 Omar Metwally
 Haitham A. Ibrahim1
 Amal Elawady
 Ioannis Zisis
 Arindam Gan Chowdhury
- 1Department of Civil and Environmental Engineering, Florida International University, Miami, FL, United States
- 2Extreme Events Institute, Florida International University, Miami, FL, United States
As global urbanization accelerates, the construction of tall buildings has surged, becoming a defining feature of modern cityscapes. Tall buildings, while contributing to economic growth and urban development, face substantial risks from extreme wind events, such as hurricanes and downbursts. This study provides a comprehensive evaluation of the performance of tall building facades under severe wind conditions, with a focus on recent events that impacted the Gulf Coast of the United States, specifically in Houston, during May to July 2024, including a powerful derecho and Hurricane Beryl. Through extensive damage assessments of various tall buildings, this research highlights the different damages observed from these wind events, revealing critical vulnerabilities in tall building façades, particularly in relation to wind channeling effects in densely built urban areas. The observed damage patterns, including extensive glass breakage and façade failures, underscore the need for a reassessment of wind effects on tall buildings to better reflect the complex interactions between wind forces and urban environments. Additionally, by integrating real-world damage observations with wind tunnel simulations carried out at the NSF NHERI Wall of Wind Experimental Facility, this research offers valuable insights into the factors that may have influenced the observed damage. In this wind tunnel testing campaign, a series of aerodynamic testing of a tall building model under both atmospheric boundary layer and downburst winds were conducted. Additionally, interference effects are tested for both types of events. The preliminary findings have shown that downburst winds can have higher negative pressures compared to atmospheric boundary layer (ABL) which needs to be further studied including several downburst events to characterize the difference between both types of winds. Also, the results indicated the need to conduct a detailed interference study to compare ABL and downburst to properly include these effects for dense urban areas.
1 Introduction
In 2022, the world surpassed 2,000 buildings taller than 200 m (CTBUH, 2023). In 2023, a record was set for tall building completions with 177 buildings of 200 m or taller being completed (CTBUH, 2024). According to this data, the number and height of tall buildings have seen a significant rise over the past few decades making 200 m tall buildings now common in many metropolitan areas. As global cities continue to expand both in population and economic activity, the demand for vertical development has surged. Therefore, the increasing adoption of tall buildings in urban landscapes has become a defining feature of modern cities. These structures serve as vital business and residential hubs, contributing to economic growth and urban development.
Tall buildings, due to their height and structural complexity, are particularly vulnerable to wind loads. The susceptibility of these structures to damage can lead to significant economic losses, not only from direct damage but also from the disruption of business activities. These damages can be classified into several categories including human discomfort caused by large acceleration, interior damage due to high vibrations resulting in falling objects and damaged electrical appliances, and finally façade damage due to the wind-borne debris or the high wind pressure exceeding the design value (Cui and Caracoglia, 2020). Additionally, the recovery time for these buildings is a concern since the interruption of services can have a significant economic impact which should be taken into consideration in risk assessment models. For example, an earthquake in 2011 caused the displacement of 60% of the business in Christchurch’s central business district (Molina Hutt et al., 2016). Moreover, debris from the failure of tall building façades during high intensity wind events can cause significant disruptions to transportation networks which includes road blockages, vehicle damage, and risks to pedestrians. Such observation was reported during the Dallas microburst in June 2019 where the travel time increased in certain highways by approximately 95% (INRIX, 2024).
Hurricanes and localized convective systems such as derecho and downbursts rank among the most formidable natural forces capable of inflicting severe damage on tall structures. Although both phenomena are marked as intense winds, they differ markedly in their origins and the characteristics of the wind forces they produce. Hurricanes, vast tropical cyclones formed over warm ocean waters, are distinguished by sustained high winds, heavy rainfall, storm surges, and waves. These systems can persist for days, affecting large geographical areas and often causing widespread devastation. In contrast, downbursts are intense, spatially and temporally localized downdrafts that create powerful straight-line winds near the ground, typically associated with thunderstorms. While convective winds can generate wind speeds comparable to hurricanes, their effects are confined to much smaller areas and occur over shorter periods. Understanding these differences is essential for evaluating their impact on tall buildings and for devising effective mitigation strategies.
The damage inflicted by extreme wind events varies considerably depending on the nature of the event. Hurricanes tend to have a broad impact, often causing significant damage to the glass and cladding of tall buildings. This was evident during Hurricane Katrina, when tall buildings in New Orleans, such as the Hyatt Regency Hotel and the Amoco Building, sustained substantial façade damage, particularly on the windward sides. This damage was primarily due to wind-borne debris, resulting in costly repairs and extended business interruptions (Kareem and Bashor, 2006). Similarly, typhoons in Japan, such as Maemi in 2003, have highlighted the vulnerability of tall buildings to wind-induced damage, with many structures experiencing significant damage to windowpanes due to intense wind pressures and flying debris (Tamura, 2009).
Another notable example of hurricane damage is the JP Morgan Chase Tower in Houston which sustained devastating damage to its facade during hurricane Ike in 2008. (Butler & Kareem, 2012) studied the damage observations on this building using computational fluid dynamics and wind tunnel testing and indicated that damage may have initiated by high pressures and increased by interference effects with surrounding buildings producing rotational flow which caused the wind-borne debris to contribute to the damage. Another extreme case of tall building damage during hurricanes is the Capital One tower in Lake Charles, Louisiana. This building sustained damage during Hurricane Rita in 2005, leading to repairs and upgrades. However, it was severely damaged again during Hurricanes Laura and Delta in 2020, ultimately leading to its demolition in September 2024 after nearly 4 years of closure (Malcolm, 2024).
In contrast to the widespread impacts of hurricanes, localized wind events like derechos, downbursts, and microbursts have been known to cause severe, concentrated damage. A notable example is the collapse of a 37-story building in Belém, Brazil, on 29 January 2011, which was attributed to a downburst (Loredo-Souza et al., 2019). Also, a downburst impacted Porto Alegre, Brazil, on 29 January 2016, with gust reaching around 42 m/s, causing cladding damage in several tall buildings despite not reaching the design wind speed (Loredo-Souza et al., 2019). The pattern of damage closely matched areas identified as high-pressure zones in previous wind tunnel tests, indicating the building’s vulnerability to the intense, localized wind pressures of downbursts. In downtown Dallas, a microburst struck the area on 9 June 2019, causing windows damage to several tall buildings such as Fountain Place skyscraper on and the KPMG building (Krause, 2019).
These observations have documented a range of impacts on tall building, including both global and localized damage to façade elements highlighting the vulnerabilities of tall buildings to wind-induced forces. The types of damage observed often include the detachment or failure of façade panels, window breakage, and in some cases, damage to structural connections between the façade and the building’s primary framework. Such damage not only compromises the structural integrity of the building but also poses significant safety risks to occupants and causes significant losses to the building’s interior. Additionally, these events often result in direct and indirect economic losses due to repair costs and disruptions to business operations, respectively. Such consequences underscore the need for continuous improvement in wind load assessment methods and the design standards that guide the construction of tall buildings.
The accurate assessment of wind loads on tall buildings is critical for ensuring their safety and resilience. Various methodologies, including wind tunnel testing, field measurements, analytical methods and computational fluid dynamics (CFD) simulations, have been employed to evaluate these loads under different wind conditions. Wind tunnel testing has been instrumental in understanding how wind flows around tall buildings and the resulting pressure on their facades. Despite the intensive research done in characterizing wind loads on tall buildings under different atmospheric boundary layer (ABL) conditions, tall buildings are still experiencing damage. Additionally, not enough investigations have been carried out to characterize the differences in loading characteristics between ABL and convective localized storms such as downbursts.
Worth noting that failures in tall building facades may stem from a combination of factors beyond mere wind design criteria. Inadequate design decisions, such as considering the dynamics of the panels which can result in wind-induced vibrations. Material selection is equally critical employing materials with low thermal resistance or brittleness can lead to stress fractures and fatigue under dynamic wind conditions. Construction errors, including improper sealing, misaligned panels, and deficient anchoring, further compromise facade integrity. A notable example is the John Hancock Tower in Boston. In this building, the original glass panels failed due to several poor design choices as the panel exhibited thermal expansions resulting in stresses at the edge of the glass. Additionally, the reflective coating resulted in loss of bond in some parts of the lead tape to glass connection. These issues yielded some cracks which resulted in glass failure when subjected to wind buffeting necessitating the replacement of all windows (Schwartz and Gumpertz, 2004). Additionally, the poor performance of glass in façade panels can be an issue since the performance of glass can be affected by its brittle failure, duration of load and loss of strength (Kareem, 1986). Maintenance is also crucial to identify existing defects such as initial cracks and loosening of connections.
This paper aims to contribute to the efforts of evaluating the field performance of tall buildings façades during extreme wind events, with a focus on hurricanes and downbursts. By connecting case studies of damage observations of tall buildings facades under hurricane and downburst winds to observations from wind tunnel experiments, this paper aims to identify potential gaps that needs further investigation, especially related to the effects of downbursts on tall buildings and propose areas for future investigation. The ultimate goal is to enhance the resilience of tall building facades to extreme wind events, thereby reducing the potential for damage and associated direct and indirect losses. The remainder of this paper is organized as follows. Section 2 presents the two events under consideration herein, a hurricane and a derecho, for which damage observation is reported. Section 3 focuses on the damage observations during the two events and compares the damage in several tall buildings. Section 4 introduces the wind tunnel testing campaign of tall buildings with some preliminary results that can help understand the observed damage while Section 5 highlights a preliminary comparison between the ASCE provisions for wind loads of façade and the results from the wind tunnel testing.
2 Damage observation
Previous damage observations of tall buildings in Houston after Hurricane Alicia, which took place in 1983, revealed that wind-borne debris, from gravel and roof appurtenances, is the main contributor to façade damage (Williams and Kareem, 2003). This conclusion resulted in some provisions such as banning loose ballast on the roof (Konz, 2009). Kareem, (1986) also recommended studying the effect of new buildings on existing buildings and communicate those effects with owners to enhance existing buildings if the newly added building will have a negative effect. Later in 2008, Hurricane Ike caused façade damage to tall buildings in the same region with wind-borne debris and interference effects being the primary causes of this damage either acting individually or combined (Konz, 2009).
More recently, tall buildings in downtown Houston experienced damage from two subsequent events in 2024: a derecho which took place on May 16 and Hurricane Beryl which made landfall in Texas on July 8th. In the paper, the focus will be directed towards damage observations from those two events. The flow field of those two events is briefly introduced in this section before presenting the damage observations.
2.1 Event 1: houston derecho 2024
Throughout much of May 2024, a powerful heat dome settled over the Caribbean Sea and Gulf of Mexico, leading to scorching temperatures that shattered records across Central America. As the hot air at the dome’s northern boundary met cooler, drier air in the U.S., atmospheric instability gave rise to severe thunderstorms in the south-central United States. On May 14, the Storm Prediction Center (SPC) issued a level 2 severe weather alert for parts of Texas, which escalated to level 3 by the morning of May 16, extending toward the Gulf Coasts of Texas and Louisiana. In southeastern Texas and southwestern Louisiana, a northward-moving warm front heightened moisture levels, increasing the potential for storms to intensify along the boundary. By mid-afternoon, a significant mesoscale convective system developed across central and eastern Texas, generating numerous updrafts. As the system advanced southeast, it evolved into a derecho—an extensive, long-lived wind event—striking the Greater Houston area with winds up to 45 m/s and producing three EF1 tornadoes. By early May 17, the storm moved offshore into the Gulf of Mexico, reducing the severe weather threat inland but leaving behind significant damage along the Gulf Coast, including shattered windows, damaged roofs, and numerous downed trees and power lines (National Weather Service, 2024b; Voiland, 2024; Lewis, 2024). A map indicating the progression of the derecho through Houston area is shown in Figure 1. It is noteworthy that the buildings in question were not affected by the tornadoes. Figure 2 shows a map of the location of the studied buildings along with gust speeds recorded at various measurement points from ASOS observation network stations during the derecho (ASOS, 1998). The values indicate a range of 28 m/s to 32 m/s. However, as noted by the reconnaissance team (Kalliontzis et al., 2024), post damage survey reported higher wind speeds reaching 45 m/s in downtown Houston. For example, CoreLogic provided a map of wind speeds that showed values in the range of approximately 36 m/s to 40 m in the location of the buildings (INRIX, 2024).
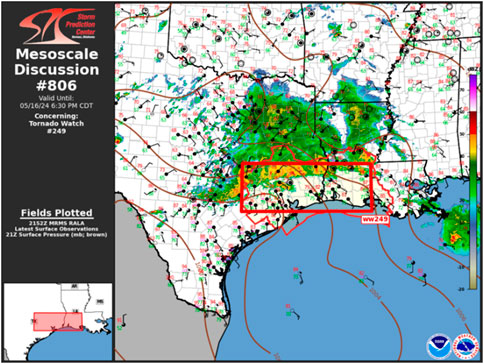
Figure 1. Map showing the formation of the Mesoscale Convective System (MCS) over Texas which evolved into a derecho (NOAA Storm Prediction Center, 2024).
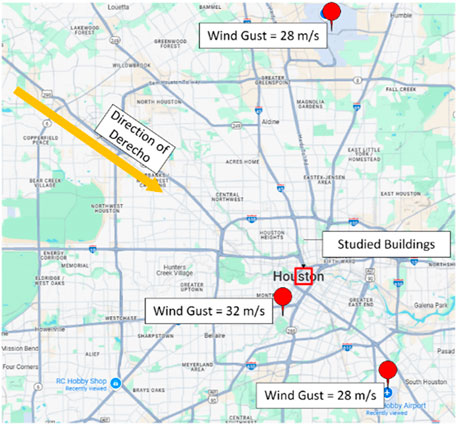
Figure 2. Map of the location of studied buildings along with gust speeds recorded by ASOS observation network during the derecho.
2.2 Event 2: hurricane beryl 2024
Hurricane Beryl was a significant and devastating storm that struck the Caribbean, the Yucatán Peninsula, and the Gulf Coast of the United States in late June and early July 2024. On 8 July 2024, Hurricane Beryl impacted Houston as a Category 1 hurricane with gust speeds reaching approximately 40 m/s. Marking a historic event, it rapidly intensified becoming the earliest Category 5 hurricane ever recorded, reaching maximum sustained winds of 74 m/s. The hurricane originated from a tropical wave off the coast of Africa on 25 June 2024, and rapidly intensified, making its first landfall in Grenada as a high-end Category 4 storm on July 1. Beryl reached its peak strength as a Category 5 hurricane upon entering the Caribbean Sea, but soon weakened due to wind shear. The storm’s intensity fluctuated, briefly strengthening back to Category 3 before ultimately making its final landfall in Texas as a Category 1 hurricane on July 8th with sustained winds of 36 m/s. Beryl transitioned to a post-tropical cyclone over Arkansas on July 9 and eventually dissipated over Ontario on July 11 (National Weather Service, 2024a; KHOU 11 Staff, 2024). The track of the storm can be seen in Figure 3. Figure 4 shows a map of the location of the studied buildings along with gust speeds recorded at various measurement points from ASOS observation network stations during hurricane Beryl (ASOS, 1998). The values are showing very narrow range indicating that the wind speeds at the building locations are in this range from 37 m/s to 40 m/s.
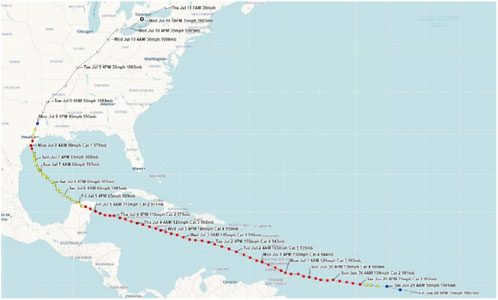
Figure 3. Hurricane Beryl track (National Weather Service, 2024b).
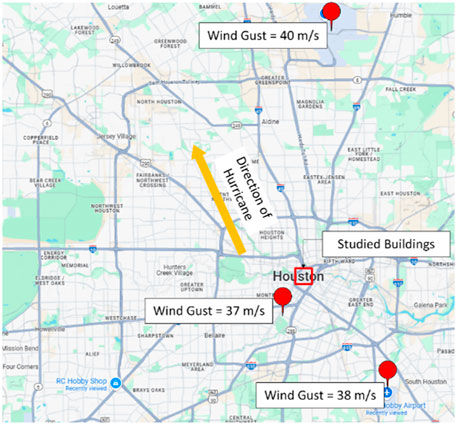
Figure 4. Map of the location of studied buildings along with gust speeds recorded by ASOS observation network during Hurricane Beryl.
3 Tall buildings case studies
This section presents damage observations from the two events. The derecho caused extensive and varied damage to several prominent high-rise buildings in Houston downtown area, such as the Chevron Building Auditorium, Wells Fargo Plaza, Enterprise Plaza, Wedge International Tower, and the Total Energies Tower. These Buildings are supposed to be designed for wind speeds up to 67 m/s (Kalliontzis et al., 2024). However, they were significantly impacted by intense wind forces, urban wind channeling, and wind-borne debris, causing both widespread and localized façade damage across their façades. An assessment of 18 high-rise buildings in the most severely affected downtown areas revealed approximately 3,250 broken windows (Espinoza, 2024). In contrast, during Hurricane Beryl, downtown experienced significantly less glass damage compared to the May 16 derecho. The Downtown Houston Management District noted that 40 buildings exhibited minor structural or facade damage following the hurricane (Miranda, 2024). To provide further context, the following sections will cover case studies of damage, using pictures provided by reconnaissance teams (Padgett et al., 2024; Kalliontzis et al., 2024). Case studies of various buildings are discussed, comparing the observed damages from both events and attempting to identify the underlying reasons for different damage patterns whenever data is available. It should be noted that pictures depicting the damage due to the hurricane might show repairs from the derecho in the form of plywood or sheets. However, the damage from the hurricane was not yet repaired during the field survey (Kalliontzis et al., 2024).”
3.1 Chevron building auditorium
This building, located in 1,500 Louisiana St, is a 40-story 182.9 m tall building. The building features a curtain wall façade where the horizontal structural beams support the vertical mullions to which the glass panels are fitted. Despite being a valuable option for construction of curved surfaces, the glass panels add to the lateral stiffness of the building which can cause glass failure in extreme events due to the material’s brittleness (Kalliontzis et al., 2024). Similar observations were also reported by (Alawode, et al., 2023) in full-scale testing of single-skin facades where the authors reported that increasing the stiffness of the joints by added vertical protrusions resulted in higher vibration and higher dynamic amplification factors. During the derecho event, the building’s cladding system was significantly damaged as shown in Figure 5. Figure 5A highlights the building’s location, identifying the damaged side and the direction of the derecho. The intense wind forces caused large and small façade panels to dislodge as shown in Figures 5B–D. Numerous glass windows shattered, raining debris onto the streets below, creating hazardous conditions in the surrounding areas. The damage was predominantly observed on the side facing another tall building, Chevron Corporation Tower, suggesting that the wind channeling effect between the adjacent towers may have amplified the negative pressures (suctions) on the facade. Interestingly, although the Chevron Corporation Tower shares the same oblong shape and orientation and is positioned in front of the Chevron Building Auditorium, it sustained minimal window damage. This discrepancy suggests that the significant damage to Chevron Building Auditorium was likely intensified by channeling effects, particularly as damage was concentrated at higher elevations, reducing the likelihood of wind-borne debris as the primary cause.
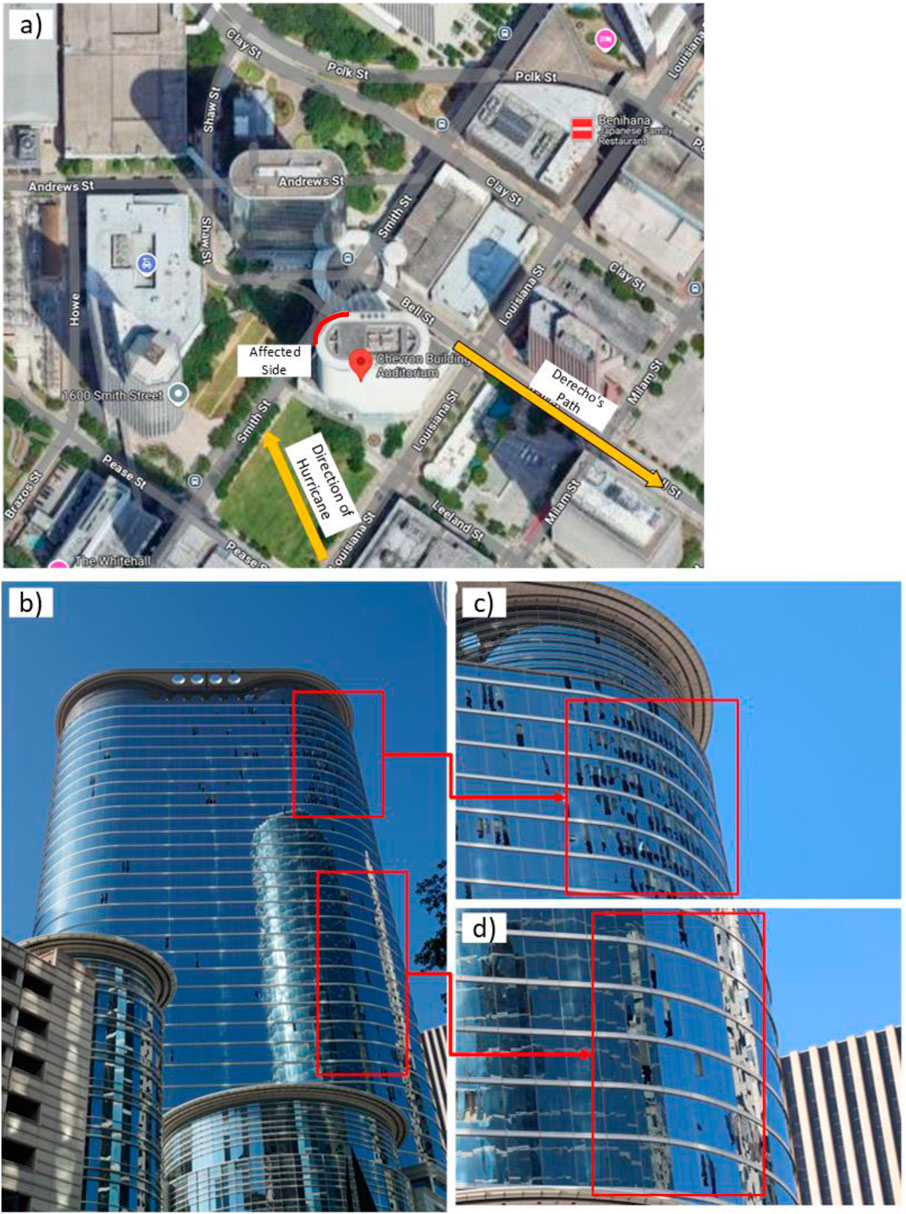
Figure 5. Damage sustained by the Chevron Building Auditorium during the derecho, (A) damaged side of the building with derecho’s and hurricane paths., (B) global damage view (Padgett et al., 2024). (C, D) localized glass damage (Padgett et al., 2024).
During Hurricane Beryl, the building sustained additional but minor impacts, according to company spokesperson Randy Stuart (Miranda, 2024). Figure 6 illustrates the relatively minor impacts observed during hurricane Beryl. It is notable that in both events, damage was concentrated on the curved surfaces of the oblong-shaped buildings, likely due to high suction from flow separation. Similar observation was reported for the same building during hurricane Ike which had wind gusts up to 41 m/s (Konz, 2009). Additionally, inaccurate manufacturing of the curved surface or errors in the installation can cause uneven distribution of the wind loading resulting in concentration of stresses at specific parts of the façade components possibly leading to failures. The building suffered less damage in Hurricane Ike compared to the derecho. The comparatively lower damage from Hurricanes Beryl and Ike, despite comparable gust speeds, underscores, in addition to the importance of interference effects, the need to further study the impact of the different loading mechanism associated with derechos and other related phenomena like thunderstorms as these events produce sudden, intense bursts of wind that can create highly localized stress concentrations on building façades.
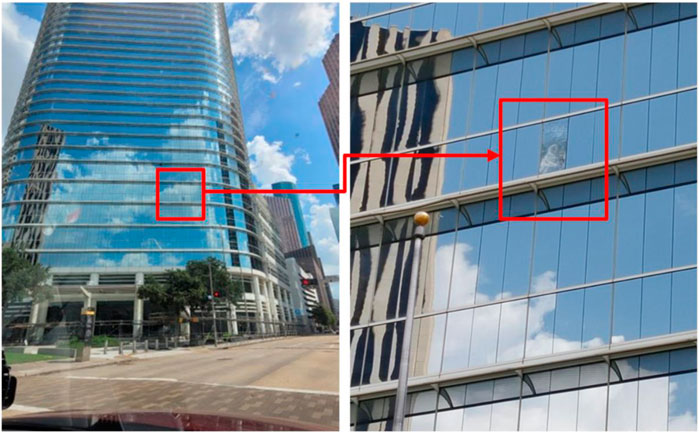
Figure 6. Minor damage sustained by the Chevron Building Auditorium during hurricane Beryl (Kalliontzis et al., 2024).
3.2 Center point energy plaza
This building, located in 1,111 Louisiana St, is a 53-story 226 m tall building. The building location and sustained damage is shown in Figure 7, with the damaged corner with respect to derecho’s path shown in Figure 7A. The building features a double-skin façade system supported by vertical mullions as shown in Figure 7D. The damage to this building during the derecho was mostly concentrated at one corner as can be seen in Figure 7B. This damage may be attributed to the cornering effects in rectangular buildings accompanied by the channeling effects caused by the two tall buildings facing that corner. Both façade layers were damaged in some cases mostly on the corners while some cases had damage to a single layer of the façade mostly away from the corner as depicted in Figure 7C. A detailed view of damage to both layers is shown in Figure 7D opposed to damage in the external layer only in Figure 7E. It is worth mentioning that the configuration of double skin facades, including the layout and the width of the air gap, affects the wind induced pressures and may contribute to the damage of the façade as some configurations have demonstrated higher pressures compared to those for single-skin facades (da Silva and Gomes, 2008; Lou et al., 2012). Therefore, it’s recommended to conduct wind tunnel testing for such type of façade to investigate all the design parameters. On the other hand, the building suffered very minor damage during the impact of hurricane Beryl.
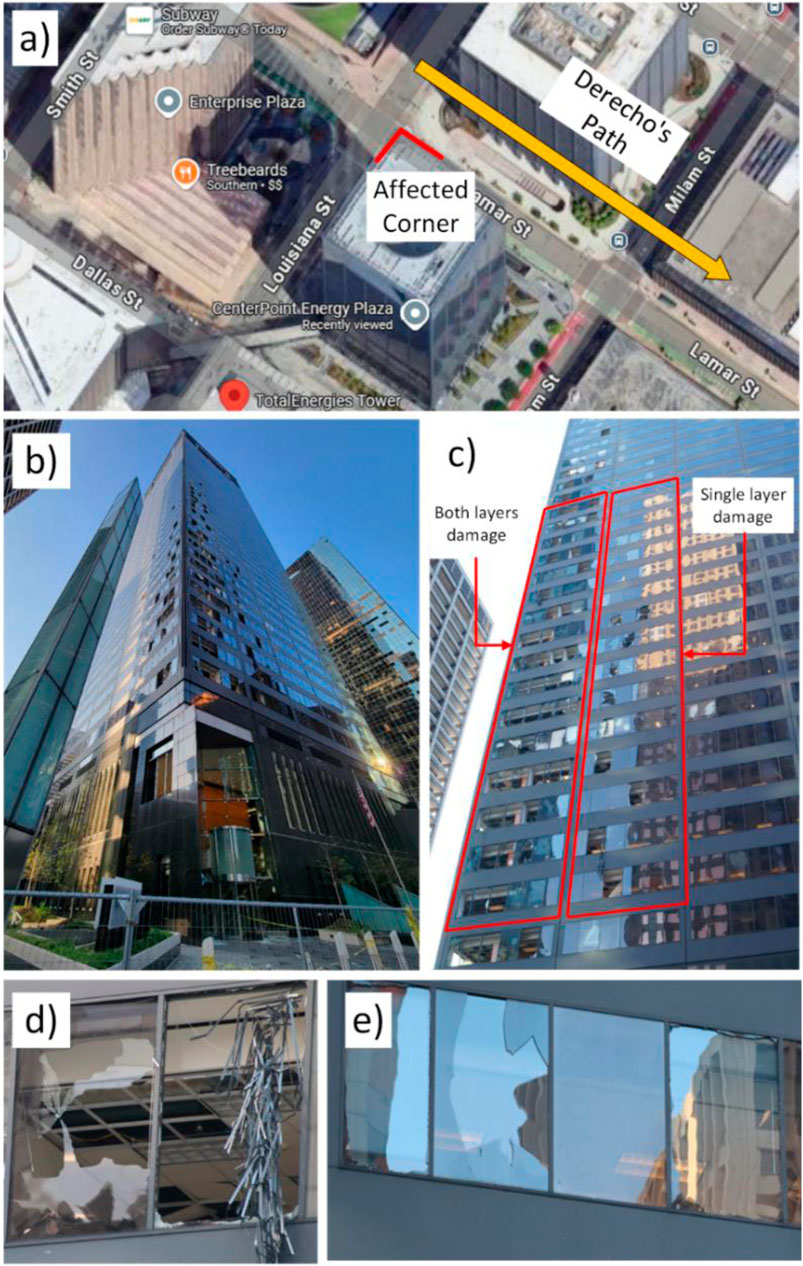
Figure 7. Damage sustained by the CenterPoint Energy Plaza, (A) corner affected corner with respect to the derecho’s path, (B) global damage view of the damaged corner, and (C) localized damage view, (D) damage to both layers of the façade and (E) damage to one layer of façade (Padgett et al., 2024).
3.3 EL paso energy building
This building, located in 1,001 Louisiana St, is a 35-story 153 m tall building. Detailed information about the cladding and building renovation, which was completed in 2012, can be found in (Abendroth L, 2013). The building suffered from considerable damage during the derecho, as shown in Figure 8A, where the damage is concentrated on the side of the building close to another tall building highlighting again the effect of channeling in intensifying the wind pressures. The direction of the derecho along with the damaged side is shown in Figure 8B. When combined with corner effects, most of the damage is concentrated on both corners of the damaged side, similar to CenterPoint Energy Plaza, as can be seen in Figure 8C. It is worth noting that the horizontal and vertical ribs might have affected the local pressure of building façade as these ribs might slightly increase the pressure on the building as noted by several researchers (Cheng et al., 2021). Additionally, the horizontal ribs can significantly affect the location of the stagnation point moving it downward (Liu et al., 2021). This finding aligns with the observation of damage concentrated more on the lower half of the building. However, this preliminary conclusion needs to be investigated more in light of the strong interference effects experienced by the building to study the complex interaction between multiple factors. Although the photos provided by (Kalliontzis et al., 2024) do not offer clear views of the building following hurricane Beryl, the few pictures, where the building was visible, are enough to conclude that the building had minimal damage from the hurricane.
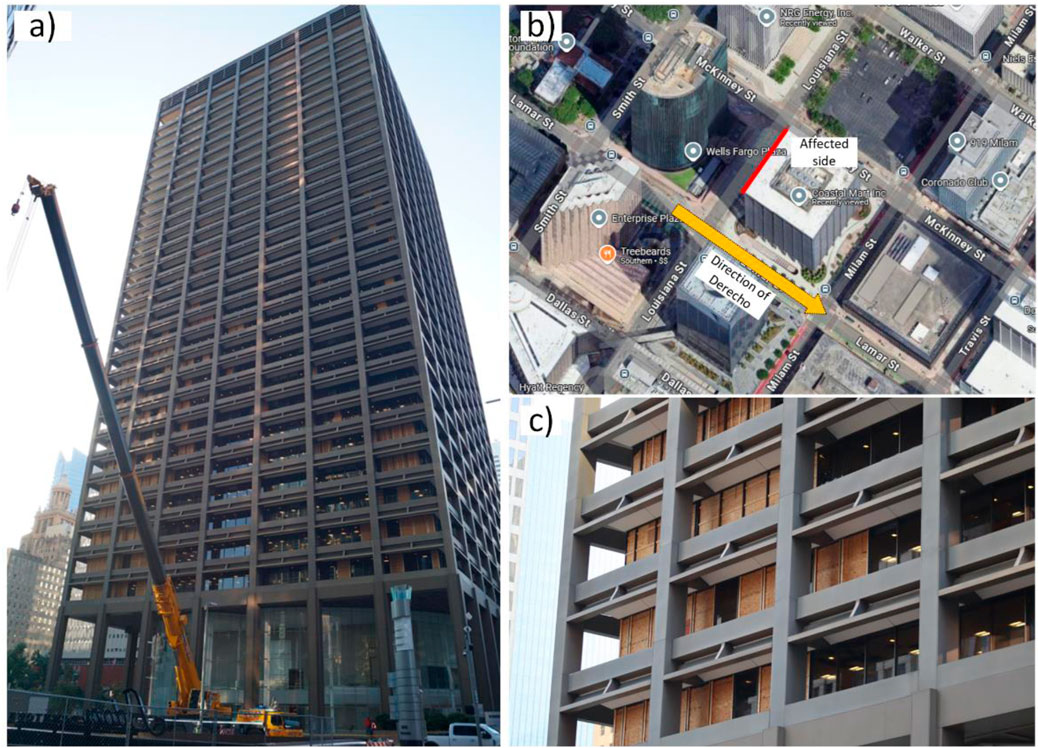
Figure 8. Damage sustained by El Paso Energy building, (A) global damage view of the damaged side, (B) damaged side along with the derecho’s path, and (C) localized damage view at the corner (Padgett et al., 2024).
3.4 RRI energy plaza
This building, located in 1,000 Main St, is a 36-story 158 m tall building. The building sustained damage during the derecho as shown in Figure 9, with the building location with respect to the direction of both events shown in Figure 9A. On the lower half of building, less severe damage is observed as shown in Figures 9B, C which indicates only cracking of glass that may be attributed to wind-borne debris since the damage side is the windward wall. Severe damage was concentrated on the upper half of the building as shown in Figure 9D. On the lower half of building, less severe damage is observed as shown in Figure 9B which indicates only cracking of glass that may be attributed to wind-borne debris since the damage side is the windward wall. The same building experienced less damage on the same side during Hurricane Beryl as shown in Figure 10 where only minor cracking in the façade was observed.
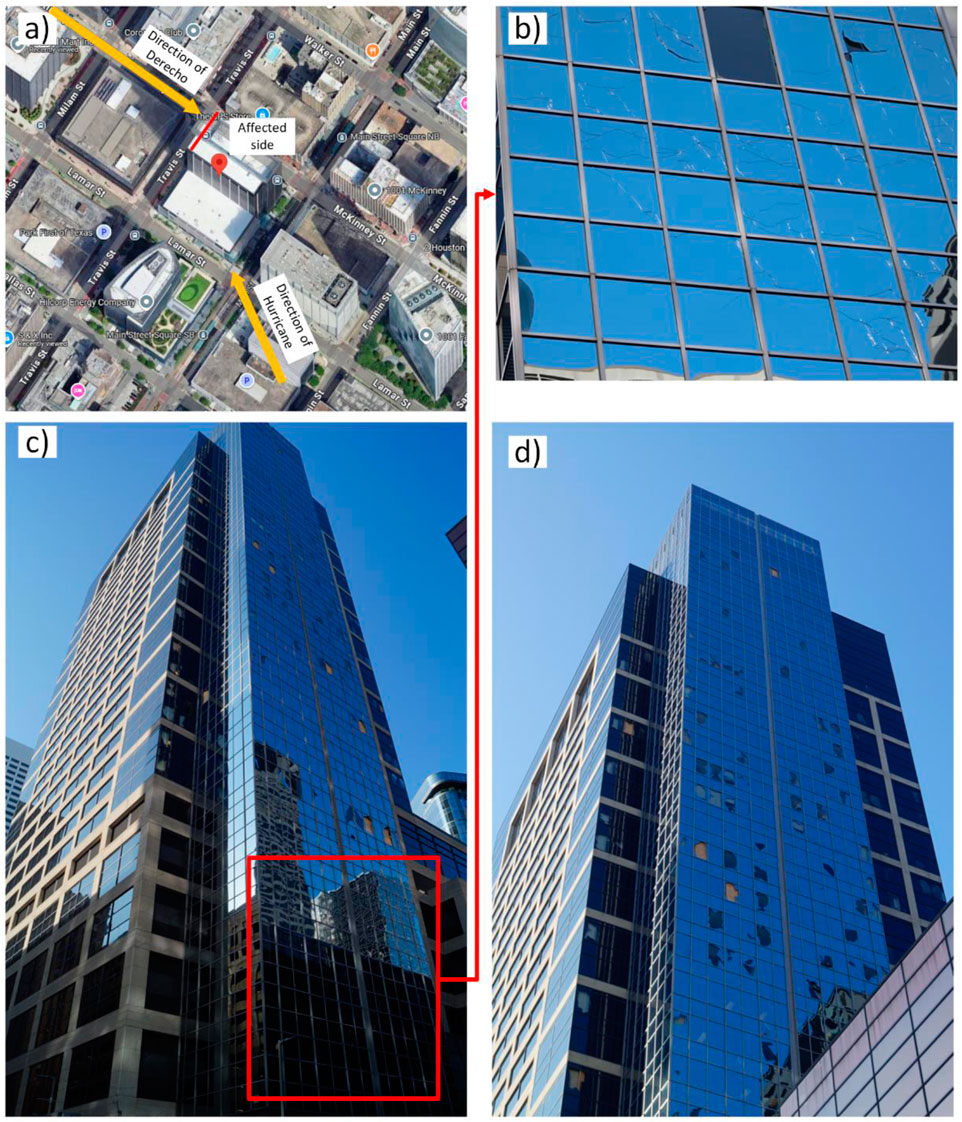
Figure 9. Damage sustained by the RRI Energy Plaza building, (A) building location with events directions, (B) cracked glass, (C) global damage view, and (D) breakage of façade (Padgett et al., 2024).
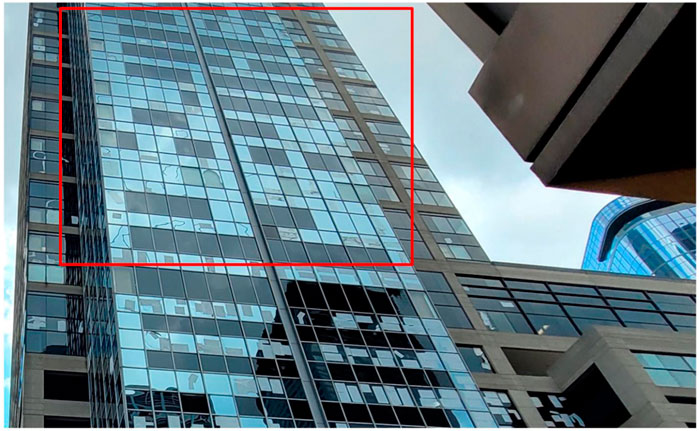
Figure 10. Damage sustained by the RRI Energy Plaza building during hurricane Beryl.
3.5 Wedge international tower
This building, located in 1,415 Louisiana St, is a 44-story 168 m tall building. This building, also, suffered considerable damage in the derecho compared to the hurricane. Figure 11 shows the damage in the tower during the derecho indicating widespread breakage of the glass panels compared to minimum damage encountered during the hurricane as shown in Figure 12.
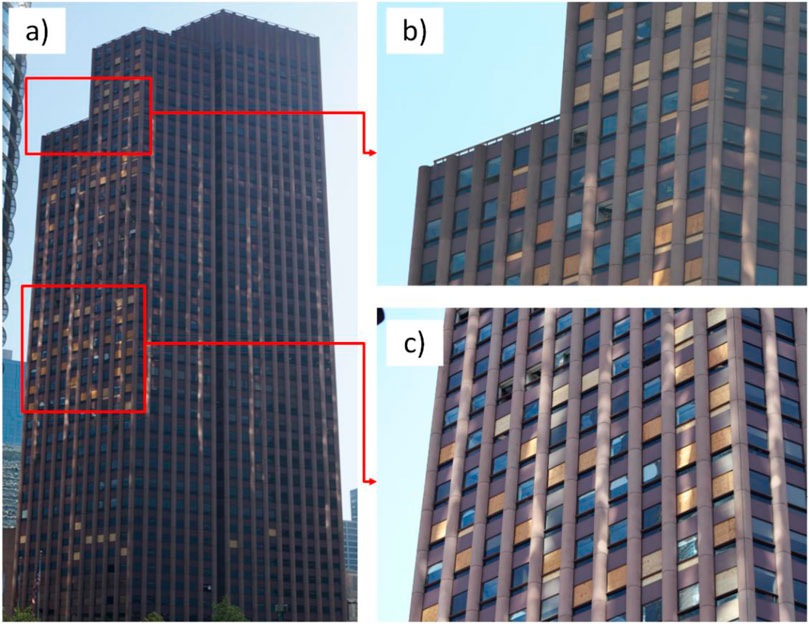
Figure 11. Damage sustained by the wedge international tower during the derecho, (A) global view of the damage, (B, C) detailed views of some damage locations (Padgett et al., 2024).
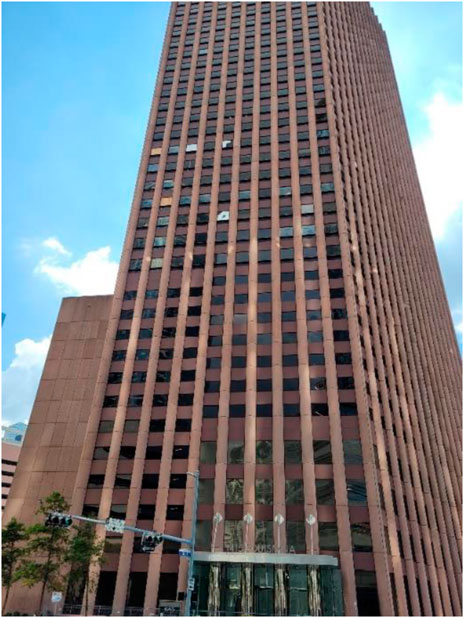
Figure 12. Damage sustained by the wedge international tower during hurricane Beryl (Kalliontzis et al., 2024).
In summary, the damage to tall buildings during the Houston Derecho and Hurricane Beryl highlighted several critical lessons. The event underscored the vulnerability of glass facades in high-rise buildings, with significant damage observed, during the derecho with gust of 45 m/s, despite designed to withstand wind speeds up to 67 m/s as previously mentioned. This highlights the need to reevaluate current design and construction guidelines for façade elements, considering the unique loading characteristics associated with non-hurricane events, such as thunderstorm winds in derechos and downbursts. Additionally, the channeling effects of wind in dense urban areas may significantly alter the flow around tall buildings, further inducing more progressive damage. The abrupt change in wind speeds during transient events may have contributed to the observed damage in façade elements which again motivates the need to study the differences in loading between hurricanes and other transient events such as downbursts. These effects need to be studied in conjunction with the dynamic behavior of the façade system to better understand the interaction between the loading and the system as considered for Atmospheric boundary layer winds in Alawode et al. (2023), Bakhtiari et al. (2024). Additionally, it is recommended for reconnaissance teams to provide more data related to the design of facades to facilitate interpretation of the causes of damage. Similar recommendations were provided by Mayercsik and Bennett (2024), where the authors suggested incorporating facade directionality, and site-specific factors into forensic assessments to pinpoint the causes of failure and distinguish between one-time event and long-term effects. Key factors include solar exposure, that affect thermal expansion stresses, hail swaths and wind driven rain.
4 Wind tunnel testing
In this section, a series of aerodynamic wind testing of a high-rise building is conducted with preliminary results presented in an attempt to better understand the observed damage during the events in question. The testing was carried out at the US National Science Foundation (NSF) designated facility, the Natural Hazard Engineering Research Infrastructure (NHERI) Wall of Wind Experimental Facility (WOW EF), a large open-jet wind testing facility at Florida International University (FIU). The WOW EF is equipped with a 12-fan system providing 8,400 horsepower, capable of generating wind speeds up to 157 mph (70 m/s), effectively simulating Category 5 hurricane conditions based on the Saffir-Simpson scale. The facility’s flow management box, measuring 4.3 m in height, 6.1 m in width, and 9.8 m long after the contraction area, is designed with spires and automated roughness elements to replicate the Atmospheric Boundary Layer (ABL) for various terrains. Additionally, the test section includes an automated turntable to accommodate testing with different wind directions. For further details on the design and features of the facility, refer to (Gan Chowdhury et al., 2017).
Stronger wind areas within the general path of a derecho are primarily caused by downbursts since a typical derecho comprises several downburst clusters, each consisting of numerous smaller downbursts (Lima de Figueiredo et al., 2019; Pryor, 2023). These clusters extend almost continuously for at least 250 miles, leading to widespread damage. This contrasts with a single downburst event, which typically results in localized damage. As a result, wind tunnel testing generally focusses on simulating individual downburst events. Despite being well studied under ABL winds, only a few studies have addressed the aerodynamics of tall buildings under downbursts.
Consequently, a downburst simulator was added recently to the WOW EF based on the 2-D wall jet concept (Lin and Savory, 2006; Sengupta and Sarkar, 2008). For downburst experiments, the simulator is attached to the flow management box. The simulator is equipped with two slats which open after pressurizing the gate to allow the flow jet. Then, this opening is closed using a gravity gate after a predetermined time window, representing the desired event duration. More information about the design and validation of the downburst simulator can be found in Mejia et al. (2022). Figure 13A shows the downburst simulator with closed slats while Figure 13B shows the open slats with closed gravity gate.

Figure 13. WOW downburst simulator attached to the flow management box, (A) closed slots, (B) open slots with closed gravity gate.
The conducted testing aims to compare between the aerodynamics of tall buildings under ABL and downburst in an attempt to identify the vulnerability of tall buildings to localized, powerful downburst winds, especially following the damage observed during the Houston derecho.
4.1 Building model and test program
The building model is not intended to be a specific case from the damage observations presented in the previous section but rather a generic case that suits future testing considerations, such as aeroelastic testing which can be beneficial to understanding the effect of building vibration on the performance of the façade (Chen et al., 2023) and also to study the effect of transient events on tall building response (Kwon and Kareem, 2009). The building model is a 1:350 scale of a prototype measuring 48 m × 48 m × 347 m. With scaled dimensions of 13.7 cm × 13.7 cm × 99 cm as shown in Figure 14A, the model is equipped with 300 pressure taps, 75 taps on each surface, as depicted in Figure 14B, to measure the incident pressure on all surfaces at a sampling rate of 625 Hz using the SCANIVALVE system.
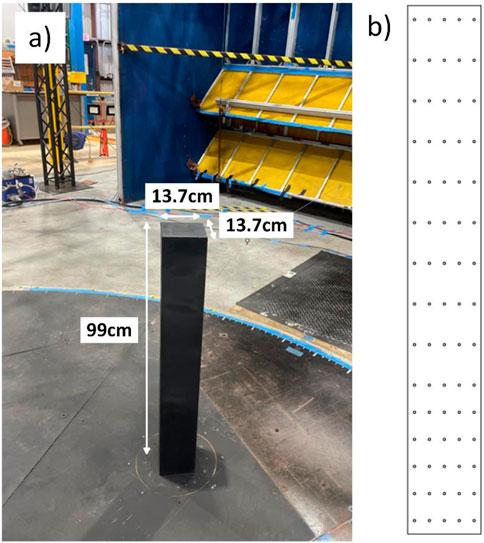
Figure 14. Shows (A) Tall building model on the WOW turntable, (B) Distribution of pressure taps on one surface.
The isolated building will be tested under ABL and downburst for both 0° and 45° wind directions. Interference testing will consider 5 cases where a similar model is located upstream the base model with varying upstream distance. Figure 15 shows a schematic for the location of the interfering building with respect to the base model and wind direction for the five testing cases.
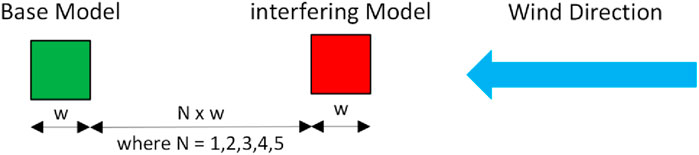
Figure 15. Schematic of the locations of interfering models.
4.2 Comparison of profiles
Figure 16 shows a typical comparison of the wind profiles and time histories for both downbursts and ABL, illustrating the instantaneous and mean wind speeds. In contrast to the ABL time history, which maintains a constant mean wind speed, the downburst time history is non-stationary, characterized by rapid increase, ramp-up, plateau, and decrease, ramp-down, in the wind speed. Therefore, for the downburst case a moving-mean approach is used to describe the time-varying mean. Figure 17 presents a comparison between the WOW downburst profile and various numerical and experimental data, demonstrating a strong match. Likewise, the ABL profile is compared to the ESDU open terrain profile, also showing a good match.
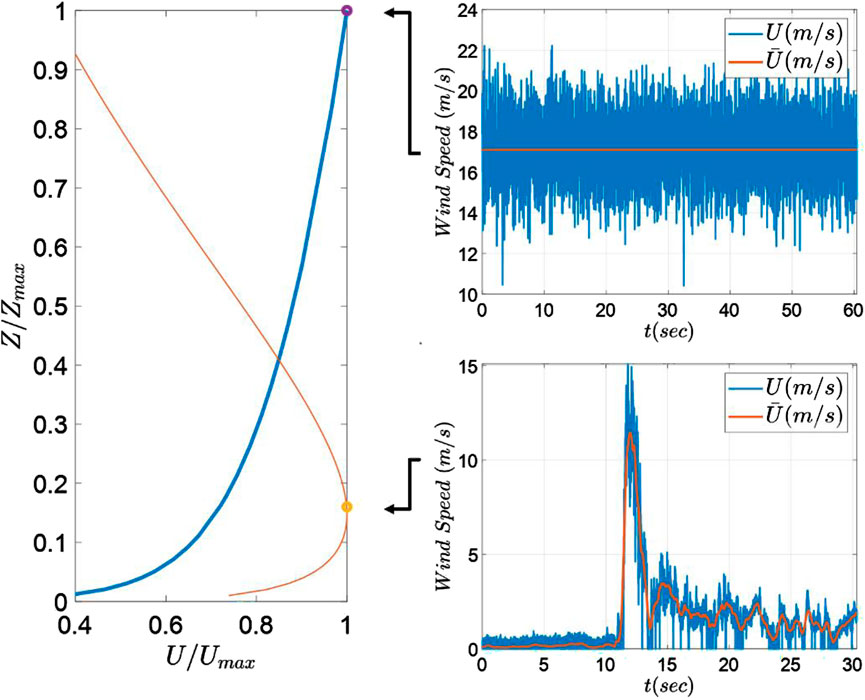
Figure 16. Comparison between profiles and time histories of downburst and ABL.
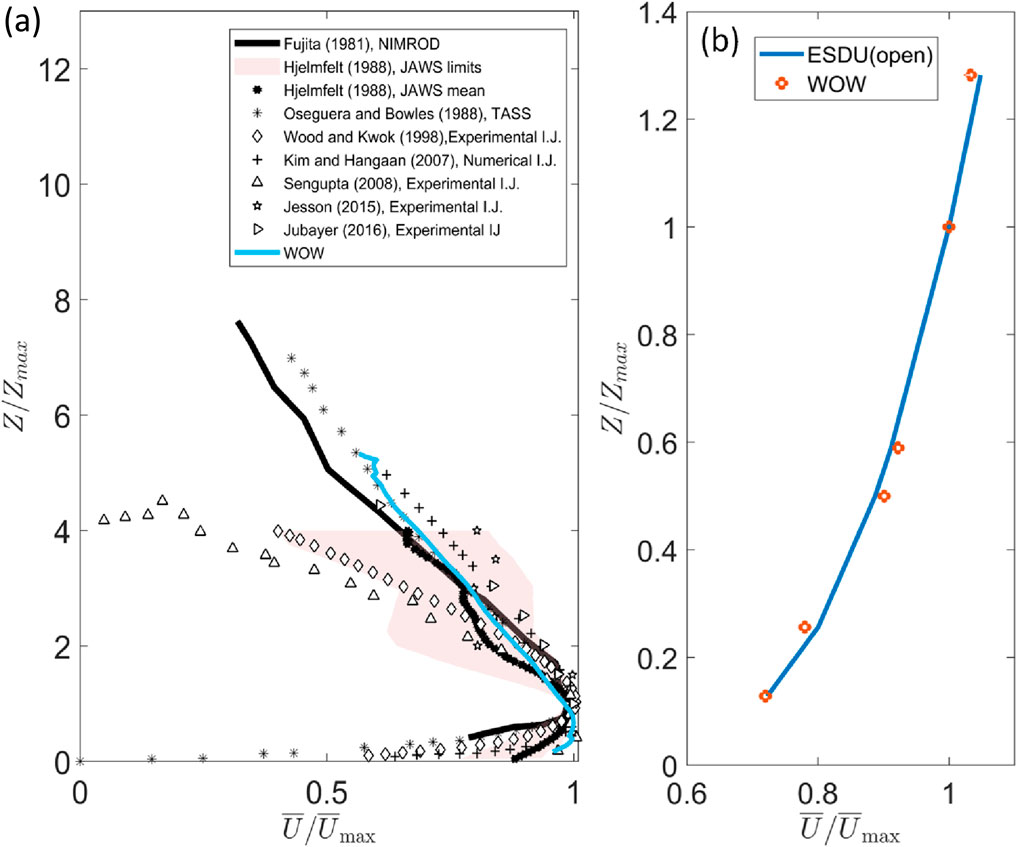
Figure 17. Validation of the simulated profiles in (A) downburst, (B) ABL.
4.3 Data analysis
The pressure coefficient time history is calculated using Equation 1 by normalizing the measured pressure by the maximum mean wind speed which is the maximum moving mean in the case of downburst. Having said that, the mean wind speed for the ABL testing is 17 m/s while the maximum moving mean for the downburst testing is 10 m/s.
where
4.4 Comparison of mean and RMS pressure coefficient in downburst and ABL
Figure 18 shows a comparison between the mean pressure coefficients resulting from both downburst and ABL simulations for 0° deg wind direction. As depicted, the windward pressure coefficient follows the wind speed profile with stagnation area, corresponding to the highest positive pressure, occurs at higher elevation for ABL case while occurring at lower elevations for the downburst case matching the maximum wind speed of the nose-shape profile of the downburst. Despite the location, the maximum values of the pressure coefficient of the windward wall are comparable for both cases.
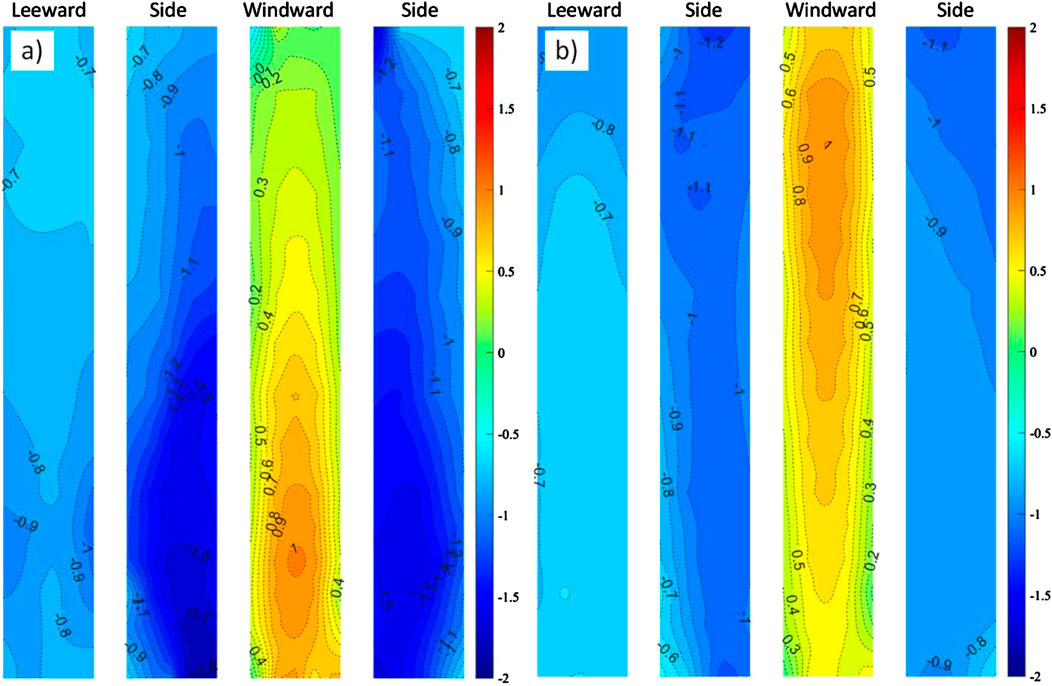
Figure 18. Mean pressure coefficient of 0° deg wind direction from (A) downburst, (B) ABL.
On the sides, the minimum negative pressure coefficient in the downburst case reaches 1.6 at the base of the leading edge, compared to 1.2 at the middle top in the ABL case which may have contributed to the increased observed damage in the case of the derecho compared to the hurricane especially for the total energies building, given the close range of expected wind gusts from the events as indicated in Sections 2.1, 2.2, which sustained considerable damage on its side wall (Kalliontzis et al., 2024). Additionally, the side pressures exhibit different characteristics. The downburst case has a decreasing magnitude gradient from the base of the leading edge towards the top of the trailing edge, matching the observations of Li et al. (2023), which is different from the typical pressure coefficient contour in the ABL case which shows the maximum negative values near the leading edge at the upper part and base of the side wall (Holmes, 2015). For the downburst case the highest suction in the leeward and side wall occurs at the same height of the max pressure on the windward. The leeward wall, in the ABL case is showing a radial contour plot with the maximum value located at the middle of the top region. In the downburst case, however, the leeward wall is showing different characteristics where the maximum suction is located at the edges at the same height of the stagnation area.
In addition to reporting the mean pressure coefficient, the characteristics of the fluctuating component should be studied to evaluate the turbulent nature of downbursts which affects the potential of inducing damage to tall buildings facades (Zhang et al., 2014). Figure 19 shows a comparison between the Root Mean Square (RMS) pressure coefficients resulting from both downburst and ABL simulations for 0° degree wind direction. In the downburst case, the RMS was calculated for the peak zone of the event which was approximately 3 s. For the windward wall, the RMS pressure coefficients range from approximately 0.09–0.22 in the downburst case, depicting a broader range compared to that observed in the ABL case, which ranges from 0.14 to 0.19. The higher values in the downburst case, especially in the lower half of the building, reflects the variation in the incident turbulence intensity between the two flow types where the turbulence intensity in the downburst case ranges from 0.12 to 0.17 along the height of the model which is higher than the values in the ABL which range from 0.08 to 0.14. On the side walls, the downburst case exhibits generally lower RMS values, except near the lower base close to the leading edge, where the downburst is showing higher values. The lower RMS values in the downburst case suggest that crosswind forces are weaker compared to the ABL case. For the leeward wall, the RMS pressure coefficients are higher at the sides in the ABL case, with values decreasing toward the center. A different pattern is observed in the downburst case where the highest RMS coefficient is located at the base of the leeward wall and decrease upward. Similar to the side walls, the values in the ABL case are higher than the those for downburst case. Hence, in general, the downburst showed lower RMS values except for the lower half of the windward wall and the base of the side walls. Overall, the values of the RMS pressure coefficient of the downburst case align closely with the results reported by Zhang et al. (2014). Additionally, the observed peak pressure coefficient is shown is Figure 20. The results are showing similar observation as the downburst demonstrates lower observed peaks except for the lower half of the windward wall and the base of the side walls.
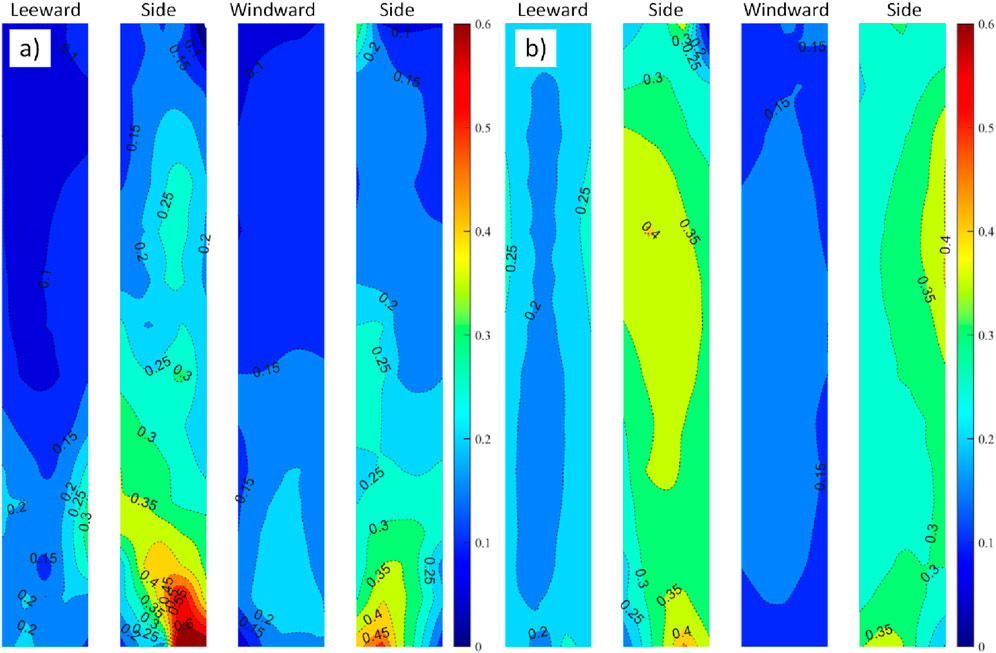
Figure 19. RMS pressure coefficient of 0° deg wind direction from (A) downburst, (B) ABL.
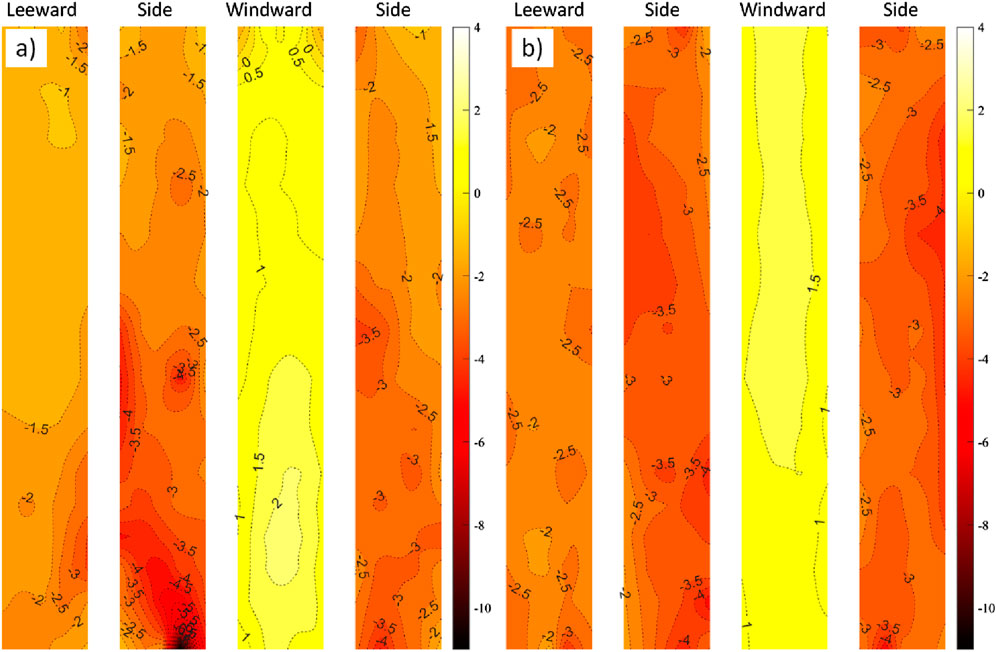
Figure 20. Observed peak pressure coefficient of 0° deg wind direction from (A) downburst, (B) ABL.
For the 45° wind direction, illustrated in Figure 21, positive mean pressure coefficients of 0.9 are observed at the leading edge on the two wind-facing walls, face 1 and face 2, in both the ABL and downburst cases, with pressure decreasing towards the trailing edge. However, the downburst exhibits a steeper gradient of pressure decrease, resulting in higher suction at the trailing edge compared to the ABL case. Similar to the 0° wind direction, on the other two walls (face 4 and face 5), the downburst produces greater suction, reaching a mean negative pressure coefficient of −1.1, compared to −0.7 in the ABL scenario.
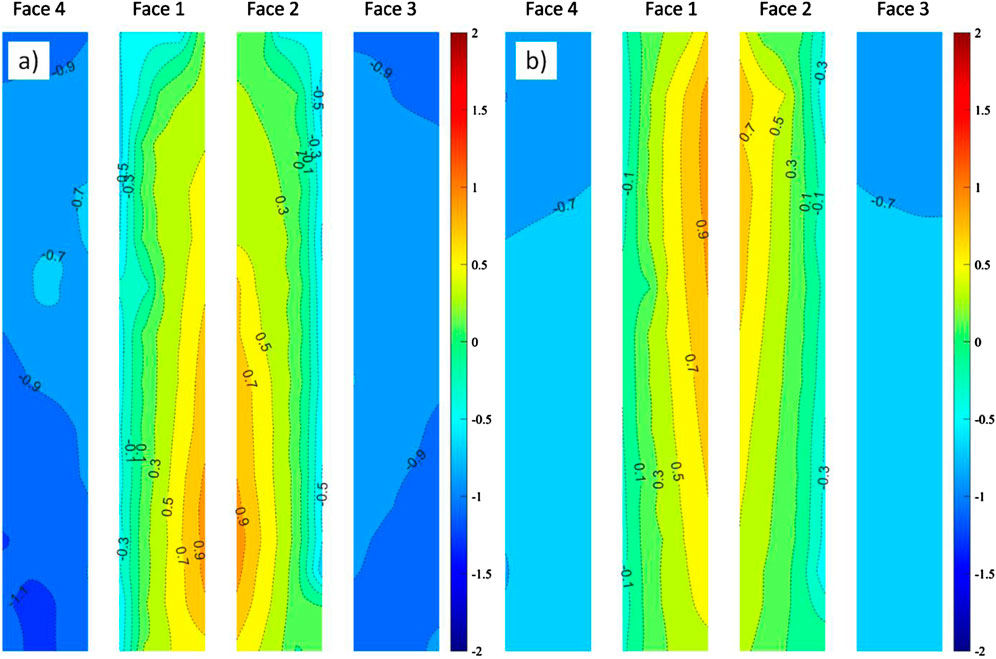
Figure 21. Mean pressure coefficient of 45° deg wind direction from (A) downburst, (B) ABL.
4.5 Comparing interference effects in downburst and ABL
As observed, channelling effects in dense urban environment might have a significant consequence on the wind-induced local pressures and have contributed to the damage observed in Houston during the derecho. This section compares the mean pressure coefficients on the windward wall of the main model with different distances from an upstream interfering building of the same dimensions for both ABL and downburst winds. For ABL wind, Figure 22A shows the ABL-induced mean pressure coefficients on the windward wall for the isolated building while Figures 22B–F shows the mean pressure coefficient with upstream building while increasing its distance. Each case corresponds to increasing the upstream distance by the width of the model as depicted in Figure 15. Figure 22B is when the spacing between both buildings was equal to the width of the building. As shown, at small upstream distance, the windward wall is showing high negative pressure coefficient that reached a value of 0.7 with a bulk area of the windward subjected to this high suction. However, increasing the distance to twice the building width as in Figure 22C reduced the absolute coefficient to a value of 0.2 in most of the surface area despite having a value that reached 0.6 in very limited zone. This demonstrates that upstream distance dramatically influences pressure coefficients, with the original pattern gradually restored as distance increases since the flow gradually returns to the original state and the pressure coefficient stabilize and returns to the undisturbed case. Similar results were reported by Xie and Gu (2004) where the interference factor, defined as the ratio between the base moment of building with interference effects and the base moment of the isolated building, approaches 1 as the upstream distance increases. Figure 22F shows a very similar pattern, despite lower magnitudes, compared to the base case without interference effects. A similar trend is observed for the downburst case as shown in Figure 23. However, the original pattern and values in the downburst case is taking longer distance to be retrieved than the ABL case. The high suction in the windward wall with close upstream building might have contributed, beside wind-borne debris, to the façade damage of several buildings during the derecho such as the El Paso Energy Building and the CenterPoint Energy Plaza. A separate study should delve more to identify the difference in interference effects between ABL and downburst considering additional interference configurations and studying the effects on all surfaces for both mean and fluctuating components of the pressure coefficient.

Figure 22. Effect of upstream distance on the mean pressure coefficient of the windward wall in the ABL winds for 0 deg wind direction [distance increase from (A–F)].
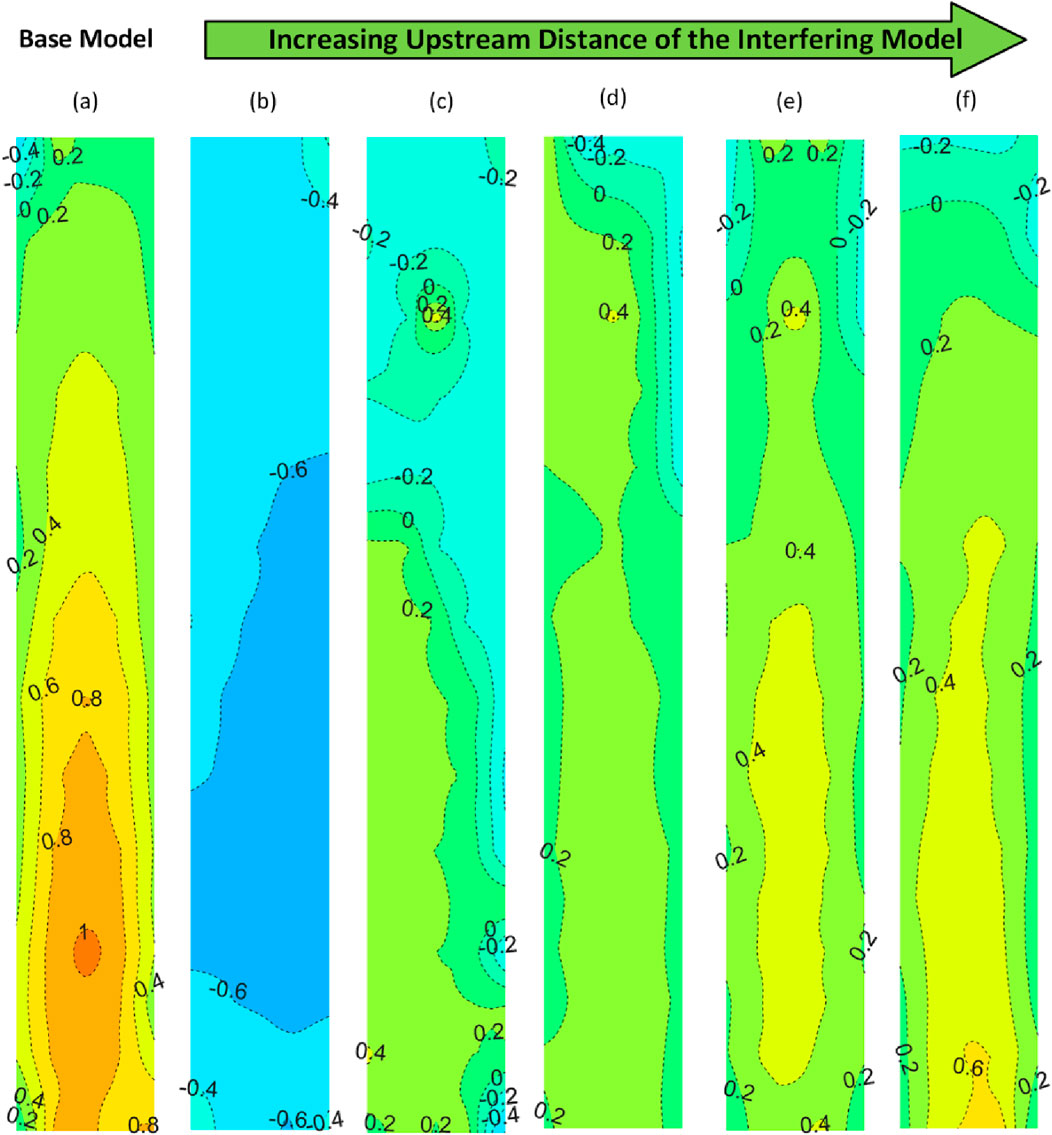
Figure 23. Effect of upstream distance on the mean pressure coefficient of the windward wall in the downburst winds for 0 deg wind direction [distance increase from (A–F)].
5 Conclusion
This study provides critical insights into the impact of extreme wind events on the façades of tall buildings, focusing on the derecho and Hurricane Beryl events that impacted Houston, Texas during 2024. Significant damage was observed on tall buildings in downtown Houston, despite being designed for wind speeds of up to 67 m/s which is higher than the recorded gust wind speed for both events. This damage caused various socio-economic impacts, including direct structural losses, interior damage, traffic disruptions from wind-borne debris, and business interruptions. The findings reveal notable vulnerabilities in tall building façades, particularly related to wind channeling effects in urban environments. Comparing the observations in both events, the damage resulted from the derecho was more severe than that resulted from the hurricane, despite comparable gust speeds. This suggests that the unique loading characteristics of non-hurricane events, such as derechos and downbursts, can have a disproportionate effect on localized areas of building façades. These variations in wind loading are especially critical in regions with mixed climates, where thunderstorm winds may influence design wind speeds and necessitate special provisions.
In the second part of this study, wind tunnel testing was conducted on a tall building under both Atmospheric Boundary Layer (ABL) and downburst wind conditions, with and without upstream interference from nearby buildings. The tests revealed different pressure coefficient patterns corresponding to the difference in wind profiles, with much higher suction on the sides of buildings during downburst events compared to ABL conditions.
Future research should focus on conducting a more detailed analysis of the aerodynamic differences between ABL and downburst winds for tall buildings. Additionally, detailed study of interference effects between closely spaced buildings under both ABL and downburst conditions to identify the difference in those effects. A codification study should also be performed to reassess pressure coefficients for tall building walls compared to building codes. Lastly, further exploration of the vibration response of buildings, specially under downburst events, using aeroelastic testing to study the interaction between building dynamics and transient events characterized by rapid ramp up and ramp down of wind speed which can cause dynamic amplification of the wind-induced forces on the tall buildings. This should be studied with comparison with ABL winds which are considered stationary in general.
By focusing on these areas, future research can contribute to the development of more resilient tall building designs, that might be capable of withstanding the unique challenges posed by both hurricanes and non-hurricane wind events, ultimately enhancing urban safety and reducing economic and social losses.
Data availability statement
The datasets presented in this article are not readily available because Data is not publicly available now. Requests to access the datasets should be directed to YWVsYXdhZHlAZml1LmVkdQ==.
Author contributions
OM: Writing–original draft, Writing–review and editing, Methodology, Formal analysis, Conceptualization. HI: Writing–review and editing, Methodology, Conceptualization. AE: Writing–review and editing, Resources, Funding acquisition, Methodology, Conceptualization. IZ: Writing–review and editing, Methodology. AC: Writing–review and editing, Methodology.
Funding
The author(s) declare that financial support was received for the research, authorship, and/or publication of this article. These tests were conducted at the NHERI Wall of Wind Experimental Facility (NSF Award No. 1520853 and No. 2037899). The authors acknowledge the financial support provided by NSF through “NSF-CMMI Award #2146277: CAREER: Bridging the Global Gap on Understanding Downburst Impacts on Buildings: Field Data-Modeling Research and Education for More Resilient Communities.”
Conflict of interest
The authors declare that the research was conducted in the absence of any commercial or financial relationships that could be construed as a potential conflict of interest.
Generative AI statement
The author(s) declare that no Generative AI was used in the creation of this manuscript.
Publisher’s note
All claims expressed in this article are solely those of the authors and do not necessarily represent those of their affiliated organizations, or those of the publisher, the editors and the reviewers. Any product that may be evaluated in this article, or claim that may be made by its manufacturer, is not guaranteed or endorsed by the publisher.
References
Abendroth, J. L. (2013). El Paso Energy – building envelope solutions for 1960s vintage construction.
Alawode, K. J., Vutukuru, K. S., Elawady, A., Lee, S. J., Chowdhury, A. G., and Lori, G. (2023). Wind-induced vibration and wind-driven rain performance of a full-scale single-skin facade unit with vertical protrusions. J. Archit. Eng. 29 (2), 04023003. doi:10.1061/jaeied.aeeng-1393
Asos, A. (1998). “Automated surface observing system: asos user’s guide,” in US dept. Of commerce. National oceanic and atmospheric administration: federal aviation administration (Washington, DC: US Navy: US Dept. of the Air Force). Available at: https://Www.Weather.Gov/Media/Asos/Aum-Toc.Pdf.
Bakhtiari, A., Alawode, K. J., Vutukuru, K. S., Lori, G., Elawady, A., Chowdhury, A. G., et al. (2024). Wind-induced dynamic behavior of single-skin curtain-wall system: a comparative numerical study. J. Archit. Eng. 30 (4), 04024032. doi:10.1061/jaeied.aeeng-1725
Butler, K., and Kareem, A. (2012). “Anatomy of glass damage in urban areas during hurricanes,” in Advances in hurricane engineering: learning from our past, 405–416.
Chen, B., Jiang, L., Zhang, L., Yue, W., Yang, H., and Yu, H. (2023). Wind resistance performance of large-scale glass curtain walls supported by a high-rise building. Buildings 13 (3), 636. doi:10.3390/buildings13030636
Cheng, X., Huang, G., Yang, Q., and Zhou, X. (2021). Influence of architectural facades on wind pressures and aerodynamic forces of tall buildings. J. Struct. Eng. 147 (1), 04020303. doi:10.1061/(asce)st.1943-541x.0002867
Council on Tall Buildings and Urban Habitat (2023). Year in review: tall trends of 2022: world surpasses 2,000 buildings of 200 meters or greater height. CTBUH. 44–51.
Council on Tall Buildings and Urban Habitat (2024). Year in review: tall trends of 2023: a record-Breaking bear for tall building completions. The Skyscraper Center.
Cui, W., and Caracoglia, L. (2020). Performance-based wind engineering of tall buildings examining life-cycle downtime and multisource wind damage. J. Struct. Eng. 146 (1), 04019179. doi:10.1061/(asce)st.1943-541x.0002479
da Silva, F. M., and Gomes, M. G. (2008). Gap inner pressures in multi-storey double skin facades. Energy Build. 40 (8), 1553–1559. doi:10.1016/j.enbuild.2008.02.014
Espinoza, S. G. (2024). Downtown Houston skyscraper window repairs continue after deadly derecho. Houst. Public Media. Available at: https://www.houstonpublicmedia.org/articles/news/houston/2024/05/21/488157/downtown-houston-skyscraper-window-repairs-continue-after-deadly-derecho/.
Gan Chowdhury, A., Zisis, I., Irwin, P., Bitsuamlak, G., Pinelli, J.-P., Hajra, B., et al. (2017). Large-scale experimentation using the 12-fan wall of wind to assess and mitigate hurricane wind and rain impacts on buildings and infrastructure systems. J. Struct. Eng. 143 (7), 04017053. doi:10.1061/(asce)st.1943-541x.0001785
INRIX (2024). Dallas microburst upends traffic, INRIX IQ shows city’s quick recovery. Available at: https://inrix.com/case-studies/dallas-microburst-upends-traffic-inrix-iq-shows-citys-quick-recovery/.
Kalliontzis, D., Rahman, A. U., Khan, W., Kenawy, M., Ghahremani, K., Pham, H., et al. (2024). Joint preliminary virtual reconnaissance report-early access reconnaissance report (PVRR-EARR) field assessment structural team (FAST) lead: field assessment structural team (FAST) Members: Virtual assessment structural team (VAST) section authors: (in order of section authored). Available at: https://www.steer.network.
Kareem, A. (1986). Performance of cladding in hurricane Alicia. J. Struct. Eng. 112 (12), 2679–2693. doi:10.1061/(asce)0733-9445(1986)112:12(2679)
Kareem, A., and Bashor, R. (2006). Performance of glass/cladding of high-rise buildings in Hurricane Katrina. Wind Eng. Newsl. AAWE, 1–5.
KHOU 11 Staff (2024). Tropical Storm Beryl brings 90+ mph winds, more than a foot of rain in some areas of Houston. Available at: https://www.khou.com/article/weather/hurricane/tropical-storm-beryl-wind-rain/285-4e7cc1e8-ecaa-45c5-a8f7-741d96a9c6cb.
Konz, R. C. (2009). “Cladding performance of high-rise buildings in the Houston CBD during Hurricane Ike,” in Forensic Engineering 2009: Pathology of the built environment, 739–748.
Krause, K. (2019). Thousands still without power Monday after powerful storms rake Dallas-Fort Worth. The Dallas Morning News. Available at: https://www.dallasnews.com/news/weather/2019/06/10/thousands-still-without-power-monday-after-powerful-storms-rake-dallas-fort-worth/.
Kwon, D.-K., and Kareem, A. (2009). Gust-front factor: new Framework for wind load effects on structures. J. Struct. Eng. 135 (6), 717–732. doi:10.1061/(ASCE)0733-9445(2009)135:6(717)
Lewis, B. (2024). How Did a derecho form in Houston? City Cast Houston. Available at: https://houston.citycast.fm/explainers/how-did-a-derecho-form-in-houston.
Li, Y., Mason, M. S., Bin, H. Y., and Lo, Y. L. (2023). Aerodynamic characteristics of a high-rise building in a steady thunderstorm outflow-like flow field. J. Wind Eng. Industrial Aerodynamics 240, 105501. doi:10.1016/j.jweia.2023.105501
Lima de Figueiredo, E., de Lima Nascimento, E., and Ilha de Oliveira, M. (2019). Analysis of two derecho events in Southern Brazil. Meteorology Atmos. Phys. 131, 1171–1190. doi:10.1007/s00703-018-0654-x
Lin, W. E., and Savory, E. (2006). Large-scale quasi-steady modelling of a downburst outflow using a slot jet. Wind & Struct. 9 (6), 419–440. doi:10.12989/was.2006.9.6.419
Liu, J., Hui, Y., Yang, Q., and Tamura, Y. (2021). Flow field investigation for aerodynamic effects of surface mounted ribs on square-sectioned high-rise buildings. J. Wind Eng. Industrial Aerodynamics 211, 104551. doi:10.1016/j.jweia.2021.104551
Loredo-Souza, A. M., Lima, E. G., Vallis, M. B., Rocha, M. M., Wittwer, A. R., and Oliveira, M. G. K. (2019). Downburst related damages in Brazilian buildings: are they avoidable? J. Wind Eng. Industrial Aerodynamics 185, 33–40. doi:10.1016/j.jweia.2018.11.022
Lou, W., Huang, M., Zhang, M., and Lin, N. (2012). Experimental and zonal modeling for wind pressures on double-skin facades of a tall building. Energy Build. 54, 179–191. doi:10.1016/j.enbuild.2012.06.025
Malcolm, T. (2024). Louisiana city’s hurricane-damaged skyscraper imploded. Available at: https://www.chron.com/news/article/lake-charles-tower-imploded-hurricane-19751079.php.
Mayercsik, N. P., and Bennett, P. J. (2024). Directionality considerations in building facade assessments for distress due to storms and construction defects. Forensic Eng. 2024, 948–956. doi:10.1061/9780784485798.097
Mejia, A. D., Elawady, A., Vutukuru, K. S., Chen, D., and Chowdhury, A. G. (2022). Examination of different wall jet and impinging jet concepts to produce large-scale downburst outflow. Front. Built Environ. 8, 980617. doi:10.3389/fbuil.2022.980617
Miranda, J. (2024). Downtown Houston hit yet again with more shattered glass. Chron. Available at: https://www.chron.com/news/houston-texas/article/downtown-houston-windows-beryl-19563140.php.
Molina Hutt, C., Almufti, I., Willford, M., and Deierlein, G. (2016). Seismic loss and downtime assessment of existing tall steel-framed buildings and strategies for increased resilience. J. Struct. Eng. 142 (8), C4015005. doi:10.1061/(asce)st.1943-541x.0001314
National Weather Service (2024a). Hurricane Beryl 2024. Available at: https://www.weather.gov/lch/2024Beryl.
National Weather Service (2024b). Tropical event summary. National Oceanic and Atmospheric Administration. Available at: https://www.weather.gov/hgx/tropicaleventsummary.
NOAA Storm Prediction Center (2024). Mesoscale discussion 806: severe weather event review for Thursday. NOAA. Available at: https://www.spc.noaa.gov/exper/archive/event.php?date=20240516.
Padgett, J., Rincon, R., and Tafur, A. (2024). “Reconnaissance of wind damage to buildings in downtown Houston,” in Reconnaissance of wind damage to buildings in downtown Houston (Texas: DesignSafe-CI).
Pryor, K. L. (2023). “Downburst monitoring and prediction studies,” in Field measurements for Passive environmental Remote Sensing (Elsevier), 411–429.
Sengupta, A., and Sarkar, P. P. (2008). Experimental measurement and numerical simulation of an impinging jet with application to thunderstorm microburst winds. J. Wind Eng. Industrial Aerodynamics 96 (3), 345–365. doi:10.1016/j.jweia.2007.09.001
Tamura, Y. (2009). “Wind-induced damage to buildings and disaster risk reduction,” in Proceedings of the APCWE-VII, Taipei, Taiwan.
Voiland, A. (2024). Derecho darkens Houston. NASA Earth Obs. Available at: https://earthobservatory.nasa.gov/images/152843/derecho-darkens-houston.
Williams, T., and Kareem, A. (2003). Performance of building cladding in urban environments under extreme winds. Proc., 11th Int. Conf. Wind Eng.
Xie, Z. N., and Gu, M. (2004). Mean interference effects among tall buildings. Eng. Struct. 26 (9), 1173–1183. doi:10.1016/j.engstruct.2004.03.007
Keywords: tall building aerodynamics, downburst winds, wind tunnel testing, damage observations, ABL wind
Citation: Metwally O, Ibrahim HA, Elawady A, Zisis I and Chowdhury AG (2025) Wind load impact on tall building facades: damage observations during severe wind events and wind tunnel testing. Front. Built Environ. 10:1514523. doi: 10.3389/fbuil.2024.1514523
Received: 21 October 2024; Accepted: 31 December 2024;
Published: 21 February 2025.
Edited by:
David Richard Johnson, Purdue University, United StatesReviewed by:
David James Henderson, James Cook University, AustraliaBo Li, Beijing Jiaotong University, China
Copyright © 2025 Metwally, Ibrahim, Elawady, Zisis and Chowdhury. This is an open-access article distributed under the terms of the Creative Commons Attribution License (CC BY). The use, distribution or reproduction in other forums is permitted, provided the original author(s) and the copyright owner(s) are credited and that the original publication in this journal is cited, in accordance with accepted academic practice. No use, distribution or reproduction is permitted which does not comply with these terms.
*Correspondence: Amal Elawady, YWVsYXdhZHlAZml1LmVkdQ==