- 1Guangxi Xingang Communications Investment Group Corporation Ltd., Qinzhou, China
- 2Research Institute of Urbanization and Urban Safety, School of Civil and Resource Engineering, University of Science and Technology Beijing, Beijing, China
- 3CCCC Highway Bridges National Engineering Research Center Co., Ltd., Beijing, China
- 4School of Engineering and Technology, Central Queensland University, Melbourne, VIC, Australia
- 5School of Architecture and Civil Engineering, The University of Adelaide, Adelaide, SA, Australia
Fiber Reinforced Polymer (FRP) composites are known for their exceptional resistance to harsh conditions, impressive durability, and high tensile strength, making them increasingly popular in structural applications. However, the inherent variability of composite materials poses a critical challenge, particularly in tensile strength, which directly impacts the safety and durability of structures. This study evaluated the tensile strength of 395 specimens, including 103 carbon fiber-reinforced polymer (CFRP) rods and 293 hybrid glass-carbon FRP (HFRP) rods, tested according to the GB 30022–2013 standard. To analyze the data, four statistical distributions—normal, lognormal, Weibull, and Gamma—were applied, and a goodness-of-fit test identified the Weibull distribution as the most suitable model. The study further proposed standardized tensile strength values of 2,912.40 MPa for 5 mm CFRP rods and 2,230.98 MPa, 2,385.12 MPa, and 2,517.44 MPa for 6, 7, and 8 mm HFRP rods, respectively. These findings provide valuable insights into the tensile performance of FRP rods, contributing to enhanced design and safety standards for FRP-based structural elements and offering practical references for mitigating material variability in construction applications.
1 Introduction
Fiber Reinforced Polymer (FRP) has excellent tensile strength, durability, and corrosion resistance and can withstand long-term cyclic/fatigue loading and harsh working conditions (Al-Salloum et al., 2013; Bakis, 2011; Duo et al., 2021; Helbling and Karbhari, 2007; Sun et al., 2024; Yang et al., 2015; Yi et al., 2021). In recent times an increase in the use of FRP bars can be noticed in the construction sector replacing the use of traditional steel bars (Liu et al., 2022; Tafsirojjaman et al., 2022; Xue et al., 2023). This is an important way to fundamentally solve the problem of insufficient durability of concrete structures and achieve larger spans and lighter structures (Benmokrane et al., 2000; Dębski et al., 2002; Hollaway, 2010; Li-Ye et al., 2022; Van Den Einde et al., 2003; Wang and Wu, 2010; Wen and Xiangxin, 2023; Wu et al., 2007; Wu et al., 2014; Zhitao and Kuihua, 2007). The FRP composite materials used in construction have significant variability in their properties, including geometric features (layer angle and size), material properties (elastic modulus, shear modulus, Poisson’s ratio, and material density), external properties such as thermal and load effects, and production processes (Chang-Huan et al., 2005; Du et al., 2024; Heng et al., 2024; Liu et al., 2024; Liu et al., 2023; Wei et al., 2023; Yalei et al., 2024). These factors have the potential to influence the mechanical properties of composite materials. Therefore, conducting a dispersion analysis of these materials can effectively improve their reliability. Reliability design aims to minimize the possibility of product failure within the specified service life under specified working conditions, starting from safety, economy, and maintainability (Anni et al., 2022; Bin et al., 2014; Shan-Hua et al., 2012; Xin, 2024; Jiang-Wei and Zhuan-Yong, 2017; Yu and Ping, 2013; Yufen, 2024a).
In 1920, Griffith (Lajtai, 1971) proposed the theory of fracture based on the existence of defects within materials and suggested that under certain conditions, small defects or cracks would expand unstably, leading to the failure of the material. While this explains the reason for the failure of materials with actual strength lower than yield strength, it could not explain the relationship between material strength, geometric shape, and load. Peirce (Pierce, 1926) proposed the concept of weak nodes, conceptualising that fibers can be divided into several nodes along their length direction. As long as one node breaks, the entire fiber will break, and the broken node is termed a “weak node”. The tensile strength of the fiber depends mainly on the strength of the weak node (Yufen and Boming, 2010). On this basis, Peirce’s weak section theory was improved, which suggests that fiber fracture does not occur at a certain point in Peirce’s theory of length, but rather within a certain length fracture interval. In 1951, Weibull proposed the strength distribution theory based on Peirce’s weak section theory, which can accurately characterize the strength distribution of carbon fibers and verify the applicability of the weak section theory in the field of carbon fiber strength (Weibull, 1951).
In recent years, a widespread research on the discrete mechanical properties of carbon fibers can be seen in the literature, where researcher from several countries including China is playing a leading role. Gang et al. (2014) tested the tensile strength of domestic T300 grade carbon fiber single and double filaments and used Weibull distribution to describe the average tensile strength of carbon fiber single filaments. The results showed that the tensile strength performance of domestic T300 grade carbon fiber monofilament reached the level of Dongli T300 carbon fiber. The dispersibility of the T300 grade carbon fiber monofilament was smaller than that of the Dongli T300 carbon. Moreover, the strength of the multifilament of the former is slightly lower than that of the latter. Based on the Weibull theory, Wu et al. conducted a probabilitstic statistical analysis of the tensile strength of carbon fibers and explored the relationship between fiber tensile strength and the length and diameter of fiber monofilament. In a similar research, Wu and Boming (2010) collected and organized nearly 1000 FRP material performance test sample data, and used three fitting goodness test methods, namely, σ2 test, K-S test, A-D test, to analyze the probability distribution types of FRP ultimate tensile strength, elastic modulus, and thickness, and developed a correlation between each indicator. Grounded on the Weibull distribution function, they (Wu and Boming, 2010) redefined the standard value of FRP tensile strength and compared the calculated value with the current standard value. Wang et al. (2022) used the classic rule of mixture formula to predict the tensile strength of domestic carbon fiber reinforced polymer (CFRP) bars. The predictions demonstrated significant error when compared to the measured values. Even though the mechanical properties distribution of Fiber Reinforced Polymer composites has been extensively investigated in the literature, a gap of knowledge still exists on their statistical distribution for structural tendons of circular cross-section.
Despite these advances, research on the statistical distribution of the mechanical properties of FRP rods, especially those with circular cross-sections used as structural tendons, remains limited. This gap poses challenges for the development of reliable design methodologies and the adoption of FRP in critical engineering applications. Addressing this issue is essential for advancing the understanding of FRP mechanical behavior, improving material reliability, and promoting its broader application in the construction sector.
In this study, tensile strength tests on carbon fiber reinforced polymer (CFRP) and carbon fiber and glass fiber composite rods herein named hybrid fiber reinforced polymer (HFRP) has been conducted. The CFRP rods were of a diameter of 5 mm, while the HFRP rods were of varying diameters of 6 mm, 7 mm, and 8 mm. The tensile strength of FRP rods obtained from the tests was analysed using four distribution types, namely, normal distribution (D’agostino, 2017), lognormal distribution (Gaddum, 1945), two-parameter Weibull distribution (Wozniak and Li, 1990), and Gamma distribution (Stacy, 1962). These distributions were chosen to account for the observed skewness, variability, and failure characteristics commonly associated with FRP materials. Besides, this selection process aligns with prior studies that have used these distributions to characterize the tensile strength and reliability of FRP materials, as it provides a better representation of the variability observed in experimental data (Lekou and Philippidis, 2008; Yang et al., 2019; Zeng et al., 2024). Finally, the Kolmogorov-Smirnov (K-S) (Berger and Zhou, 2014) and Anderson-Darling (A-D) (Nelson, 1998) goodness of fit test methods were used to assess the performance of these distribution models.
2 Tensile test of FRP rods
2.1 Material and specimens
All the materials used to produce the specimens were manufactured by Zhongfu Carbon Core Cable Technology Co., Ltd. The rods used in this experiment are 5 mm diameter CFRP rods as well as 6 mm, 7 mm, and 8 mm diameter HFRP rods (Sun et al., 2021). The hybridization consists of a central section made of carbon fiber (CF) enveloped by a layer of Glass Fiber (GF), as shown in Figure 1A. The composition of each rod as well as its fiber content is given in Table 1. To ensure the integrity of the rod’s mechanical properties, the specimens were stored in a room with a temperature of 25°C and a relative humidity of 60%.
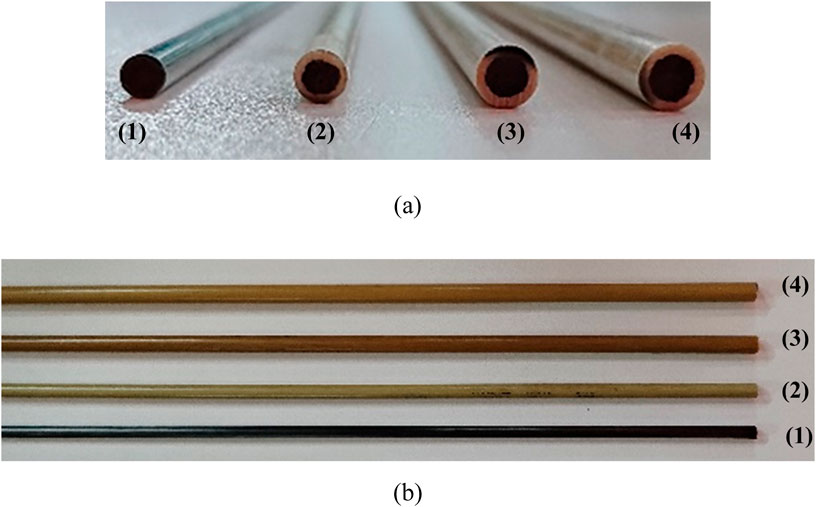
Figure 1. Carbon and hybrid glass-carbon FRP rods. (A) Cross-sections; (B) rod; (1) 5 mm, (2) 6 mm, (3) 7 mm, (4) 8 mm.
The CFRP and HFRP rods were cut into a length of 800 mm (shown in Figure 1B) as per the specification of GBT 30022–2013 (Test Method, 2013). In order to minimize experimental errors and ensure data reliability, all CFRP and HFRP test specimens were produced from the same batch. A total of 396 FRP rods (103 for 5 mm CFRP, 100 for 6 mm HFRP, 93 for 7 mm HFRP, and 100 for 8 mm HFRP),were tested in the experimental program. All tests were carried out at the Zhongfu Carbon Core Cable Technology Co., Ltd. laboratory.
Figure 2 shows the anchorage system utilized for the test. It features a clip-type anchor of 210 mm tapered at the top with a hole that helps attach the specimen to the testing machine. Before testing, the preparation of the specimen was meticulously carried out to ensure accurate and reliable results. Of the 800 mm rod length, 420 mm are dedicated to anchorage (210 mm at each extremity) and 380 mm serves as the span length, where the failure of the specimen is supposed to occur. Both ends of the CFRP rod were thoroughly roughened to increase the friction coefficient on the surface of the rod, making it more tightly connected to the anchor. To ensure a good performance of the pair of anchors the threads and the interior were cleaned with anhydrous ethanol to remove any residual carbon powder from the anchor. Additionally, the cleaning process was followed by air drying the anchors to prevent any residual moisture from affecting the connection. This cleaning procedure was rigorously conducted after every 25 tensile tests to maintain consistency and prevent performance degradation.
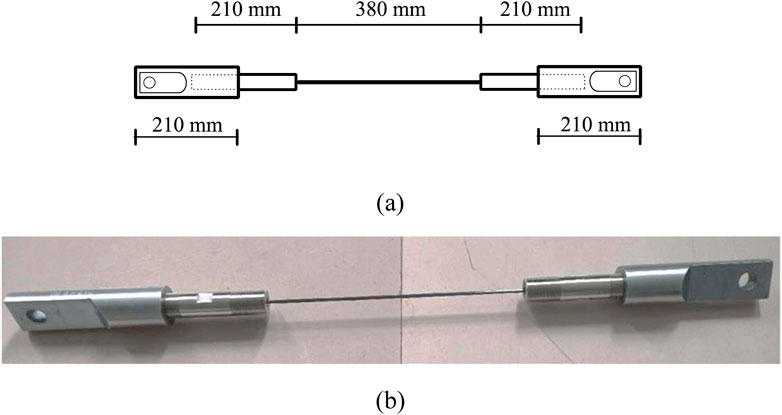
Figure 2. Anchorage system of the tensile test specimen: (A) schematic illustration, (B) real specimen.
2.2 Testing procedure
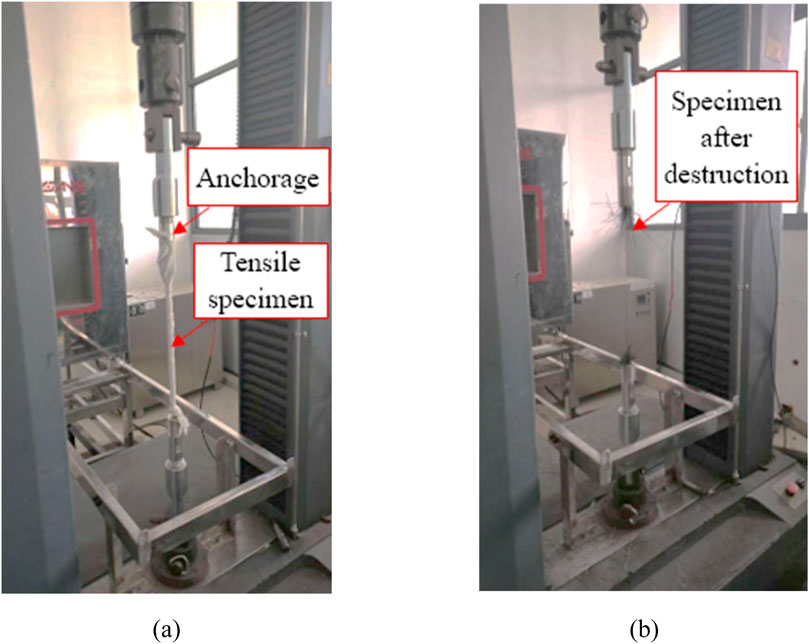
Tensile tests were conducted according to “GBT 30022–2013 (Test Method, 2013),” using a Mester CMT5105 microcomputer-controlled universal testing machine (UTM) with a maximum tensile force of 100 kN. Prior to testing, the specimens were placed on the UTM and wrapped with a wet fabric to prevent carbon fiber fragments spread during rod failure (shown in Figure 3). All the tests were performed at a loading rate of 5 mm/min and any specimen that failed within the anchorage section, near the anchor, or slipped out from the anchor during tension was considered invalid.
The tensile strength of the specimen was calculated using the following Equation 1:
Where
3 Experimental results
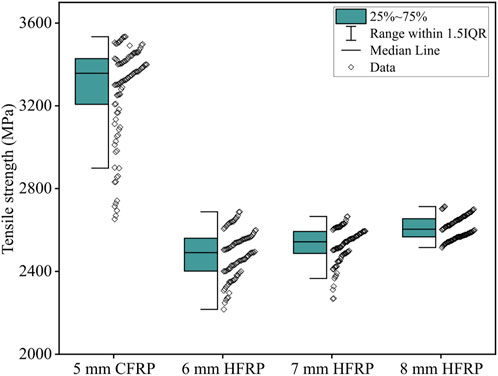
Figure 4 shows a visual summary of the set of tensile strength obtained from the tensile test of 5 mm CFRP, 6 mm HFRP, 7 mm HFRP, and 8 mm HFRP including the median, interquartile range (IQR), and potential outliers. Each box is critical for understanding the spread of the central half of the data points. The IQR of all the groups of data span from the first quartile (Q1, 25th percentile) to the third quartile (Q3, 75th percentile). To set the boundaries of the typical data spread the “whiskers” extend 1.5 times the IQR.
Overall, the comparison across these FRP types and sizes shows significant differences in both the central tendencies and variabilities of their tensile strengths. The 5 mm CFRP box plot appears to show a higher average tensile strength compared to the HFRP, as indicated by the position of the median line within the box. On the other hand, the 6 mm, 7 mm, and 8 mm HFRP box plots illustrate a general trend where the median tensile strength appears to decrease slightly as the thickness increases from 6 mm to 8 mm.
The average tensile strengths of 5 mm diameter CFRP rods and 6 mm, 7 mm and 8 mm HFRP rods are shown in Table 2. It can be seen that the 5 mm CFRP rods recorded the highest tensile strength of 3,285.15 MPa. The HFRP rods on the otherhand recorded lower tensile strength (max. 23%) despite having larger diameter. An increase of HFRP tensile strength with respect to the diameter of the rod was noticed. This behvaior can be attributed to the larger carbon fiber section present within the HFRP rods of higher diameter.
4 Probability distribution modeling and parameter estimation
To precisely define the probabilistic distribution characteristics of the tensile strength of CFRP, multiple probability distribution models were employed, including the Normal distribution, Lognormal distribution, two-parameter Weibull distribution, and Gamma distribution. In this study, the applicability of each probability distribution model to describe the tensile strength distribution of CFRP was analyzed using the Kolmogorov-Smirnov (K-S) (Berger and Zhou, 2014) and Anderson-Darling (A-D) (Nelson, 1998) goodness of fit test methods. This approach allowed for the quantification of the similarity between observed data and theoretical models, ultimately identifying the most explanatory probability distribution type.
The Normal distribution (D’agostino, 2017) is characterized by its bell-shaped curve, which exhibits symmetry. The peak of this curve corresponds to the mean value (μ), while the standard deviation (σ) determines the spread of the curve. A smaller standard deviation indicates that data points are relatively concentrated, whereas a larger standard deviation suggests that data points are more dispersed. The Normal distribution (approximated using Equation 2) is typically used to represent situations where the tensile strength of CFRP is symmetrically and relatively evenly distributed.
where μ ranges from negative infinity to positive infinity, and the standard deviation σ is greater than zero.
The Lognormal distribution (Gaddum, 1945), derived from the natural logarithm of a normal distribution (using Equation 3), is characterized by its right-skewness, where the tail of the distribution extends to the right. This probability of distribution density curve exhibits a long-tailed shape. It is particularly suitable for analyzing datasets that are skewed to the right.
The two-parameter Weibull distribution (Weibull, 1951; Wozniak and Li, 1990), introduced by Swedish engineer Waloddi Weibull in the 1950s, is extensively utilized to describe the duration or lifetime of random variables. This distribution plays a crucial role in reliability engineering and survival analysis. It is particularly suited for modeling and analyzing life data of various products, such as the failure times of components and breakdown times of equipment. By fitting actual data to the two-parameter Weibull distribution (using Equation 4), failure rate curves, life distribution, and reliability parameters can be estimated, which can be used in assessing product reliability and prediction of lifespan (Jiang and Murthy, 2011).
where, β represents the shape parameter and η the scale parameter, with both η and β being greater than zero, and x being non-negative.
The Gamma distribution (Stacy, 1962) is widely used to describe the duration or waiting times of positive random variables. As per this model, the relationship between the duration and random variables can be established using Equation 5. It holds significant applications in the fields of statistics and probability theory, particularly in areas such as reliability analysis, queueing theory, and financial modeling.
This configuration underpins the foundational structure of the Gamma distribution, reinforcing its utility in describing the behavior of variables across diverse analytical contexts.
4.1 CFRP rod of 5 mm diameter
In this section, the cumulative probability distribution function for a set of 103 tensile strength data of 5 mm CFRP rods was computed. Prior to the calculation, the parameters of each distribution function were determined. Table 3 provides a detailed presentation of the estimated parameters for various probability distributions, each accompanied by their 95% confidence intervals. The normal distribution indicates a mean of 3,294.041, with a confidence interval between 3,252.863 and 3,335.219, suggesting that the true average is likely to fall within this range. The standard deviation, which is only 6.4% of the mean reflects a low variation around the mean tensile strength of the CFRP rods. On the other hand, an average of 8.09773 and a standard deviation of 0.06683 is obtained with the log-normal distribution, both with very narrow confidence intervals, indicating precise parameter estimates.
The Weibull distribution suggests an η parameter of 3,379.81 which is approximately 2.9% higher than the average tensile strength calculated directly from experimental results. Nevertheless, the distribution indicates a parameter β of 23.62624, demonstrating its reliability and spread. Lastly, the Gamma distribution shows parameters α and β of 233.5675 and 14.10316 respectively; suggesting a relatively high degree of variability within the data.
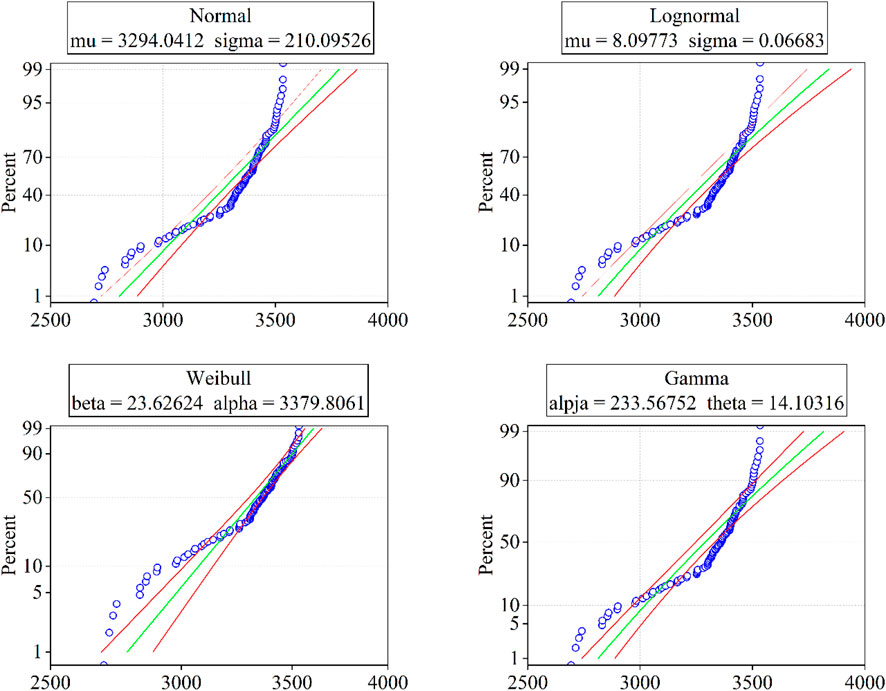
After estimating the parameters for each distribution, the histogram of the tensile strengths of this batch of samples were plotted (as shown in Figure 5). It is apparent that the tensile strengths of CFRP rods are more in line with the Weibull distribution.
Figure 6 illustrate the tensile strength of the 5 mm CFRP rods compared with four distributions models, where the red lines indicate the estimated intervals of tensile strength and the green lines represent the fitted curves for the four distributions. If the tensile strength conforms to one or more of the distribution models, the values tend to be more distributed between the two red lines and around the green line. Through careful observation, it is found that the tensile strength of 5 mm CFRP rods tends to be more consistent with the estimated form of the Weibull distribution.
4.2 HFRP rod of 6 mm diameter
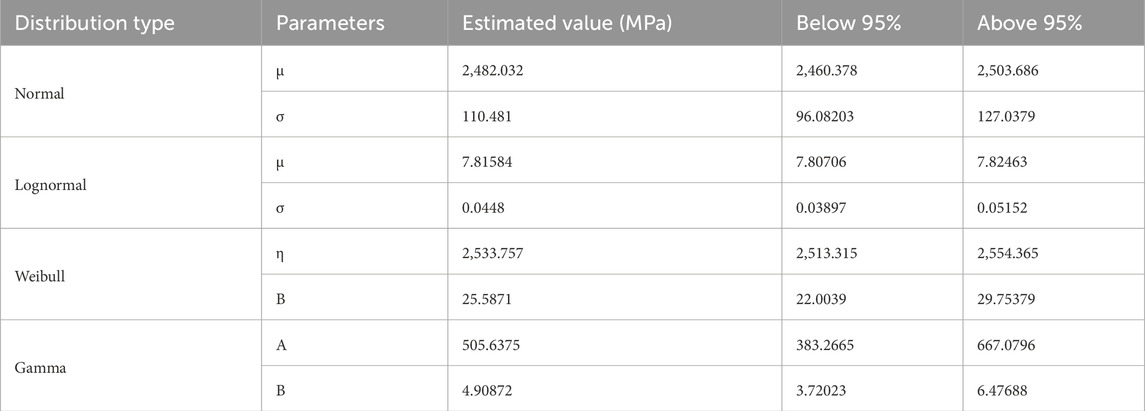
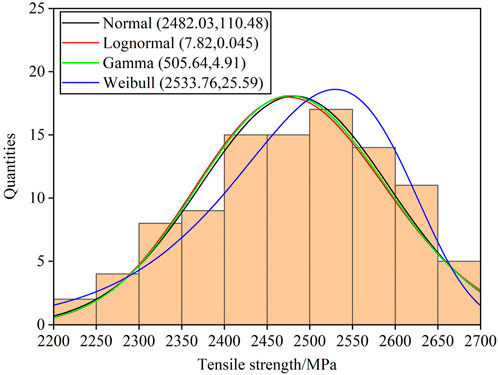
The parameters of the four probability distributions for the 6 mm HFRP rods are presented in Table 4. In the Normal model, the parameters µ and σ of 2,482.032 and 110.481, respectively, suggest the data clusters around this central value with a lower dispersion than the data for the 5 mm CFRP rod. In fact, for the latter, the standard deviation in the normal distribution was estimated at 99.61 MPa more than that of the 6 mm HFRP rod. On the other hand, the low 95% confidence intervals for both parameters provide a precise estimate.
The characteristic parameters of the Gamma distribution, α and β, have values of approximately 505.64 and 4.91, respectively. A higher α paired with lower β suggests a high frequency of significant data points, indicative of frequent higher measurements. When compared to the Gamma parameters of the CFRP rod, two different trends was observed. The first trend demonstrates a decrease in α, while the second trend shows an increase in β. This suggests that the hybridization of carbon fibers and glass fibers within a rod may have a high impact on the tensile strength probability distribution shape and scale.
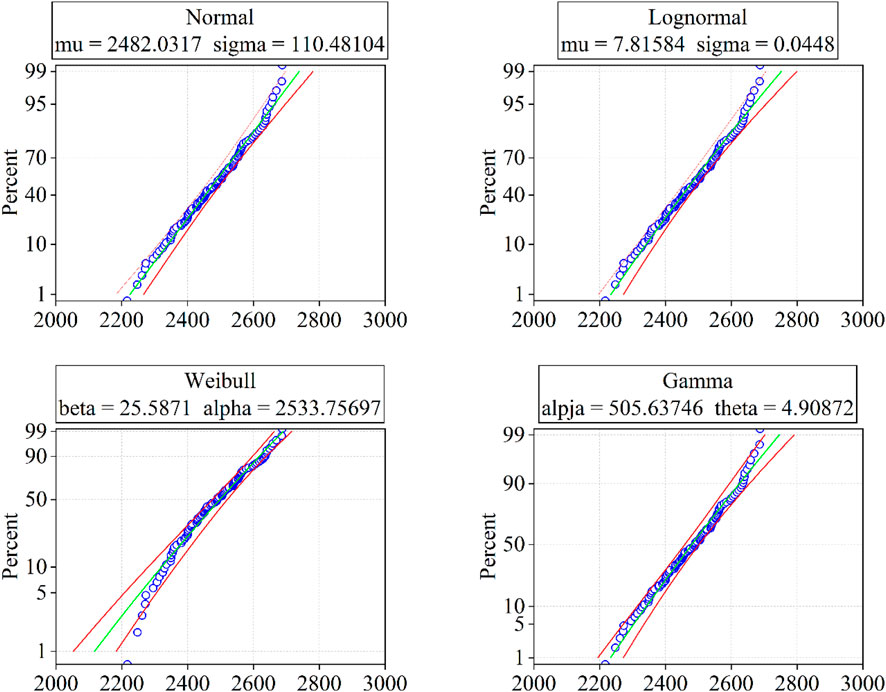
The lognormal and Weibull distributions also offer a large insight into the 6 mm HFRP rods data shape and scale. For the former, parameters µ and σ of 7.81584 and 0.0448, respectively, suggest a concentrated distribution of data. Conversely, the latter, with shape parameter β of 25.5871 and scale parameter η of 2,533.757, indicates an increasing failure rate. Figure 7 gives an illustrative display of the distributions.
The fitting curves of the tensile strength distribution for 6 mm HFRP are shown in Figure 8. Each graph juxtaposes empirical data with theoretical models to evaluate their suitability. Although the normal distribution has a symmetric profile around the mean, it fails to adequately reflect the extremities, indicating a restriction in its ability to represent the whole range of tensile strengths. In contrast, the Lognormal distribution aligns better with the empirical data, especially at higher values. Similarly, the Gamma distribution fits well, particularly at higher strengths, but shows minor discrepancies at the lower end.
On the other hand, the Weibull curve provides an excellent fit across all data points, showcasing its suitability for modelling the distribution of 6 mm HFRP rods. It offers a comprehensive representation that encompasses the full spectrum of observed strengths, crucial for predicting the material’s behavior under operational conditions.
4.2.1 HFRP rod of 7 mm diameter
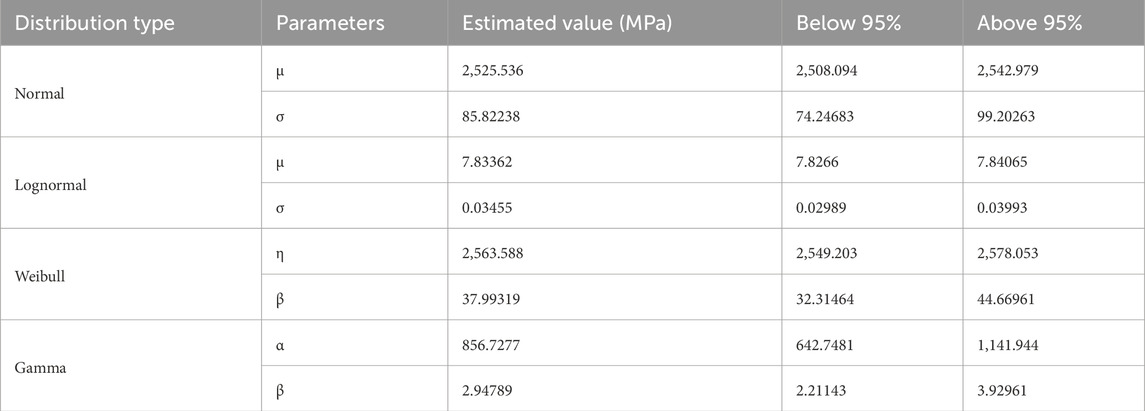
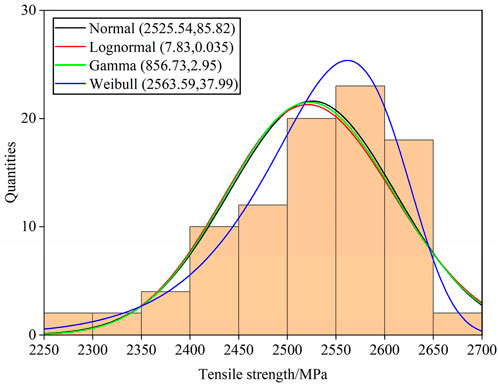
In Table 5, the Normal distribution reflects an average tensile strength of 2,525.536 MPa and its variability with a σ of 85.82 for the 7 mm diameter rods. The relatively lower standard deviation compared to the 6 mm HFRP rods and 5 mm CFRP rods, which have standard deviations of 110.481 and 210.09, respectively, suggests that the 7 mm HFRP rods exhibit less variability in tensile strength, potentially indicating that the addition of GF grants more consistentcy to the tensile strength distribution.
The Lognormal distribution parameters, µ = 7.83362 and σ = 0.03455 indicate that the logarithm of the tensile strength measurements is centred around the mean (7.83), which closely aligns to the of the 6 mm rods (7.81), but with a tighter distribution (0.03). The implication here is that while extremely high strength values are more common, they deviate less from the median strength, pointing to a reliable performance characteristic of the 7 mm HFRP rods.
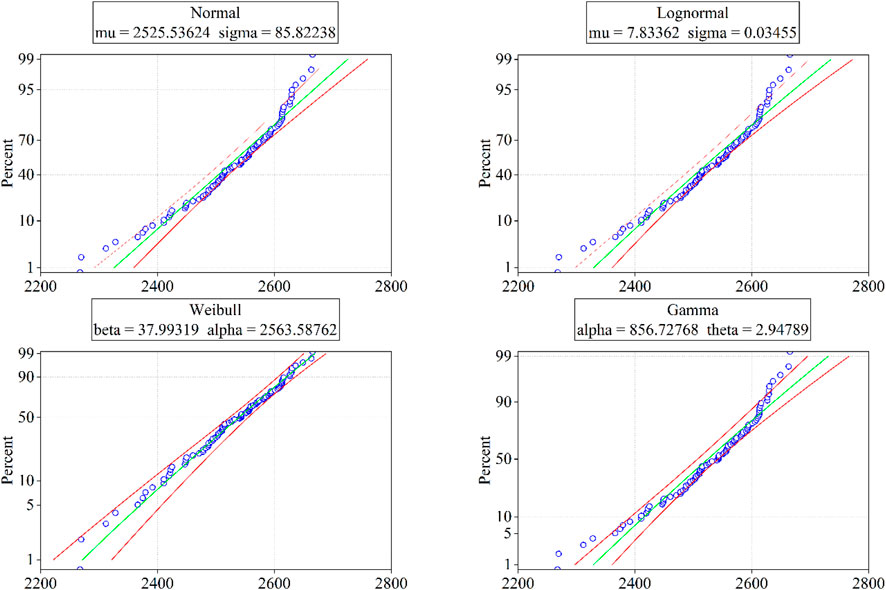
The average tensile strength for the 7 mm HFRP rods obtained with Weibull distribution parameters and experimental results were 2,563.588 MPa and 2,525.54 MPa, respectively. It is apparent that the Weibull distribution model predictions closely align with the experimental results. In addition, the standard deviation of this distribution is also lower than that of the normal distribution (37.99) suggesting the Weibull model might reflect the tensile strength spread better than the normal distribution, as shown in Figure 9. Besides, the Gamma distribution with shape α of 856.7277 and rate β of 2.94789, which highlights the frequency and scale of tensile strengths observed, respectively. These parameters indicate a more frequent occurrence of higher strengths but at a reduced accumulation rate compared to the 6 mm HFRP rods.
As shown in Figure 10, the Normal distribution curve effectively captures the central clustering of data points. However, as is typical with the type of distributions, the fit at the extremities show minor nonconformities, indicating potential limitations of this model in capturing the full range of observed tensile strengths. Likewise, a good fit is obtained with the Gamma distribution curve mainly because it captures the higher range of tensile strengths, though showing slight underestimation at the lowest strengths.
The Weibull distribution provides an excellent fit across all data points with close adherence to both the lower and upper bounds of data. The latter with the Lognormal distributions stand out for their superior ability to represent the tensile strength distribution of 7 mm HFRP rods, with the Weibull model slightly excelling due to its comprehensive fit throughout the entire range of strengths observed.
4.2.2 HFRP rod of 8 mm diameter
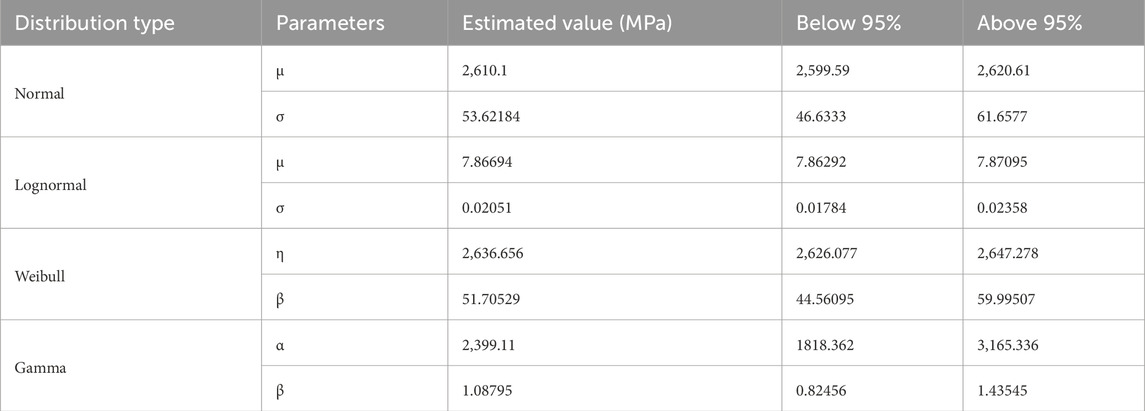
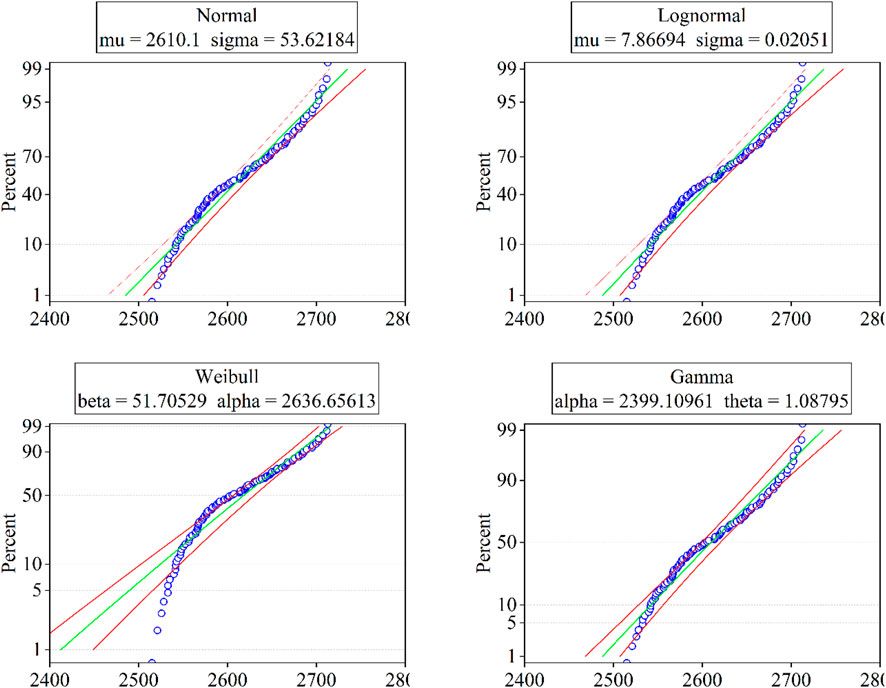
The statistical analysis of the 8 mm HFRP rods, detailed in Table 6, shows that the Normal distribution has a mean tensile strength of 2,610.1 MPa with a relatively low standard deviation of 53.62184. This indicates a strong central tendency of the tensile strength with minimal variability. In the same vein, the Weibull distribution also displays a scale parameter of 2,636.656 MPa, which is closer to the experimental average tensile strength and shape parameter (of 51.70529). Conversely, the Lognormal distribution presents a µ of 7.86694 and a very low σ of 0.02051, reflecting concentrated high values of tensile strength. Lastly, the Gamma distribution indicates a high occurrence of substantial tensile strengths at a decreasing rate of occurrence with a parameter α of 2,399.11 MPa and a β of 1.08795. A clear visualization of the four distributions is presented in Figure 11.
Comparing these parameters to those of the other HFRP rods, a noticeable increase in both the mean and the scale parameters in the Normal and Weibull distributions, is observed. For the 7 mm HFRP rods, the average strength is 2,525.536 with a standard deviation of 85.82238, and the Weibull η is 2,563.588. Besides, the 6 mm HFRP rods demonstrated a lower Normal mean (µ = 2,482.032) and a higher standard deviation (σ = 110.481), indicating less consistency in material strength. This also indicates that as the rod thickness increases, both the central value and the variability improves. Likewise, the Lognormal and Gamma distributions suggest tighter control and higher quality in the 8 mm HFRP rods compared to the 7 mm, and 6 mm rods, with less variability and more frequent high strengths, respectively.
The 5 mm CFRP rods, however, has a much higher Normal mean (µ = 3,294.041 MPa) and a greater standard deviation (σ = 210.0953 MPa), suggesting stronger but more variable material properties. The Weibull and Gamma distributions also show that the 5 mm CFRP rods have the highest strength occurrence and durability, albeit with significant variability. Therefore, the 8 mm provides a more balanced profile with high strength and reduced variability, making them highly suitable for applications requiring both durability and consistency.
Figure 12 displays the fitting curves of the tensile strength distribution for the 8 mm HFRP rods using the four statistical models. Similar to the 5 mm CFRP and 6 mm and 7 mm HFRP, the Normal distribution plot of the 8 mm HFRP rods capture the central clustering of data effectively. It also struggles to accurately represent the extremes, indicating limitations in fully encompassing the variability in material strength. Likewise, the Lognormal distribution also struggles to fit the data points toward the extremities. Although the Weibull distribution fits well, particularly at higher strengths, it exhibits minor fitting challenges at the lower end. Overall, the Weibull distribution stands out as the most effective model, offering robust predictive capabilities for the mechanical properties of the 8 mm HFRP rods. The Gamma distribution demonstrates excellent fits across the data spectrum, particularly for its precise alignment along the entire range of tensile strengths.
5 Discussions
5.1 Effect of hybridization
The statistical distribution of tensile strength reveals significant distinctions between CFRP and HFRP rods. The 5 mm CFRP rods achieve a superior mean tensile strength of 3,285.16 MPa, surpassing that of HFRP rods, which demonstrate tensile strengths ranging from 2,472.32 MPa to 2,612.11 MPa as their diameter increases. However, the variability in tensile strength, as quantified by standard deviation and Weibull shape parameters, is notably greater in CFRP rods. Specifically, the Weibull shape parameter for CFRP rods is 23.63, compared to progressively higher values of 25.59, 37.99, and 51.71 for 6 mm, 7 mm, and 8 mm HFRP rods, respectively, indicating enhanced consistency in HFRP rods.
These differences are intrinsically linked to the composition and hybrid structure of the rods. The increasing volume fraction of carbon fibers in hybrid rods enhances their tensile properties, while the inclusion of glass fibers effectively mitigates variability (Naito and Oguma, 2017). The stress-distribution characteristics of glass fibers, which possess a greater elongation capacity than carbon fibers, significantly improve resistance to abrupt failures by balancing localized stresses across the composite structure (You et al., 2007). This hybridization effect is further substantiated by the tighter confidence intervals and gamma distribution parameters observed in HFRP rods (e.g., α = 2,399.11 and β = 1.09 for 8 mm HFRP rods, compared to α = 233.57 and β = 14.10 for 5 mm CFRP rods). These parameters signify the enhanced consistency and mechanical stability introduced by hybridization.
The implications of these findings are profound for civil engineering applications. The reduced variability and increased predictability of HFRP rods make them highly reliable for critical infrastructure, such as bridges and tunnels, where consistent mechanical performance and cost efficiency are essential.
5.2 Effect of diameter
With increasing rod diameter, both the mean tensile strength and performance consistency of fiber-reinforced polymer rods improve. For HFRP rods, tensile strengths increase from 2,472.32 MPa for 6 mm diameter rods to 2,612.11 MPa for 8 mm diameter rods. This augmentation is accompanied by a notable reduction in variability, as evidenced by a rise in Weibull shape parameters from 25.59 for 6 mm rods to 51.71 for 8 mm rods. In contrast, the 5 mm CFRP rods achieve the highest average tensile strength of 3,285.16 MPa but exhibit greater variability, reflected by a standard deviation of 210.10 MPa.
The differences in these statistical distributions are attributed primarily to material composition and cross-sectional geometry. Larger-diameter rods contain a higher proportion of carbon fibers in their core, leveraging the superior mechanical properties of carbon fibers compared to glass fibers (Rajak et al., 2021). This composition not only increases tensile strength but also improves consistency by mitigating the effects of localized defects. Furthermore, the broader cross-sectional area of larger rods reduces stress concentrations, enabling a more uniform load distribution. These results underline the critical role of diameter in enhancing the mechanical reliability and structural performance of FRP tendons in engineering applications (Ashrafi et al., 2017; Benmokrane et al., 2017; Feng et al., 2024).
5.3 Implications for design and practical applications
The identification of the Weibull distribution as the most suitable model for tensile strength variability provides a statistically robust basis for improving design reliability and safety factors in practical engineering applications. The derived standardized tensile strength values (Table 11) can be potentially incorporated into design codes as baseline material properties, enabling engineers to account for the inherent variability of FRP rods. By integrating these values into safety factor calculations, engineers can achieve a balance between reliability and material efficiency, ensuring that structures meet performance requirements without unnecessary conservatism.
Furthermore, the statistical modeling of tensile strength variability allows for a more precise understanding of material behavior under load, which is critical for structural applications such as bridges, tunnels, and marine infrastructure. The higher Weibull shape parameters observed in larger-diameter HFRP rods reflect improved consistency, making them particularly suitable for scenarios where predictable performance is essential. These findings also provide a framework for manufacturers to refine quality control processes by targeting variability, thereby ensuring consistent material properties and enhancing the reliability of FRP rods in real-world applications.
6 Goodness-of-fit test for the distribution type of tensile strength
Two tests were used in this investigation to statistically evaluate the test sample. The purpose is to evaluate the goodness-of-fit, or if there was a substantial difference between the sample distribution and a comparator distribution. To achieve that, the statistical significance criterion for this study was established at α = 0.05.
6.1 Kolmogorov-Smirnov and Anderson-Darling tests
The K-S (Kolmogorov-Smirnov) test (Berger and Zhou, 2014) is a nonparametric hypothesis testing method used to test whether a sample data set follows a particular theoretical distribution or to determine whether two sample data sets come from the same distribution. The test was proposed by Andrey Kolmogorov and Nikolai Smirnov in 1933 and 1948, respectively.
The test bases its judgment on the difference between the sample data and the Cumulative Distribution Function (CDF) of the theoretical distribution or compares to distinct sets of sample data. The null hypothesis of the test assumes that the sample data (or two sample data sets) are identical to the theoretical distribution. If the calculated K-S statistic is less than the critical value, the null hypothesis is accepted, i.e., the sample data (or two sample data sets) are considered to be the same as the theoretical distribution. On the contrary, a greater critical value indicates that the sample data (or the two sample data sets) are significantly different from the theoretical distribution. In such cases, the null hypothesis is rejected.
The K-S test is widely used in the field of statistics and data analysis, especially to verify if the data meets specific distributional assumptions or to make distributional comparisons. As a nonparametric method, it does not rely on specific assumptions about the distribution of the data. It is therefore applicable to a wide range of distribution and data types. It should be noted that the K-S test is less sensitive to large samples of data, therefore, requiring special care when applying it to select appropriate sample sizes and theoretical distributions.
The Anderson-Darling (A-D) test (Nelson, 1998) is another effective statistical technique for determining the suitability of a certain probability distribution. Because of its sensitivity to deviations in the distribution’s tails, it is in some situations, more useful than the K-S test. The A-D test highlights differences in the tails by calculating a statistic based on the empirical cumulative distribution function (ECDF) and the given theoretical cumulative distribution function (CDF).
In statistical modeling, the goodness of fit tests, such as the A-D test, are crucial because they support the selection of the probability distribution for the data. Reliability in drawing conclusions and generating forecasts depends on accurate distribution fitting. It guarantees that the statistical models that are employed for reliability analysis, risk assessment, and hypothesis testing are predicated on solid grounds. Overall, Combining the A-D and K-S tests offer a comprehensive approach to assessing the goodness of fit for probability distributions.
6.2 Goodness-of-fit test results
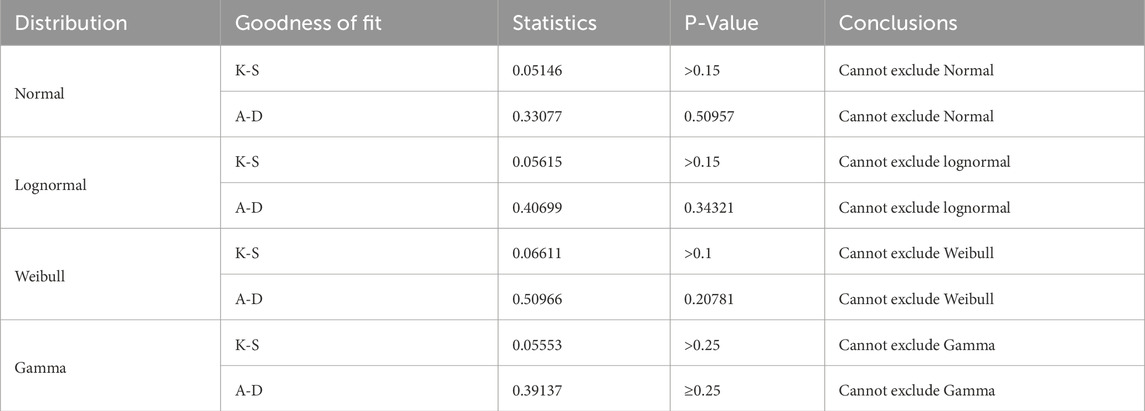
The four cumulative probability distributions for the tensile strength data of 5 mm CFRP rods was performed using Origin-pro software. The results are presented in Table 7. High p-values in these tests indicate that there is insufficient evidence to reject the hypothesis that the data follow the tested distribution, thereby failing to exclude these models as potential fits for the data. For the Normal and Lognormal distributions, both tests indicate a poor fit with low p-values (≤0.01 and significantly smaller), firmly excluding these models from the data. Likewise, the Gamma distribution is decisively excluded based on both K-S (p-value ≤0.005) and A-D (p-value <0.005) tests, which demonstrate significant deviations from the expected model behavior across the dataset. Conversely, the Weibull distribution shows a K-S p-value larger than 0.1, initially suggesting a reasonable fit. However, the A-D test indicates that the Weibull distribution is not suitable to model the data because of a p-value less than 0.01.
Table 8 shows the goodness-of-fit of the Normal, Lognormal, Weibull, and Gamma distribution applied to the tensile strength data of the 6 mm HFRP rods. Both the K-S and A-D tests yield p-values significantly greater than the alpha level of 0.05 for all four distributions. Higher p-values are noticed for Normal and Lognormal distributions with 0.15 in the K-S test, 0.50957 in the A-D test for the former and 0.15 and 0.34321 for the latter. These high p-values suggest that both the Normal and Lognormal models provide reasonable fits for the distribution of tensile strength in 6 mm HFRP, as there is no statistical basis to reject these models. Similarly, the Weibull and Gamma distributions show p-values that exceed 0.1 and 0.25, respectively, in the K-S tests, and 0.20781 and 0.25, respectively, in the A-D tests. Therefore, indicating that these distributions cannot be excluded either. The consistency of high p-values across all four distributions suggests that the tensile strength of the 6 mm HFRP may be sufficiently modeled by a variety of theoretical distributions, reflecting the flexibility or heterogeneity in the physical properties of the material.
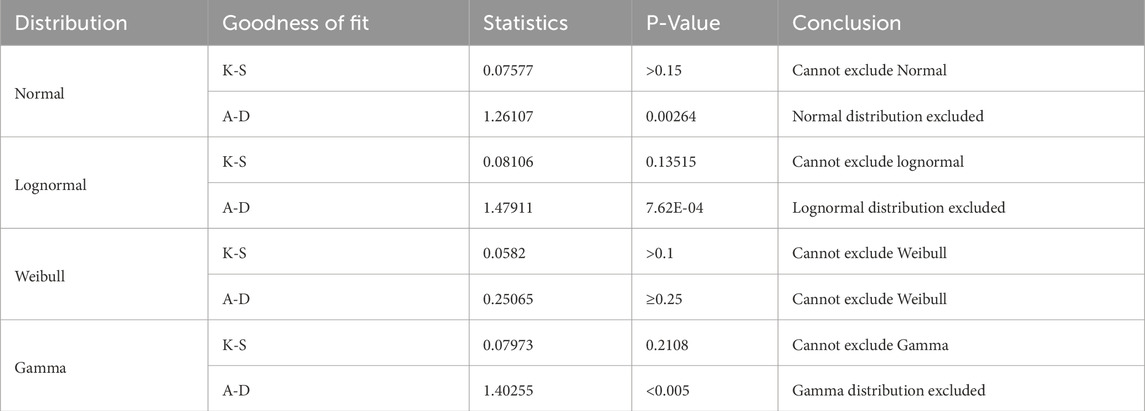
For the 7 mm HFRP rod, the Normal distribution shows a K-S statistic p-value greater than 0.15, suggesting that the model cannot be statistically excluded based on this test result. In fact, the A-D test contradicts this by showing a p-value of 0.00264, leading to the exclusion of the Normal distribution as a suitable model for the data. The Lognormal and Gamma distributions also show mixed results with the K-S test indicating that these models can be used while the A-D test states the opposite. In contrast, the Weibull distribution satisfies the appropriate level of significance for both the K-S test (p-value >0.1) and the A-D test (p-value ≥0.25) implying that it could effectively model the tensile strength distribution for 7 mm HFRP (Table 9).
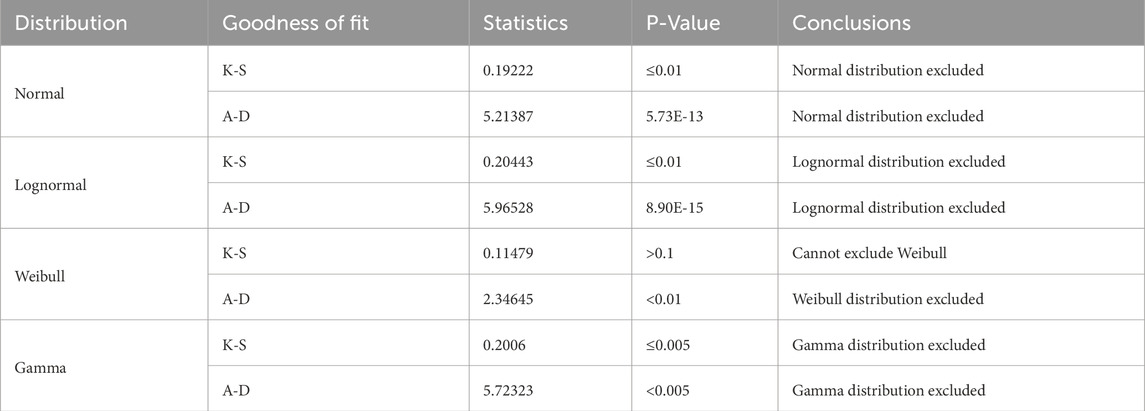
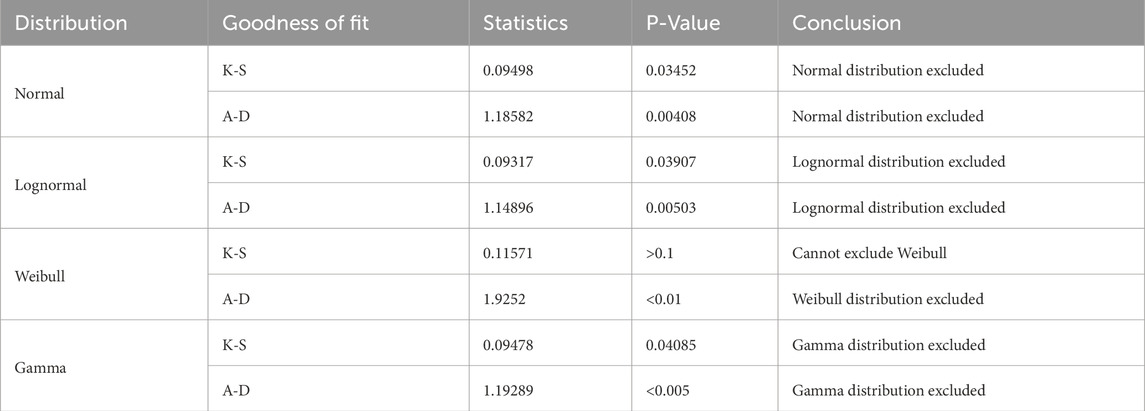
For the 8 mm HFRP rods, the Normal and Lognormal distributions are conclusively excluded as viable models for their tensile strength data set (Table 10). The K-S test results for both distributions show p-values well below the typical significance level (0.05), at 0.03452 for the former and 0.03907 for the latter, indicating a significant difference between the observed data and the model predictions. These exclusions are further corroborated by the A-D test results with even smaller p-values (0.00408 for Normal and 0.00503 for Lognormal). Likewise, the Weibull and Gamma distributions also do not cope well, except in the K-S test for Weibull, which does not exclude it due to a p-value greater than 0.1. However, the A-D test for Weibull, showing a p-value below 0.01, and the results for the Gamma distribution in both tests (p-values at 0.04085 for K-S and less than 0.005 for A-D) lead to their exclusion.
The observed discrepancies between the K-S and A-D tests arise from their differing sensitivities to various parts of the data distribution. The K-S test gives equal weight to all data points, making it more responsive to deviations in the central portion of the distribution but less effective in detecting discrepancies in the tails. In contrast, the A-D test places greater emphasis on the tails, allowing it to capture deviations in the extreme values, which are particularly critical for understanding tensile strength variability. For cases such as the Weibull distribution in the 5 mm CFRP and 8 mm HFRP rods, the A-D test rejected the distribution due to tail deviations, even when the K-S test did not. Given the importance of the tails in assessing material performance, particularly in identifying the weakest points, the A-D test results were prioritized to ensure a more realistic and conservative evaluation of the tensile strength distribution. Among the four distributions analyzed, the Weibull distribution was the most widely accepted, as it was consistently supported by the K-S test and only occasionally rejected by the stricter A-D test due to minor tail deviations.
6.3 Standardized values of strength based on Weibull distribution
In the previous section of this paper, the cumulative probability distribution graphs of all four types of rods have been plotted and the parameters η and β required for the Weibull distribution have been calculated. Based on the estimated values of these parameters, the standardized values of the tensile strengths have been determined with respect to the quantile value ρ. In this paper, a quantile value of ρ = 5% has been chosen by using the uniform theory of reliability (Xin, 2024). The standard value of tensile strength under the Weibull distribution was calculated using this quantile value according to the standard GBT 30022–2013 (Equation 6).
where, xk is the standardized value of tensile strength; μk is the sample mean; σk is the sample standard deviation; n is a constant and n takes the value of 1.645 (Xin, 2024). The calculation results are shown in Table 11.
7 Conclusion
The investigation presented in the paper aimed at assessing the statistical distribution of 396 FRP rods divided into four sets of 103 5 mm CFRP, 100 6 mm HFRP, 93 7 mm HFRP, and 100 8 mm HFRP rods. The hybrid rods were made by adding glass fibers around a core of carbon fiber within the rod. Afterwards, the tensile test was conducted according to the GBT 30022–2013 standard and four distributions, namely, normal, Lognormal, Weibull, and Gamma were used to analyze the experimental results. The employed distribution models were then evaluated with the Kolmogorov-Smirnov (K-S) goodness of fit test. The following conclusions are drawn from this study:
i. The normal and Weibull distributions provide the best fit for the tensile strength data across different specimen sizes, with the Weibull distribution yielding the most reliable predictions due to its higher shape parameters for larger diameters. Likewise, the lognormal distribution suggests that a log transformation stabilizes the variance, providing a robust fit. The gamma distribution captures the increasing variability and complexity in the data, reflecting the broader range of tensile strengths and the reduced predictability with larger specimen sizes. These findings indicate that the choice of distribution can significantly impact the interpretation and modeling of tensile strength data in FRP materials, with each distribution offering unique insights into the material properties.
ii. The tensile strength of all the studied CFRP and HFRP rods conforms to the Weibull distribution.
iii. Based on the Weibull distribution and in accordance with the “ GBT 30022–2013”, the standard tensile strength values with a 95% confidence level were calculated for FRP rods of various diameters. The results are as follows: 2,912.40 MPa for 5 mm diameter CFRP rods, 2,230.98 MPa for 6 mm diameter HFRP rods; 2,385.12 MPa for 7 mm diameter CFRP-GFRP composite rods, and 2,517.44 MPa for 8 mm diameter HFRP rods.
It is important to acknowledge that this study is limited to only four statistical distributions and the exclusion of other mechanical properties besides tensile strength. Therefore, to advance the knowledge of FRP rods, future studies could explore additional distributions, assess other mechanical properties, and include larger, more diverse samples to enhance the robustness and applicability of the findings.
Data availability statement
The raw data supporting the conclusions of this article will be made available by the authors, without undue reservation.
Author contributions
HQ: Conceptualization, Investigation, Methodology, Writing–original draft. TK: Data curation, Formal Analysis, Visualization, Writing–original draft. XL: Data curation, Formal Analysis, Investigation, Writing–review and editing. KS: Formal Analysis, Investigation, Visualization, Writing–original draft. KQ: Supervision, Validation, Writing–review and editing. SN: Validation, Writing–review and editing. TT: Conceptualization, Funding acquisition, Project administration, Supervision, Writing–review and editing.
Funding
The author(s) declare that financial support was received for the research, authorship, and/or publication of this article. The authors gratefully acknowledge the financial support provided by the National Key Research and Development Plan of China (2022YFC3801800) and the National Natural Science Foundation of China (NSFC 52178097).
Conflict of interest
Authors HQ and XL were employed by Guangxi Xingang Communications Investment Group Corporation Ltd. Author KQ was employed by CCCC Highway Bridges National Engineering Research Center Co., Ltd.
The remaining authors declare that the research was conducted in the absence of any commercial or financial relationships that could be construed as a potential conflict of interest.
The author(s) declared that they were an editorial board member of Frontiers, at the time of submission. This had no impact on the peer review process and the final decision.
Generative AI statement
The author(s) declare that no Generative AI was used in the creation of this manuscript.
Publisher’s note
All claims expressed in this article are solely those of the authors and do not necessarily represent those of their affiliated organizations, or those of the publisher, the editors and the reviewers. Any product that may be evaluated in this article, or claim that may be made by its manufacturer, is not guaranteed or endorsed by the publisher.
References
Al-Salloum, Y. A., El-Gamal, S., Almusallam, T. H., Alsayed, S. H., and Aqel, M. (2013). Effect of harsh environmental conditions on the tensile properties of gfrp bars. Compos. Part B Eng. 45, 835–844. doi:10.1016/j.compositesb.2012.05.004
Anni, W., Xiaogang, L., and Qingrui, Y. (2022). Research progress of carbon fiber reinforced polymer composite cable: anchorage system and service performance. J. Build. Struct. 43, 45–54. doi:10.14006/j.jzjgxb.2022.0089
Ashrafi, H., Bazli, M., Najafabadi, E. P., and Vatani Oskouei, A. (2017). The effect of mechanical and thermal properties of frp bars on their tensile performance under elevated temperatures. Constr. Build. Mater. 157, 1001–1010. doi:10.1016/j.conbuildmat.2017.09.160
Bakis, E. C. (2011). “Durability of gfrp reinforcement bars,” in Advances in FRP Composites in Civil Engineering - Proceedings of the 5th International Conference on FRP Composites in Civil Engineering, CICE 2010, China, January 2011, 33–36. doi:10.1007/978-3-642-17487-2_5
Benmokrane, B., Manalo, A., Bouhet, J.-C., Mohamed, K., and Robert, M. (2017). Effects of diameter on the durability of glass fiber–reinforced polymer bars conditioned in alkaline solution. J. Compos. Constr. 21. doi:10.1061/(asce)cc.1943-5614.0000814
Benmokrane, B., Rahman, H., Mukhopadhyaya, P., Masmoudi, R., Chekired, M., Nicole, J.-F., et al. (2000). Use of fibre reinforced polymer reinforcement integrated with fibre optic sensors for concrete bridge deck slab construction. Can. J. Civ. Eng. 27, 928–940. doi:10.1139/l00-029
Berger, V. W., and Zhou, Y. (2014). Kolmogorov–Smirnov test: overview. Wiley statsref: Statistics reference online.
Bin, W., Yongxin, Y., Qingrui, Y., and Biao, L. (2014). Study on the dispersion of tensile strength of domestic carbon fiber composites predicted by composite theory. Fib. Mater., 63–67.
Chang-Huan, K., Xu, X., Chin-Sheng, G., and Jian-Yuan, H. Static behavior of long-span cable-stayed bridges using carbon fiber composite cable. J. Zhejiang Univ. Sci. 2005, 138–143.
Dębski, M., Gołoś, K., and Dębski, D. (2002). Composite joints of aerostructures. Trans. Inst. Aviat. 170, 3–27.
Du, Y., Dong, C., Fu, Z., and Fen, Z. (2024). Study on tensile properties of high-performance adhesive impregnated carbon fiber bundles. J. Railw. Sci. Eng., 1–11. doi:10.19713/j.cnki.43-1423/u.T20240089
Duo, Y., Liu, X.-G., Yue, L., Tafsirojjaman, T., and Sabbrojjaman, M. (2021). Environmental impact on the durability of FRP reinforcing bars. J. Build. Eng. 43, 102909. doi:10.1016/j.jobe.2021.102909
Feng, S.-Z., Zeng, J.-J., Zhao, B., Hao, Z.-H., Zhuge, Y., Zhong, Q.-M., et al. (2024). Accelerated aging tests of large-diameter gfrp bars in alkaline environment. Compos. Part C. Open Access 14, 100486. doi:10.1016/j.jcomc.2024.100486
Gang, D., Jiayu, X., Dazhi, J., and Yang, X. (2014). Study of statistical characteristics of carbon fiber and effects on mechanical properties of carbon fiber composite cores. J. Natl. Univ. Def. Technol. 36, 52–56.
Helbling, C., and Karbhari, V. M. (2007). Tittle of chapter.Durability of Composites in aqueous environments. Elsevier, 31–71.
Heng, Z., Ruoyan, W., Tong, Z., Yang, Z., Aijun, G., and Yu, W. (2024). Study on factors affecting compressive strength of carbon fiber composite. Petrochem. Technol. 53, 525–531.
Hollaway, L. (2010). A review of the present and future utilisation of frp composites in the civil infrastructure with reference to their important in-service properties. Constr. Build. Mater. 24, 2419–2445. doi:10.1016/j.conbuildmat.2010.04.062
Jiang, R., and Murthy, D. N. P. (2011). A study of Weibull shape parameter: properties and significance. Reliab Eng. Syst. Saf. 96, 1619–1626. doi:10.1016/j.ress.2011.09.003
Jiang-Wei, Y., and Zhuan-Yong, Z. (2017). Effect of anodic oxidation treatment on strength dispersion of carbon fiber and its characterization. Synthetic Fiber China 46, 26–29. doi:10.16090/j.cnki.hcxw.2017.01.010
Lajtai, E. (1971). A theoretical and experimental evaluation of the Griffith theory of brittle fracture. Tectonophysics 11, 129–156. doi:10.1016/0040-1951(71)90060-6
Lekou, D., and Philippidis, T. (2008). Mechanical property variability in frp laminates and its effect on failure prediction. Compos. Part B Eng. 39, 1247–1256. doi:10.1016/j.compositesb.2008.01.004
Liu, H., Ka, T. A., Su, N., Zhu, Y., Guan, S., Long, J., et al. (2024). Experimental study of dimensional effects on tensile strength of gfrp bars. Buildings 14, 1205. doi:10.3390/buildings14051205
Liu, Y., Zhang, H.-T., Tafsirojjaman, T., Dogar, A. U. R., Alajarmeh, O., Yue, Q.-R., et al. (2022). A novel technique to improve the compressive strength and ductility of glass fiber reinforced polymer (gfrp) composite bars. Constr. Build. Mater. 326, 126782. doi:10.1016/j.conbuildmat.2022.126782
Liu, Y., Zhang, H. T., Tafsirojjaman, T., Ur Rahman Dogar, A., Yue, Q. R., and Manalo, A. (2023). Compressive behaviour and prediction model for short and slender frp-confined gfrp bars. Constr. Build. Mater. 376, 131059. doi:10.1016/j.conbuildmat.2023.131059
Li-Ye, J., Na, L., Peng, C., Guo-Xin, J., and Xin-Xin, F. (2022). Application and prospect of carbon fiber composite in lightweight. CHINA PLAST. IND. 50, 14–19. doi:10.3969/j.issn.1005-5770.2022.01.004
Naito, K., and Oguma, H. (2017). Tensile properties of novel carbon/glass hybrid thermoplastic composite rods. Compos. Struct. 161, 23–31. doi:10.1016/j.compstruct.2016.11.042
Nelson, L. S. (1998). The anderson-darling test for normality. J. Qual. Technol. 30, 298–299. doi:10.1080/00224065.1998.11979858
Pierce, F. (1926). Tensile tests for cotton yarns: V. The “weakest link” theorems on the strength of long and of composite specimens. J. Text. Inst. 17, T355–T368.
Rajak, D. K., Wagh, P. H., and Linul, E. (2021). Manufacturing technologies of carbon/glass fiber-reinforced polymer composites and their properties: a review. Polymers 13, 3721. doi:10.3390/polym13213721
Shan-Hua, L., Li-Tong, Z., Yong-Sheng, L., Xiao-Wei, Y., Lai-Fei, C., Hui, L., et al. (2012). Strength distribution of hybrid fibers reinforced sic matrix composite. J. Solid Rocket Technol. 35, 410–413.
Stacy, E. W. (1962). A generalization of the gamma distribution. Ann. Math. statistics 33, 1187–1192. doi:10.1214/aoms/1177704481
Sun, J.-H., Su, N.-J., He, Z.-Q., Jia, R.-X., Liu, Y., Lin, F.-K., et al. (2024). Durability of concrete-encapsulated gfrp bars subjected to seawater immersion. Case Stud. Constr. Mater. 20, e03249. doi:10.1016/j.cscm.2024.e03249
Sun, S., Wen, Z., Qu, X., Chen, J., Fang, Y., and Zhengtao, H. (2021). Analysis of different methods for measuring carbon fiber diameter Fiber glass, 31–36.
Tafsirojjaman, T., Dogar, A. U. R., Liu, Y., Manalo, A., and Thambiratnam, D. P. (2022). Performance and design of steel structures reinforced with frp composites: a state-of-the-art review. Eng. Fail. Anal. 138, 106371. doi:10.1016/j.engfailanal.2022.106371
Test Method (2013). Test method for basic mechanical properties of fiber reinforced polymer bar secondary. Journal.
Van Den Einde, L., Zhao, L., and Seible, F. (2003). Use of frp composites in civil structural applications. Constr. Build. Mater. 17, 389–403. doi:10.1016/s0950-0618(03)00040-0
Wang, A., Liu, X., and Qingrui, Y. (2022). Research progress of carbon fiber reinforced polymer composite cable: anchorage system and service performance. J. Build. Struct. 43, 45–54. doi:10.14006/j.jzjgxb.2022.0089
Wang, X., and Wu, Z. (2010). Evaluation of frp and hybrid frp cables for super long-span cable-stayed bridges. Compos. Struct. 92, 2582–2590. doi:10.1016/j.compstruct.2010.01.023
Wei, H., Dong, Z., Wenyu, H., Wenfeng, S., Ziqi, S., and Yubin, C. (2023). The effect of twisting on tensile properties of hifgh modulus carbon fiber impregnated filament. Compos. Mater. Eng., 50–54. doi:10.19936/j.cnki.2096-8000.20231228.007
Weibull, W. A. (1951). A statistical distribution function of wide applicability. J. Appl. Mech. 18, 293–297. doi:10.1115/1.4010337
Wen, D., and Xiangxin, K. (2023). Application progress of carbon fiber reinforced polymer in the field of automotive lightweighting. Trends and Summ., 84–87. doi:10.19466/j.cnki.1674-1986.2023.04.018
Wozniak, P. J., and Li, X. (1990). Goodness—of—fit for the two—parameter Weibull distribution with estimated parameters. J. Stat. Comput. Simul. 34, 133–143. doi:10.1080/00949659008811212
Wu, Y., and Boming, Z. (2010). The discrete analysis on the tensile strength of carbon fiber. Glass Fiber Reinf. Polym. Compos., 29–31.
Wu, Z., Wang, X., and Iwashita, K. (2007). State-of-the-Art of advanced frp applications in civil infrastructure in Japan. Compos. Polycon 37, 1–17.
Wu, Z., Wang, X., Zhao, X., and Noori, M. (2014). State-of-the-Art review of frp composites for major construction with high performance and longevity. Int. J. Sustain. Mater. Struct. Syst. 1, 201–231. doi:10.1504/ijsmss.2014.062757
Xin, L. (2024). Research on fatigue performance of bfrp bars in seawater sand concrete environment. Zengzhou Univ. Level of thesis. doi:10.27466/d.cnki.gzzdu.2021.004515
Xue, S., Li, X., Liu, Y., Smith, S. T., Dogar, A. U. R., Li, X., et al. (2023). A novel winding–wedge anchorage for cfrp straps: conceptual design and performance evaluation. Case Stud. Constr. Mater. 19, e02636. doi:10.1016/j.cscm.2023.e02636
Yalei, H., Qiaoxin, Z., Lieyi, G., Fei, Z., Zicong, L., and Lei, Z. (2024). Effect of resin viscosity on wettability and interfacial bondingp roperties of carbon fiber and epoxy resin. New Chem. Mater. 52, 149–154.
Yang, Y., Li, W., Tang, W., Li, B., and Zhang, D. (2019). Sample sizes based on Weibull distribution and normal distribution for frp tensile coupon test. Materials 12, 126. doi:10.3390/ma12010126
Yang, Y., Wang, X., and Wu, Z. (2015). Experimental study of vibration characteristics of frp cables for long-span cable-stayed bridges. J. Bridge Eng. 20, 04014074. doi:10.1061/(asce)be.1943-5592.0000656
Yi, Y., Guo, S., Li, S., Zillur Rahman, M., Zhou, L., Shi, C., et al. (2021). Effect of alkalinity on the shear performance degradation of basalt fiber-reinforced polymer bars in simulated seawater sea sand concrete environment. Constr. Build. Mater. 299, 123957. doi:10.1016/j.conbuildmat.2021.123957
You, Y.-J., Park, Y.-H., Kim, H.-Y., and Park, J.-S. (2007). Hybrid effect on tensile properties of frp rods with various material compositions. Compos. Struct. 80, 117–122. doi:10.1016/j.compstruct.2006.04.065
Yu, R., and Ping, W. (2013). Study on tensile strength and variation of basalt fibers. J. Nant. Univ. Nat. Sci. Ed. 12, 55–59.
Yufen, W., and Boming, Z. (2010). The discrete analysis on the tensile strength of carbon fiber. Glass Fiber Reinf. Polym. Compos., 29–31.
Yufen, W. (2024). Strength in synthesized mechanical performance of single carbon fiber and dispersion of composite strength. Doctoral thesis.
Zeng, Y., Caspeele, R., Matthys, S., and Taerwe, L. (2024). “Statistical characterization of unidirectional tensile strength of frp composites,” in 13th international symposium on fiber reinforced polymers for reinforced concrete structures (FRPRCS-13). October 15-19, 2017, China, Paper presented at the.
Keywords: fiber reinforced polymer composites, statistical distribution, Weibull, hybrid glass-carbon FRP (HFRP) rod, tensile strength
Citation: Qin H, Ka TA, Li X, Sun K, Qin K, Noor E Khuda S and Tafsirojjaman T (2025) Evaluation of tensile strength variability in fiber reinforced composite rods using statistical distributions. Front. Built Environ. 10:1506743. doi: 10.3389/fbuil.2024.1506743
Received: 06 October 2024; Accepted: 27 December 2024;
Published: 22 January 2025.
Edited by:
Zhoucheng Su, Technology and Research (A∗STAR), SingaporeReviewed by:
Amir Ali Shahmansouri, Washington State University, United StatesAhmed Eltwati, University of Benghazi, Libya
Copyright © 2025 Qin, Ka, Li, Sun, Qin, Noor E Khuda and Tafsirojjaman. This is an open-access article distributed under the terms of the Creative Commons Attribution License (CC BY). The use, distribution or reproduction in other forums is permitted, provided the original author(s) and the copyright owner(s) are credited and that the original publication in this journal is cited, in accordance with accepted academic practice. No use, distribution or reproduction is permitted which does not comply with these terms.
*Correspondence: T. Tafsirojjaman, dGFmc2lyb2pqYW1hbkBhZGVsYWlkZS5lZHUuYXU=
 Hao Qin1
 Thierno Aliou Ka
 Sarkar Noor E Khuda
 T. Tafsirojjaman
