- 1China Railway 24th Bureau Group Nanchang Railway Engineering Co Ltd., Nanchang, China
- 2Lunan High-Speed Railway Co Ltd., Jinan, China
- 3China Construction Foundation and Infrastructure Co Ltd., Jinan, China
- 4School of Civil Engineering, Chongqing University, Chongqing, China
- 5School of Civil Engineering, Yantai University, Yantai, China
The analysis of bridge vibration response under train loads is crucial for the operational safety of railway bridge structures. In this study, a three-dimensional coupled dynamic model of train-track-truss arch bridge is established. Based on the numerical simulation results, the effects of different train axle loads and speeds on the vibration response of the truss arch bridge are analyzed, and the time-history changes of the displacement and stress at critical sections of the bridge are revealed. The results show that: during the train operation, the maximum vertical dynamic stress and maximum vertical displacement are linearly related to the train axle load and speed. The greater the train axle load and speed, the larger the maximum vertical dynamic stress and maximum vertical displacement. The maximum vertical acceleration generated during train operation increases linearly with train speed and exponentially with train axle load. The most unfavorable section occurs at the mid-span of the bridge, where the maximum vertical displacement, maximum vertical dynamic stress, and maximum vertical acceleration are all at their peak. This research has significant implications for engineering safety and operation.
1 Introduction
In recent years, with economic development, high-speed railways have become the primary mode of transportation for people in various countries (Lin et al., 2016). In China, as of the end of 2023, the mileage of high-speed railways has reached 45,000 km, with the length of railway bridges exceeding 11,500 and totaling about 18,800 km, accounting for 45.9% of the total length of high-speed railway lines (Liangjiang, 2022). It can be seen that bridges play a significant role in high-speed railways. As China’s high-speed railway network continues to extend into mountainous areas, there is a growing demand for bridges with greater span capacity. Suspension bridges, truss arch bridges, and other large-span bridge types are gradually increasing in proportion among railway bridges (Levin et al., 2022). Large-span bridges, especially those with truss arch and other complex structural systems, are directly affected by the vibration response of the bridge under train loads, which directly impacts the safety of high-speed railway operation. Therefore, it is necessary to conduct research on the vibration response of network truss arch bridges under train loads in high-speed railway systems.
Currently, a number of scholars have conducted research on the vibration response of railway bridges. The main research methods include field testing (Xia et al., 2003; Zhang et al., 2008; Brunetti et al., 2017; Galvín et al., 2021), theoretical calculations (Cheng et al., 2001; Majka and Hartnett, 2008), and numerical simulation analysis (Liu et al., 2009; Ribeiro et al., 2012; Malveiro et al., 2018). Field testing is the most direct and effective means of studying the vibration response of railway bridges. Currently, field tests on the vibration response of railway bridges mainly focus on aspects such as track structure vibration velocity and acceleration (Zou et al., 2019; Xiaoyan et al., 2022), with relatively fewer studies on the stress and displacement of bridge critical sections. Moreover, field tests are mainly conducted on simple supported beams (Chen et al., 2022), with little involvement in complex bridge types such as network truss arch bridges. Theoretical calculations, compared to field testing, are more convenient and can analyze more operating conditions. However, theoretical calculations are primarily used to study the dynamic response of simple supported beams and cannot be applied to investigate the vibration response of complex structural bridges like network truss arch bridges. Compared to theoretical calculations, numerical simulation, although demanding in terms of computational resources, allows for the study of more complex bridge types. Due to limitations in computational capabilities, early researchers utilized numerical simulation software to investigate the dynamic and vibration responses of railway bridges under train loading (Cheng and Pengzhen, 2018; Xiangrong and Yifan, 2021). With the advancement of computer technology, research efforts have gradually expanded to include complex bridge types such as arch bridges (Pan et al., 2023), cable-stayed bridges (Zhang et al., 2024). However, numerical simulation studies on the dynamic response of suspension truss arch bridges are currently lacking. In summary, current research on the vibration of railway bridges mostly focuses on simply supported beams, with limited attention to the vibration response of network truss arch bridges. Therefore, there is a need to conduct research on the vibration response of network truss arch bridges under high-speed train loading.
This study established a three-dimensional coupled dynamic numerical model of high-speed train-track-network truss arch bridge system and analyzed the impact of different train axle loads and speeds on the vibration response of the network truss arch bridge. It revealed the temporal variations in displacement, stress, acceleration, and other parameters at critical sections of the network truss arch bridge during train operation. The findings of this research provide theoretical data support for the safe operation and improved design of high-speed railway network truss arch bridges.
2 The finite element numerical simulation
2.1 3D train-track-subgrade FEM
Using ABAQUS finite element software, a three-dimensional bridge-track-train coupling dynamic numerical model was established for a certain engineering project, as shown in Figure 1. Figures 2A, B display the side view and the cross-section of the box girder of this model, respectively. Among them, points A and B displace the upper top surface and the lower bottom surface of 1/2 section respectively. Points D and C are located on the top and bottom surfaces of the 1/4 section, respectively. The length and width of the model are 148 m and 19.2 m, respectively. The model mainly includes: concrete box girder, arch ribs, hangers, train track system, and train. The train track system consists of the track, sleepers, track plate, and cushion layer from top to bottom, as shown in Figure 3A. The train primarily includes: train body, bogie, and wheelsets from top to bottom, as shown in Figure 3B. During the modeling process, the train body and bogies are treated as discrete rigid bodies, and the wheelsets are treated as rigid analytical bodies. The hangers are modeled as truss elements, and the arch ribs are made of steel-concrete composite, with a steel pipe on the outside and concrete filled inside. The material properties of the model components are listed in Table 1. It should be noted that the attenuation of materials under the action of fatigue is not considered in the selection of material properties, so the model is suitable for dynamic response analysis of new railway Bridges.

Figure 2. The side view of the model and the cross-section of box girder: (A) Side view; (B) Cross-section view.
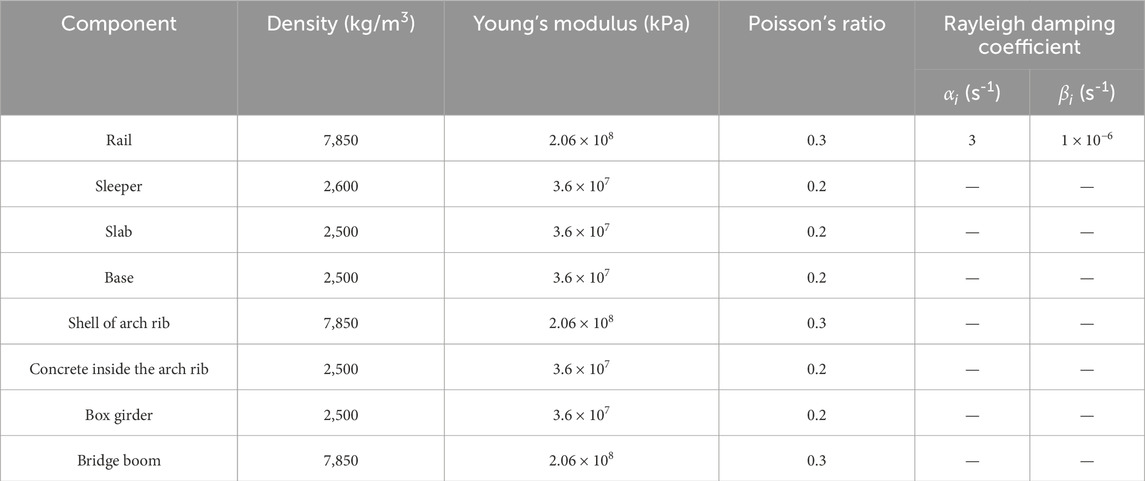
Table 1. Material properties of each component (Xu et al., 2018).
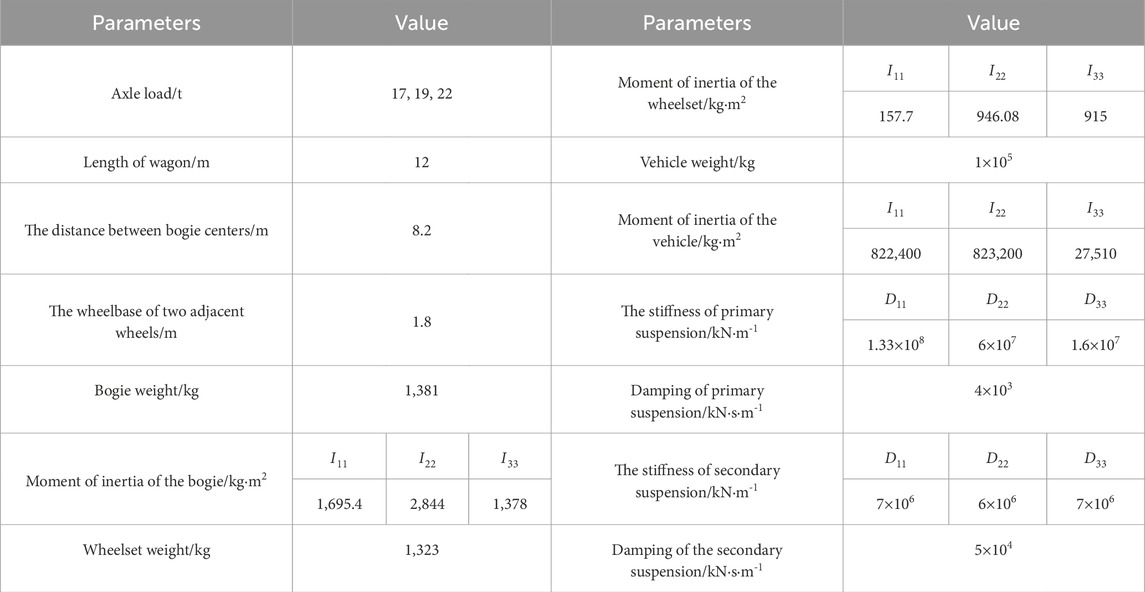
The model includes three analysis steps. In the first analysis step, pre-stress is applied to the hangers, with the pre-stress values for each hanger provided in Table 2. In the second analysis step, gravitational loads are applied to the train. In the third analysis step, forward velocity is applied to the train. Spring connections were set between the vehicle and bogie and between the bogie and wheelset to simulate the primary and secondary suspensions of the train, respectively. Contact was established between the wheelset and track surfaces. The divergent behavior adopted penalty friction, and the friction coefficient was 0.3. Hertz’s nonlinear contact theory defines the wheel–rail normal contact (Tang et al., 2015). Tie constraints were set between the sleeper and slab. A spring connection replaced the fasteners between the track and sleeper; the specific parameters of the train are listed in Table 3.
Restrict the displacements and rotations in all directions at the sections at both ends of the bridge (Cai et al., 2019). The rotation angle of the connector between the track and sleeper was also fixed. The model was segmented to improve the mesh quality, and structural mesh generation technology was adopted. Additionally, in the literature (Liu, 2009), it has been pointed out that the track’s vertical irregularities significantly affect the train–track interaction. Therefore, the model also considers the impact of track irregularities on the dynamic response of the bridge. The method for setting track irregularities is as follows: First, extract the node coordinates of the smooth track from the INP file. Then, modify the track node coordinates using MATLAB based on the high-speed railway track irregularity spectrum. Finally, import the modified node coordinates into the INP file to implement the vertical irregularities of the track.
2.2 Calculation arrangement
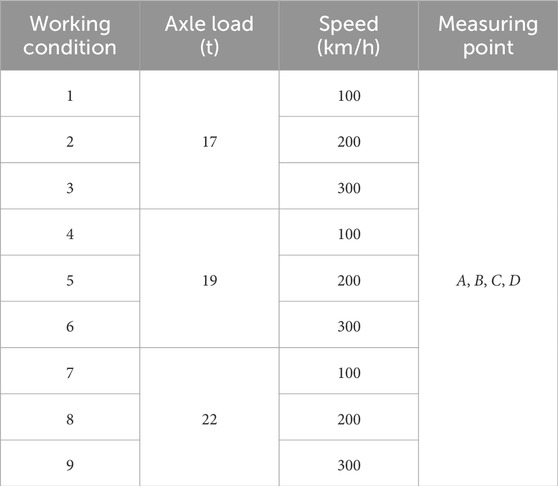
To study the dynamic response caused by trains with different axle loads passing over the bridge at different speeds, three types of axle loads and three speeds are selected. The dynamic responses at four measurement points are compared, as shown in Table 4.
3 Result analysis
3.1 Vertical displacement
(1) The influence of speed on the vertical displacement
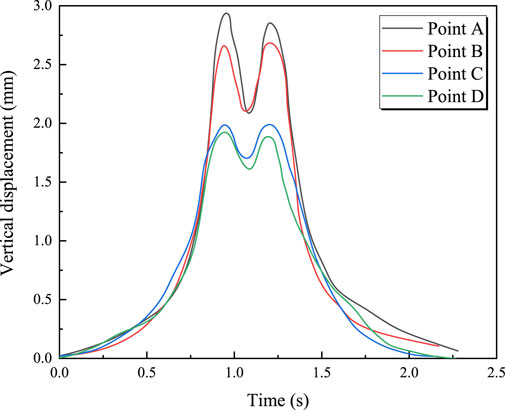
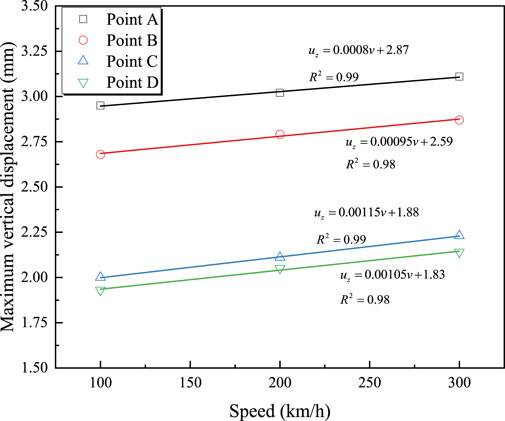
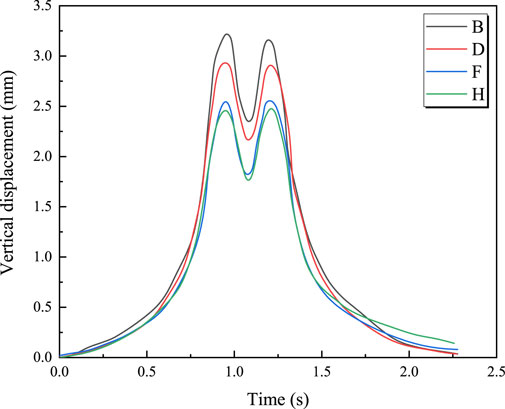
Figure 4 shows the time-history curves of vertical displacement at measurement points A, B, C, and D for a train traveling at 100 km/h with an axle load of 17 t. It can be seen from the figure that the maximum vertical displacement occurs at the mid-span section of the bridge, with a maximum displacement of 2.95 mm. For the same section, the displacement at the top slab of the box girder is greater than that at the bottom slab. Figure 5 illustrates the effect of train speed on the maximum vertical displacement at each measurement point. From Figure 5, it is observed that the vertical displacement at each measurement point increases linearly with the train speed. The relationship between vertical displacement at each measurement point and train speed is described by Equations 1–4.
(2) The influence of axle load on the vertical displacement
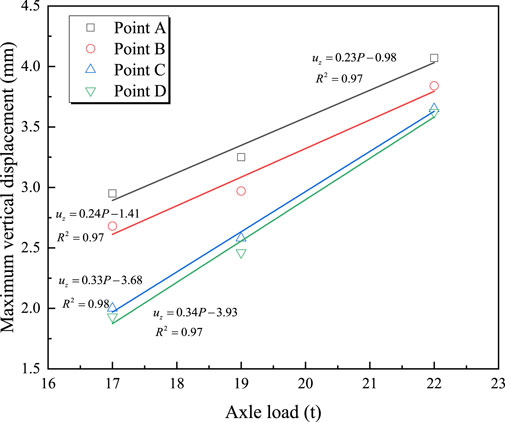
Figure 6 shows the time-history curves of vertical displacement at four measurement points for a train with an axle load of 19 tons traveling at 100 km/h. It can be observed that the vertical displacement at the mid-span section remains the largest. Comparing Figures 4, 6, it can be seen that the vertical displacement time-history curves exhibit a “double-peak” pattern during high-speed train operation, with each peak corresponding to the center position of the train’s bogie. Figure 7 illustrates the relationship between the maximum vertical displacement at each measurement point and axle load during the train’s passage. It can be seen that the maximum vertical displacement at each measurement point is linearly related to the train’s axle load; as the axle load increases, the bridge’s vertical displacement also increases. For example, at measurement point A, the maximum vertical displacement increases from 2.95 mm to 4.5 mm when the axle load increases from 17 tons to 22 tons. The relationship between the train’s axle load and maximum vertical displacement can be represented by Equations 5–8.
3.2 Vertical acceleration
(1) The influence of speed on the vertical acceleration
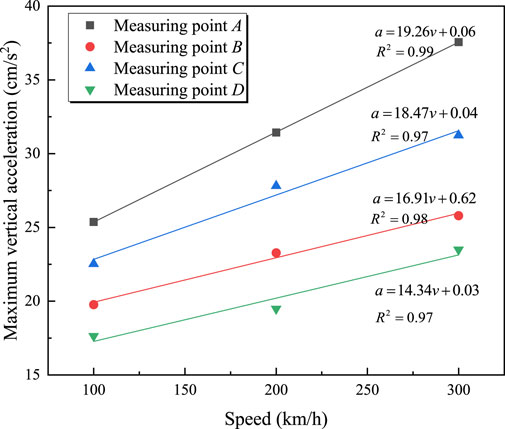
Figure 8 shows the time-history curves of vertical vibration acceleration at each measurement point for a train with an axle load of 17 t traveling over the bridge at 100 km/h. It can be seen that, for the same section, the vibration acceleration of the bridge deck is greater than that at the bridge bottom. During train operation, the vertical acceleration at the mid-span section of the bridge is the highest. Figure 9 displays the maximum vertical acceleration at each measurement point for a 17 t train traveling at different speeds. From Figure 9, it is observed that the vertical acceleration at each measurement point is linearly related to the train speed; the acceleration increases as the train speed increases. The relationship between vertical vibration acceleration and train speed can be described by Equations 9–12.
(2) The influence of axle load on the vertical acceleration
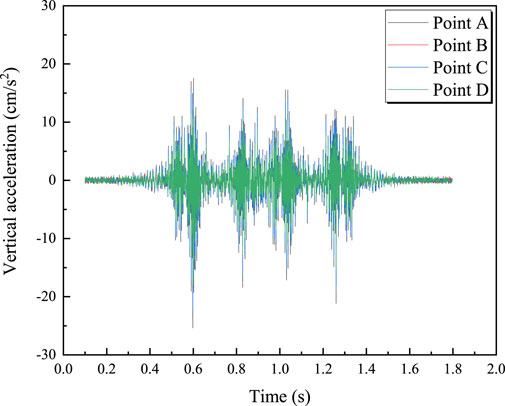
Figure 8. Vertical acceleration time history curve of train with speed of 100 km/h and axle load of 17t.
Figure 10 shows the vertical acceleration at four measurement points for a train with an axle load of 19 tons traveling at 100 km/h. It can be observed that the vertical acceleration is most intense when each wheelset passes the measurement points. Figure 11 illustrates the relationship between the train axle load and the maximum vertical acceleration at each measurement point. From Figure 11, it is clear that the maximum vertical acceleration is proportional to the train axle load; the maximum vertical acceleration increases with the axle load. For example, at measurement point A, the maximum vertical acceleration increases from 25.37 cm/s2 to 38.48 cm/s2 when the axle load increases from 17 tons to 22 tons. The relationship between maximum vertical acceleration and train axle load can be represented by an exponential function, as shown in Equations 13–16.
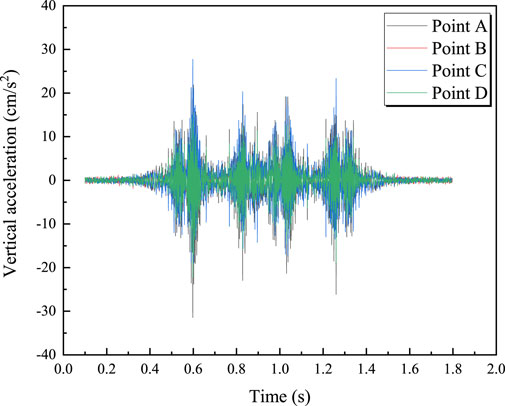
Figure 10. Vertical acceleration time history curve of train with speed of 100 km/h and axle load of 19t.
3.3 Vertical dynamic stress
(1) The influence of speed on the Vertical dynamic stress
Figure 12 shows the time-history curve of vertical dynamic stress for a train with an axle load of 17 t traveling at 100 km/h. It can be observed that, during train operation, the dynamic stress at the bridge deck is relatively consistent across both the mid-span section and other sections. The same applies to the dynamic stress at the bottom slab of the bridge. This indicates that the dynamic stress at measurement points located on the same horizontal plane does not vary significantly as the train passes over the bridge. Figure 13 shows the relationship between the maximum vertical dynamic stress and train speed. It can be seen from the figure that the maximum vertical dynamic stress increases linearly with train speed; as the train speed increases, the maximum vertical dynamic stress also increases. For example, at measurement point A, the vertical dynamic stress increases from 12.108 kPa to 22.584 kPa when the train speed increases from 100 km/h to 300 km/h. The relationship between the maximum vertical dynamic stress at the bridge deck and bottom slab and the train speed is given by Equations 17, 18, respectively.
(2) The influence of axle load on the vertical dynamic stress
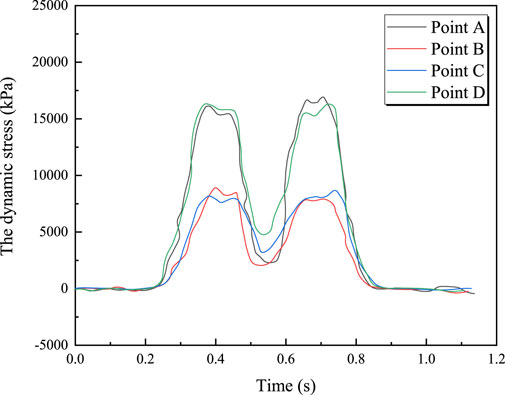
Figure 12. Vertical Dynamic stress time history curve of train with speed of 100 km/h and axle load of 17t.
Figure 14 shows the time-history curves of vertical dynamic stress at each measurement point for a train with an axle load of 19 t traveling at 100 km/h. The pattern is similar to that in Figure 12 and will not be repeated here. Figure 15 illustrates the relationship between the maximum vertical dynamic stress and train axle load. It can be seen from Figure 15 that the maximum vertical dynamic stress is linearly related to the train axle load; the maximum vertical dynamic stress increases with the axle load. For example, at measurement point A, the maximum vertical dynamic stress increases from 12.108 kPa to 24.45 kPa when the axle load increases from 17 tons to 22 tons. The relationship between the maximum vertical dynamic stress at the bridge deck and bottom slab and the train axle load is given by Equations 19, 20, respectively.
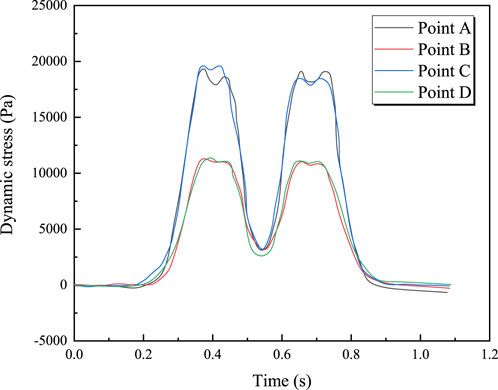
Figure 14. Vertical Dynamic stress time history curve of train with speed of 100 km/h and axle load of 19 t.
4 Dynamic response prediction model
Based on the above analysis, it is observed that the vertical displacement, vertical acceleration, and vertical dynamic stress at point A are the highest when the train passes over the bridge. Therefore, when establishing the bridge dynamic response prediction model, the analysis focuses only on the dynamic response at point A. Table 5 lists the maximum vertical displacement, acceleration, and dynamic stress at point A for different train axle loads and speeds. From Table 5, it can be seen that the maximum vertical displacement, acceleration, and dynamic stress at point A exhibit a clear linear relationship with the train axle load and speed. Therefore, a multiple linear regression approach is used to determine the relationship between the maximum vertical displacement, acceleration, and dynamic stress at point A and the train axle load and speed. The fitting results are given by Equations 21–23, with the coefficients of determination (R2) for Equations 21–23 being 0.99, 0.98, and 0.99, respectively. This indicates a high degree of fit, and Equations 21–23 can be used to calculate the dynamic response at point A.

Table 5. Maximum vertical displacement, acceleration, and dynamic stress at measurement point A for different train axle loads and speeds.
5 Conclusion
Based on a certain engineering project, this study established a three-dimensional coupling dynamic numerical model of a train-track-mesh-hanger arch bridge. It calculated the vertical displacement, vertical acceleration, and vertical dynamic stress at various locations on the bridge caused by trains with different axle loads and speeds, and developed a prediction model for the dynamic response at the most unfavorable location on the bridge. The specific conclusions are as follows:
(1) The maximum vertical dynamic stress and maximum vertical displacement are linearly related to the train axle load and speed. The greater the train axle load and speed, the larger the maximum vertical dynamic stress and maximum vertical displacement.
(2) The maximum vertical acceleration generated during train operation increases linearly with train speed and exponentially with train axle load.
(3) During train operation, the most unfavorable section of the bridge is at the mid-span section. A multiple linear regression approach can be used to determine the relationship between the dynamic response at the most unfavorable section and the train axle load and speed.
Data availability statement
The original contributions presented in the study are included in the article/supplementary material, further inquiries can be directed to the corresponding author.
Author contributions
YZ: Formal Analysis, Methodology, Software, Writing–original draft, Writing–review and editing. ZL: Investigation, Supervision, Writing–original draft. CT: Data curation, Supervision, Writing–review and editing. XZ: Conceptualization, Investigation, Software, Writing–original draft. BL: Funding acquisition, Investigation, Software, Writing–review and editing.
Funding
The author(s) declare that no financial support was received for the research, authorship, and/or publication of this article.
Conflict of interest
Author YZ was employed by China Railway 24th Bureau Group Nanchang Railway Engineering Co Ltd. Author ZL was employed by Lunan High-Speed Railway Co Ltd. Author CT was employed by China Construction Foundation and Infrastructure Co Ltd.
The remaining authors declare that the research was conducted in the absence of any commercial or financial relationships that could be construed as a potential conflict of interest.
Publisher’s note
All claims expressed in this article are solely those of the authors and do not necessarily represent those of their affiliated organizations, or those of the publisher, the editors and the reviewers. Any product that may be evaluated in this article, or claim that may be made by its manufacturer, is not guaranteed or endorsed by the publisher.
References
Brunetti, M., Ciambella, J., Evangelista, L., Lofrano, E., Paolone, A., and Vittozzi, A. (2017). Experimental results in damping evaluation of a high-speed railway bridge. Procedia Eng. 199, 3015–3020. doi:10.1016/j.proeng.2017.09.402
Cai, C., He, Q., Zhu, S., Zhai, W., and Wang, M. (2019). Dynamic interaction of suspension-type monorail vehicle and bridge: numerical simulation and experiment. Mech. Syst. Signal Process. 118, 388–407. doi:10.1016/j.ymssp.2018.08.062
Chen, L. kun, Jiang, L. zhong, Li, R., Li, Q., Zhang, M., Zhang, N., et al. (2022). A feasible vibration measurement and active control method of reinforced concrete lightweight pier railway bridges for heavy-haul monorail trains. Eur. J. Environ. Civ. Eng. 26, 360–378. doi:10.1080/19648189.2019.1663267
Cheng, S., and Pengzhen, L. (2018). Vertical dynamic response research ofexisting railway bridge under double machine heavy haul traction. J. Railw. Sci. Eng. 15, 956–961. doi:10.19713/j.cnki.43-1423/u.2018.04.018
Cheng, Y. S., Au, F. T. K., and Cheung, Y. K. (2001). Vibration of railway bridges under a moving train by using bridge-track-vehicle element. Eng. Struct. 23, 1597–1606. doi:10.1016/S0141-0296(01)00058-X
Galvín, P., Romero, A., Moliner, E., De Roeck, G., and Martínez-Rodrigo, M. D. (2021). On the dynamic characterisation of railway bridges through experimental testing. Eng. Struct. 226, 111261. doi:10.1016/j.engstruct.2020.111261
Levin, F. C., Back, M., Vogt, S., and Cudmani, R. (2022). Experiment-based estimation of the settlement potential due to dynamic loads from heavy vehicle traffic on the A 44n motorway built on the dump of the Garzweiler opencast mine. Transp. Geotech. 32, 100674. doi:10.1016/j.trgeo.2021.100674
Liangjiang, C. (2022). Achievements and prospects of railway bridge construction technology in China. High. SPEED Railw. Technol. doi:10.12098/j.issn.1674-8247.2022.04.001
Lin, W., Yoda, T., and Taniguchi, N. (2016). Effects of bridge accessories in steel–concrete composite railway bridges in service condition. J. Bridg. Eng. 21, 1–9. doi:10.1061/(asce)be.1943-5592.0000809
Liu, K., Reynders, E., De Roeck, G., and Lombaert, G. (2009). Experimental and numerical analysis of a composite bridge for high-speed trains. J. Sound. Vib. 320, 201–220. doi:10.1016/j.jsv.2008.07.010
Majka, M., and Hartnett, M. (2008). Effects of speed, load and damping on the dynamic response of railway bridges and vehicles. Comput. Struct. 86, 556–572. doi:10.1016/j.compstruc.2007.05.002
Malveiro, J., Ribeiro, D., Sousa, C., and Calçada, R. (2018). Model updating of a dynamic model of a composite steel-concrete railway viaduct based on experimental tests. Eng. Struct. 164, 40–52. doi:10.1016/j.engstruct.2018.02.057
Pan, J., Wang, X., Huang, K., and Wang, W. (2023). Symmetrically construction monitoring analysis and completed state evaluation of a tied steel box arch bridge based on finite element method. Symmetry (Basel) 15, 932. doi:10.3390/sym15040932
Ribeiro, D., Calçada, R., Delgado, R., Brehm, M., and Zabel, V. (2012). Finite element model updating of a bowstring-arch railway bridge based on experimental modal parameters. Eng. Struct. 40, 413–435. doi:10.1016/j.engstruct.2012.03.013
Tang, L. S., Chen, H. K., Sang, H. T., Zhang, S. Y., and Zhang, J. Y. (2015). Determination of traffic-load-influenced depths in clayey subsoil based on the shakedown concept. Soil Dyn. Earthq. Eng. 77, 182–191. doi:10.1016/j.soildyn.2015.05.009
Xia, H., De Roeck, G., Zhang, N., and Maeck, J. (2003). Experimental analysis of a high-speed railway bridge under Thalys trains. J. Sound. Vib. 268, 103–113. doi:10.1016/S0022-460X(03)00202-5
Xiangrong, G., and Yifan, X. (2021). Influence of aerodynamic interference of parallel adjacent bridges on coupled vibration of train-bridge system. J. Railw. Sci. Eng. 18, 162–171. doi:10.19713/j.cnki.43
Xiaoyan, L., Lingxiao, W., Qingjie, L., Cui, W., Xuejun, Y., and Xinya, Z. (2022). Field test on structural vibration, noise and environmental vibration of high-speed railway bridges. J. China Railw. Soc. 44, 121–128.
Xu, F., Yang, Q., Liu, W., Leng, W., Nie, R., and Mei, H. (2018). Dynamic stress of subgrade bed layers subjected to train vehicles with large axle loads. Shock Vib. 2018. doi:10.1155/2018/2916096
Zhang, N., Xia, H., and Guo, W. (2008). Vehicle-bridge interaction analysis under high-speed trains. J. Sound. Vib. 309, 407–425. doi:10.1016/j.jsv.2007.07.064
Zhang, Q., Cai, X., Wang, T., Zhang, Y., and Wang, C. (2024). Aerodynamic performance and dynamic response of high-speed trains passing by each other on cable-stayed bridge under crosswind. J. Wind Eng. Ind. Aerodyn. 247, 105701. doi:10.1016/j.jweia.2024.105701
Keywords: high-speed railways, truss arch bridges, train-bridge coupled vibration, numerical simulation, vibration response analysis
Citation: Zou Y, Liu Z, Tian C, Zhang X and Liu B (2024) Dynamic response analysis of concrete filled steel tube tied arch bridge on a slab foundation under moving train load. Front. Built Environ. 10:1498790. doi: 10.3389/fbuil.2024.1498790
Received: 19 September 2024; Accepted: 31 October 2024;
Published: 15 November 2024.
Edited by:
Yifei Sun, Taiyuan University of Technology, ChinaCopyright © 2024 Zou, Liu, Tian, Zhang and Liu. This is an open-access article distributed under the terms of the Creative Commons Attribution License (CC BY). The use, distribution or reproduction in other forums is permitted, provided the original author(s) and the copyright owner(s) are credited and that the original publication in this journal is cited, in accordance with accepted academic practice. No use, distribution or reproduction is permitted which does not comply with these terms.
*Correspondence: Bo Liu, ODUyMjg1MTY5QHFxLmNvbQ==
 Yongnian Zou1
 Bo Liu


