- Department of Civil Engineering, Sharda University, Greater Noida, India
This paper presents a novel approach for assessing liquefaction potential by integrating Dynamic Cone Penetration Test (DCPT) data with advanced machine learning (ML) techniques. DCPT offers a cost-effective, rapid, and adaptable method for evaluating soil resistance, making it suitable for liquefaction assessment across diverse soil conditions. This study establishes a threshold criterion based on the ratio of the penetration rate to the dynamic resistance (e/qd), where values exceeding four indicate high liquefaction susceptibility. ML models, including Support Vector Machine (SVM) optimized with Particle Swarm Optimization (PSO), Grey Wolf Optimizer (GWO), Genetic Algorithm (GA), and Firefly Algorithm (FA), were employed to predict the e/qd ratio using key geotechnical parameters, such as fine content, peak ground acceleration, reduction factor, and penetration rate. The SVM-PSO model demonstrated superior performance, with high R2 values of 0.999 and 0.989 in the training and testing phases, respectively. The proposed methodology offers a sustainable and accurate approach for liquefaction assessment, reducing the environmental impact of geotechnical investigations, while ensuring reliable predictions. This study bridges the gap between field testing and advanced computational techniques, providing a powerful tool for geotechnical engineers to assess liquefaction risks and design resilient infrastructures.
1 Introduction
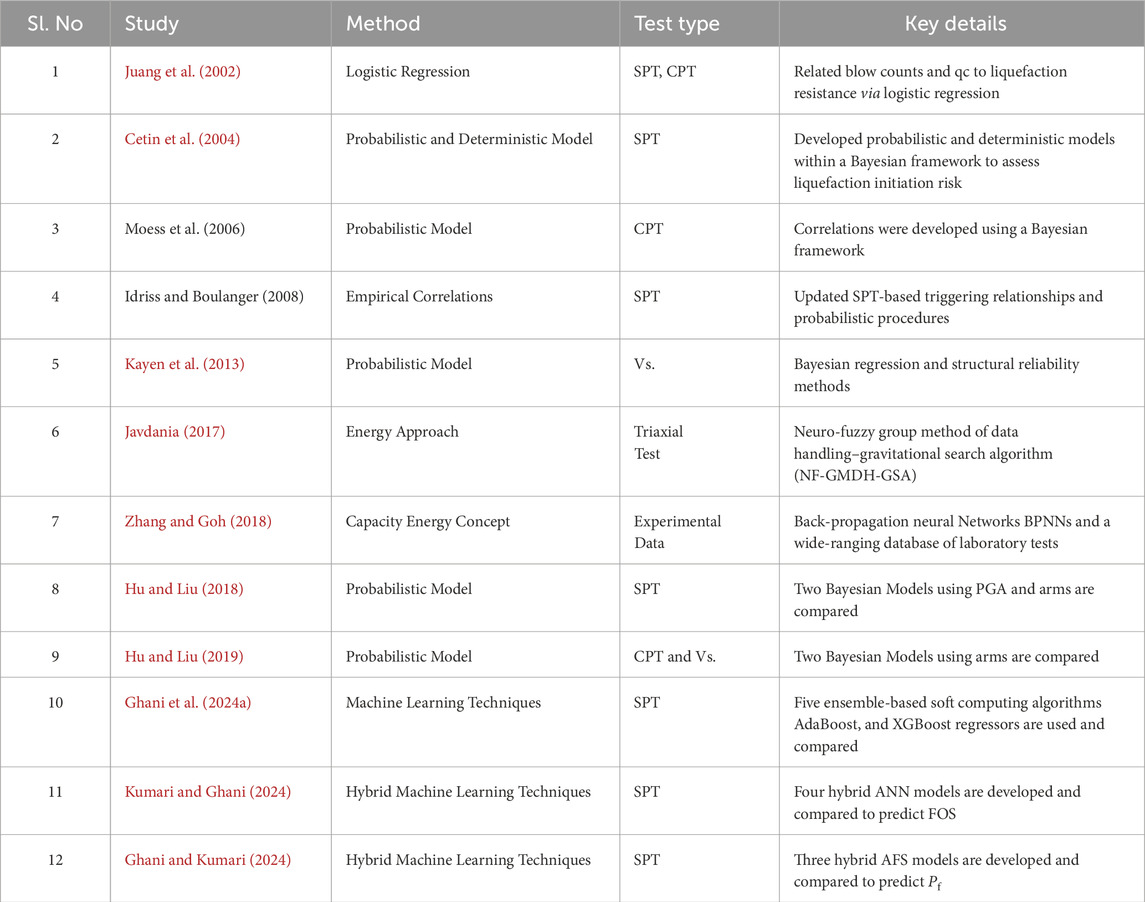
Liquefaction poses a significant threat to infrastructure even in low-magnitude earthquakes. Soil liquefaction susceptibility was assessed through a multifaceted approach, considering historical earthquake occurrences, the geological origin of the soil deposit, its compositional makeup (grain size distribution and presence of fines), and the current state of the soil (density, saturation level). Furthermore, the evaluation of liquefaction potential assessment (LPA) helps engineers and designers mitigate ground conditions in the case of seismic hazards. A clear understanding of liquefaction susceptibility and the minimum magnitude threshold for triggering are crucial for comprehensively induced seismic risk assessments (Green et al., 2019). There are several factors that affect liquefaction, such as soil type, groundwater table, relative density, and particle size distribution, which, in progression above their permissible limits, cause settlements, subsidence, and lateral spreads, making the structure unable to withstand its capabilities. (Ghani and Kumari, 2021b). The liquefaction potential of soil can be evaluated using various techniques. One commonly used approach is the Standard Penetration Test-based empirical procedures, such as the Seed and Idriss method (Seed and Idriss, 1971). These methods consider factors such as soil type, fines content, and effective overburden stress to estimate the likelihood of liquefaction occurrence. Seed et al. (1983) established a method for assessing the liquefaction potential of sandy soils by using field data from various sites with known liquefaction during earthquakes in different countries. The results of this study were extended to earthquakes of other magnitudes by incorporating a magnitude scaling factor when evaluating the cyclic stress ratio induced at a specific depth. This procedure has undergone significant modifications to improve its effectiveness and accuracy (Youd and Idriss, 2001; Umar et al., 2018; Ghani and Kumari, 2021a). By incorporating several refinements, the procedure delivers improved effectiveness and competence. Several researchers have mainly relied on empirical correlations and conservative statistical analyses derived from field tests. Juang et al. (2002) leveraged logistic regression to assess the association of the Standard Penetration Test (SPT) blow counts and Cone Penetration Test (CPT) tip resistance (qc) with liquefaction resistance. Based on this concept, Cetin et al. (2004) developed a framework that combines probabilistic and deterministic models using a Bayesian approach with SPT data. Moss et al. (2006) applied a statistical approach to Bayesian frameworks to incorporate cone penetration test (CPT) data for liquefaction assessment. Idriss and Boulanger (2006) further advanced this field by refining SPT-based triggering relationships and probabilistic approaches. These advancements have set up a foundation for incorporating probabilistic methods with traditional in situ testing methods, leading to more precise liquefaction potential evaluations.
An analysis of the liquefaction potential assessment methods listed in Table 1 reveals a significant shift in focus from empirical correlations to more sophisticated probabilistic and machine learning (ML) based methods. The commitment of the geotechnical community to enhancing the accuracy, efficiency, and adaptability of liquefaction prediction techniques is evident in the transition from empirical correlations to more advanced methods.
Liquefaction has been extensively studied using various in situ tests and empirical correlations. For decades, geotechnical engineers have relied on established in situ testing methods, such as the SPT and CPT, to evaluate the susceptibility of soil to liquefaction during earthquakes (Cetin et al., 2004; Idriss and Boulanger, 2006; Moss et al., 2006). However, these methods have limitations such as being time-consuming, costly, and sometimes overly conservative in their estimations (Ghani and Kumari, 2022a; Kumar, Samui, and Burman, 2023). As research in this field has evolved, so have the computational methods employed, with researchers increasingly utilizing more advanced techniques. Kayen et al. (2013) applied Bayesian regression and structural reliability methods to shear wave velocity (Vs.) data, thereby expanding the toolkit for liquefaction assessment. The introduction of ML has led to a significant shift. Javdanian, (2017) employed a neuro-fuzzy group method with a gravitational search algorithm for the triaxial tests. Zhang and Goh (2018) utilized backpropagation neural networks with a comprehensive laboratory database. Hu and Liu (2018, 2019) compared Bayesian models using peak ground acceleration (PGA), SPT, CPT, and Vs. data. Most recently, Ghani et al. (2023) showed the power of ensemble-based soft computing algorithms such as AdaBoost and XGBoost, integrating SPT, PGA, and fine content (FC) data. The integration of ML algorithms with geotechnical data has shown promising results. Ghani et al. (2022) utilized artificial neural networks (SVM) coupled with metaheuristic algorithms to predict liquefaction behavior in the Indo-Gangetic region, achieving high accuracy. Similarly, Kumar, Samui, Burman, et al. (2023) employed various deep learning models, with an (RNN) demonstrating superior performance in predicting liquefaction potential. This progression highlights the growing recognition of the potential of the geotechnical community to capture complex soil behaviors and improve liquefaction predictions.
Considering the aforementioned literature, the present research introduces a novel methodology for evaluating liquefaction potential by integrating field measurements from the Dynamic Cone Penetration Test (DCPT) with advanced ML techniques. This innovative framework addresses a significant gap in the existing literature by effectively combining a cost-efficient and expeditious in situ testing method, namely, DCPT, with state-of-the-art computational tools. By leveraging the strengths of both field data and ML algorithms, this study investigates the potential to substantially enhance the accuracy, efficiency, and adaptability of liquefaction assessments across diverse soil conditions, with the aim of revolutionizing the liquefaction potential evaluation by synergizing the DCPT with cutting-edge ML algorithms. This approach not only capitalizes on the DCPT’s advantages of being cost-effective and rapid but also harnesses the power of advanced computational techniques to process and interpret field data. In doing so, it addresses the limitations of traditional methods and paves the way for more comprehensive and nuanced liquefaction assessments. The integration of ML allows for the identification of complex patterns and relationships within DCPT data that may not be apparent through conventional analysis methods. Furthermore, this innovative framework has the potential to significantly improve the adaptability of liquefaction assessments under a wide range of soil conditions. ML algorithms can be trained on diverse datasets, enabling them to recognize and account for site-specific factors that influence liquefaction susceptibility. This adaptability is particularly valuable in geotechnical engineering, where soil properties can vary greatly even within small geographic areas. By combining the simplicity and practicality of DCPT with the sophisticated analytical capabilities of machine learning, this study aims to provide geotechnical engineers with a powerful tool that enhances both the accuracy and efficiency of liquefaction potential evaluations, ultimately contributing to more reliable and cost-effective geotechnical designs and risk assessments.
2 Research significance
The significance of this research lies in its innovative approach to address the challenges of earthquake-induced liquefaction. Conventional methods for liquefaction assessment, although effective, are often time-consuming, costly, and conservative in their predictions. By utilizing the DCPT, a time-efficient and adaptable test method, in conjunction with advanced ML models, this study provides a more responsive and accurate tool for assessing liquefaction potential. This approach not only enhances seismic resilience but also promotes sustainable infrastructure practices by reducing costs and improving resource efficiency. The capacity to predict liquefaction risk with greater accuracy enables engineers to design structures that are better prepared for seismic events, ultimately contributing to safer and more resilient urban environments. The integration of ML with geotechnical testing methods represents a significant advancement in the field of earthquake engineering. This novel approach has the potential to revolutionize the assessment and mitigation of liquefaction risks in seismic-prone areas. Furthermore, the improved accuracy and efficiency of this method could lead to more targeted and cost-effective soil improvement strategies that enhance overall urban resilience.
3 Methodology
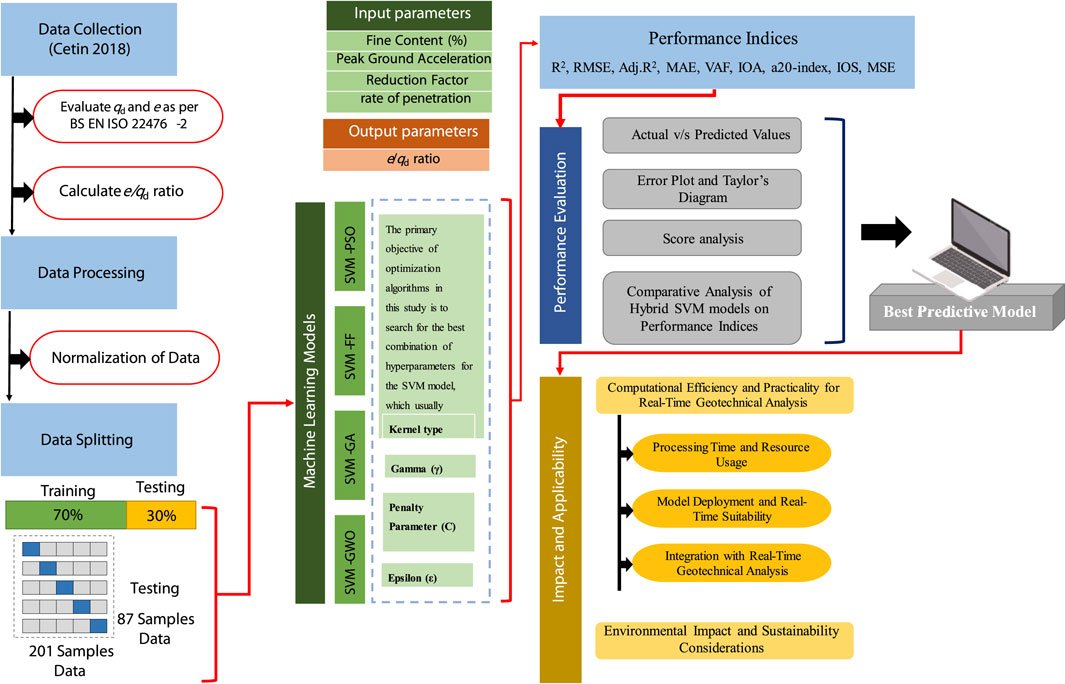
This section explores the methods for evaluating liquefaction potential. Primarily, the simplified approach proposed by Idriss and Boulanger (2006) that utilizes SPT-N values was discussed, followed by an examination of liquefaction assessment techniques based on DCPT analysis. Furthermore, the details and functionality of the computational model are discussed. Finally, the section concludes with a discussion of the data processing procedures and various statistical parameters used to evaluate the effectiveness of these computational analyses. A comprehensive description of the adopted methodology is shown in Figure 1. Essential geotechnical data from Cetin et al. (2018) were collected. The rate of penetration (e) and dynamic resistance (qd) of the soil were then assessed using these data through the DCPT according to the guidelines outlined in BS EN ISO 22476-2. Subsequently, to determine liquefaction susceptibility, the critical e/qd ratio was calculated. Soil liquefaction susceptibility is classified as high or low, depending on the e/qd ratio. Additional geotechnical characteristics, including FC (%), PGA, rd, and the previously determined e and e/qd ratios, were used to conduct further comparisons. The ML models were ultimately used to confirm the entire evaluation procedure, ensuring the accuracy and reliability of the liquefaction susceptibility assessment. To ensure consistent scaling, the data were normalized before being input to the hybrid model. To select the optimal predictive model, the performance indicators, scores, and scatter plot visualization were compared.
A reliable instrument for evaluating the risk of soil liquefaction is provided by this structured methodology, which successfully combines cutting-edge computational modelling approaches with conventional geotechnical testing methods.
3.1 Simplified procedure using SPT-N values: Idriss and Boulanger approach
This method utilizes a ratio between two key parameters: the cyclic resistance ratio (CRR), which reflects the soil’s ability to resist liquefaction, and the cyclic stress ratio (CSR), which represents the level of stress imposed by earthquake shaking and is expressed as
Youd and Perkins, 1978 introduced a factor of 0.65 to convert the irregular earthquake load into a comparable uniform stress cycle shown in Equation 1. The reduction coefficient (rd) is not constant and varies depending on the depth z Equations 2–4 by Idriss (1999).
where σvo represents the total effective overburden pressure, σ′vo represents the effective vertical overburden stress at depth z, amax represents the peak ground acceleration in the horizontal direction, MSF represents the magnitude scaling factor that provides the combinational effect of relative amplitude and the number of load cycles Equations 5 and 6 for sand and clay, respectively. Kσ represents the correction factor for the effective overburden, as shown in Equations 7, 8.
The mathematical Expression to evaluate CRR in Equation 9 generated from the corrected blow count (N1)60 is as follows:
SPT-N values are tuned to an equivalent clean sand value using Equation 10 comprised of
where
Finally, in Equation 13, the expression used to evaluate the safety factor of safety (FOS) against liquefaction is described as follows: if the safety factor is less than 1, there is a liquefaction potential. If the safety factor is greater than one, there is no liquefaction potential.
3.2 Dynamic cone penetration test
The current study distinguishes itself by focusing on DCPT, a method that is less commonly used in liquefaction studies but offers significant advantages over traditional tests. DCPT is more time-efficient, cost-effective, and adaptable to various soil types (Benz Navarrete et al., 2022; Park G. et al., 2023). Its dynamic nature and real-time data-collection capabilities make it particularly suitable for rapid and accurate liquefaction assessments (Duan et al., 2023a). The adaption of susceptibility studies based on DCPT is mainly due to its dynamic and adaptable characteristics, as it stands out as a valuable tool in the geotechnical engineer’s toolkit. Notably, one of its primary advantages over traditional SPT is its superior time and cost efficiency. DCPT offers a remarkable reduction in testing time owing to its rapid deployment capabilities (Benz Navarrete et al., 2022). Unlike the SPT, which involves a slower and more labor-intensive process, the dynamic penetration of DCPT into the soil allows for a quicker assessment of soil strength. This time efficiency is particularly advantageous in conditions where swift decision making is crucial, such as liquefaction estimation.
Moreover, DCPT requires minimal drilling and presents a significant cost-saving advantage. The direct dynamic penetration of the cone into the soil eliminates the need for extensive borehole preparation, reduces associated costs, and minimizes the environmental impact. This makes the DCPT a more economical alternative for liquefaction assessment, contributing to the overall project cost-effectiveness (Park I. et al., 2023).
The real-time data-collection capability of the DCPT further enhances its appeal. This feature allows for on-site analysis, enabling immediate decision making based on accurate and up-to-date information. In scenarios where time-sensitive projects demand rapid liquefaction assessments, DCPT proves to be an invaluable asset (Duan et al., 2023b). The simplified equipment setup and ease of operation of the DCPT also translate into reduced equipment and personnel costs. With a smaller team and more economical equipment requirements compared with the SPT, the DCPT offers an attractive cost-effective solution for geotechnical investigations. Additionally, the DCPT demonstrated enhanced accuracy and consistency in data collection (Park G. et al., 2023). Its dynamic nature generates more reliable and repeatable results compared to the SPT and CPT, contributing to a more precise characterization of soil behavior. Moreover, the adaptability of the DCPT to various soil types further underscores its versatility and applicability in diverse geological settings. This heightened accuracy and wide range of soil adaptability improve the reliability of the results, making the DCPT a preferred choice for liquefaction assessments. In essence, by capitalizing on the advantages presented above by the DCPT, this study aims to revolutionize the methodology for estimating liquefaction potential in soils.
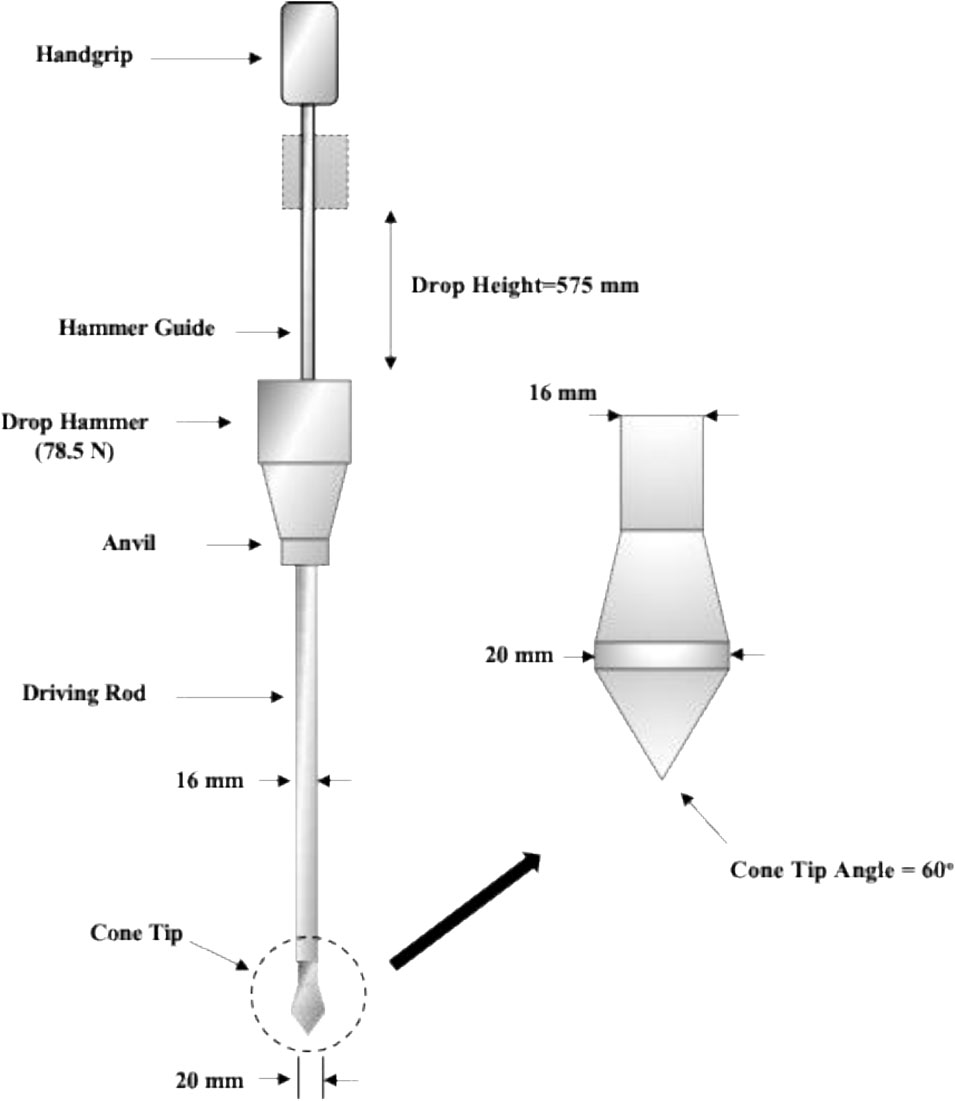
The DCPT was designed to penetrate soils up to a depth of 1 m, utilizing a 20 mm diameter and a 60-degree cone, along with an 8 kg hammer, as depicted in Figure 2. The soil dynamic resistance (
Where A cone tip area, e is the rate of penetration at each drop, and m and m' are the masses of the anvil, rods, and drop hammer, respectively. From Equation 14, by dividing one/e, Equation 15 can be obtained. The rearranged equation, From Equation 14, we can calculate e/
Consequently, the fine-grained soil equation is as follows (Gholami et al., 2022):
3.3 Background of applied ML techniques
ML has transformed the landscape of civil engineering and has presented innovative solutions to intricate challenges. Applied extensively in civil engineering tasks, ML techniques span predictive modelling to decision support systems (Thapa and Ghani 2024a; Ghani and Chhetri Sapkota, 2024; Mustafa et al., 2024). ML algorithms meticulously scrutinize extensive datasets, uncovering patterns and trends that yield valuable insights into structural behavior, material performance, and project management. In the realm of structural engineering, ML is instrumental in forecasting the structural health and lifespan of bridges and buildings using real-time monitoring data (Ghani et al., 2023; Gupta et al., 2024; Shrestha et al., 2023; Thapa et al., 2024a). Geotechnical engineering reaps the benefits of ML in soil classification, slope stability analysis, ground settlement prediction, and liquefaction assessment (Ghani et al., 2024b; Ghani and Kumari, 2022a; 2022b; 2023b; 2023a; N; Kumar and Kumari, 2024; Mahmoodzadeh et al., 2022; Thapa and Ghani, 2023; Thapa and Ghani, 2024). Several researchers have promoted the application and adaptability of ML for liquefaction assessment (Hanandeh et al., 2022; Sui et al., 2023). Moreover, optimizing ML models with metaheuristic optimization algorithms has shown promising results in enhancing the accuracy and reliability of liquefaction prediction results (Duan et al., 2023a; Ghani et al., 2022). The ML model’s hyperparameters are fine-tuned by the optimization algorithm, resulting in more accurate predictive results. A concise summary of the optimized ML models utilized is provided below. For a comprehensive background on these ML and optimization methods, readers can consult the pertinent literature (Asteris et al., 2021; Davoodi et al., 2023; D. R; Kumar et al., 2022; Nagaraju et al., 2023).
3.3.1 Support Vector Machine
Supervised learning tasks, particularly classification problems, can benefit from the application of SVM’s, an algorithm initially introduced by Vapnik for classification (Cortes and Vapnik, 1995). The SVM framework has since been extended to encompass regression and other prediction tasks, as demonstrated by recent advancements (C. Chen et al., 2024). SVMs operate on the principle of structural risk minimization, which aims to strike a balance between fitting the training data and ensuring a good generalization performance to unseen data. In this investigation, we employed a Gaussian Radial Basis Function (RBF) kernel to transform the data from its original lower-dimensional feature space to a higher-dimensional space where linear separation between classes becomes possible. This allows SVM to learn a linear decision boundary in the transformed space, which can be expressed by the following Equation 17:
where, ⟨∙⟩ represents the dot function, and φ(x) denotes a transformation that takes the input feature and maps it to a higher-dimensional feature space. The parameter vector of the function, referred to as model bias, is denoted by b. The minimum values of ω were obtained using the following Equation 18:
The variables ξj and
3.3.2 Metaheuristic optimization algorithms
Inspired by the social hierarchy and hunting strategies of grey wolves, the Grey Wolf Optimizer (GWO) algorithm mimics the pack structure. Alpha wolves (leaders), betas (assistants), deltas (subordinate hunters), and omegas (lowest ranking) guided the search process. This population-based approach has found widespread application in various engineering fields, offering a valuable tool for task optimization, as demonstrated in recent research (Ghani and Kumari, 2022a; Thapa et al., 2024a). Particle Swarm Optimization (PSO) serves as a global optimization approach employed in fine-tuning hyperparameters within machine-learning models. Drawing inspiration from the collective behavior of bird swarms and fish schools (Gad, 2022), the PSO algorithm has proven its efficacy. In a comparative study of five optimization algorithms, namely, PSO, ant colony systems, genetic algorithm (GA), shuffled frog leaping, and the memetic algorithm, PSO emerged as the superior technique (Pham and Nguyen Dang, 2024). Inspired by Darwin’s theory of natural selection, GA utilizes a population of initial solutions encoded as chromosomes. These chromosomes, which are often represented as binary strings, act as candidate solutions. Through an iterative evaluation using fitness functions, the algorithm identified promising solutions. These solutions are then combined (crossover) and slightly altered (mutation) to create new generations, ultimately leading to an improvement in the overall population towards optimal solutions, which has proven successful in solving complex problems, including those in civil engineering (Ghani and Kumari, 2022b). Firefly (FF) is a population-based metaheuristic optimization approach. It emphasizes light variety and enticing formulas, mirroring the use of light by fireflies for mating, prey detection, and swarm awareness (Ghani and Kumari, 2022b). Figure 4 presents the workflow for optimizing the hyperparameters of an SVM regression model using the four optimization algorithms adopted in this study, as discussed above.
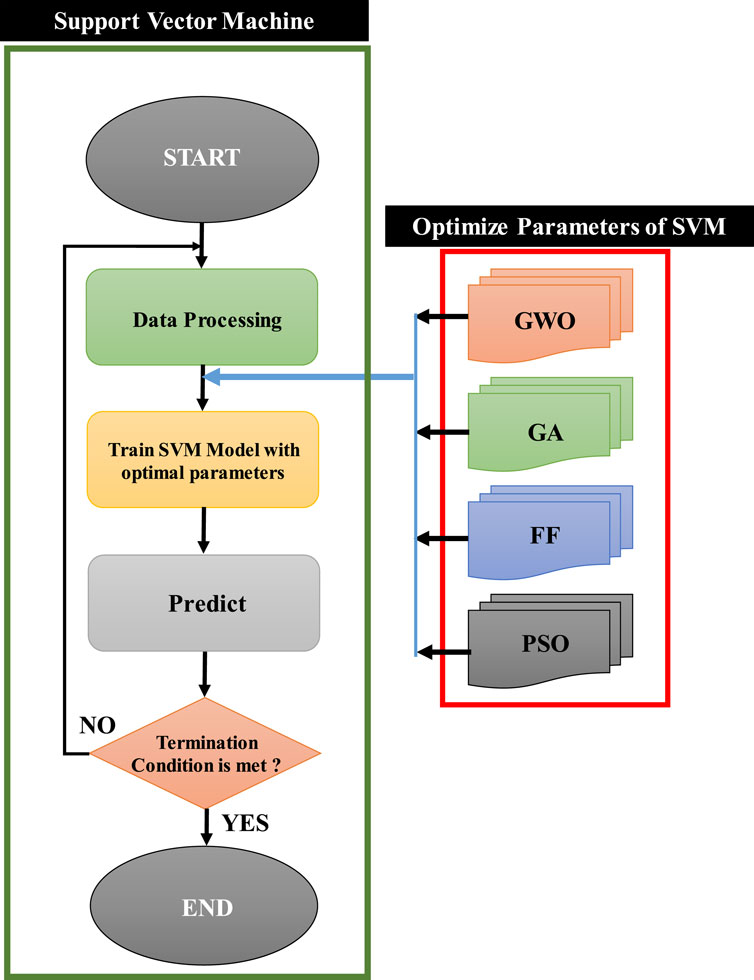
Figure 4. Workflow for optimizing SVM regression hyperparameters using GWO, GA, FF, and PSO algorithms.
4 Data collection and data processing
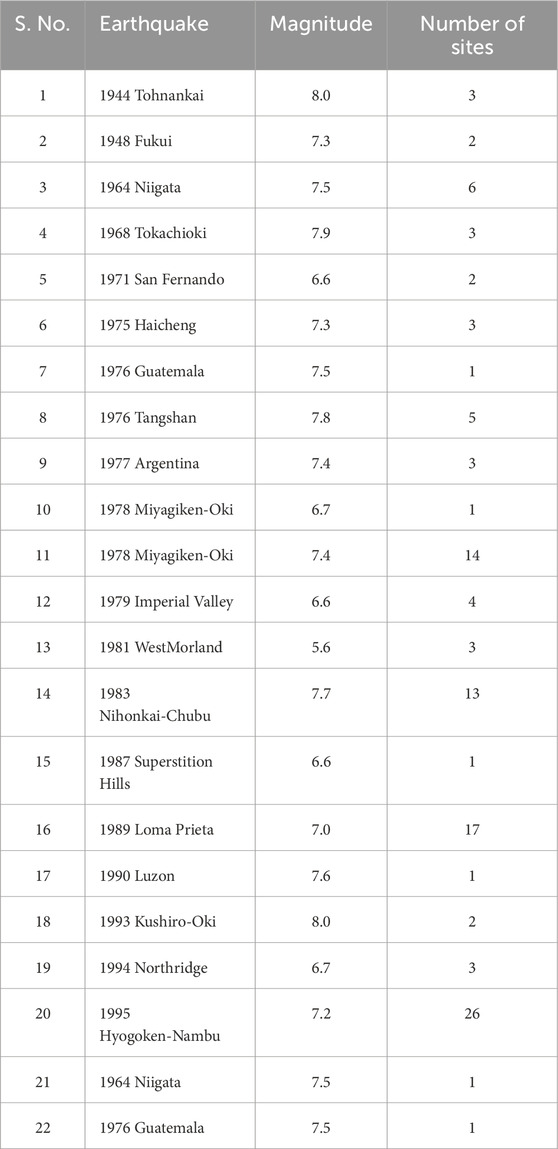
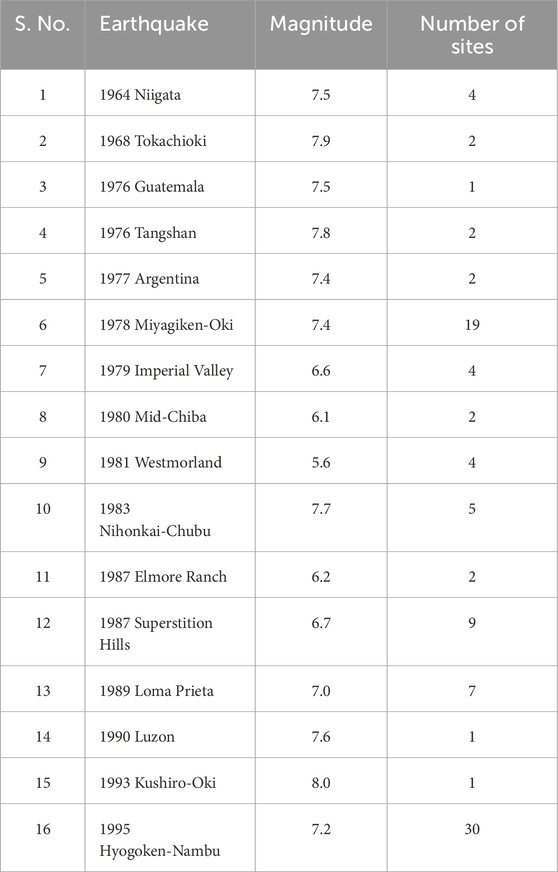
The database was obtained from a comprehensive record of numerous earthquake events, detailing their magnitudes, specific sites affected, and the occurrence of liquefaction at each location. Tables 2, 3 present data on various earthquakes, detailing their magnitudes, number of affected sites, and occurrence and non-occurrence of liquefaction. Figures 5, 6 illustrate the global map highlighting the locations from which the liquefied and non-liquefied soil data were collected. Notable events include the 1944 Tohnankai earthquake with a magnitude of 8.0 affecting three sites and causing liquefaction; the 1976 Tangshan earthquake with a magnitude of 7.8 impacting five sites and leading to liquefaction; and the 1995 Hyogoken-Nambu earthquake with a magnitude of 7.2 affecting 26 sites and resulting in liquefaction. Tables 2, 3 provide a concise overview of seismic events and their associated impacts on the liquefaction of ground sites. This structured format facilitates an easy comparison and analysis of liquefaction incidents across various seismic events and locations.
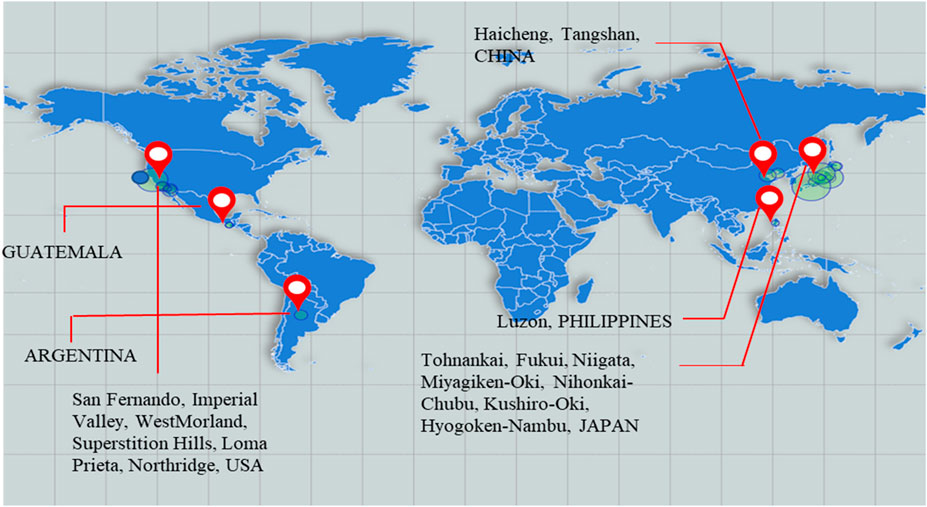
Figure 5. Map of the study area for Liquefaction cases in the study area as per Table 2.
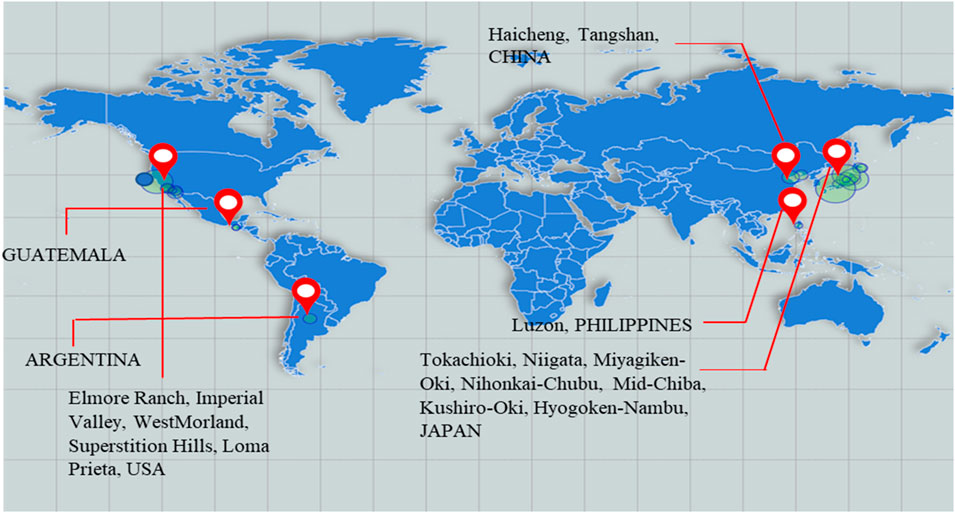
Figure 6. Map of the study area for Non-Liquefaction cases in the study area as per Table 3.
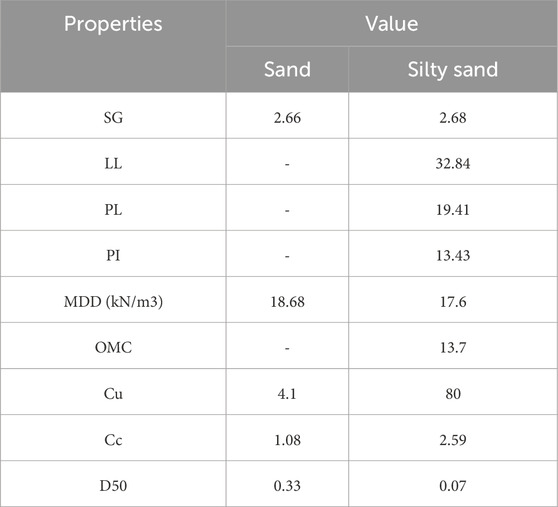
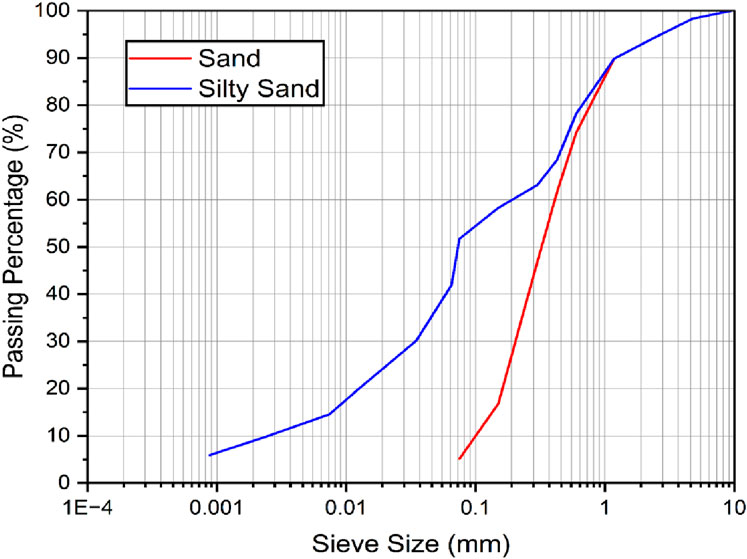
Table 4 outlines the various properties of the soil types encountered, that is, sand and silty sand from the study area. Overall, the table presents and compares the density, moisture characteristics, and particle size distribution of sand and silty sand, highlighting the significant differences in their properties. Figure 7 shows the grain size distribution of sandy soil and silty sand soil from the study area.
For the processing of data to incorporate ML techniques, normalization is a crucial preprocessing step that significantly improves the accuracy of computational models. It addresses the issue of variable scaling by transforming data values into a common range, often between zero and one. This mitigates the influence of features with larger scales on the learning process, ensuring that all variables contribute equally during the model training. By normalizing the data, we prevent features with inherently larger values from dominating the model, and achieve a more balanced representation of the underlying relationships within the data. This paves the way for the development of more robust and generalizable models.
The minimum and maximum values of aNORMALIESD are represented by amin and amax, respectively as shown in Equation 20. This technique is called the min-max normalization technique.
5 Results and discussion
5.1 Threshold criteria for liquefaction assessment from field data
In the present investigation, the focus was on the capabilities of the DCPT method in evaluating the liquefaction susceptibility. A pivotal aspect highlights the significance of the e/qd ratio in gauging the likelihood of liquefaction-induced failures. Termed the safety ratio, this ratio outlines the relationship between the rate of penetration (e) and cone resistance (qd), thereby emerging as a pivotal factor in evaluating the potential for soil liquefaction. The DCPT method employs Equation 14 to calculate the soil dynamic resistance (qd). This equation incorporates key factors such as the equipment mass, gravitational force, and cone tip dimensions. By rearranging this formula, Equation 15 expresses the ratio of the penetration rate to the dynamic resistance (e/qd), which is often referred to as the safety ratio. This parameter offers valuable insights into the soil behavior under dynamic stress conditions. Generally, a higher e/qd value suggests an increased susceptibility to liquefaction, as it indicates the tendency of the soil to yield more readily under applied forces. To bridge the gap between the DCPT results and more conventional soil-testing methods, Equation 16 establishes a correlation between qd and the Standard Penetration Test (SPT) N-value for cohesionless fine-grained soils. This relationship enhances the applicability of the DCPT by allowing comparisons with widely used SPT data, thereby facilitating a more comprehensive assessment of the liquefaction potential across various soil types and conditions.
The establishment of a threshold criterion, illustrated in Figure 8, proved instrumental in determining the soil liquefaction susceptibility based on the e/qd ratio. The sample index was plotted along the y-axis, representing the different soil samples analyzed. The Safety Factor is plotted on the x-axis, indicating the ratio between the rate of penetration and dynamic resistance for each sample. The red vertical line at e/qd = 4 represents the critical threshold separating the liquefied and nonliquefied zones. Samples with e/qd ≥ 4 were classified as liquefied (LQ) and are represented by orange bars. Samples with e/qd < 4 were classified as non-liquefied (NLQ) and are shown as blue bars. The Liquefied Zone on the right side of the red line indicates that the soil samples falling within this region are more likely to experience liquefaction. The graph visually demonstrates the separation between the liquefied and non-liquefied cases based on their e/qd values, providing insight into the safety margins for various soil samples under dynamic loading conditions. This classification is based on the understanding that soils with higher e/qd ratios generally exhibit lower resistance to liquefaction, which increases the risk of failure under seismic loading conditions.
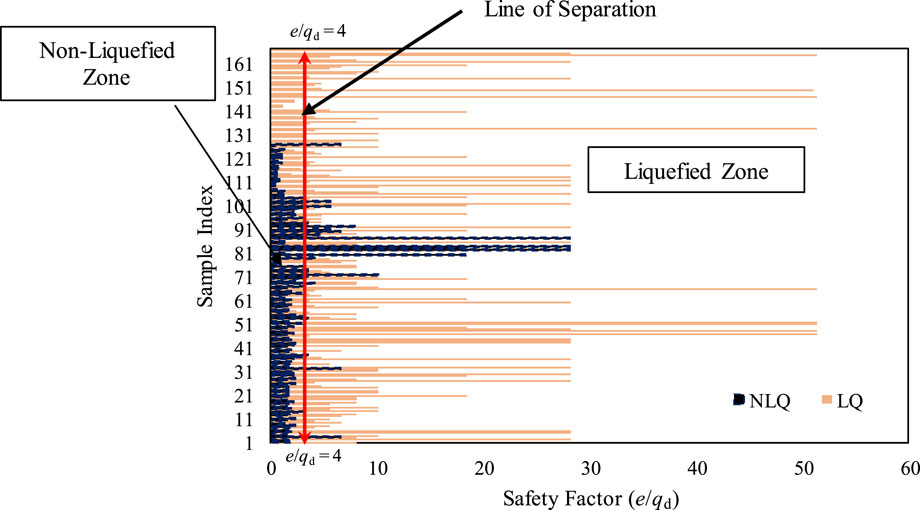
Figure 8. Distribution of safety factor (e/qd) for liquefied and non-liquefied samples with the critical separation threshold (e/qd = 4).
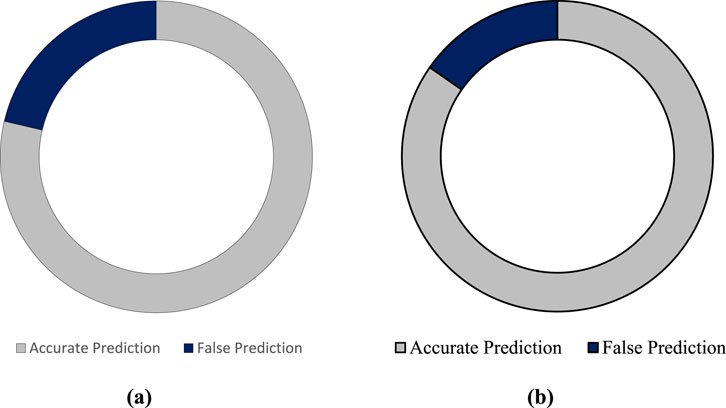
This differentiation is briefly summarized using the tabular liquefaction susceptibility criterion, as shown in Table 5. Figure 8 serves as a visual aid to elucidate the relationship between the e/qd ratio and the liquefaction prediction. Figure 9 provides a quantitative assessment of the accuracy of liquefaction predictions derived from the e/qd ratio obtained using the DCPT method. Notably, the accuracy rates for the liquefied and non-liquefied scenarios were 82.7% and 86.5%, respectively, as shown in Figures 9A, B. The overall accuracy of the prediction rate for liquefied and non-liquefied conditions highlighted the precision of the proposed method.
The results of this study underscore the pivotal role of the e/qd ratio in fortifying our understanding of soil liquefaction. The e/qd ratio is a key component that provides crucial information for projects involving engineering and construction, particularly in areas with high seismic activity. Through meticulous analysis and empirical validation, the present findings underscore the efficacy of employing this safety ratio within the DCPT framework, offering a robust and novel tool for evaluating liquefaction susceptibility at different locations.
5.2 Relation between inputs and safety factor (e/qd)
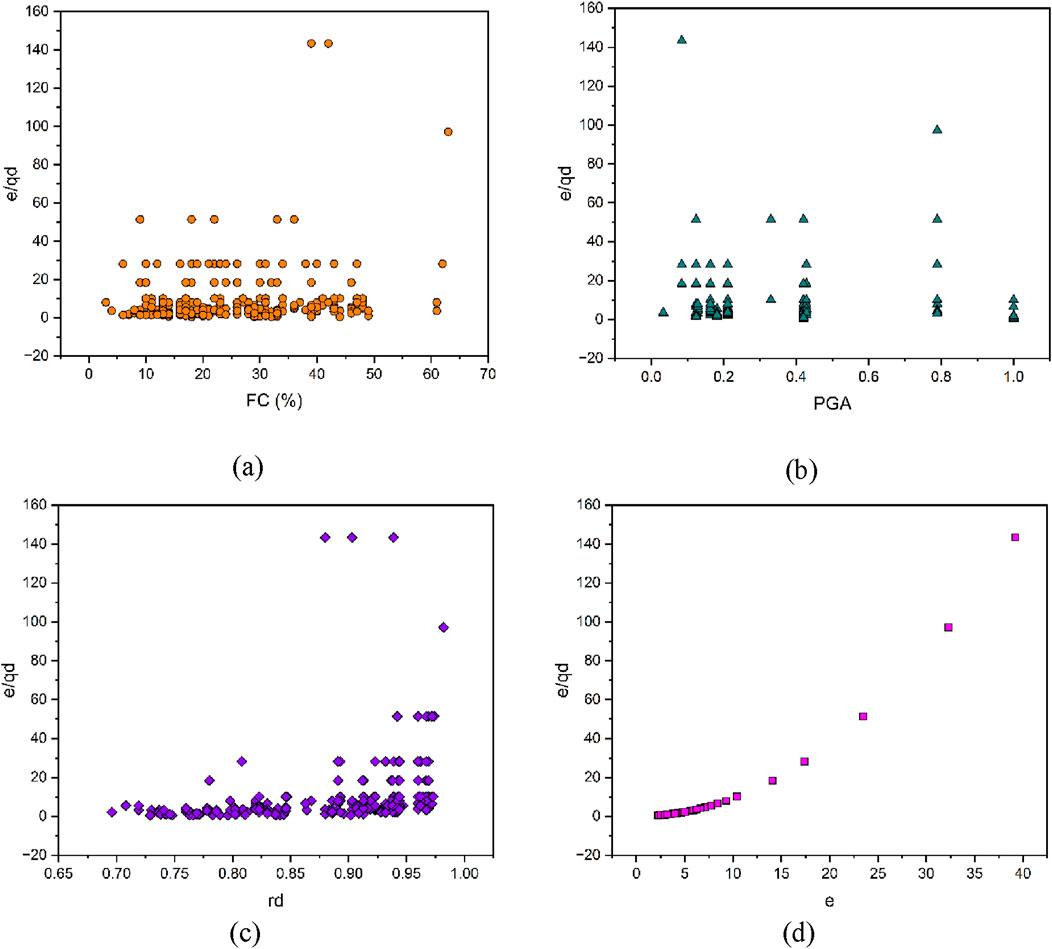
Figure 10 illustrates the connection between the input variables and the e/qd ratio through four subfigures: FC (%), PGA, rd, and e. The amount of finer particles in the soil, known as FC (%), affects its vulnerability to liquefaction. An increased FC usually results in a higher e/qd ratio, indicating a higher likelihood of liquefaction. PGA is the seismic factor acting on the soil, which directly affects the e/qd ratio. With an increase in PGA, the e/qd ratio increased, indicating a greater likelihood of liquefaction. rd accounts for the depth-related weakening of seismic energy; smaller rd values are linked to greater e/qd ratios, suggesting that deeper layers are at an increased risk of liquefaction. The penetration rate (e) in the DCPT test is an important factor. A higher e/qd ratio indicates a weaker soil strength when the penetration rate is increased. Figure 10 shows how variations in FC, PGA, rd, and e affect the e/qd ratio, thereby impacting the soil liquefaction potential. Comprehending these relationships assists in evaluating the engineering characteristics of soil and its response to seismic forces.
5.3 Hyperparameter tuning process
The present study employed grid search as the primary hyperparameter tuning method to optimize the performance of our ML models. The grid search performs an exhaustive search over a predefined parameter space, allowing us to systematically evaluate different combinations of hyperparameters. For the SVM model, the regularization parameter (C), which controls the trade-off between maximizing the margin and minimizing classification errors, and the kernel coefficient (gamma) for the Radial Basis Function (RBF) kernel, which determines the influence of a single training example were tuned (Ghani et al., 2021; Ghani et al., 2024a; Guan et al., 2022; Jamal et al., 2021; Ghani et al., 2024b; Talamkhani et al., 2023; Wang et al., 2023). The grid search process was performed in combination with the k-fold cross-validation to ensure robustness (Man et al., 2023; Roy et al., 2023). This cross-validation technique divides the dataset into k subsets, where the model is trained on k-1 subsets and tested on the remaining subset. The process is repeated k times, and the results are averaged to minimize overfitting and ensure that the model generalizes well to the unseen data (Ghani and Kumari 2022; Thapa et al., 2024b; Ghani and Kumari 2021b; Shrestha et al., 2024; Mustafa and Ahmad 2024). The grid search explored a range of values for C (0.1–100) and gamma (0.001–1). After tuning, we observed a significant improvement in the model performance. The optimized SVM model, for instance, demonstrated a reduction in the root mean square error (RMSE) and an increase in the coefficient of determination (R2). These enhancements were crucial for achieving higher accuracy in predicting liquefaction susceptibility, as the tuned parameters allowed the model to better capture the complex nonlinear relationships between the input variables and liquefaction outcomes. In addition to the grid search, we also experimented with a random search for other models, such as decision trees and neural networks, where we randomly sampled the hyperparameter space. Although random search is less computationally expensive, a grid search was chosen for the SVM model to ensure a more precise optimization of the hyperparameters. The results from hyperparameter tuning clearly demonstrate that model performance is highly sensitive to the choice of parameters. The fine-tuned SVM model outperformed the default settings, confirming the effectiveness of the proposed grid search strategy.
5.4 Computational analysis using ML models
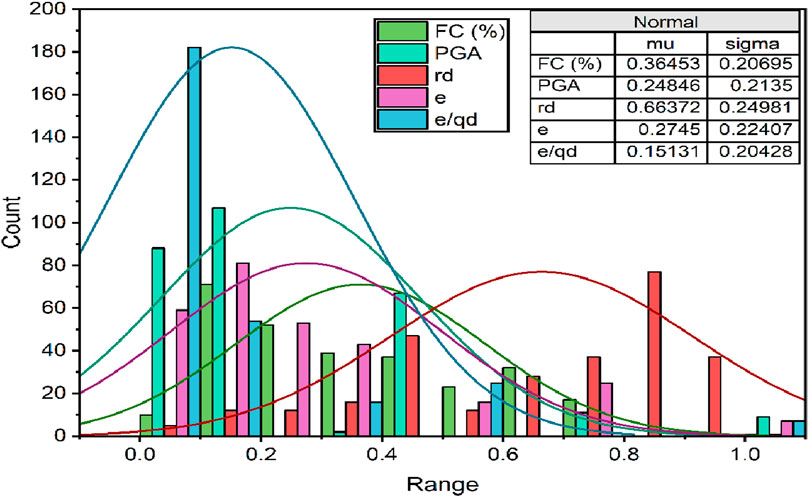
Furthermore, this study focuses on developing a data-driven ML model for utilizing DCPT test data utilizing four key variables: fine content (FC), peak ground acceleration (PGA), reduction factor (rd), and rate of penetration (e). Table 6 presents a statistical summary of the input and output variables for the entire dataset. To gain a deeper understanding of the relationship between key parameters influencing safety, Figure 11 presents the frequency distribution of the normalized values for FC, PGA, rd, e, and e/qd. Figure 12 illustrates the relative frequency distribution of the five key variables affecting the soil liquefaction susceptibility. The distributions were mostly right-skewed, indicating that most data points fell within the lower ranges for each parameter. For instance, fine content predominantly lies between 10% and 30%, whereas PGA values are mainly low, with a significant portion of samples having low seismic activity. The reduction factor values cluster around 0.8 to 0.9, suggesting a moderate energy reduction with depth. The penetration rate (e) showed a concentration of approximately 5–15, indicating moderate resistance in the soil. Finally, the safety ratio (e/qd) values were low for most samples, indicating that the majority of the soils tested had lower liquefaction potential. These distributions highlight the critical role of these variables in assessing the liquefaction risk.
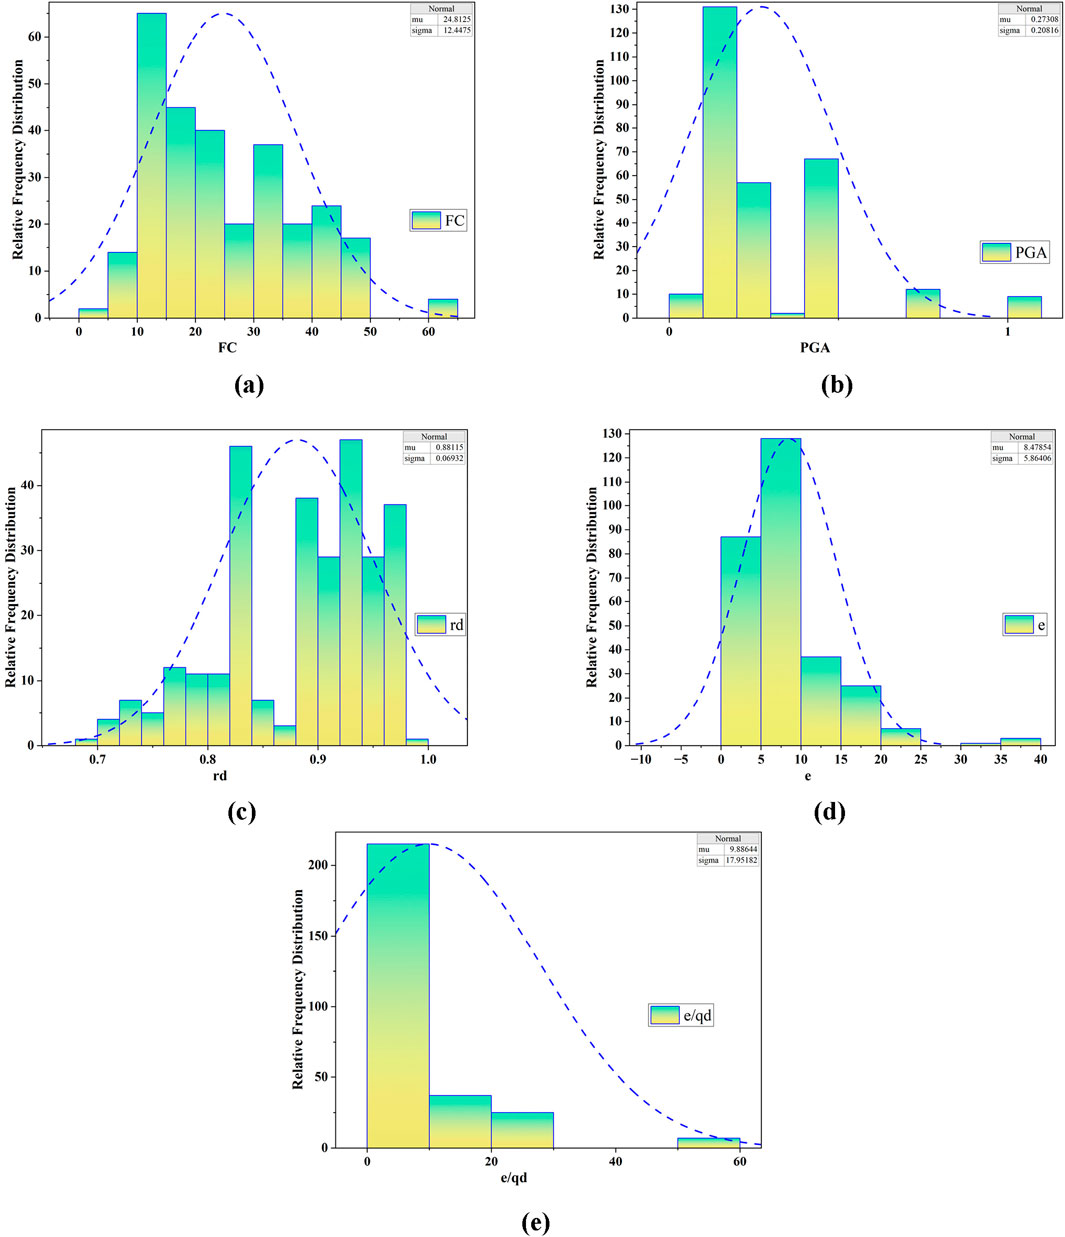
Figure 12. Relative Frequency Distribution of Key Parameters Influencing Liquefaction Susceptibility in Soils (A) Fines Content, (B) Peak Ground Acceleration, (C) Reduction factor (D) Rate of Penetration, and (E) Safety Ratio.
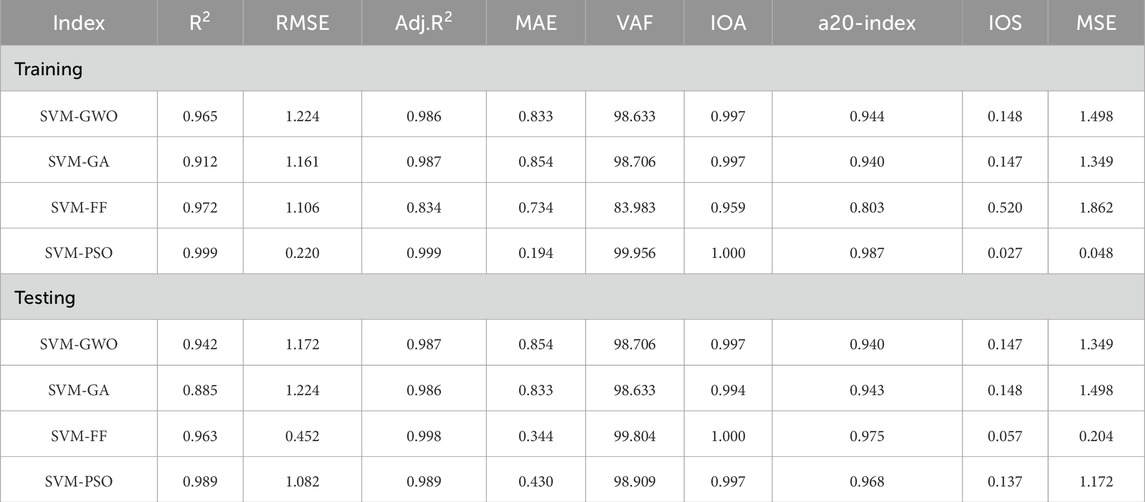
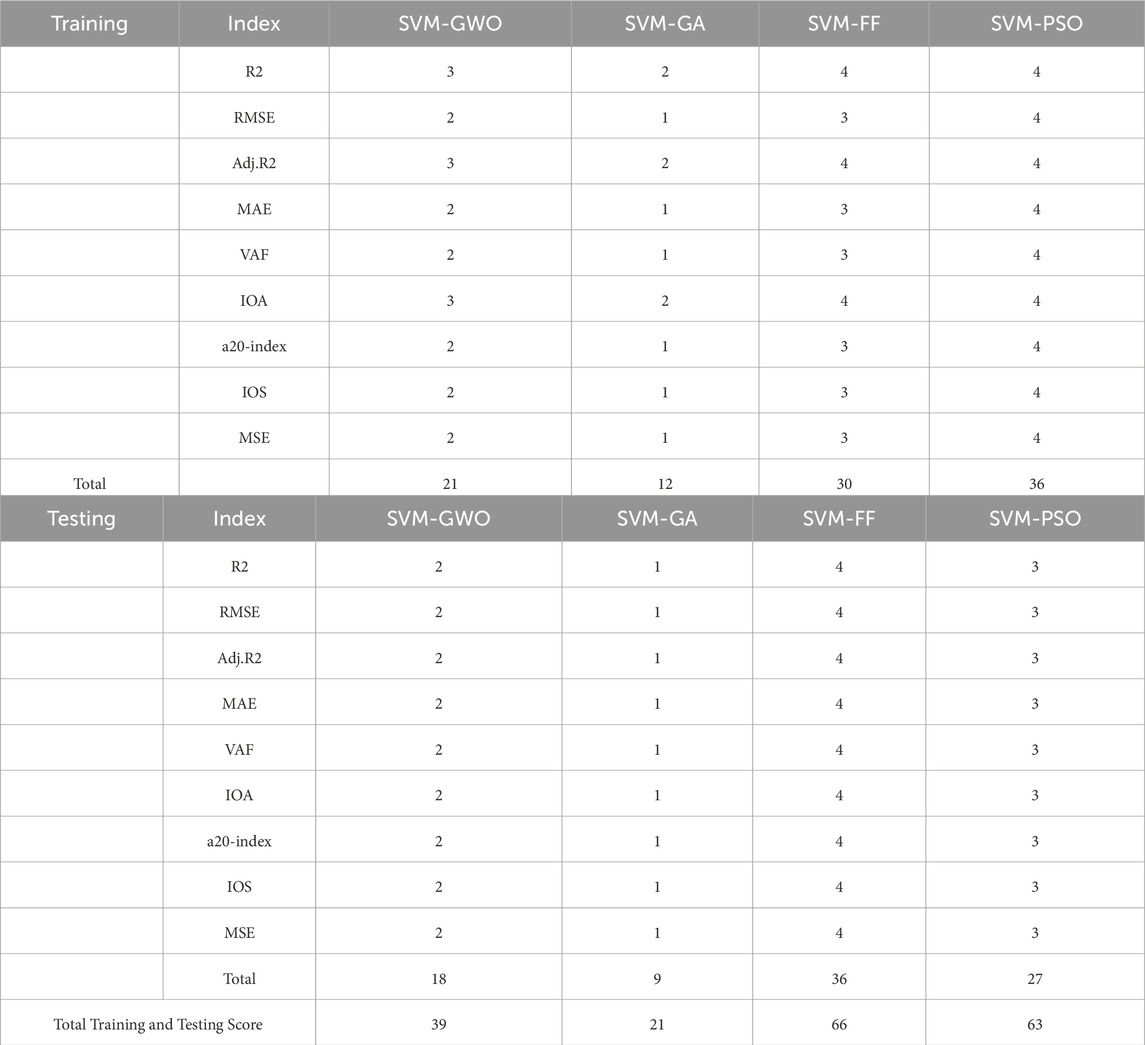
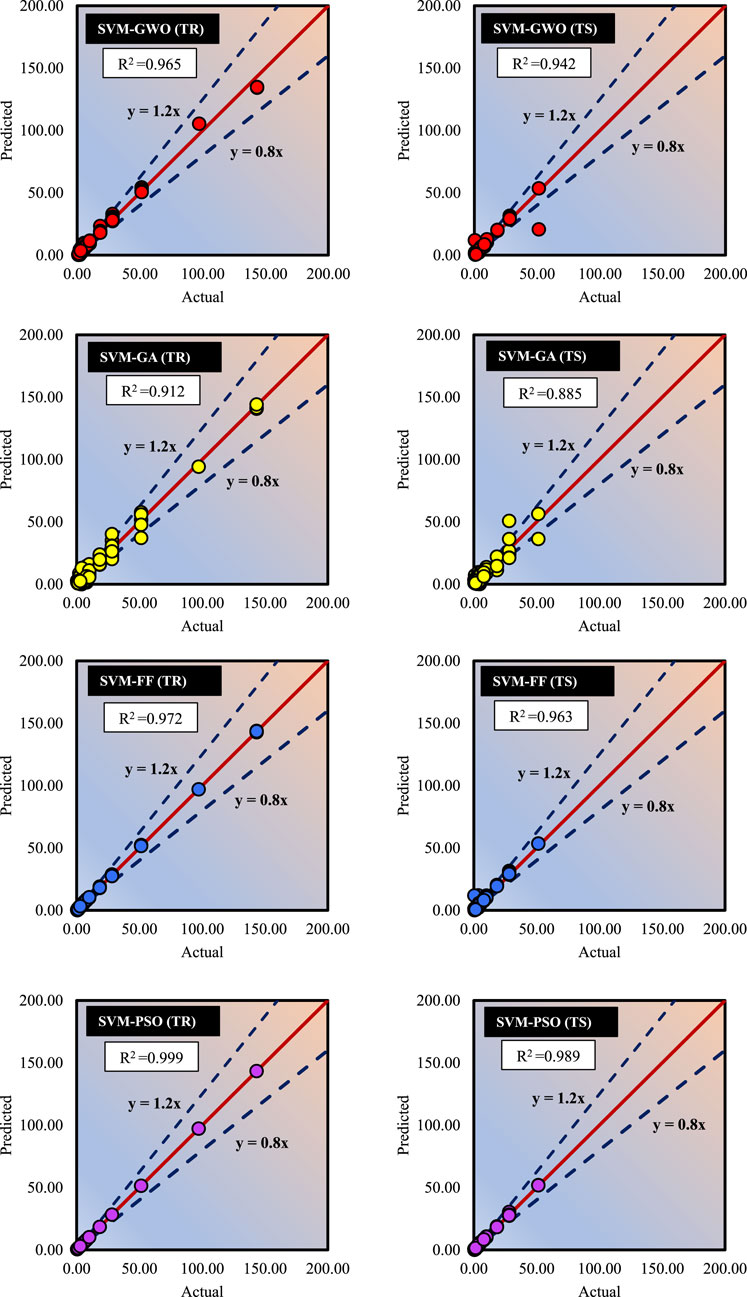
Hybridized ML models were used to evaluate e/qd. Both the model construction and validation phases were specifically addressed to provide a comprehensive understanding of the effectiveness of the ML model. The primary focus of the discussion was model performance during the training and testing phases. Table 7 presents the statistical performance of the model during the training and testing phases. Table 8 presents a thorough examination of the various models using multiple indices to determine the scores. The performance of each model was assessed during both training and testing stages. The scores represent the extent to which each model predicts the e/qd ratio. In the testing phase, the SVM-FF model demonstrated superior predictive ability by achieving the highest total score of 36, surpassing all other indices. In contrast, the SVM-GA model had the lowest score of nine in testing, indicating less accurate predictions. The SVM-PSO model consistently achieved high scores in both the training and testing stages. This in-depth score analysis helps to pinpoint the strongest and most dependable models for predicting soil behavior in different situations, guaranteeing precise evaluations of soil liquefaction potential. The SVM-FF model showed high accuracy in predicting e/qd with R2 values of 0.999 and 0.998 and low RMSE values of 0.332 and 0.452 in the training and testing stages, respectively, achieving the highest score of 66. This was followed by the SVM-PSO model, which also showed high accuracy in predicting e/qd with R2 values of 0.999 and 0.989 and low RMSE values of 0.220 and 1.082 in the training and testing stages, respectively, achieving a score of 63. The SVM-GA model, being the poorest performer, still had an R2 value above 0.83 in both the training and testing phases with a score of 21, whereas the SVM-GWO model showed good predicting capability, obtaining R2 above 0.98 in both the training and testing phases, obtaining a score of 39.
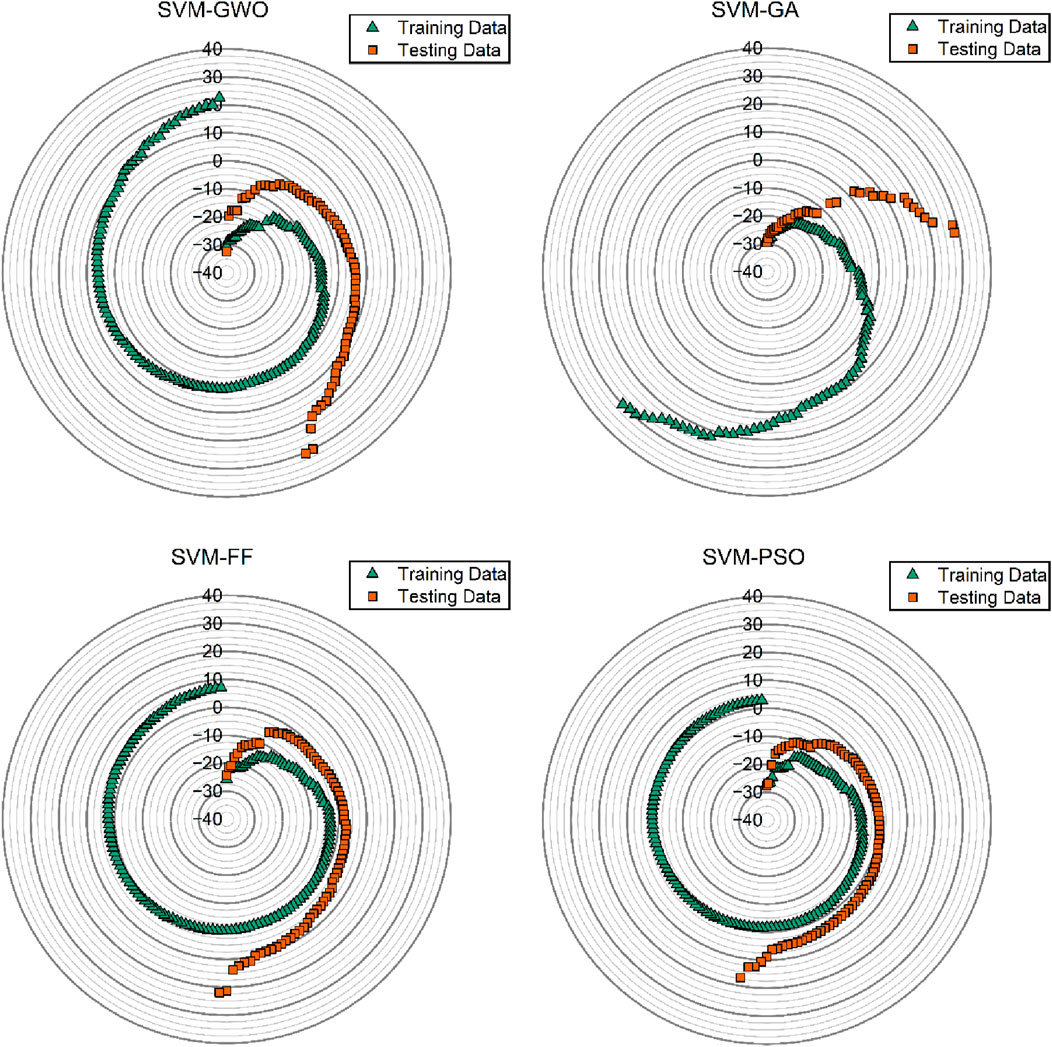
Figure 13 shows the actual and predicted scatter plots, where the orange dot represents the actual value, and the green dot represents the predicted e/qd values. Figure 14 illustrates the error graph of the prediction models, where the green triangle represents the training dataset and the orange square represents the testing dataset. From Figures 13, 14, the SVM-FA and SVM-PSO models have the best accuracy because of the presence of 95% of the dataset in the ideal line and an error of less than 30%.
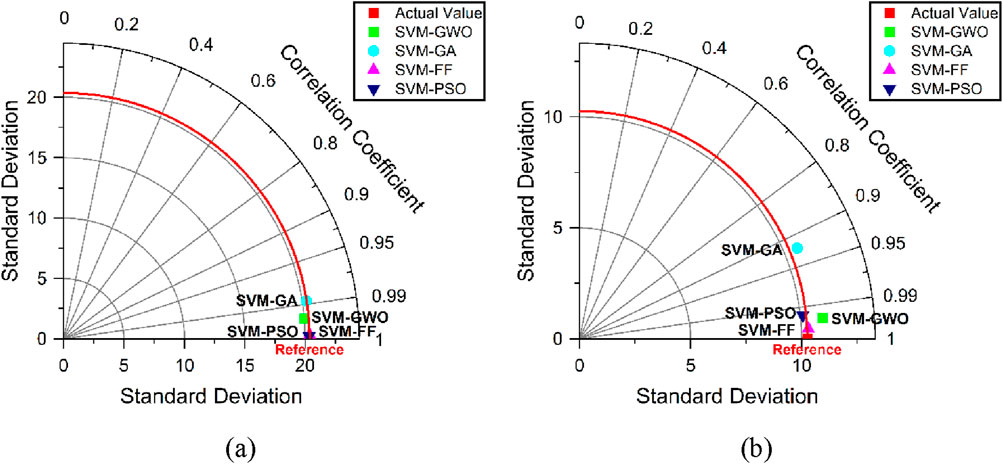
Figure 15 presents a detailed evaluation of the general performance of the model using the Pearson correlation coefficient (R), standard deviation (SD), and root mean square error (RMSE) measurements. The Taylor diagram included information from the training and testing datasets. Evaluating the effectiveness of the model is simpler compared to the benchmarks of R = 1 and RMSE = 0. During both the training and testing stages, the proposed models accurately predicted the actual value (e/qd), as shown in Figure 15. Throughout both stages, the SVM-PSO model excels significantly, approaching the reference point near the red square. To validate the performance improvements of the hybrid models, we conducted a paired t-test. This test evaluates whether the observed differences in key performance metrics, such as R2, RMSE, and MAE, are statistically significant. The paired t-test was used to determine whether the mean difference between the performances of the two models was significantly different from zero. The relationship for the paired t-test is shown in Equation 21
Where:
We applied the test to the performance metrics of each model across the same datasets with a significance level of 0.05. If the resulting p-value is less than 0.05, we reject the null hypothesis and conclude that the performance improvement of the hybrid models over the standalone models is statistically significant. The results show that for key metrics, such as RMSE and R2, the improvements in the hybrid models (e.g., SVM-PSO and SVM-FF) are statistically significant compared to the standalone models, confirming the superiority of the hybrid models in liquefaction risk prediction.
This statistical analysis reinforces the validity of the enhanced performance of the hybrid models.
This demonstrates how the model’s forecasting accuracy validates its potential for accurately predicting e/qd in real-world applications. However, the study’s dataset, while comprehensive for the specific region and soil type analyzed, may not adequately represent soil variability across diverse locations, potentially limiting the model’s applicability in substantially different conditions. The generalizability of the model across regions and soil profiles necessitates further validation with more heterogeneous datasets. Uncertainties in the DCPT data, the primary input, may introduce variability that affects the predictive accuracy. Despite measures to mitigate overfitting, the relatively limited dataset size presents a potential risk, necessitating additional validation on larger and more diverse datasets to ensure robustness and scalability.
In conclusion, this study not only contributes to the evolving landscape of liquefaction potential assessment, but also bridges the gap between field testing and advanced computational techniques. The integration of these advanced computational models with DCPT data, specifically the e/qd ratio (rate of penetration to cone resistance), represents a significant advancement. The DCPT, known for its rapidity, cost-effectiveness, and versatility across soil types (Rollins et al., 2021), provides a practical and efficient field-testing method. The e/qd ratio, when exceeding a threshold of 4, signifies a high likelihood of liquefaction and offers a quick and reliable assessment tool.
6 Computational efficiency and practicality for real-time geotechnical analysis
The practical application of the proposed ML models in real-time geotechnical analysis is contingent on their computational efficiency. This study utilized machine-learning techniques to predict liquefaction susceptibility using DCPT data. These models were selected because of their ability to achieve an optimal balance between high predictive accuracy and computational efficiency, rendering them suitable for practical implementation.
6.1 Processing time and resource usage
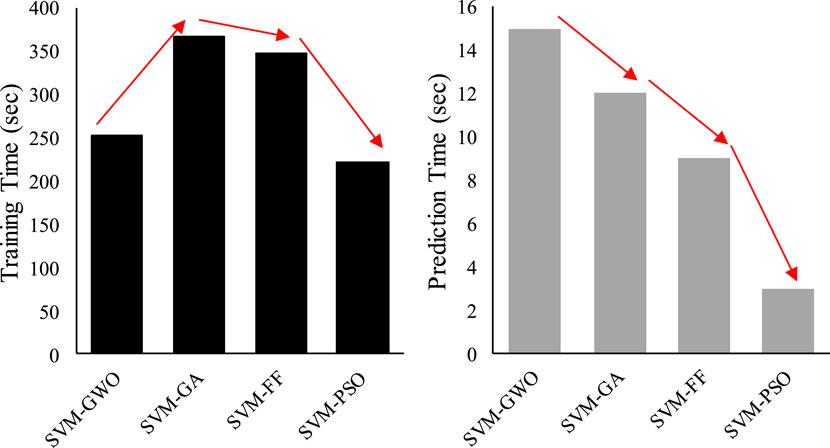
The computational efficiency of the models was evaluated by assessing the mean training duration and resource utilization across multiple trials. Table 9 presents the average training time (in min) and memory consumption (in GB) for each ML model.
As shown in Table 1, the SVM-PSO model demonstrated low memory and CPU usage, proving its efficiency in real-time applications. While models such as SVM-GA and SVM-FA require marginally more training time, their resource consumption remains within acceptable bounds and is suitable for deployment in resource-limited environments such as in-field devices or real-time monitoring systems.
6.2 Model deployment and real-time suitability
In addition to resource utilization, we evaluated the temporal requirements of each model to process the novel data inputs after training. Figure 16 shows the prediction duration (in seconds) for each model when processing the new DCPT data points. This demonstrates that the prediction time for all models was less than 15 s, which underscores their capacity for real-time analysis. This capability is particularly significant for applications, such as post-earthquake site assessments, where rapid and accurate predictions of liquefaction susceptibility are essential.
6.3 Integration with real-time geotechnical analysis
The integration of these ML models with DCPT data presents a streamlined approach for liquefaction assessment. In contrast to traditional methods, which may require labor-intensive and time-consuming data collection and processing, DCPT provides real-time data inputs that can be immediately analyzed by ML models. This renders the proposed methodology particularly valuable in field scenarios in which real-time risk assessment is crucial. The combination of efficient processing times and low resource consumption renders these machine-learning models suitable for deployment in both real-time and near-real-time geotechnical applications. Their capacity for integration with lightweight hardware systems further enhances their applicability to real-world engineering projects.
7 Environmental impact and sustainability considerations
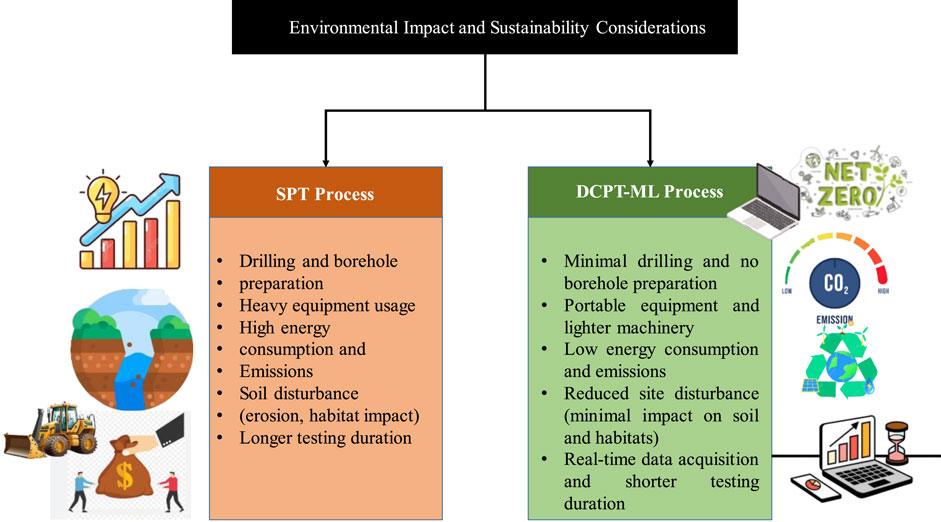
The proposed methodology, which integrates DCPT data with ML models, offers substantial environmental advantages over conventional methods, such as SPT. These methods require extensive drilling, borehole preparation, and heavy equipment utilization, resulting in high energy consumption and significant soil disturbance, which can potentially disrupt habitats, induce soil erosion, and contaminate the groundwater. In contrast, DCPT is a portable and lightweight alternative that requires minimal drilling and equipment. The direct soil penetration approach minimizes borehole preparation, thereby reducing both site time and environmental disturbances. DCPT’s real-time data acquisition capability of DCPT shortens the testing duration, consequently reducing the energy consumption and emissions from machinery operation. The integration of DCPT with ML enhances the predictive accuracy without necessitating additional field tests, thus promoting resource efficiency. This approach not only reduces costs, but also decreases the environmental footprint of geotechnical assessments. It supports sustainable infrastructure practices by facilitating the design of earthquake-resilient structures, with minimal environmental degradation. In conclusion, the DCPT-ML framework provides a sustainable and accurate method for liquefaction assessment, mitigating the environmental impact of geotechnical investigations, particularly in ecologically sensitive areas, while ensuring reliable predictions of the liquefaction potential. Figure 17 illustrates and compares the environmental impact and sustainability considerations between two geotechnical investigation methods: the SPT process and Dynamic Cone Penetration Test integrated with Machine Learning (DCPT-ML) process.
8 Summary and conclusion
This study presents an innovative approach that combines Dynamic Cone Penetration Test (DCPT) data with advanced machine learning (ML) algorithms to improve the accuracy, efficiency, and environmental impact of liquefaction risk assessments. This study marks a significant leap in geotechnical engineering by shifting from traditional, time-consuming, and resource-intensive methods such as the Standard Penetration Test (SPT) to a more sustainable, rapid, and adaptable solution. Through the use of DCPT, this method offers real-time data acquisition and minimizes soil disturbance, energy consumption, and emissions, making it not only cost-effective, but also environmentally friendly. The integration of ML techniques, specifically optimized SVM models, demonstrated outstanding predictive performance, with the SVM-PSO model achieving high R2 values of 0.999 and 0.989 during training and testing, respectively. This level of accuracy highlights the robustness of the proposed method in capturing the complex soil behaviors and liquefaction susceptibility. The e/qd ratio, which compares the penetration rate to dynamic resistance, was shown to be a critical threshold for predicting the liquefaction potential, with values exceeding four indicating a high likelihood of failure.
Overall, this study provides a powerful, data-driven tool that geotechnical engineers can use to assess liquefaction risks more accurately and efficiently. The ability to train ML models on diverse datasets enables site-specific adaptations, thereby enhancing the practical applicability of this method across various soil types and seismic conditions. Furthermore, the use of minimal drilling and lightweight equipment contributes to the reduction of environmental impacts, aligning with the sustainable infrastructure development goals. This research not only advances the field of liquefaction risk assessment, but also sets a new standard for the intersection of geotechnical engineering, sustainability, and computational efficiency.
9 Limitations and future work
Future research should expand this methodology to different soil types and geographical locations to validate its broader applicability. Enhancing the computational efficiency using streamlined algorithms or advanced optimization methods will improve the model’s processing speed for large datasets or real-time applications. Integrating the model with real-time data from tools such as the DCPT can support the continuous monitoring of soil stability, enabling proactive maintenance and early warning systems for geotechnical hazards, ultimately improving infrastructure resilience and safety.
Data availability statement
The raw data supporting the conclusions of this article will be made available by the authors, without undue reservation.
Author contributions
SS: Conceptualization, Data curation, Formal Analysis, Investigation, Methodology, Software, Validation, Visualization, Writing–original draft. SG: Project administration, Software, Supervision, Visualization, Writing–review and editing.
Funding
The author(s) declare that no financial support was received for the research, authorship, and/or publication of this article.
Conflict of interest
The authors declare that the research was conducted in the absence of any commercial or financial relationships that could be construed as a potential conflict of interest.
Publisher’s note
All claims expressed in this article are solely those of the authors and do not necessarily represent those of their affiliated organizations, or those of the publisher, the editors and the reviewers. Any product that may be evaluated in this article, or claim that may be made by its manufacturer, is not guaranteed or endorsed by the publisher.
References
Asteris, P. G., Skentou, A. D., Bardhan, A., Samui, P., and Pilakoutas, K. (2021). Predicting concrete compressive strength using hybrid ensembling of surrogate machine learning models. Cem. Concr. Res. 145, 106449. doi:10.1016/j.cemconres.2021.106449
Author anonymous. Geotechnical investigation and testing-Field testing-Part 2: dynamic probing (ISO 22476-2:2005). (2005).
Aytaş, Z., Alpaslan, N., and Özçep, F. (2023). Evaluation of liquefaction potential by standard penetration test and shear wave velocity methods: a case study. Nat. Hazards 118 (3), 2377–2417. doi:10.1007/s11069-023-06093-9
Benz Navarrete, M. A., Breul, P., and Gourvès, R. (2022). Application of wave equation theory to improve dynamic cone penetration test for shallow soil characterisation. J. Rock Mech. Geotechnical Eng. 14 (1), 289–302. doi:10.1016/j.jrmge.2021.07.004
Bol, E. (2023). A new approach to the correlation of SPT-CPT depending on the soil behavior type index. Eng. Geol. 314, 106996. doi:10.1016/j.enggeo.2023.106996
Cetin, K. O., Seed, B., Kiureghian, A. D., Tokimatsu, K., Harder, L. F., Kayen, R. E., et al. (2004). Standard penetration test-based probabilistic and deterministic assessment of seismic soil liquefaction potential. J. Geotechnical Geoenviron Ment. Eng. 130 (12), 1314–1340. doi:10.1061/(asce)1090-0241(2004)130:12(1314)
Cetin, K. O., Seed, R. B., Kayen, R. E., Moss, R. E. S., Bilge, H. T., Ilgac, M., et al. (2018). Dataset on SPT-based seismic soil liquefaction. Data Brief 20, 544–548. doi:10.1016/j.dib.2018.08.043
Chen, C., Xu, J., Ni, J., Chen, G., and Lyu, Z. (2024). An intelligent broaching tool design method based on CBR and support vector machine. Adv. Eng. Inf. 60, 102447. doi:10.1016/j.aei.2024.102447
Chen, T.-L., and Paris, L. (2022). Identifying key environmental and building features affecting the outcome of a seismic event: a case study of the “921” earthquake. Nat. Hazards 111 (3), 2627–2647. doi:10.1007/s11069-021-05151-4
Cortes, C., and Vapnik, V. (1995). Support-vector networks. Mach. Learn. 20 (3), 273–297. doi:10.1007/BF00994018
Davoodi, S., Mehrad, M., Wood, D. A., Rukavishnikov, V. S., and Bajolvand, M. (2023). Predicting uniaxial compressive strength from drilling variables aided by hybrid machine learning. Int. J. Rock Mech. Min. Sci. 170, 105546. doi:10.1016/j.ijrmms.2023.105546
Duan, W., Congress, S. S. C., Cai, G., Zhao, Z., Pu, S., Liu, S., et al. (2023a). Characterizing the in-situ state of sandy soils for liquefaction analysis using resistivity piezocone penetration test. Soil Dyn. Earthq. Eng. 164, 107529. doi:10.1016/j.soildyn.2022.107529
Duan, W., Zhao, Z., Cai, G., Wang, A., Wu, M., Dong, X., et al. (2023b). Vs-based assessment of soil liquefaction potential using ensembling of GWO–KLEM and Bayesian theorem: a full probabilistic design perspective. Acta Geotech. 18 (4), 1863–1881. doi:10.1007/s11440-022-01695-2
Emamgholizadeh, S., and Mohammadi, B. (2021). New hybrid nature-based algorithm to integration support vector machine for prediction of soil cation exchange capacity. Soft Comput. 25 (21), 13451–13464. doi:10.1007/s00500-021-06095-4
Gad, A. G. (2022). Particle swarm optimization algorithm and its applications: a systematic review. Archives Comput. Methods Eng. 29 (5), 2531–2561. doi:10.1007/s11831-021-09694-4
Ghani, S., Sapkota, S. C., Singh, R. K., Bardhan, A., and Asteris, P. G. (2024b). Modelling and validation of liquefaction potential index of fine-grained soils using ensemble learning paradigms. Soil Dyn. Earthq. Eng. 177, 108399. doi:10.1016/j.soildyn.2023.108399
Ghani, S., Kumar, N., Gupta, M., and Saharan, S. (2023). Machine learning approaches for real-time prediction of compressive strength in self-compacting concrete. Asian J. Civ. Eng. 25, 2743–2760. doi:10.1007/s42107-023-00942-5
Ghani, S., and Kumari, S. (2021a). “Plasticity-based liquefaction prediction using support vector machine and adaptive neuro-fuzzy inference system,” in Indian geotechnical conference (Singapore: Springer Nature Singapore), 515–527.
Ghani, S., and Kumari, S. (2021b). Insight into the effect of fine content on liquefaction behavior of soil. Geotech. Geol. Eng. 39, 1–12. doi:10.1007/s10706-020-01491-3
Ghani, S., and Kumari, S. (2022). “Consumption of industrial waste in sustainable development of clean and environmentally friendly city near an industrial area,” in Facets of a Smart City: computational and experimental techniques for sustainable urban development, 103.
Ghani, S., and Kumari, S. (2022a). Liquefaction behavior of Indo-Gangetic region using novel metaheuristic optimization algorithms coupled with artificial neural network. Nat. Hazards 111 (3), 2995–3029. doi:10.1007/s11069-021-05165-y
Ghani, S., and Kumari, S. (2022b). Reliability analysis for liquefaction risk assessment for the city of patna, India using hybrid computational modeling. J. Geol. Soc. India 98 (10), 1395–1406. doi:10.1007/s12594-022-2187-7
Ghani, S., and Kumari, S. (2023a). Plasticity-based liquefaction prediction using support vector machine and adaptive neuro-fuzzy inference system, 515–527). doi:10.1007/978-981-19-6998-0_44
Ghani, S., and Kumari, S. (2023b). Prediction of soil liquefaction for railway embankment resting on fine soil deposits using enhanced machine learning techniques. J. Earth Syst. Sci. 132 (3), 145. doi:10.1007/s12040-023-02156-4
Ghani, S., and Kumari, S. (2024). A novel tool for probabilistic modeling of liquefaction behavior in alluvial soil. Georisk Assess. Manag. Risk Eng. Syst. Geohazards, 1–24. doi:10.1080/17499518.2024.2395560
Ghani, S., Kumari, S., and Ahmad, S. (2022). Prediction of the seismic effect on liquefaction behavior of fine-grained soils using artificial intelligence-based hybridized modeling. Arabian J. Sci. Eng. 47 (4), 5411–5441. doi:10.1007/s13369-022-06697-6
Ghani, S., Kumari, S., and Bardhan, A. (2021). A novel liquefaction study for fine-grained soil using PCA-based hybrid soft computing models. Sādhanā 46, 113. doi:10.1007/s12046-021-01640-1
Ghani, S., Sapkota, S. C., Singh, R. K., Bardhan, A., and Asteris, P. G. (2024a). Modelling and validation of liquefaction potential index of fine-grained soils using ensemble learning paradigms. Soil Dyn. Earthq. Eng. 177, 108399. doi:10.1016/j.soildyn.2023.108399
Gholami, A., Palassi, M., and Fakher, A. (2022). Estimation of SPT N values from the results of DCPT counts after elimination of the soil friction effect. Indian Geotechnical J. 52 (6), 1267–1277. doi:10.1007/s40098-022-00604-4
Green, R. A., and Bommer, J. J. (2019). What is the smallest earthquake magnitude that needs to be considered in assessing liquefaction hazard? Earthquake spectra. Earthq. Spectra 35 (3), 1441–1464. doi:10.1193/032218EQS064M
Guan, Z., Wang, Y., and Zhao, T. (2022). Adaptive sampling strategy for characterizing spatial distribution of soil liquefaction potential using cone penetration test. J. Rock Mech. Geotechnical Eng. 14 (4), 1221–1231. doi:10.1016/j.jrmge.2022.01.011
Gupta, M., Prakash, S., and Ghani, S. (2024). Enhancing predictive accuracy: a comprehensive study of optimized machine learning models for ultimate load-carrying capacity prediction in SCFST columns. Asian J. Civ. Eng. 25, 3081–3098. doi:10.1007/s42107-023-00964-z
Hanandeh, S. M., Al-Bodour, W. A., and Hajij, M. M. (2022). A comparative study of soil liquefaction assessment using machine learning models. Geotechnical Geol. Eng. 40 (9), 4721–4734. doi:10.1007/s10706-022-02180z
Hu, J., and Liu, H. (2018). Identification of ground motion intensity measure and its application for predicting soil liquefaction potential based on the Bayesian network method. Eng. Geol. 248, 34–49. doi:10.1016/j.enggeo.2018.11.006
Hu, J., and Liu, H. (2019). Bayesian network models for probabilistic evaluation of earthquake-induced liquefaction based on CPT and vs databases. Eng. Geol. 254, 76–88. doi:10.1016/j.enggeo.2019.04.003
Idriss, I. M., and Boulanger, R. W. (2006). Semi-empirical procedures for evaluating liquefaction potential during earthquakes. Soil Dyn. Earthq. Eng. 26 (2), 115–130. doi:10.1016/j.soildyn.2004.11.023
Idriss, M. (1999). “An update to the Seed-Idriss simplified procedure for evaluating liquefaction potential,” in Proc., TRB workshop on new approaches to liquefaction, january, publication No. FHWA-RD-99-165. Washington, D.C., USA: Federal Highway Administration.
Jamal, A., Zahid, M., Tauhidur Rahman, M., Al-Ahmadi, H. M., Almoshaogeh, M., Farooq, D., et al. (2021). Injury severity prediction of traffic crashes with ensemble machine learning techniques: a comparative study. Int. J. Inj. Control Saf. Promot. 28 (4), 408–427. doi:10.1080/17457300.2021.1928233
Javdanian, H. (2017). Evaluation of soil liquefaction potential using energy approach: experimental and statistical investigation. Bull. Eng. Geol. Environ. 78, 1697–1708. doi:10.1007/s10064-017-1201-6
Juang, C. H., Jiang, T., and Andrus, R. D. (2002). Assessing probability-based methods for liquefaction potential evaluation. J. Geotechnical Geoenvironmental Eng. 128 (7), 580–589. doi:10.1061/(asce)1090-0241(2002)128:7(580)
Kayen, R., Moss, R. E. S., Thompson, E. M., Seed, R. B., Cetin, K. O., Kiureghian, A. D., et al. (2013). Shear-wave velocity-based probabilistic and deterministic assessment of seismic soil liquefaction potential. J. Geotech. Geoenviron. 139 (3), 407–419. doi:10.1061/(asce)gt.1943-5606.0000743
Kramer, S. L. (1996). Geotechnical earthquake engineering. Upper Saddle River, NJ: Prentice Hall, 653.
Kumar, D. R., Samui, P., and Burman, A. (2022). Prediction of probability of liquefaction using hybrid ANN with optimization techniques. Arabian J. Geosciences 15 (20), 1587. doi:10.1007/s12517-022-10855-3
Kumar, D. R., Samui, P., and Burman, A. (2023). Suitability assessment of the best liquefaction analysis procedure based on SPT data. Multiscale Multidiscip. Model. Exp. Des. 6 (2), 319–329. doi:10.1007/s41939-023-00148-x
Kumar, N., and Kumari, S. (2024). Slope stability analysis of vetiver grass stabilized soil using genetic programming and multivariate adaptive regression splines. Transp. Infrastruct. Geotechnol. 11, 3558–3580. doi:10.1007/s40515-024-00423-5
Mahmoodzadeh, A., Mohammadi, M., Farid Hama Ali, H., Hashim Ibrahim, H., Nariman Abdulhamid, S., and Nejati, H. R. (2022). Prediction of safety factors for slope stability: comparison of machine learning techniques. Nat. Hazards 111 (2), 1771–1799. doi:10.1007/s11069-021-05115-8
Man, X., Tang, L., Jia, X., Cong, S., and Ling, X. (2023). Seismic response and failure modes analysis of pile foundations in liquefiable soils using various design criteria. Soil Dyn. Earthq. Eng. 174, 108215. doi:10.1016/j.soildyn.2023.108215
Moss, R. E. S., Seed, R. B., Kayen, R. E., Stewart, J. P., Der Kiureghian, A., and Cetin, K. O. (2006). CPT-based probabilistic and deterministic assessment of in situ seismic soil liquefaction potential. J. Geotechnical Geoenvironmental Eng. 132 (8), 1032–1051. doi:10.1061/(asce)1090-0241(2006)132:8(1032)
Mustafa, R., and Ahmad, M. T. (2024). Probabilistic analysis of simply supported concrete beam using machine learning techniques: a comparative study. Asian J. Civ. Eng. 25 (5), 3915–3928. doi:10.1007/s42107-024-01020-0
Mustafa, R., Kumari, K., Kumari, S., Kumar, G., and Singh, P. (2024). Probabilistic analysis of thermal conductivity of soil. Arabian J. Geosciences 17 (1), 22. doi:10.1007/s12517-023-11831-1
Nagaraju, T. V., Bahrami, A., Prasad, Ch. D., Mantena, S., Biswal, M., and Islam, Md. R. (2023). Predicting California bearing ratio of lateritic soils using hybrid machine learning technique. Buildings 13 (1), 255. doi:10.3390/buildings13010255
Park, G., Kim, N., Kang, S., Kim, S. Y., Yoo, C., and Lee, J.-S. (2023a). Instrumented dynamic cone penetrometer incorporated with time domain reflectometry. Measurement 206, 112337. doi:10.1016/j.measurement.2022.112337
Park, I., Kang, C., and Bayat, A. (2023b). Determination of geotechnical parameters for underground trenchless construction design. Bull. Eng. Geol. Environ. 82 (1), 9. doi:10.1007/s10064-022-03008-z
Pham, V. H. S., and Nguyen Dang, N. T. (2024). Solving time cost optimization problem with adaptive multi-verse optimizer. OPSEARCH 61, 662–679. doi:10.1007/s12597-023-00737-x
Rollins, K. M., Roy, J., Athanasopoulos-Zekkos, A., Zekkos, D., Amoroso, S., and Cao, Z. (2021). A new dynamic cone penetration test–based procedure for liquefaction triggering assessment of gravelly soils. J. Geotechnical Geoenvironmental Eng. 147 (12). doi:10.1061/(ASCE)GT.1943-5606.0002686
Roy, J., Rollins, K. M., Dhakal, R., and Cubrinovski, M. (2023). A comparative study of the DPT and CPT in evaluating liquefaction potential for gravelly soil at the port of wellington, New Zealand. J. Geotechnical Geoenvironmental Eng. 149 (11). doi:10.1061/JGGEFK.GTENG-10769
Seed, H. B., and Idriss, I. M. (1971). Simplified procedure for evaluating soil liquefaction potential. J. Soil Mech. Found. Div. 97 (S9), 1249–1273. doi:10.1061/jsfeaq.0001662
Seed, H. B., Idriss, I. M., and Arango, I. (1983). Evaluation of liquefaction potential using field performance data. J. Geotechnical Eng. 109 (3), 458–482. doi:10.1061/(asce)0733-9410(1983)109:3(458
Shrestha, A., Gupta, M., and Ghani, S. (2024). Evaluating seismic resilience of steel buildings: integrating soil-structure interaction and ensemble modeling approaches. Model. Earth Syst. Environ., 1–26. doi:10.1007/s40808-024-02147-4
Shrestha, N., Gupta, M., Ghani, S., and Kushwaha, S. (2023). Enhancing seismic vulnerability assessment: a neural network effort for efficient prediction of multi-storey reinforced concrete building displacement. Asian J. Civ. Eng. 25, 2843–2865. doi:10.1007/s42107-023-00949-y
Sui, Q., Chen, Q., Wang, D., and Tao, Z. (2023). Application of machine learning to the Vs-based soil liquefaction potential assessment. J. Mt. Sci. 20 (8), 2197–2213. doi:10.1007/s11629-022-7809-4
Talamkhani, S., Naeini, S. A., and Ardakani, A. (2023). Prediction of static liquefaction susceptibility of sands containing plastic fines using machine learning techniques. Geotechnical Geol. Eng. 41 (5), 3057–3074. doi:10.1007/s10706-023-02444-2
Thapa, I., and Ghani, S. (2023). Estimation of California bearing ratio for hill highways using advanced hybrid artificial neural network algorithms. Multiscale Multidiscip. Model. Exp. Des. 7, 1119–1144. doi:10.1007/s41939-023-00269-3
Thapa, I., and Ghani, S. (2024a). Advancing earth science in geotechnical engineering: a data-driven soft computing technique for unconfined compressive strength prediction in soft soil. J. Earth Syst. Sci. 133, Article 159. doi:10.1007/s12040-024-02374-4
Thapa, I., and Ghani, S. (2024b). Enhancing unconfined compressive strength prediction in nano-silica stabilized soil: a comparative analysis of ensemble and deep learning models. Model. Earth Syst. Environ. 10, 5079–5102. doi:10.1007/s40808-024-02052-w
Thapa, I., Kumar, N., Ghani, S., Kumar, S., and Gupta, M. (2024a). Applications of bentonite in plastic concrete: a comprehensive study on enhancing workability and predicting compressive strength using hybridized AI models. Asian J. Civ. Eng. 25 (4), 3113–3128. doi:10.1007/s42107-023-00966-x
Thapa, I., Kumar, N., Ghani, S., Kumar, S., and Gupta, M. (2024b). Applications of bentonite in plastic concrete: a comprehensive study on enhancing workability and predicting compressive strength using hybridized AI models. Asian J. Civ. Eng. 25, 3113–3128. doi:10.1007/s42107-023-00966-x
Umar, S. K., Samui, P., and Kumari, S. (2018). Reliability analysis of liquefaction for some regions of Bihar. IJGEE 9 (2), 23–37. doi:10.4018/IJGEE.2018070102
Wang, J.-S., Hwang, J.-H., Deng, Y.-C., and Lu, C.-C. (2023). Model uncertainties of SPT, CPT, and VS-based simplified methods for soil liquefaction assessment. Bull. Eng. Geol. Environ. 82 (7), 260. doi:10.1007/s10064-023-03300-6
Yilmaz, C., Silva, V., and Weatherill, G. (2021). Probabilistic framework for regional loss assessment due to earthquake-induced liquefaction including epistemic uncertainty. Soil Dyn. Earthq. Eng. 141, 106493. doi:10.1016/j.soildyn.2020.106493
Youd, T. L., and Idriss, I. M. (2001). Liquefaction resistance of soils: summary report from the 1996 NCEER and 1998 NCEER/NSF workshops on evaluation of liquefaction resistance of soils. J. Geotechnical Geoenvironmental Eng. 127 (4), 297–313. doi:10.1061/(asce)1090-0241(2001)127:4(297)
Youd, T. L., and Perkins, D. M. (1978). Mapping liquefaction-induced ground failure potential. J. Geotechnical Eng. Div. 104 (4), 433–446. doi:10.1061/ajgeb6.0000612
Keywords: liquefaction risk, dynamic cone penetration test (DCPT), machine learning, sustainable infrastructure, seismic risk assessment, resilient infrastructure
Citation: Singh SV and Ghani S (2024) A smarter approach to liquefaction risk: harnessing dynamic cone penetration test data and machine learning for safer infrastructure. Front. Built Environ. 10:1495472. doi: 10.3389/fbuil.2024.1495472
Received: 12 September 2024; Accepted: 14 October 2024;
Published: 25 October 2024.
Edited by:
Jitendra Khatti, Rajasthan Technical University, IndiaReviewed by:
Anil Choudhary, National Institute of Technology, Jamshedpur, IndiaPuspendu Ray, Indian Institute of Engineering Science and Technology, Shibpur, India
Copyright © 2024 Singh and Ghani. This is an open-access article distributed under the terms of the Creative Commons Attribution License (CC BY). The use, distribution or reproduction in other forums is permitted, provided the original author(s) and the copyright owner(s) are credited and that the original publication in this journal is cited, in accordance with accepted academic practice. No use, distribution or reproduction is permitted which does not comply with these terms.
*Correspondence: Sufyan Ghani, c3VmeWFuLmdoYW5pQHNoYXJkYS5hYy5pbg==
 Shubhendu Vikram Singh
 Sufyan Ghani