 Qing-Yu Duan
 Qiang Wang*
- School of Civil Engineering, Shenyang Jianzhu University, Shenyan, Liaoning, China
Introduction: With the large-scale construction of high-rise and super high-rise buildings, structures combining ultra-high strength concrete and steel sections are increasingly applied in practical engineering.
Methods: Accurately predicting the elastoplastic behavior of frame structures containing steel-reinforced ultra-high performance concrete (SRUHPC) components is crucial for assessing the seismic safety and studying the collapse performance of buildings with such components. To expand the application range of the SRC-SFM based on DEM (Discrete Element Method), this paper introduces a UHPC constitutive model based on SRC-SFM, constructing an SFM suitable for SRUHPC components. On this basis, it also achieves the establishment of a comprehensive SRHSC model. The SRUHPC SFM model is further validated through comparisons with the hysteretic performance of SRUHPC components and plane frames of different stories.
Results: Comprehensive indicators including hysteretic curves, stress-strain relationships of various fibers at the column base, energy dissipation curves, and stiffness degradation curves prove that SRUHPC-SFM can be used to simulate the hysteretic performance of SRUHPC components and SRUHPC plane frames.
Discussion: This extends the application of DEM in studying the non-linear mechanical properties of structures containing SRUHPC components before collapse, laying a solid foundation for accurate simulation of the entire collapse process of structures containing SRUHPC components using DEM.
1 Introduction
As modern architecture advances toward taller, longer-span, and lighter structures, the application of ultra-high-performance concrete (UHPC) is becoming an inevitable trend (Zhang and Lin, 2015). UHPC was initially used in concrete-filled steel tube (CFST) columns because the confinement provided by the steel tube can improve the brittleness of UHPC. In the Tokyo Techno-Station building, the application of UHPC with a cube compressive strength of 160 MPa in CFST columns resulted in a 37% reduction in cross-sectional area compared to CFST columns made of conventional materials. This effectively saved building space, reduced the building mass, and significantly enhanced economic benefits (Liew et al., 2016).
Compared to conventional reinforced concrete columns, steel-concrete composite columns offer superior structural performance, effectively reducing the cross-sectional dimensions of structural columns and providing greater useable space in buildings. Compared to steel columns, steel-concrete composite columns exhibit excellent corrosion and fire resistance, making them widely used in super high-rise building structures. The application of UHPC in steel-concrete composite columns aims to significantly enhance the load-bearing capacity of the components without increasing, or even reducing, the cross-sectional area of vertical members. However, as the strength of concrete increases, its brittleness becomes more pronounced, and it is more prone to spalling under fire conditions. Previous studies on UHPC material properties have shown that the incorporation of a certain amount of steel fibers can enhance the ductility of UHPC (Jiao et al., 2005), while the addition of polypropylene fibers can effectively prevent spalling of UHPC at high temperatures (Chen and Liu, 2004; Han et al., 2005). UHPC with a strength grade of C120 has already been successfully pumped for high-rise construction in the Guangzhou East Tower project (Zhang and Lin, 2015).
Scholars have conducted research on steel reinforced ultra-high-performance concrete (SRUHPC) components and structures containing SRUHPC components (Huicun et al., 2015; Liu et al., 2015; Chen et al., 2013). Ellobody et al. (2011), Ellobody and Young (2011) used ABAQUS finite element simulation software to perform parametric analyses on steel-concrete composite columns with concrete cylinder compressive strengths ranging from 30 to 110 MPa. They studied the effects of steel yield strength, concrete strength, and slenderness ratio on the load-bearing capacity of axially and eccentrically loaded steel-concrete composite columns. Kim et al. (2012), Kim et al. (2014) conducted axial compression tests on SRUHPC components of varying strengths and investigated their load-bearing capacities. Zheng et al., (2014), Jia et al. (2016), Zhang et al. (2015) conducted quasi-static tests on both SRUHPC components and planar frame models containing SRUHPC components. These tests examined the hysteretic performance of the components and frames under different axial compression ratios and shear span ratios. However, current experimental and numerical studies on SRUHPC components and frames are mostly focused on their mechanical behavior under non-large deformation conditions. Under unexpected seismic events, buildings containing SRUHPC components may enter a strongly nonlinear stress state, potentially leading to component failure, fracture, and even structural collapse. Numerical simulation techniques can be employed to study the collapse process of buildings with SRUHPC components. This research can help identify the failure modes and collapse mechanisms of such structures, providing valuable recommendations for improving the collapse safety of SRUHPC building structures.
To study the mechanical behavior of components after fracture and structural collapse, scholars have employed the Discrete Element Method (DEM) of discontinuous media mechanics to study these phenomena. Meguro and Tagel-din (2000), Meguro and Tagel-Din (2001), Kuroda et al. (2004), Christy et al. (2021) proposed an applied element method based on DEM and utilized it for collapse analysis of masonry and reinforced concrete (RC) structures. Gu et al. (2014) and Wang et al. (2020) developed a beam-column fiber model based on DEM, which was applied to the simulation of the entire collapse process of RC (Reinforced Concrete) structures as well as the dynamic elastoplastic analysis of SRC (Steel Reinforced Concrete) building structures. Due to the lack of corresponding constitutive models for SRUHPC components in the existing SRC-SFM, it is not yet possible to accurately simulate the mechanical properties of SRHSC components, let alone simulate the collapse and failure of SRHSC structures.
To expand the application range of the SRC-SFM based on DEM, this paper introduces a UHPC constitutive model based on SRC-SFM, constructing an SFM suitable for SRUHPC components. On this basis, it also achieves the establishment of a comprehensive SRUHPC model, aiming to accurately simulate the hysteretic performance of SRUHPC beam-column components and SRUHPC plane frames. This lays the foundation for DEM to be used in the precise simulation of the entire collapse process of SRHSC building structures.
2 Concrete constitutive relationships
Over the past century, significant advancements have been made in the study of confined concrete (Wen-Feng and Ying, 2007). Several classical confinement models have been established, including the Kent-Park model (Kent and Park, 1971), the Sheikh model (Sheikh and Uzumeri, 1982), the Mander model (Mander et al., 1988), the Guo model (Gao and Shi, 2007), the Cusson-Paultre model (Cusson and Paultre, 1995), and the Razvi-Saatcioglu model (Razvi and Saatcioglu, 1999), with research gradually focusing on high-strength and high-performance concrete (Wakjira and Alam, 2024a; Naeimi and Moustafa, 2021; Wakjira et al., 2024; Wakjira and Alam, 2024b). Regarding the Mander model, El-Tawil (EI-Tawil and Deierlein, 1996) and others made rational adjustments to its constitutive parameters, allowing it to simultaneously consider the combined confinement effects of stirrups and steel sections on the concrete. Based on this, the Mander model is selected in this paper as the constitutive model for the concrete in SRUHPC components.
The ascending branch of the stress-strain relationship curve for confined concrete follows the traditional Mander model, as shown in Equation 1
In the equation:
EI-Tawil and Deierlein (1996) pointed out that when the concrete strength is relatively high, particularly for ultra-high-strength concrete, the peak compressive strain in the Mander model tends to be overestimated. Through experimental studies and error analysis, they concluded that when the concrete strength exceeds 55 MPa (especially for ultra-high-strength concrete with compressive strengths exceeding 100 MPa), it is advisable to use the following equation to calculate the peak compressive strain of confined concrete, as shown in Equation 2.
For the descending branch (Collins et al., 1993), it follows the expression shown in Equations (3) and (4):
The method for calculating the confinement effect of stirrups on concrete can be specifically referenced from the literature EI-Tawil and Deierlein (1996), and the method for calculating the confinement effect of steel sections on concrete can be referenced from the literature EI-Tawil and Deierlein (1996).
Since the aforementioned methods require dividing the concrete cross-section in SRUHPC components into different regions according to their varying confinement effects. This paper simplifies the model by merging the different confined regions. The strength enhancement factor k for the Mander model is then processed using an area-weighted averaging method, as shown in Equation 5.
In the equation,
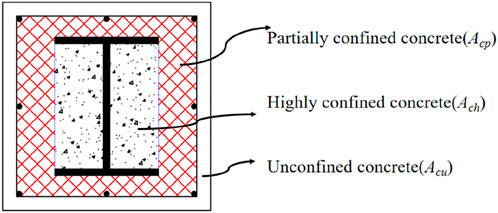
Figure 1. Simplified calculation diagram for confined concrete.
Additionally,
The simplified, single cross-section stress-strain curve for confined concrete in compression, along with the stress-strain curves for concrete under different confinement effects in compression, are shown in Figure 2.

Figure 2. Theoretical stress-strain curves of confined concrete in different regions.
In this study, only the influence of the confinement effect on the compressive stress-strain skeleton curve of concrete is considered. The uniaxial tensile stress-strain relationship of concrete and the uniaxial tension-compression loading and unloading rules are still determined according to the literature (Wang et al., 2018).
3 Constitutive relationship of steel
To meet different computational requirements, this paper adopts the steel constitutive model USR3 (Wang et al., 2013) as the constitutive models for the steel and reinforcement.
For the USR3 constitutive model, the monotonic loading curve for steel and reinforcement is the Esmaeily-Xiao model (Esmaeily and Xiao, 2005), as shown in Equation 6. The tensile segment is taken as an example, as shown in Figure 3A.
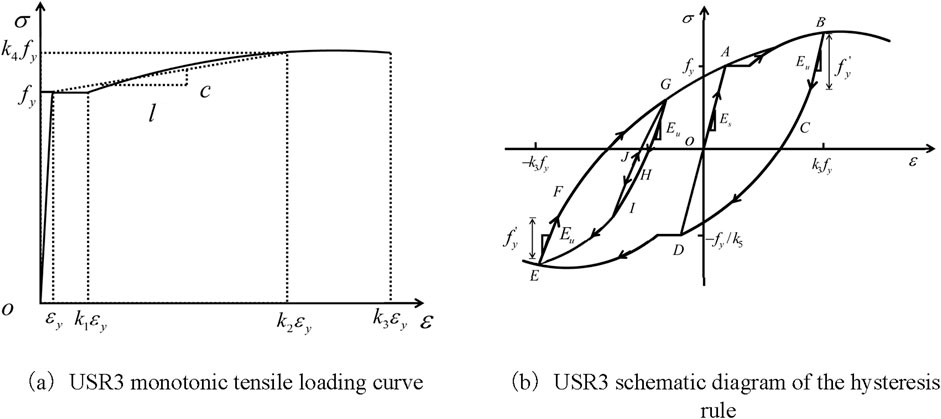
Figure 3. Intrinsic Modeling of Steel. (A) USR3 monotonic tensile loading curve (B) USR3 schematic diagram of the hysteresis rule.
In the equation,
The loading and unloading curves adopt the Légeron model (LéGeron and Paultre, 2003), and consider the unloading modulus decreasing as the maximum strain experienced increases, with reference to the model of Dodd L.L (Dodd and Restrepo-Posada, 1995), as shown in Figure 3B, And USR3 is able to better describe the Bauschinger effect of steel materials.
4 Fiber modeling of SRUHSC member rod segments
To accurately represent the interactions between concrete, reinforcement, and steel sections in SRUHPC components, this paper utilizes the SRC-SFM beam-column fiber model, which is suitable for SRC components and is part of the DEM-COLLAPSE (Duan et al., 2024) software library. The cross-section and element configuration are illustrated in Supplementary Figures S1, S2.
The RC-SFM model divides the component along its length into multiple rigid body units. The length of these units can be determined based on the maximum dimension of the cross-section. To better describe the plastic hinge effect at the component ends, the length of the end units is set to 0.5 times the cross-section dimension.
As for the division of the cross-section units, they can be divided into a 5 × 5 or 7 × 7 grid depending on the size of the cross-section. (It should be noted that dividing the cross-section into a 9 × 9 grid or more does not significantly improve calculation accuracy but greatly reduces computational efficiency.) Different types of fiber bundles are used to connect between the units, as shown in Figure 5.
The calculation process for the SRC-SFM within DEM-COLLAPSE is illustrated in Supplementary Figure S3.
By connecting the SRC-SFM beam-column fibers through different node types, an SRC-SFM frame model can be formed, as shown in Figure 4.
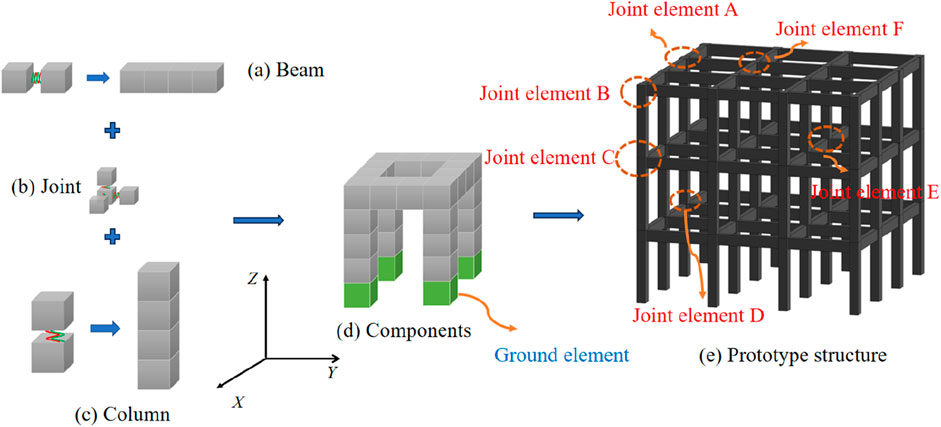
Figure 4. SRUHSC frame model assembly diagram.
5 Numerical simulation
To validate the rationality of the SRC-SFM and the proposed constitutive models in this paper, hysteretic test simulations are conducted on SRUHSC columns, two single-story single-span SRUHSC frames, and one three-story two-span SRUHSC frame, respectively.
5.1 SRUHPC columns
This paper selects three H-shaped steel SRUHPC columns with different steel section sizes and axial compression ratios from the hysteretic tests in reference (Zheng et al., 2014) to simulate and analyze their hysteretic performance. The concrete uses the code-specified constitutive model, while the steel uses the USR3 constitutive model. The dimensions and test parameters of each specimen are shown in Supplementary Figure S4 and Table 1, and the key modeling parameters of the DEM model are presented in Table 2.
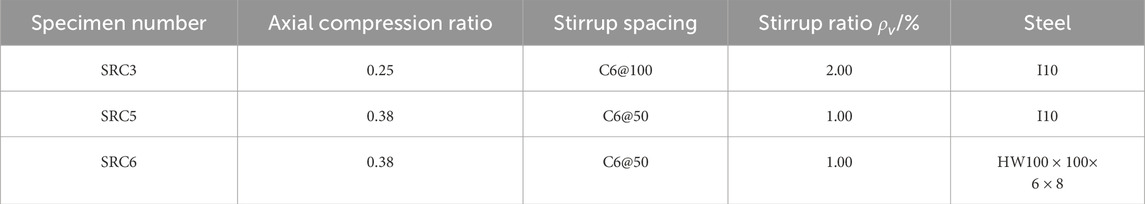
Table 1. Main parameters of test pieces.
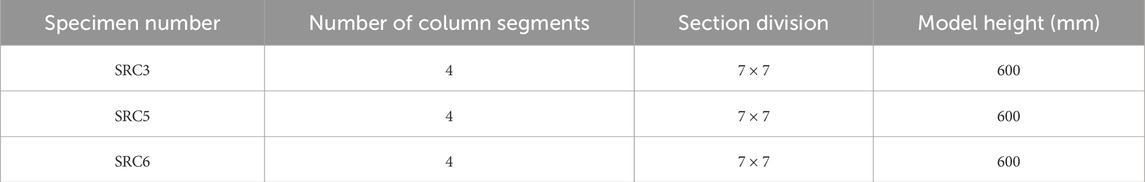
Table 2. Main parameters of DEM model.
Figure 5 shows the comparison between simulation results and experimental results for three components. Upon analyzing the simulation results of the three specimens, it was found that the simulated curves for all three specimens exhibited the following characteristics: When the displacement is small, the bearing capacity and stiffness calculated by the simulation are higher than the experimental values. This is particularly noticeable in SRC-6. However, as the displacement increases, the simulated results gradually approach the experimental results. Regarding the curve shape, both SRC-3 and SRC-6 are able to present a pinching effect that closely resembles the experimental results. For SRC-5, the pinching effect is less pronounced in the last cycle of hysteretic loading, which slightly deviates from the experimental curve. In terms of ultimate bearing capacity, SRC-3 and SRC-5 match well with the experimental values. However, SRC-6 shows a slight discrepancy in the negative region of ultimate bearing capacity compared to the experimental value. Due to the larger steel section area in SRC-6 compared to SRC-3 and SRC-5, the overall stiffness of the SRC-6 specimen is greater. This leads to a more significant difference in early-stage stiffness and bearing capacity compared to the experimental results. During the research process using this model, it was discovered that when simulating components with smaller slenderness ratios, the aforementioned phenomenon occurs. This is because the shear performance of SRC components is more pronounced, and in this model, the shear constitutive models for both concrete fibers and steel fibers are assumed to be elastic.
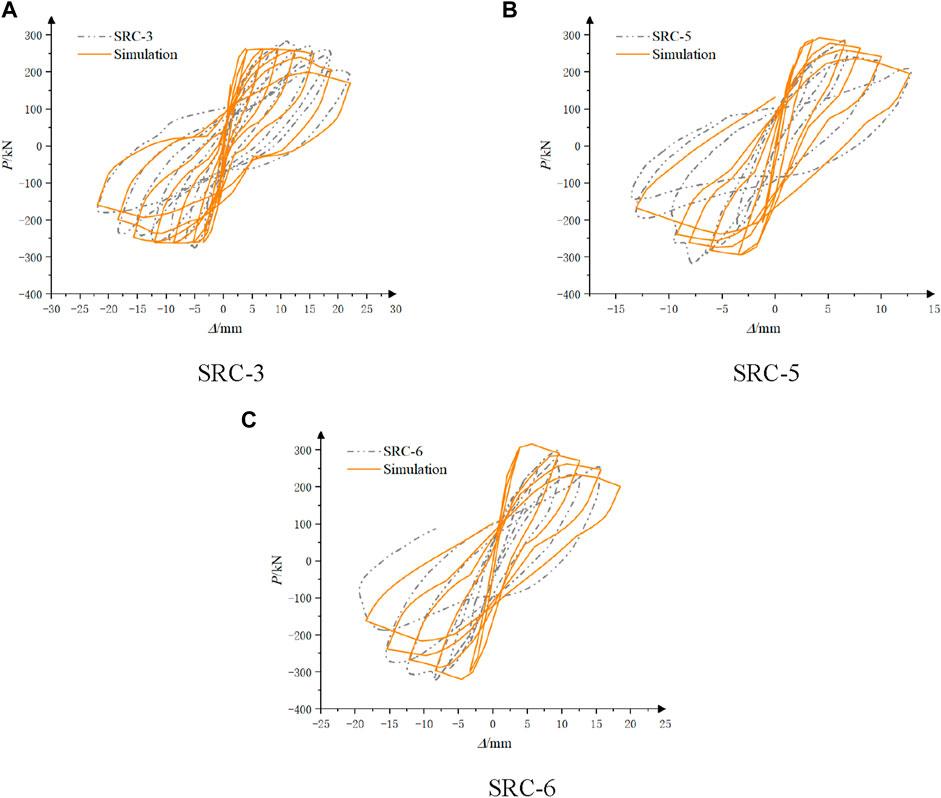
Figure 5. Comparison of SRC column hysteresis curves for different calculation conditions. (A) SRC-3 (B) SRC-5 (C) SRC-6.
Figure 6 shows the stress-strain relationships of various fibers at the column base of component SRC-3. Comparing with the experimental phenomena, it was observed that after loading, SRC-3 exhibited severe spalling of the concrete protective layer at the column base and significant deformation of longitudinal reinforcement. However, no significant damage was observed in the core concrete area, and the steel section did not show severe deformation. When comparing the stress-strain relationships of various fibers at the column base, it can be seen that these relationships accurately describe the aforementioned experimental phenomena. This further verifies the rationality of the model and the accuracy of the constitutive model at the microscopic level.
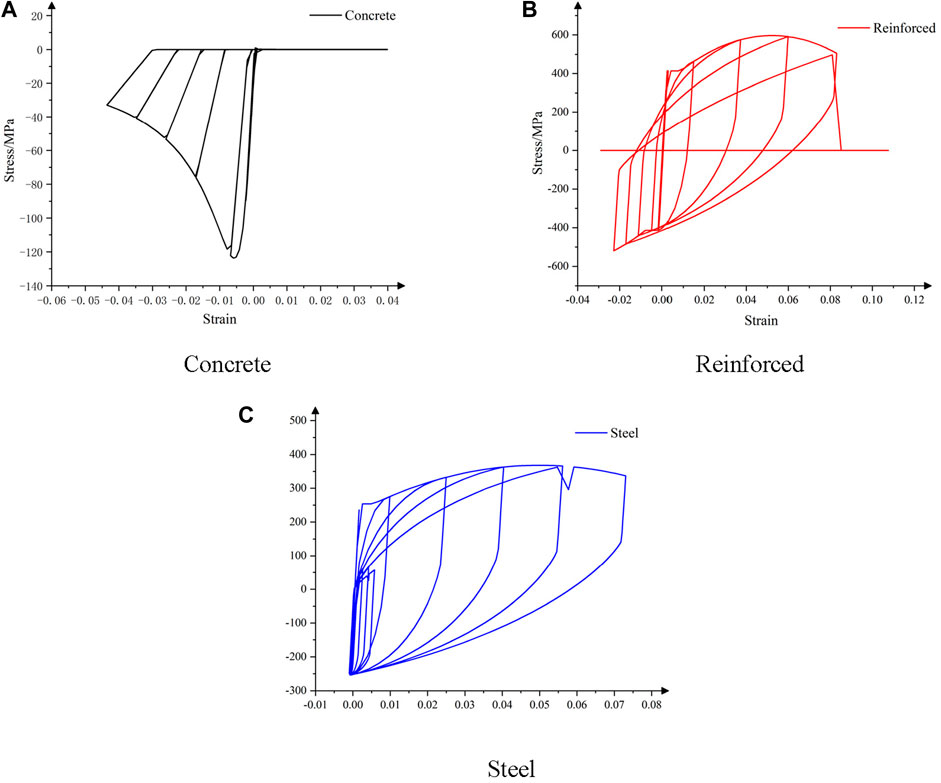
Figure 6. The stress-strain curves for various fibers at the column bottom. (A) Concrete (B) Reinforced (C) Steel.
Table 3 presents a comparison of peak bearing capacities between the experimental and simulated curves. The smallest error is found in the positive peak bearing capacity of component SRC-5, with a value of 1.09%. The largest error is observed in the positive peak bearing capacity of component SRC-3, with a value of 7.95%. However, all errors fall within the allowable range, which further reflects the rationality of the model in terms of peak bearing capacity.
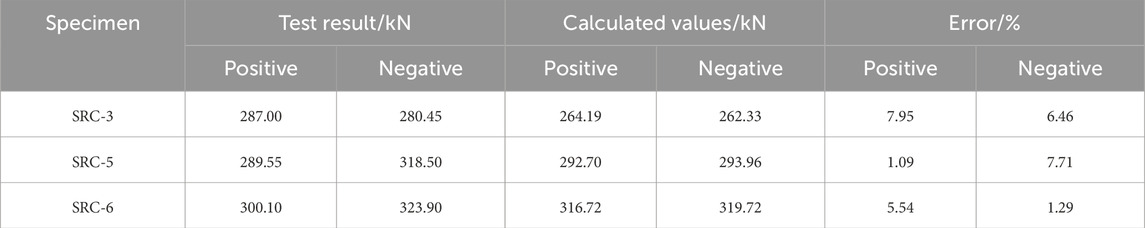
Table 3. Component size and experimental parameters.
By comparing the hysteretic curves, the stress-strain relationships of various fibers at the column base, and the peak bearing capacities, it can be concluded that the SRC-SFM model, combined with the constitutive models of various parts, can effectively simulate the hysteretic performance of SRUHPC components. This model can be used for further analysis in the next step.
5.2 Single-story, single-span SRUHPC frame
The specimens in reference (Jia et al., 2016) are designed with a prototype ratio of 1:2, and the column-to-beam section strength ratio is 1.2. The calculated column heights are 1200 mm and 800 mm, and the calculated span is 2000 mm. The columns use C100 concrete, while the beams use C40 concrete. The column section dimensions are 200 mm × 200 mm, and the beam section dimensions are 160 mm × 200 mm. The columns use composite stirrups with a spacing of 60 mm, and the beams use rectangular stirrups with a spacing of 60 mm. The spacing of the composite stirrups in the joint core area is 50 mm. The design adopts a strong joint and weak member approach. In the specimen design process, the frames with shear-span ratios of 2 and 3 have identical internal configuration, and the specific section types and arrangement are shown in Supplementary Figure S5, while the material parameters are listed in Table 4, and the key modeling parameters of the DEM model are presented in Table 5.
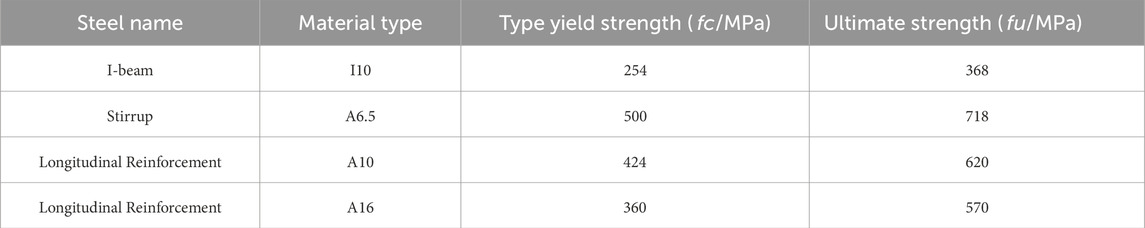
Table 4. Steel material properties.
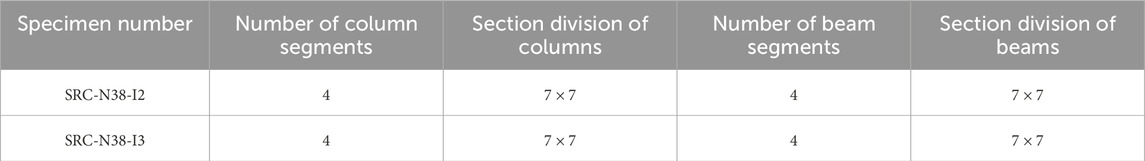
Table 5. Main parameters of DEM model.
According to the DEM modeling method in Section 3.3, the experimental components can be modeled as shown in Supplementary Figure S6. In the above models, only the main structural parts of the experimental components are considered, while the base part is ignored, and rigid constraints are applied to the bottom.
By comparing the modeling results of the main structural parameters using this method, the geometric shape and topological information of the structural models are relatively consistent, which can relatively well restore the dimensions of the specimens and the positions of various internal components within the specimens.
According to the experimental data obtained from reference (Jia et al., 2016), the hysteretic curves of the single-story single-span SRC frame calculated by DEM are shown in Figure 7.
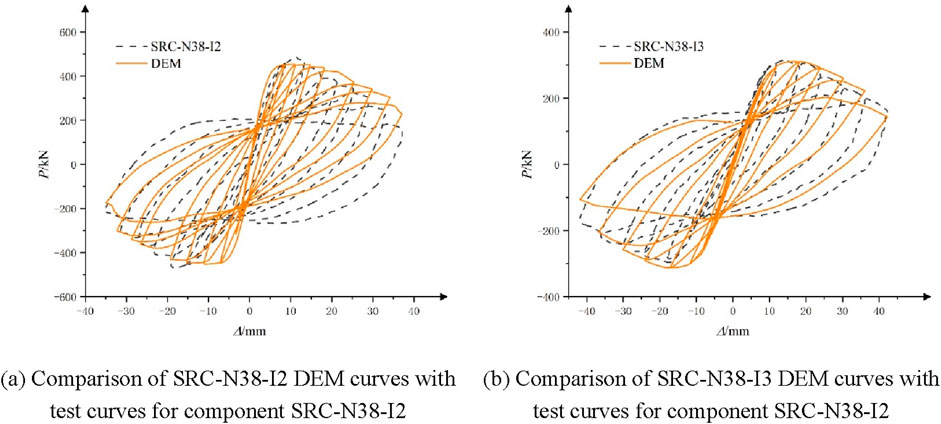
Figure 7. Comparison of hysteresis experiments for one-story, one-span SRC frames. (A) Comparison of SRC-N38-I2 DEM curves with test curves for component SRC-N38-I2. (B) Comparison of SRC-N38-I3 DEM curves with test curves for component SRC-N38-I2.
From Figure 7, it can be observed that the overall trend of the DEM simulation curve is consistent with the experimental curve. Moreover, both curves are relatively close in terms of peak bearing capacity and peak displacement. Regarding peak bearing capacity: For specimen SRC-N38-I2, the peak bearing capacity of the experimental curve is 475.30 kN, while that of the DEM simulation curve is 452.30 kN, resulting in an error of 4.84%. For specimen SRC-N38-I3, the peak bearing capacity of the experimental curve is 317.28 kN, whereas the ultimate bearing capacity of the DEM simulation curve is 311.70 kN, with errors of 1.45% and 1.70% respectively. Concerning peak displacement: For specimen SRC-N38-I2, the peak displacement of the experimental curve is 10.77 mm, while that of the DEM simulation curve is 11.22 mm, resulting in an error of 4.18%. For specimen SRC-N38-I3, the peak displacement of the experimental curve is 17.18 mm, whereas the ultimate bearing capacity of the DEM simulation curve corresponds to a displacement of 18.13 mm, leading to an error of 5.53%.
Figure 8 shows the comparison of energy dissipation curves. From this figure, it can be observed that: For specimen SRC-N38-I2, the maximum error between the simulated and experimental results occurs at 33.12 mm, with a difference of 5.59. The trend of the curve indicates that the error increases as displacement increases. For specimen SRC-N38-I3, the maximum error between the simulated and experimental results occurs at 36.15 mm, with a difference of 8.09. Similarly, the error tends to increase with displacement. However, at 42.32 mm, the error suddenly decreases to 3.43. This phenomenon is attributed to the smaller shear span ratio of SRC-N38-I3. During the loading process, as the SRC-SFM model does not consider the shear nonlinearity between concrete and steel sections, the energy dissipation capacity of components with smaller shear span ratios, such as SRC-N38-I3, shows larger errors compared to the experimental results. However, due to its smaller shear span ratio, SRC-N38-I3 experiences a significant drop in energy dissipation capacity during the loading process, leading to a sudden decrease in error at the final stage. Overall, the energy dissipation capacity of components with larger shear span ratios more closely matches the experimental results.
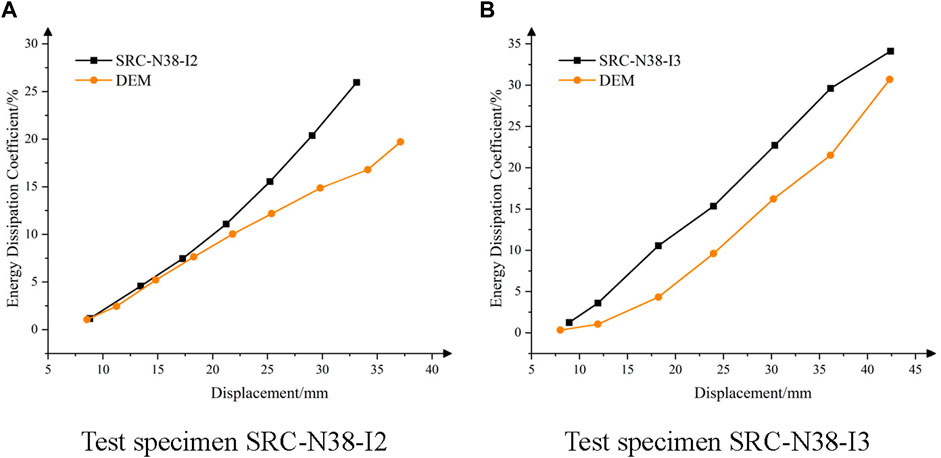
Figure 8. Energy ratio curve. (A) Test specimen SRC-N38-I2 (B) Test specimen SRC-N38-I3.
Figure 9 presents the comparison of stiffness degradation curves. Due to the larger shear span ratio of SRC-N38-I2, its initial stiffness is relatively low. For the same reasons mentioned above, there is a significant discrepancy between the simulated and experimental results in the early-stage stiffness. However, as loading progresses, this error gradually decreases. For SRC-N38-I3, which has a smaller shear span ratio, the initial stiffness ratio differs less from the experimental value. However, as loading continues to the middle range, the error gradually increases, but then decreases again as loading further progresses. When comparing the overall curves, it is found that the simulation effect for SRC-N38-I2, which has a larger shear span ratio, is better.
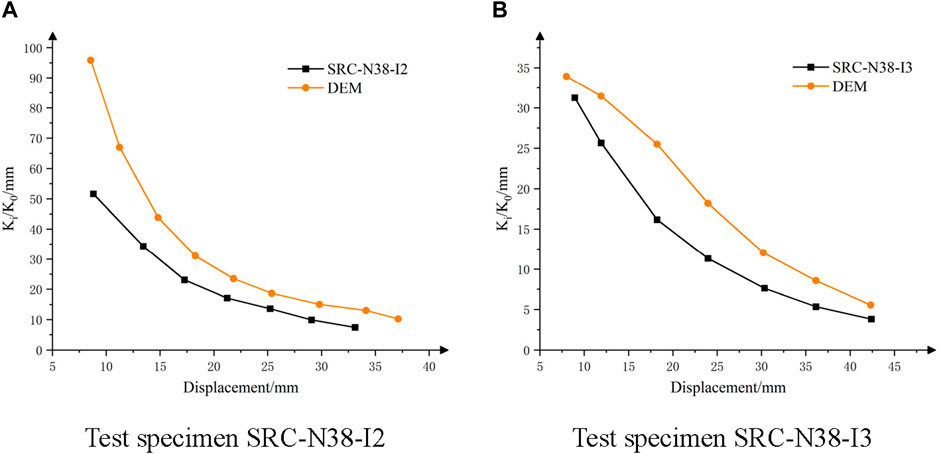
Figure 9. Stiffness degradation curve. (A) Test specimen SRC-N38-I2 (B) Test specimen SRC-N38-I3.
Based on a comprehensive analysis of the hysteretic curves, energy dissipation curves, and stiffness degradation curves, the following conclusions can be drawn: Although the simulation effect for components with smaller shear span ratios is slightly inferior to that of components with larger shear span ratios, the overall simulation results for both are considered to be quite satisfactory when compared. The one-story, one-bay plane frame model of the SRC-SFM component, when combined with the corresponding constitutive models, is capable of effectively simulating the hysteretic performance of the experimental components. This model can be used for further analysis.
5.3 Three-story, two-span SRC frame
To further verify the reasonableness and reliability of the SRUHSC-SFM frame model, the hysteresis performance of a three-story, two-span SRUHSC frame under low-cycle reversed horizontal loading was numerically simulated using the DEM.
A 1:4 scale model of a three-story, two-span steel structure ultra-high-strength concrete frame was used in this experiment. In this model, ordinary strength C40 concrete was used for the beams, while ultra-high-strength C100 concrete was used for the columns. The dimensions of the specimens, as well as the specific arrangement of the steel bars, are shown in Supplementary Figure S7. The axial compression ratio limit for the columns was set at 0.75. Thus, the experimental axial compression ratio for the middle columns was 0.38, while that for the edge columns was half of that for the middle columns, namely, 0.19 (with the edge columns bearing a load of 800 kN and the middle columns bearing a load of 1,600 kN) (Zhang et al., 2015). The key modeling parameters of the DEM model are presented in Table 6.

Table 6. Main parameters of DEM model.
According to the DEM modeling method in Section 4, the experimental components can be modeled as shown in Supplementary Figure S8. In the above models, only the main structural parts of the experimental components are considered, while the base part is ignored, and rigid constraints are applied to the bottom.
Figure 10 shows the hysteretic curve of the overall frame. Analysis of the figure reveals: The peak bearing capacity of the experimental curve is 324.69 kN, while that of the numerical simulation curve is 327.72 kN. The error between these two values is 0.92%. Figures 11, 12 represent the energy dissipation curve and stiffness degradation curve corresponding to the hysteretic curve. For the energy dissipation curve, the overall trend shows an increasing discrepancy between the simulation and experimental results. The maximum error occurs at 126.68 mm, with a value of 1.69. Regarding the stiffness degradation curve, the overall trend also indicates an increasing difference between the simulation and experimental results. The maximum error is observed at 126.68 mm, with a value of 0.13.
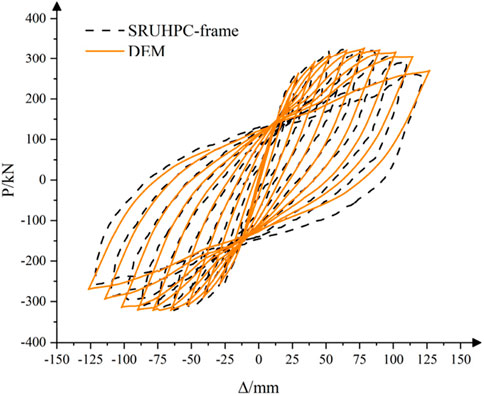
Figure 10. Hysteresis curve of SRUHPC-Frame.
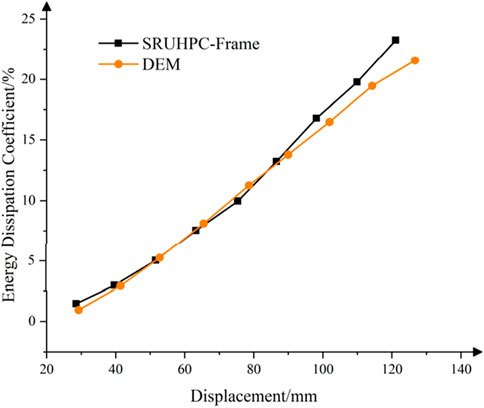
Figure 11. Energy ratio curve of SRUHPC-Frame.
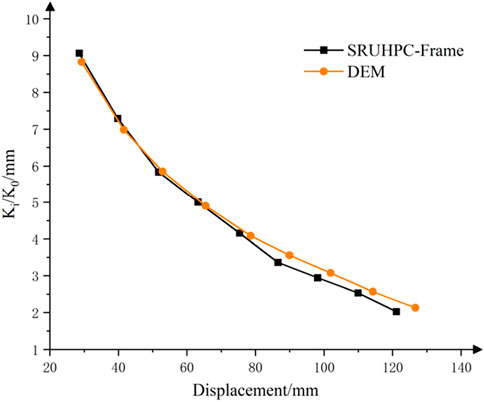
Figure 12. Stiffness degradation curve of SRUHPC-Frame.
An analysis of the inter-story hysteretic curves and a comparison of the ultimate displacements for each floor reveals, as shown Figures 13. For the 1st floor, the ultimate displacement of the experimental curve is 60.12 mm, while that of the DEM simulation curve is 95.42 mm, resulting in an error of 36.99%. For the 2nd floor, the ultimate displacement of the experimental curve is 43.25 mm, while that of the DEM simulation curve is 41.76 mm, with an error of 3.45%. For the 3rd floor, the ultimate displacement of the experimental curve is 28.06 mm, while that of the DEM simulation curve is 36.86 mm, leading to an error of 23.87%. These errors are attributed to the DEM model not including the modeling of the base and the upper loading beam. Consequently, the inter-story displacements of the 1st and 3rd floors show larger errors compared to the experiment, while the 2nd floor’s inter-story displacement shows a smaller error. Although the DEM model omits the modeling of some components, this does not significantly affect the simulation of the overall hysteretic curve.
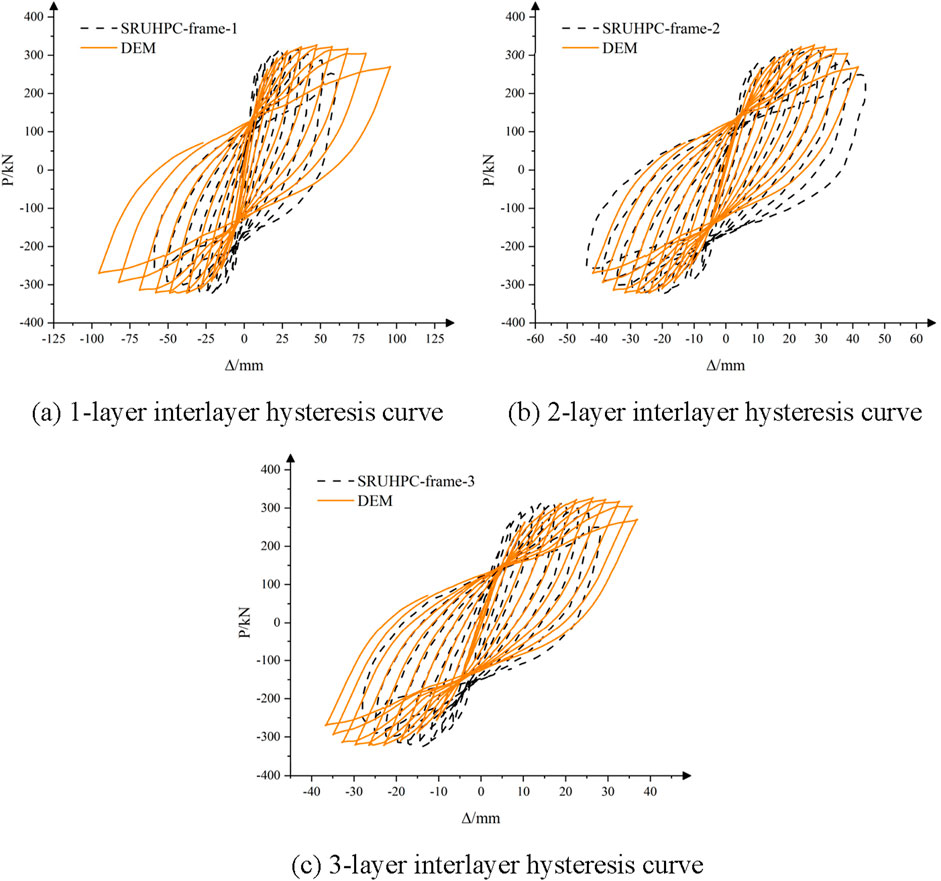
Figure 13. Interlayer hysteresis curves for each layer. (A) 1-layer interlayer hysteresis curve (B) 2-layer interlayer hysteresis curve (C) 3-layer interlayer hysteresis curve.
Combining the analysis of the overall hysteretic curve, overall energy dissipation curve, overall stiffness degradation curve, and the inter-story hysteretic curves for each floor, a comparison between the DEM simulation results and experimental results indicates that the multi-story plane frame model composed of SRC-SFM, along with the corresponding UHPC constitutive model and steel constitutive model, can effectively simulate the hysteretic performance of the SRUHPC multi-story plane frame.
6 Conclusion
Based on the existing SRC-SFM, this paper introduces a UHPC constitutive model suitable for SRUHPC components. Through comparative verification with SRUHSC components, SRUHPC single-story plane frames, and SRUHPC multi-story plane frames hysteretic tests, the following conclusions are drawn:
(1) The UHPC constitutive model and steel model introduced in this paper, when combined with SRC-SFM, not only reflect the true experimental phenomena at the stress-strain level but also effectively simulate the hysteretic performance at the component level.
(2) When simulating the hysteretic experiments of single-story SRUHPC frames with different shear span ratios, due to the linear shear constitutive models adopted for concrete and steel sections in SRC-SFM, there are some discrepancies in the stiffness degradation curve and energy dissipation curve compared to the experimental results. However, when evaluating the overall hysteretic curve, the simulation effect for the single-story SRUHPC frame hysteretic test is acceptable.
(3) In simulating the hysteretic experiment of a three-story, two-bay SRUHPC plane frame, the omission of the base and upper loading beam in the modeling process significantly affects the simulation of the inter-story hysteretic curves for the 1st and 3rd floors. However, the inter-story simulation curve for the 2nd floor closely matches the experiment. Furthermore, this modeling approach does not affect the simulation results of the overall frame, which are quite satisfactory.
In conclusion, it is proven that DEM can be used to simulate the hysteretic performance of SRUHPC components and SRUHPC plane frames. This extends the application of DEM in studying the non-linear mechanical properties of structures containing SRUHPC components before collapse, laying a solid foundation for accurate simulation of the entire collapse process of structures containing SRUHPC components using DEM.
This paper mainly focuses on the accuracy of DEM in simulating the non-linear mechanical properties of SRUHPC structures before collapse. However, it does not address the subsequent use of DEM for dynamic elastoplastic analysis of SRUHPC structures and accurate simulation of the entire collapse process. In future research work, accurately simulating the entire collapse process of SRUHPC structures will be of paramount importance.
Data availability statement
The original contributions presented in the study are included in the article/Supplementary Material, further inquiries can be directed to the corresponding author.
Author contributions
Q-YD: Data curation, Writing–original draft, Writing–review and editing. QW: Conceptualization, Investigation, Software, Supervision, Writing–review and editing. C-XY: Writing–original draft.
Funding
The author(s) declare that no financial support was received for the research, authorship, and/or publication of this article.
Conflict of interest
The authors declare that the research was conducted in the absence of any commercial or financial relationships that could be construed as a potential conflict of interest.
Publisher’s note
All claims expressed in this article are solely those of the authors and do not necessarily represent those of their affiliated organizations, or those of the publisher, the editors and the reviewers. Any product that may be evaluated in this article, or claim that may be made by its manufacturer, is not guaranteed or endorsed by the publisher.
Supplementary material
The Supplementary Material for this article can be found online at: https://www.frontiersin.org/articles/10.3389/fbuil.2024.1480817/full#supplementary-material
References
Chen, B., and Liu, J. (2004). Residual strength of hybrid-fiber-reinforced high-strength concrete after exposure to high temperatures. Cem. Concr. Res. 34, 1065–1069. doi:10.1016/j.cemconres.2003.11.010
Chen, Z., Wang, N., Zhong, M., Xue, J., and Su, Y. (2013). Tests and finite element analysis on load carrying capacity of shaped columns of steel and concrete with positive section. J. Build. Struct. 34 (10), 108–119. doi:10.14006/j.jzjgxb.2013.10.013
Christy, D. L., Pillai, T. M. M., and Nagarajan, P. (2021) “Analysis of concrete beams using applied element method,” Advances in Civil Engineering: Select Proceedings of ARICE 2019. Springer Singapore, 507–516. doi:10.1007/978-981-15-5644-9_38
Collins, M. P., Mitchell, D., and MacGregor, J. G. (1993). Structural design considerations for high-strength concrete. Concr. Int. 15 (5), 27–34.
Cusson, D., and Paultre, P. (1995). Stress-strain model for confined high-strength concrete. J. Struct. Eng. 121, 468–477. doi:10.1061/(asce)0733-9445(1995)121:3(468)
Dodd, L. L., and Restrepo-Posada, J. I. (1995). Model for predicting cyclic behavior of reinforcing steel. J. Struct. Eng. 121 (3), 433–445. doi:10.1061/(asce)0733-9445(1995)121:3(433)
Duan, Q., Wang, Q., and Yang, C. (2024). Development and validation of a segment fiber model for simulating seismic collapse in steel-reinforced concrete structures using the discrete element method. Buildings 14 (9), 2593. doi:10.3390/buildings14092593
Ei-Tawil, S. M., and Deierlein, G. G. (1996). Fiber element analysis of composite beam-column cross-sections[G]. New York: Cornell University.
Ellobody, E., and Young, B. (2011). Numerical simulation of concrete encased steel composite columns. J. Constr. Steel Res. 67 (2), 211–222. doi:10.1016/j.jcsr.2010.08.003
Ellobody, E., Young, B., and Lam, D. (2011). Eccentrically loaded concrete encased steel composite columns. Thin-Walled Struct. 49, 53–65. doi:10.1016/j.tws.2010.08.006
Esmaeily, A., and Xiao, Y. (2005). Behavior of reinforced concrete columns under variable axial loads: analysis. Aci Struct. J. 102 (5), 736–744. doi:10.14359/14669
Gao, Z., and Shi, X. (2007). Principles and analysis of reinforced concrete. Beijing: Tsinghua University Press, 103–188.
Gu, X., Wang, X., Yin, X., Lin, F., and Hou, J. (2014). Collapse simulation of reinforced concrete moment frames considering impact actions among blocks. Eng. Struct. 65, 30–41. (65-Apr.15). doi:10.1016/j.engstruct.2014.01.046
Han, C.-G., Hwang, Y.-S., Yang, S.-H., and Gowripalan, N. (2005). Performance of spalling resistance of high performance concrete with polypropylene fiber contents and lateral confinement. Cem. Concr. Res. 35 (9), 1747–1753. doi:10.1016/j.cemconres.2004.11.013
Huicun, H., Cao, W., Wang, Y., Yang, Z., and Hu, J. (2015). Experimental study on compressive performance of rectangular section section steel and concrete columns. J. Build. Struct. 36 (Suppl. 2), 56–61. doi:10.14006/j.jzjgxb.2015.S2.009
Jia, J., Zhang, J., Guo, Z., and Zhou, H. (2016). Experimental study on the seismic performance of steel-bone ultra-high-strength concrete column-steel-bone normal concrete beam combination frame. J. Build. Struct. 37 (12), 97–104. doi:10.14006/j.jzjgxb.2016.12.012
Jiao, C., Sun, W., Gao, P., and Jiang, J. (2005). Research on mechanical properties of steel fibre high-strength concrete. Concr. Cem. Prod. (3), 35–38. doi:10.3969/j.issn.1000-4637.2005.03.011
Kent, D. C., and Park, R. (1971). Flexural members with confined concrete. J. Struct. Div. 97, 1969–1990. doi:10.1061/jsdeag.0002957
Kim, C.-S., Park, H.-G., Chung, K.-S., and Choi, I.-R. (2012). Eccentric axial load testing for concrete-encased steel columns using 800 MPa steel and 100 MPa concrete. J. Struct. Eng. 138 (8), 1019–1031. doi:10.1061/(asce)st.1943-541x.0000533
Kim, C. S., ParK, H. G., Chung, K. S., and Choi, I. R. (2014). Eccentric axial load capacity of high-strength steel-concrete composite columns of various sectional shapes. J. Struct. Eng. 140 (4), 04013091. doi:10.1061/(asce)st.1943-541x.0000879
Kuroda, T., Meguro, K., and Worakanchana, K. (2004). Analysis of confining effect on failure behavior reinforced concrete structure[C]. Proc.13th WCEE(CD), 655–664.
LéGeron, F., and Paultre, P. (2003). Uniaxial confinement model for normal- and high-strength concrete columns. J. Struct. Eng. 129 (2), 241–252. doi:10.1061/(asce)0733-9445(2003)129:2(241)
Liew, J. Y. R., Xiong, M., and Xiong, D. (2016). Design of concrete filled tubular beam-columns with high strength steel and concrete. Structures 8, 213–226. doi:10.1016/j.istruc.2016.05.005
Liu, Y., Guo, Z., Xu, P., and Jia, L. (2015). Experimental study on axial compression performance of core steel and concrete columns. J. Build. Struct. 36 (4), 68–74.
Mander, J. B., Priestley, M. J. N., and Park, R. (1988). Theoretical stress strain model for confined concrete. J. Struct. Eng. 114, 1804–1826. doi:10.1061/(asce)0733-9445(1988)114:8(1804)
Meguro, K., and Tagel-din, H. (2000). Applied element method for structural analysis: theory and application for linear materials. Struct. Eng. Earthq. Eng. 17 (1), 21–35. doi:10.2208/jscej.2000.647_31
Meguro, K., and Tagel-Din, H. (2001). Applied element simulation of RC structures under cyclic loading. J. Struct. Eng. 127 (11), 1295–1305. doi:10.1061/(asce)0733-9445(2001)127:11(1295)
Naeimi, N., and Moustafa, M. A. (2021). Analytical stress–strain model for steel spirals-confined UHPC. Compos. Part C. Open Access 5, 100130. doi:10.1016/j.jcomc.2021.100130
Razvi, S., and Saatcioglu, M. (1999). Confinement model for high-strength concrete. J. Struct. Eng. 125 (3), 281–289. doi:10.1061/(asce)0733-9445(1999)125:3(281)
Sheikh, S. A., and Uzumeri, S. M. (1982). Analytical model for concrete confinement in tied columns. J. Struct. Div. 108 (12), 2703–2722. doi:10.1061/jsdeag.0006100
Wakjira, T. G., Abushanab, A., and Alam, M. S. (2024). Hybrid machine learning model and predictive equations for compressive stress-strain constitutive modelling of confined ultra-high-performance concrete (UHPC) with normal-strength steel and high-strength steel spirals. Eng. Struct. 304, 117633. doi:10.1016/j.engstruct.2024.117633
Wakjira, T. G., and Alam, M. S. (2024a). Peak and ultimate stress-strain model of confined ultra-high-performance concrete (UHPC) using hybrid machine learning model with conditional tabular generative adversarial network. Appl. Soft Comput. 154, 111353. doi:10.1016/j.asoc.2024.111353
Wakjira, T. G., and Alam, M. S. (2024b). Performance-based seismic design of Ultra-High-Performance Concrete (UHPC) bridge columns with design example–Powered by explainable machine learning model. Eng. Struct. 314, 118346. doi:10.1016/j.engstruct.2024.118346
Wang, Q., Chang, K., Hou, K., and Hao, L. (2018). Uniaxial constitutive model of concrete for beam elements in ABAQUS. J. Archit. Civ. Eng. 35 (5), 194–202. doi:10.11717/j.issn:2095-1922.2020.01.05
Wang, Q., Lu, J., Hou, K., and Hao, L. (2020). Research on the member segment fiber model based on the discrete element method. J. Shenyang Jianzhu Univ. Nat. Sci. 36 (01), 38–47. doi:10.11717/j.issn:2095-1922.2020.01.05
Wang, Q., Zhu, L., Zhe, Li, Wang, Z., and Lin, L. (2013). Study on the reinforcement constitutive model for beam elements in explicit analysis with ABAQUS. J. Civ. Eng. 46 (S2), 100–105.
Wen-Feng, Z., and Ying, L. (2007). Literature review on restrained concrete. Sichuan Build. Sci. Res. 33 (3), 144–146. doi:10.3969/j.issn.1008-1933.2007.03.040
Zhang, E., and Lin, D. (2015). Research and application of high-strength and ultra-high-strength concrete in China. Commer. Concr. (8), 32–35.
Zhang, J., Jia, J., and He, H. (2015). Experimental study on seismic performance of steel-bone ultra-high-strength concrete columnsExperimental study on seismic performance of two-span three-story section steel ultra-high strength concrete frame. J. Water Resour. Archit. Eng. 13 (06), 1–7. doi:10.3969/j.issn.1672-1144.2015.06.001
Keywords: ultra-high strength concrete, discrete element method, confinement effects, segment fiber model, hysteresis analysis
Citation: Duan Q-Y, Wang Q and Yang C-X (2025) Hysteresis performance study of SRUHSC frame based on rod segment fiber model. Front. Built Environ. 10:1480817. doi: 10.3389/fbuil.2024.1480817
Received: 14 August 2024; Accepted: 24 September 2024;
Published: 27 February 2025.
Edited by:
Panagiotis Mergos, City University of London, United KingdomReviewed by:
Tadesse Gemeda Wakjira, University of British Columbia, CanadaRoberto Fedele, Polytechnic University of Milan, Italy
Copyright © 2025 Duan, Wang and Yang. This is an open-access article distributed under the terms of the Creative Commons Attribution License (CC BY). The use, distribution or reproduction in other forums is permitted, provided the original author(s) and the copyright owner(s) are credited and that the original publication in this journal is cited, in accordance with accepted academic practice. No use, distribution or reproduction is permitted which does not comply with these terms.
*Correspondence: Qiang Wang, d2FuZ3FpYW5nc3lAMTYzLmNvbQ==