 Li Huang1
 Bowen Guan
- 1Beijing Tsinghua Tongheng Planning and Design Institute Co., Ltd., Beijing, China
- 2School of Human Settlements and Civil Engineering, Xi’an Jiaotong University, Xi’an, China
- 3Beijing Tongheng Energy and Environment Science Research Institute Co., Ltd., Beijing, China
Liquid-desiccant-based air conditioning demonstrates significant potential for energy conservation and emission reduction in industrial building applications, contributing to the advancement of a cleaner industrial future. In this study, the on-site performance of a hybrid liquid-desiccant air conditioning system installed in a pharmaceutical warehouse was assessed. The results revealed that blind use of the liquid desiccant caused considerable heat–cold offset in the system, which badly restricted its energy performance. Under the basic conditions, only 81.8% of the total cooling capacity provided by the system could be obtained through the return air, while the remaining 18.2% was wasted owing to the considerable heat–cold offset. A refined system was then proposed to improve the system energy performance. By avoiding the heat–cold offset, the coefficient of performance could be improved from 2.2–2.4 to 2.9–3.1. Moreover, an electricity savings rate of 20.2% was achieved with the refined system over the duration of the entire cooling season. Hence, this work provides valuable insights into energy conservation and emission reduction in industrial air conditioning systems, supporting the process of industrial decarbonization.
1 Introduction
Liquid desiccant techniques have developed rapidly in recent times (Luo and Yang, 2022; Su et al., 2022; Qi et al., 2020). As alternatives to conventional vapor compression air conditioning systems, liquid-desiccant air conditioning (LDAC) systems have shown advantages in terms of energy savings, pollutant filtration, and comfort (Salikandi et al., 2021; Oladosu et al., 2021; Sampath et al., 2020). Thus, LDAC systems have found wide applications in different types of buildings (Guan et al., 2020a; Ma et al., 2024; Guan et al., 2020b).
In recent years, numerous efforts have been made by researchers to combine the conventional vapor compression system with LDAC system to improve the energy performance for air conditioning. As an experimental effort, Lee and Jeong (2021) developed and tested a hybrid LDAC system; their results showed that the energy efficiency ratio of the system reached 7.7 in summer and 2.5 in winter, demonstrating high potential for energy savings. Kumar et al. (2022) studied a hybrid LDAC system and demonstrated that its coefficient of performance (COP) increased by 8.1% compared to those of conventional vapor compression systems. Mansuriya et al. (2020a) experimentally assessed a small-scale hybrid liquid-desiccant-dehumidification-incorporated vapor compression system and showed that it achieved a maximum COP improvement of 27.5% over the standalone vapor compression system.
With respect to simulations, Dai et al. (2020) established a mathematical model to study a new type of hybrid LDAC system; their results showed that compared to traditional systems, the energy savings could reach over 90% and exergy loss of the system could be reduced by 39%. Guan et al. (2021) proposed a hybrid LDAC system for rooms that did not require fresh air; their simulation results showed that this hybrid LDAC system exhibited a higher COP than the reference system. Li et al. (2022) conducted a simulation study on a heat-pump-driven LDAC system and showed that its energy efficiency under typical operating conditions could be increased by more than 11.4% and that energy consumption could be reduced by more than 31.9% over traditional air conditioning systems. Chen et al. (2020) investigated an LDAC system powered by solar energy and showed that a 2% increase in the relative humidity of indoor air corresponded to reductions of 2.8°C in the regeneration temperature and 62.1 kW in the regeneration heat. Bhowmik et al. (2022) established a mathematical model for a hybrid LDAC system and found that its COP could be increased by 40.8%–74.8% over conventional vapor compression systems. Chen et al. (2019) proposed a novel hybrid system involving a liquid desiccant and CO2 transcritical cycles; they showed that the total power consumption of the hybrid system could be reduced by 13.7% at an evaporation temperature of 12°C compared with cooling dehumidification at 7°C with conventional CO2 transcritical cycles. Evron et al. (2019) developed an efficient hybrid LDAC system and showed that it outperformed other hybrid configurations tested; further, by minimizing absorbent circulation between the two dehumidifiers, two distinct dehumidifier temperature levels were maintained to further improve the system performance. Mansuriya et al. (2020b) investigated a modified liquid-desiccant-dehumidification-incorporated vapor compression refrigeration system whose COP could be improved by up to 68.4% compared to conventional systems.
Previous studies have demonstrated that combining liquid-desiccant systems with vapor compression systems can significantly enhance the energy performances of air conditioning systems. However, such combined systems have not been fully validated for real-world engineering applications. Therefore, on-site measurements were conducted in this study to evaluate the energy performance of a hybrid LDAC system installed in a pharmaceutical warehouse. Based on the findings, a refined system is proposed to further improve energy efficiency. The main contributions of this study are as follows: 1) We highlight the unique air conditioning requirements of industrial warehouses, which differ from those of conventional industrial workshops, and demonstrate that the conventional reheating design is not necessary when using the LDAC system. 2) Unlike extant experimental and simulation studies in literature, the present work presents an engineering-based analysis, providing valuable and credible insights for improving the energy performances of industrial air conditioning systems.
2 System description and methodology
2.1 System description
The pharmaceutical warehouse considered for the purpose of this study was located in Jiangsu Province of China and had an area of 1728 m2 and a height of 17 m. The air conditioning system in the warehouse is composed of two types of subsystems, namely, two conventional systems (subsystem A) and three liquid-desiccant systems (subsystem B). The two subsystems A1 and A2 had identical configurations, as shown in Figures 1A, B. Under subsystem A, the return air from the warehouse (Ain) is cooled and dehumidified by the cooling coil (powered by chilled water) to the supply air state Aout. The three subsystems B1, B2, and B3 also had identical configurations, as shown in Figures 1A, C. The liquid dehumidifier (DEH) and liquid regenerator (REG) are crossflow and adiabatic modules.
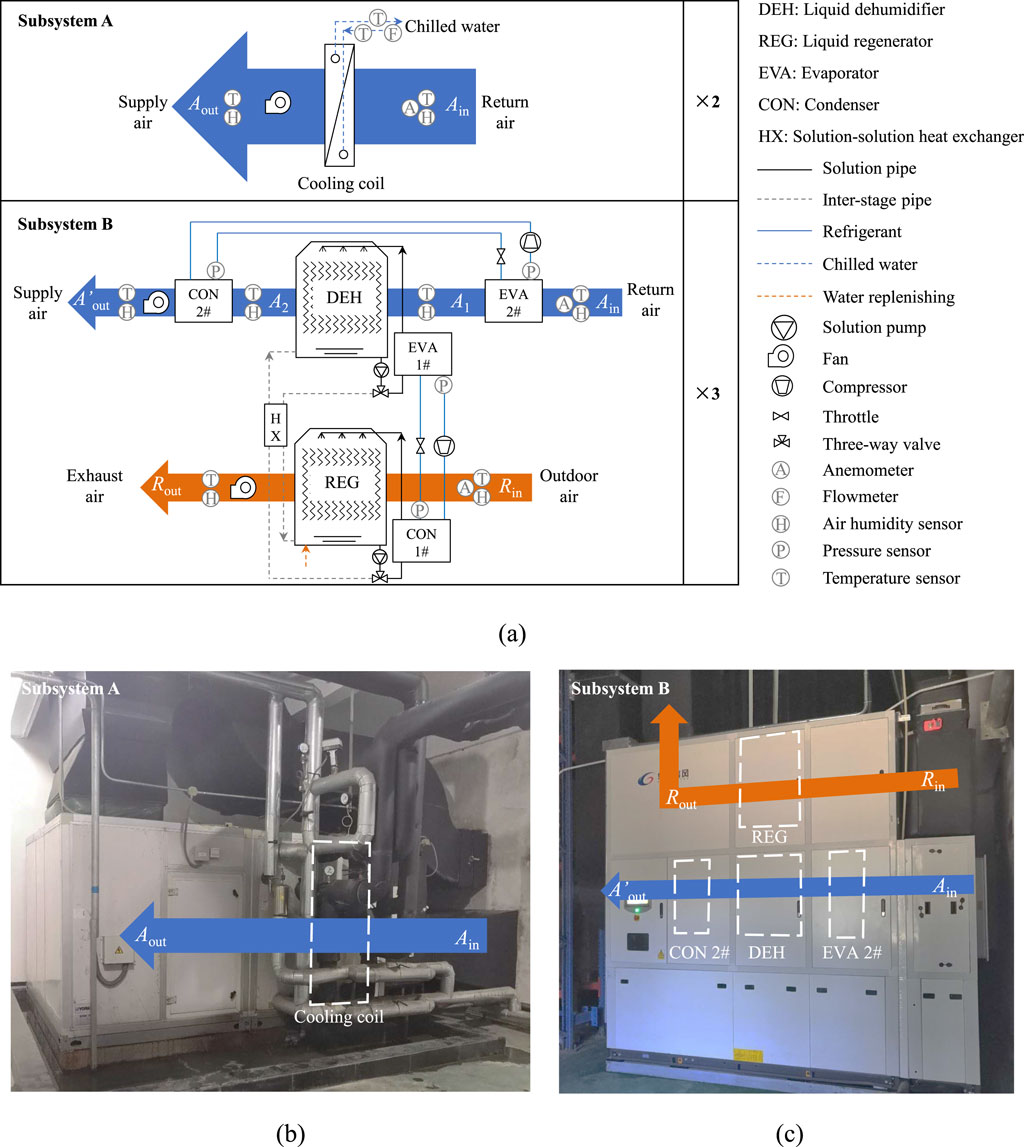
Figure 1. System configuration: (A) schematic of the air conditioning system, (B) photograph of subsystem A, and (C) photograph of subsystem B.
There are three types of flow circuits in subsystem B. The first circuit is concerned with the return air and regeneration air; the return air from the warehouse (Ain) is first cooled by the evaporator (EVA) 2# to state A1 and is then dehumidified by the DEH to state A2. Next, it is heated by the condenser (CON) 2# to the supply air state A’out; the outdoor regeneration air then absorbs moisture from the desiccant solution in the REG, which is then exhausted to the outdoor. With respect to the second desiccant solution circuit, the solution in the DEH is first cooled by EVA 1# and sprayed onto the DEH to absorb moisture from the return air so that the solution becomes diluted. A part of this diluted solution is then pumped to the REG side for regeneration. The solution at the bottom of the REG is heated by CON 1# and sprayed onto the REG to release moisture to the regeneration air. Then, a part of the solution after regeneration is pumped to the DEH side, and the entire solution is circulated. In addition, a solution–solution heat exchanger (HX) is installed in the interstage pipes to recover heat between the diluted and concentrated solutions. With respect to the last refrigerant circuit, R134a is used as the refrigerant in the two heat pump loops, where heat pump 1# provides cooling for dehumidification in the DEH and heating for regeneration in the REG. Moreover, heat pump 2# provides both cooling and heating to the return air; the return air is first dehumidified by EVA 2# and DEH and is then reheated by CON 2# to adjust the air to the demand state.
2.2 On-site measurements
On-site measurements were conducted in early August 2023, and the measurement points are depicted in Figure 1A. Air temperatures and humidities were monitored at different locations. For the return air mass flow rates in subsystems A and B (ma,A and ma,B), the air face velocities at Ain of the two subsystems were measured; then, ma,A and ma,B were obtained based on the air duct sizes. For the regeneration air mass flow rate in subsystem B (mr), the air face velocity at Rin was measured. The refrigerant pressures in the evaporators and condensers were monitored to calculate the evaporation and condensation temperatures of heat pumps 1# and 2#. Furthermore, the chilled water temperatures were monitored at the entrance and exit of the cooling coil along with its flow rate. The electrical power consumed by the compressors of the heat pumps, fans, and solution pumps was monitored. The specifications of all the measuring devices are listed in Table 1.
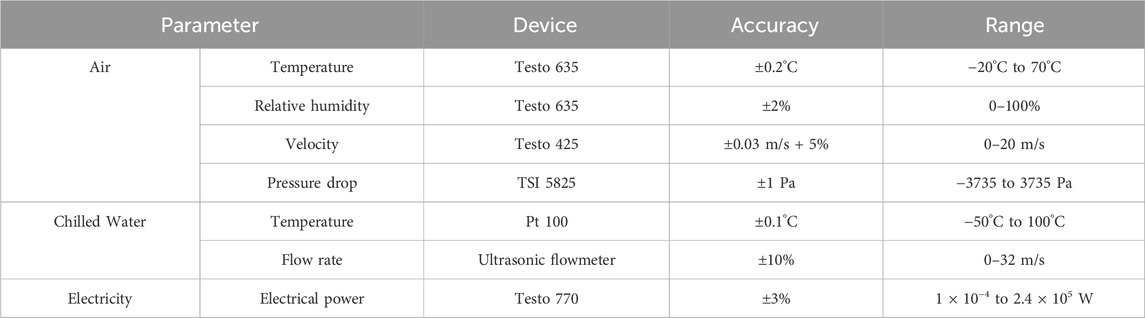
Table 1. Specifications of the measuring devices.
2.3 Mathematical model and validation
2.3.1 Dehumidifier/regenerator
A mathematical model for the crossflow DEH/REG was adopted from a previous study (Liu et al., 2007) to simulate the performance of the refined system. The energy, water content, and solute mass balances are expressed as Equations 1–3:
where ma and ms are the mass flow rates of the air and solution, respectively; ha is the enthalpy of air; hs is the enthalpy of the solution; ωa is the air humidity ratio; H and L are the height and length of the DEH or REG, respectively; X is the mass concentration of the solution.
The overall heat and mass transfer between the air and desiccant solution are given by Equations 4, 5, respectively:
where NTU is the number of mass transfer units; he is the enthalpy of the air in equilibrium with the desiccant solution; ωa is the humidity ratio of the air in equilibrium with the desiccant solution.
2.3.2 Heat pump
The heat transfer effectiveness values of the evaporator and condenser (εe and εc) are expressed by Equations 6, 7, respectively:
where ts,1, ts,2, ts,3, and ts,4 are the solution temperatures at S1, S2, S3, and S4, respectively; te and tc are the evaporation and condensation temperatures of the heat pump, respectively.
The COP ratio of the heat pump cycle to the reverse Carnot cycle (ζhp) is defined by Equation 8:
where COPhp is the coefficient of performance of the heat pump; COPideal is the coefficient of performance of the reverse Carnot cycle; Pph is the electrical power of the compressor in the heat pump loop. Qe and Qc are the cooling and condensing heating capacities that are expressed by Equations 10, 11, respectively:
where hs,1, hs,2, hs,3, and hs,4 are the enthalpies of the solutions at S1, S2, S3, and S4, respectively.
2.3.3 Model validation
To validate the model accuracy, numerical results obtained with this model are compared with experimental results from literature (Guan et al., 2020a). The air temperature and humidity ratio at Aout are the focus for evaluating the model accuracy. Figure 2 illustrates the comparison results. The discrepancies between the numerical and experimental results are observed to be within 10%, thereby validating the model accuracy.
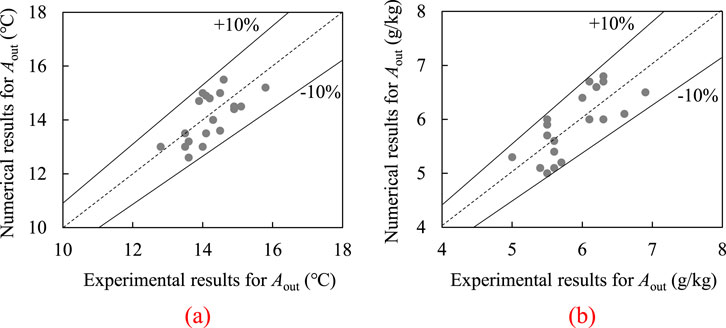
Figure 2. Comparison of the numerical and experimental results from literature (Guan et al., 2020b): (A) air temperature at Aout and (B) air humidity ratio at Aout.
2.4 Evaluation index
To evaluate the energy performance of the system, the COP of the system (COPsys) is introduced as follows:
where Qa is the sum of the cooling capacities achieved by the return air in the two subsystems A and three subsystems B, which can be calculated using Equation 2; Pcooler is the equivalent electrical power for producing chilled water in the cooling coils in subsystems A, which can be calculated using Equation 3; Php is the electrical power of the three compressors in subsystems B; Pfan is the electrical power of the fans in the entire system; Psolution is the electrical power of the solution pumps in subsystems B.
Here, ha,in is the enthalpy of air at Ain; ha,out and h’a,out are the enthalpies of air at Aout in subsystem A and A’out in subsystem B, respectively; Qcooler is the cooling capacity provided by the cooling coils in subsystem A; COPw is the coefficient of performance for producing chilled water; Qchiller is the cooling capacity provided by the central chiller in the cooling plant; Pchiller, Ptower, and Ppump are electrical powers of the chiller, fans in the cooling tower, and cooling/chilled water pumps in the cooling plant, respectively.
3 Results
3.1 Basic condition
The operating condition at 12:00 on August 5th is hereafter referred to as the basic condition. Under the basic condition, the air handling processes in subsystems A and B are as shown in Figure 2. Because the air handling processes in subsystems A1 and A2 are similar and those in subsystems B1, B2, and B3 are similar, only the air handling processes in subsystems A1 and B1 are shown in Figures 3A, B, respectively. The detailed test results are listed in Table 2. Taking subsystem A1 as an example, the return air at Ain (19.1°C and 9.6 g/kg) is processed to state Aout (11.5°C and 7.6 g/kg) by the cooling coil. The chilled water in the cooling coil provides a cooling capacity of 206.6 kW to the return air. Moreover, the values of Qchiller, Pchiller, Ptower, and Ppump in the central cooling plant can be read directly from the existing monitoring platform, and a COPw of 4.3 was calculated under the basic condition. Thus, Pcooler was determined to be 48.0 kW and Pfan in subsystem A1 was 22.2 kW. Taking subsystem B1 as an example, the return air at Ain (19.1°C and 9.6 g/kg) is first managed to state A1 (12.5°C and 7.9 g/kg) by EVA 2# and dehumidified to state A2 (12.5°C and 4.9 g/kg) by the DEH; finally, it is reheated to A’out (26.3°C and 4.9 g/kg) by CON 2#. The heat pumps, fans, and solution pumps account for electrical power values of 9.7 kW, 3.1 kW, and 0.3 kW, respectively.
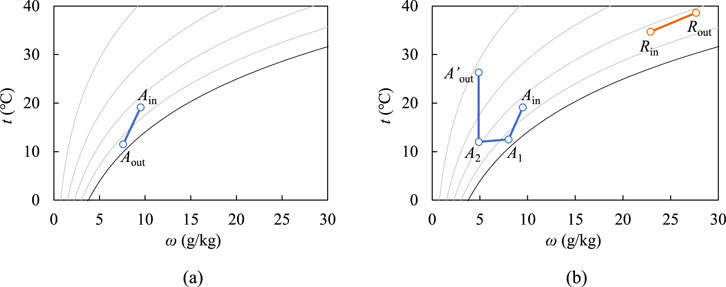
Figure 3. Air handling processes shown through psychrometric charts for (A) subsystem A1 and (B) subsystem B1.
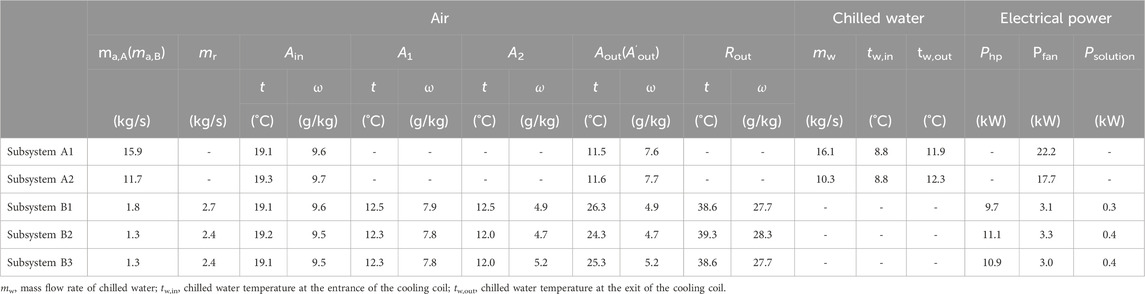
Table 2. Test results under the basic condition (Rin: 34.7°C, 22.9 g/kg; COPw = 4.3).
There are two types of heat–cold offsets in the system that severely deteriorate the energy performance of the entire system. The first type of heat–cold offset occurs between subsystems A and B, as shown in Figure 4A. Under the basic condition, the warehouse requires a cooling capacity of 286.0 kW, with a sensible load of 197.1 kW and latent load of 188.9 kW. However, subsystem A can only handle the return air to a state near saturation, which causes the ratio of latent to sensible loads undertaken by subsystems A to be less than the demand. To adjust the supply ratio of latent to sensible loads, subsystem B assumes a latent load of 50.9 kW but provides a heating capacity of 27.9 kW. Hence, the cooling provided by subsystem A and heating provided by subsystem B are offset by each other. The second type of heat–cold offset occurs within subsystem B. As shown in Figure 4B, EVA 2# and DEH cool the return air, while CON 2# reheats it, indicating a heat–cold offset within subsystem B. Additionally, the liquid desiccant circulating between the dehumidifier and regenerator contributes to this offset. Under the basic condition, only 81.8% of the total cooling capacity provided by the system is achieved with the return air, while the remaining 18.2% is wasted owing to the considerable heat–cold offset.
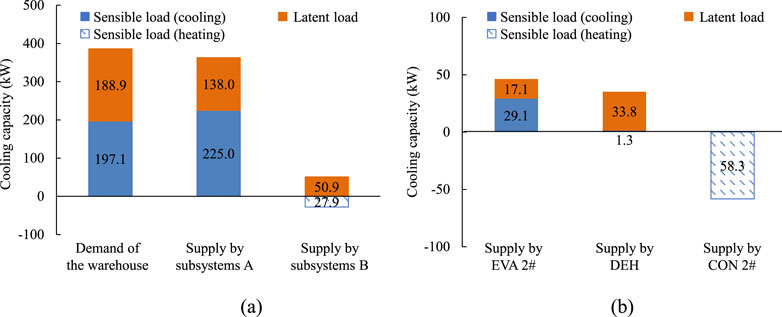
Figure 4. Heat–cold offsets (A) between subsystems A and B and (B) within subsystem B.
To further understand the roles of subsystems A and B, the cooling load undertaken and electrical power consumed by them are shown in Figures 5A, B, respectively. Subsystem B only provide 6% of the total cooling capacity, as shown in Figure 5A, whereas they are responsible for 25% of the total electrical power consumed, as shown in Figure 5B. In other words, the role of the subsystem A can be understood as to provide nearly all of the cooling capacity. However, the ratio of latent to sensible loads undertaken by subsystem A is lower than the demand ratio. Then, subsystem B can be understood to adjust the ratio of latent to sensible loads undertaken by subsystem A to the demand value.
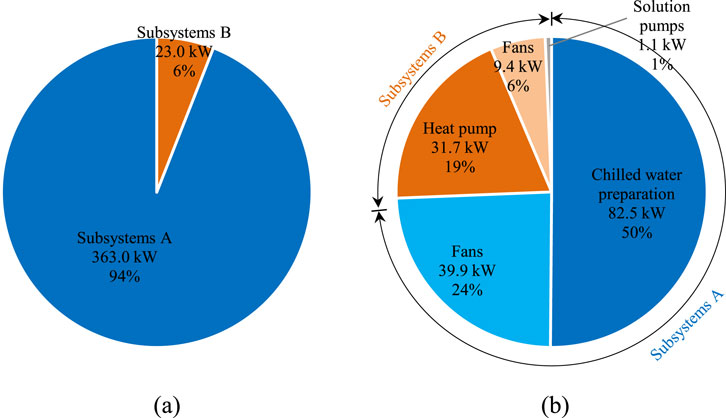
Figure 5. Cooling load and electrical power distributions: (A) cooling loads of subsystems A and B; (B) electrical power consumed by the devices.
3.2 Variable condition
3.2.1 Ambient temperature and humidity in the warehouse
The outdoor air temperature and humidity during the test period are shown in Figure 6. To examine the ambient temperature and humidity trends in the warehouse, air temperature and humidity sensors were installed at different locations, as shown in Figure 7, and the measured results at the monitoring points are shown in Figure 8. Under the existing air conditioning system, the ambient temperature can be controlled to below 20.0°C (limit value), ambient relative humidity can be controlled to below 75% (limit value), and ambient humidity ratio can be controlled to below 11.0 g/kg.
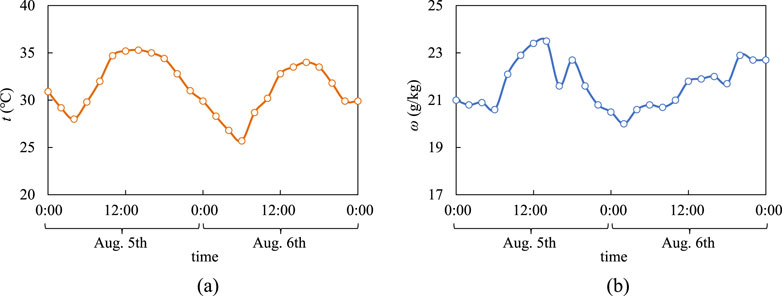
Figure 6. Weather conditions during the test period: (A) outdoor air temperature, and (B) outdoor air humidity ratio.
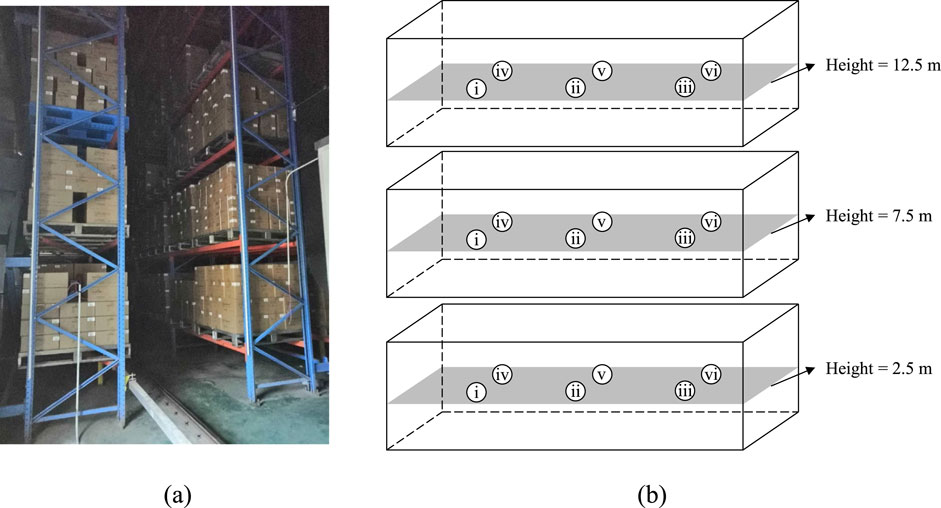
Figure 7. Locations of the air temperature and humidity monitoring points in the warehouse: (A) photograph of the warehouse, and (B) locations of the monitoring points.
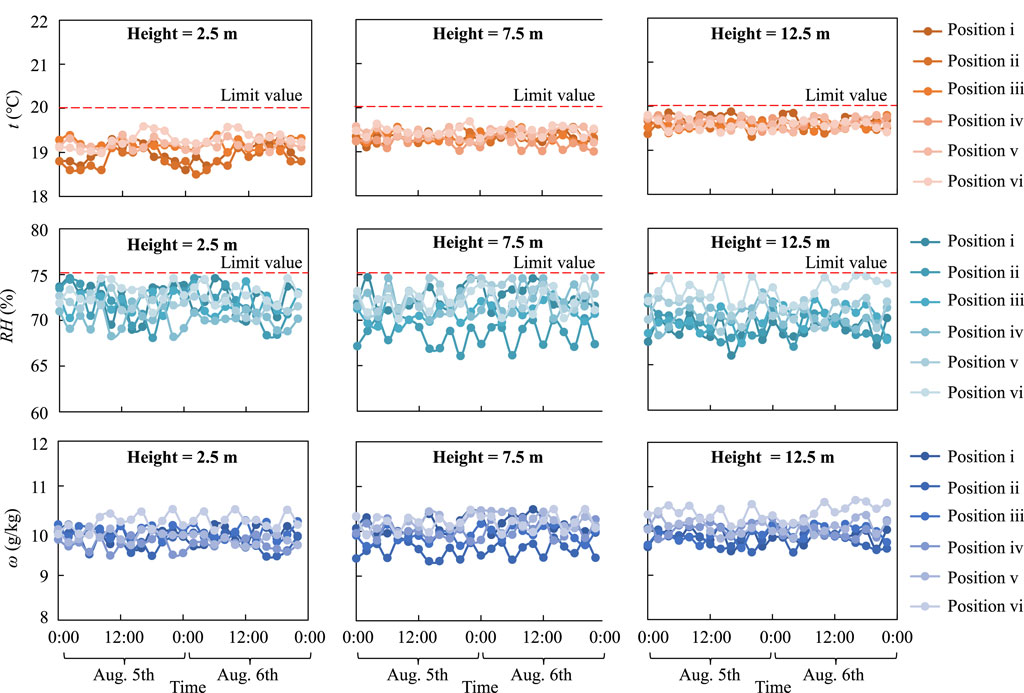
Figure 8. Indoor air temperature and humidity measurements under the air conditioning system.
3.2.2 Energy performance
To validate the accuracy of the test results, the energy unbalance rates for subsystems A and B (δA and δB) are introduced as follows:
where ha,1 and ha,2 are the air enthalpy values at A1 and A2 in subsystem B; Php,2# is the electrical power of the compressor in heat pump 2# in subsystem B. From the results listed in Table 3, it is observed that all δA and δB values are within 10%, thereby validating the accuracy of the results.
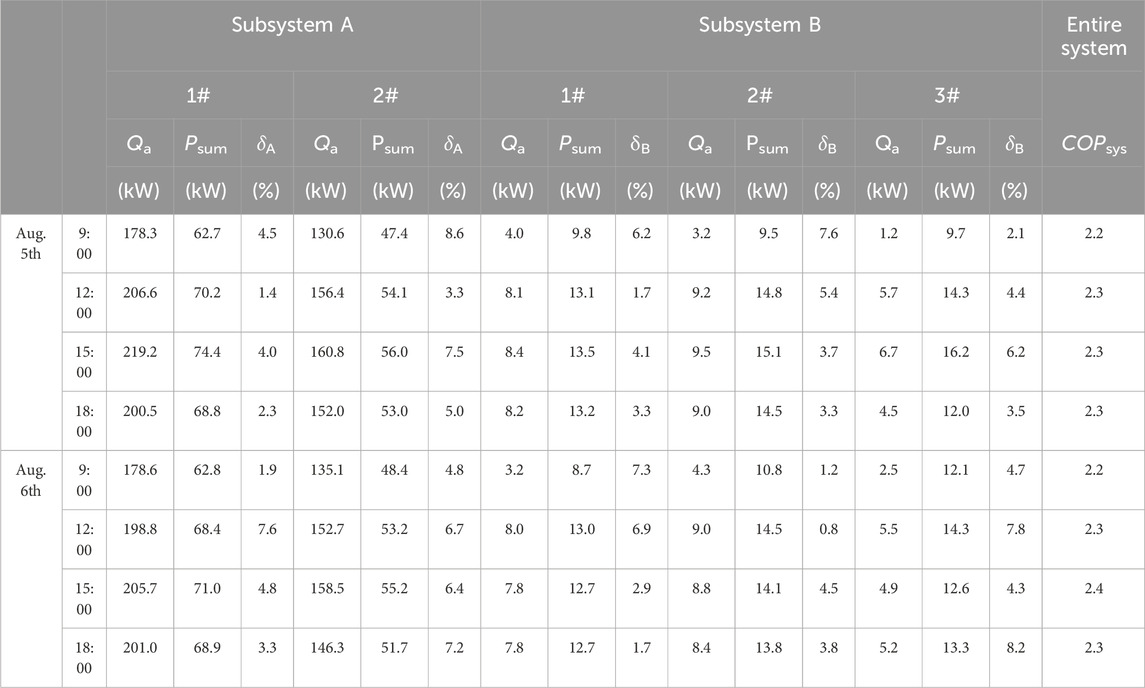
Table 3. Test results during the test period (ma,A = 1.8 kg/s, mr,A = 2.7 kg/s, ma,B = 15.9 kg/s).
Under different outdoor air conditions, the warehouse requires variable cooling capacity. As shown in Figure 9A, the cooling demand is satisfied by subsystems A and B. Subsystems A meet almost all of the cooling capacity demand, whereas subsystems B adjust the ratio of latent to sensible loads undertaken by the system. As shown in Figure 9B, subsystems B account for 20.8%–25.6% of the total electrical power consumed under different outdoor air conditions. Moreover, COPsys during the test period ranges from 2.2 to 2.4; the reasons for this narrow range of COPsys values can be understood from the following two aspects. The COPw is high at midnight because of good outdoor air conditions for the central cooling tower, which contributes to high COPsys. However, the ratio of latent to sensible loads is low at midnight, indicating that a larger portion of the cooling capacity provided by subsystem A needs to be offset by the heating capacity from subsystem B, which is unfavorable for achieving a high COPsys. The effects of these two factors counterbalance each other, resulting in the COPsys remaining within a narrow range of 2.2–2.4 during the test period.
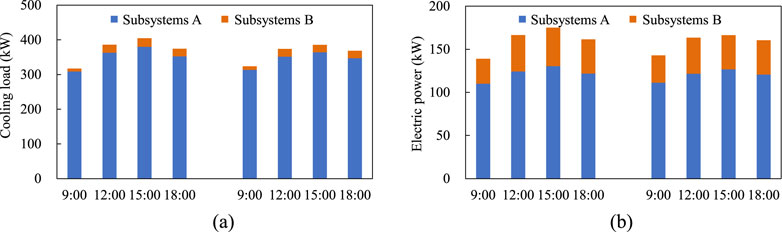
Figure 9. System performance during the test period: (A) cooling loads of subsystems A and B; (B) electrical power consumed by subsystems A and B.
In summary, subsystems A meet almost all of the cooling capacity demand of the warehouse, whereas subsystems B adjust the ratio of latent to sensible loads undertaken by the system to the demand value. Furthermore, there are two types of heat–cold offsets in the entire system, i.e., offset between subsystems A and B and offset within subsystem B. The COPsys of the entire system is severely restricted by these two types of heat–cold offsets.
3.3 Reason for system design
In the original system design phase, without enough on-site measurements as references, the proportion of sensible load to total load was overestimated. Thus, during initial use of the warehouse, there were only two subsystems A to control the ambient temperature and humidity. The ambient temperature must be restricted to below 20°C, whereas the ambient relative humidity must be controlled to below 75%. However, when using only subsystems A, the ambient relative humidity exceeded 80% because of the limitation of condensing dehumidification. To correct the ratio of latent to sensible loads undertaken by subsystems A to the demand value, three subsystems B were installed additionally, through which the return air was dehumidified but heated by subsystems B.
4 Discussion
4.1 Refined system
Avoiding the aforementioned two types of heat–cold offsets is crucial for improving the system energy performance. Accordingly, a refined system was proposed, as shown in Figure 10. The refined subsystem is a typical LDAC system in which the heat–cold offsets can be avoided. The refined system is composed of four subsystems, as shown in Figure 10A. These four subsystems have the same configurations, and the air handling processes in the subsystems are identical to each other. In addition, two more subsystems were installed for backup. In the original system, the entire system manages the return air with a total mass flow rate of 32.0 kg/s. Thus, in the refined system, each subsystem manages the return air with a mass flow rate of 8.0 kg/s.
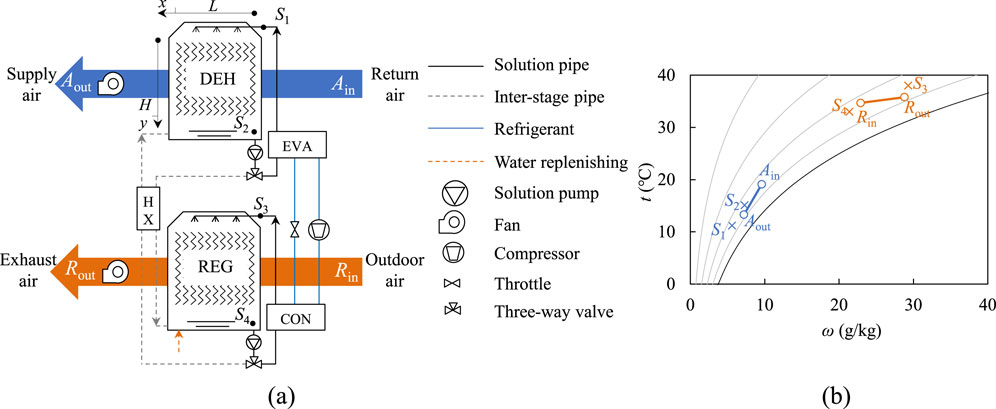
Figure 10. Refined system: (A) configuration of the refined subsystem (1#, 2#, 3#, or 4#), and (B) air handling process under the refined subsystem.
In the refined subsystem, the return air at Ain (with a flow rate of 8.0 kg/s) is directly cooled and dehumidified by the DEH to the demand state Aout. With regard to the regeneration air (with a flow rate of 8.0 kg/s), the outdoor air at Rin is used in the REG to absorb moisture from the desiccant solution and exhaust it to the outdoors. With regard to the desiccant solution, the solution in the DEH is first cooled by the EVA and sprayed onto the DEH to absorb moisture from the return air, which dilutes the solution. A part of this diluted solution is pumped to the REG side for regeneration. The solution at the bottom of the REG is heated by the CON and sprayed onto the REG to release moisture to the regeneration air. A part of the remaining solution after regeneration is pumped to the DEH side, and the entire solution is circulated. In addition, a solution–solution heat exchanger (HX) is installed at the interstage pipes to recover heat between the diluted and concentrated solutions.
4.2 Performance comparison
4.2.1 Basic condition
Under the basic condition, the operating parameters for the refined system are listed in Table 4. When the refined system undertakes the same sensible and latent loads as the original system, the simulation results under the refined system are as listed in Table 5. Moreover, Pfan and Ppump used here are estimated according to the method in Section 3.1. Taking Pfan, for example, the air pressure drop in the original system was measured using the device specifications listed in Table 1. Under the basic condition, the return air pressure drop with subsystem B1 is 680 Pa, whereas the regeneration air pressure drop with subsystem B2 is 220 Pa, according to the test results. In addition, the return air pressure drop values with EVA 2# and CON 2# are 55 Pa and 65 Pa, respectively. Thus, it can be estimated that the return air pressure drop with refined subsystem is 560 Pa and that the regeneration air pressure drop with the refined subsystem is 220 Pa. Subsequently, Pfan can be estimated under the refined system.
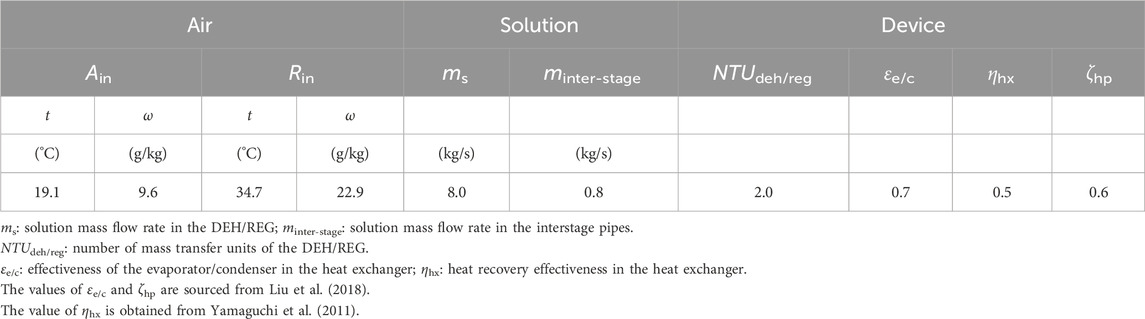
Table 4. Operating and device parameters of the refined subsystem (ma = mr = 8.0 kg/s).
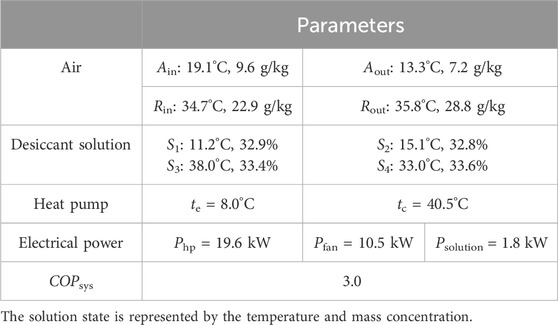
Table 5. Simulation results of the refined subsystem under the basic condition (ma = 8.0 kg/s, mr = 8.0 kg/s).
Under the refined system, the two types of heat–cold offsets can be avoided as shown in Figure 11A. The original system has to provide a total cooling capacity of 472.2 kW owing to the heat–cold offset, whereas the refined system has to only provide a total capacity of 386 kW to satisfy the warehouse demand. Because the required cooling capacity from the system is reduced, the corresponding electrical power consumption of the system is reduced, as shown in Figure 11B. The electrical power consumed by the system is reduced from 166.5 kW to 127.8 kW. Consequently, the COPsys is improved from 2.3 to 3.0 by the refined system under the basic condition (Figure 11C).
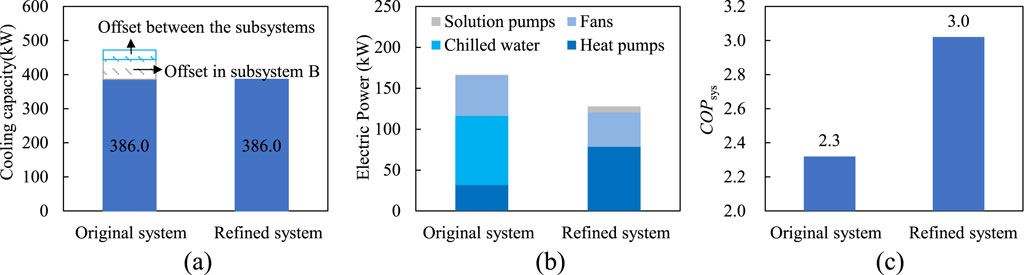
Figure 11. Performance comparisons between the original and refined systems: (A) heat–cold offset, (B) required electrical power, and (C) COPsys.
4.2.2 Variable conditions
The energy performances of the original and refined systems are compared under variable conditions. First, under the outdoor air conditions during the test period, Figure 12 illustrates the energy performance difference between the original and refined systems. As seen in Figure 12A, COPsys is improved from 2.2–2.4 to 2.9–3.1 by the refined system by avoiding the two types of heat–cold offsets. The cooling season in the local region is from May to September. The electricity amounts consumed by the original and refined systems over the entire cooling season are shown in Figure 12B. In each month during this season, an electricity savings of 17.1%–22.1% can be achieved with the refined system. Over the entire cooling season, the electricity consumed by the refined system is 20.2% less than that consumed by the original system.
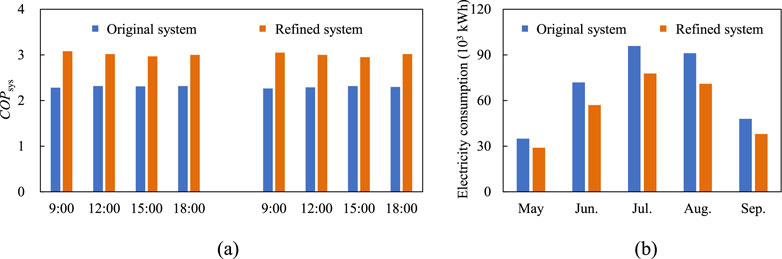
Figure 12. Performance comparisons under variable conditions: (A) COPsys at different points during the test period, and (B) monthly electricity consumption over the entire cooling season.
5 Conclusions
In this study, measurements were obtained to assess the on-site performance of a hybrid LDAC system applied in a pharmaceutical warehouse. Owing to the blind use of the liquid desiccant technique, the energy performance of the system was poor. Subsequently, a refined system was proposed to improve the performance. The main conclusions of this study are as follows.
1) Under the original system, there are two types of considerable heat–cold offsets that limit the energy performance of the system, i.e., offset between subsystems A and B as well as offset within subsystem B. Under the basic condition, only 81.8% of the total cooling capacity of the system can be achieved through the return air, while the remaining 18.2% is wasted by the considerable heat–cold offset.
2) A refined system is proposed to improve the overall energy performance. By avoiding the two types of heat–cold offsets, the COPsys can be improved from 2.2–2.4 to 2.9–3.1 by the refined system. Moreover, over the entire cooling season, an electricity savings of 20.2% can be achieved with the refined system.
3) The demand ratio of the latent to sensible loads was wrongly estimated in the original system design phase, which resulted in an unreasonable system design. On-site measurements are therefore crucial for providing reference values for load forecasting and system design.
Data availability statement
The original contributions presented in the study are included in the article/Supplementary Material, and any further inquiries may be directed to the corresponding author.
Author contributions
LH: writing–original draft and writing–review and editing. BG: conceptualization, methodology, and writing–review and editing. MQ: project administration and writing–review and editing. YL: investigation and writing–review and editing. HY: visualization and writing–review and editing.
Funding
The authors declare that financial support was received for the research, authorship, and/or publication of this article. This work was supported by projects funded by the China Postdoctoral Science Foundation (No. 2022M722545) and Natural Science Basic Research Program of Shaanxi (No. 2023-JC-QN-0491).
Conflict of interest
Author LH was employed by Beijing Tsinghua Tongheng Planning and Design Institute Co., Ltd.
Author MQ was employed by Beijing Tongheng Energy and Environment Science Research Institute Co.
The remaining authors declare that the research was conducted in the absence of any commercial or financial relationships that could be construed as a potential conflict of interest.
Publisher’s note
All claims expressed in this article are solely those of the authors and do not necessarily represent those of their affiliated organizations or those of the publisher, editors, and reviewers. Any product that may be evaluated in this article or claim that may be made by its manufacturer is not guaranteed or endorsed by the publisher.
References
Bhowmik, M., Rath, S., Varela, R. J., Muthukumar, P., Anandalakshmi, R., and Saito, K. (2022). Performance assessment of integrated liquid desiccant dehumidification with vapor-compression system for energy-efficient air conditioning applications. Appl. Therm. Eng. 216, 119118. doi:10.1016/j.applthermaleng.2022.119118
Chen, X. Y., He, Y. J., Wang, Y., and Chen, G. (2019). Analysis of a hybrid system of liquid desiccant and CO2 transcritical cycles. Int. J. Refrig. 105, 101–108. doi:10.1016/j.ijrefrig.2018.07.035
Chen, Y., Liu, Y., Wang, D., Luo, X., Liu, J., Liu, J., et al. (2020). Performance and optimization of a novel solar-driven liquid desiccant air conditioning system suitable for extremely hot and humid climates. Energy Convers. Manag. 215, 112899. doi:10.1016/j.enconman.2020.112899
Dai, Y., Liu, F., Sui, J., Wang, D., Han, W., and Jin, H. (2020). Hybrid liquid desiccant air-conditioning system combined with marine aerosol removal driven by low-temperature heat source. Appl. Energy 275, 115365. doi:10.1016/j.apenergy.2020.115365
Evron, Y., Gommed, K., and Grossaman, G. (2019). Efficient deep dehumidification hybrid air conditioning system. Int. J. Refrig. 105, 50–58. doi:10.1016/j.ijrefrig.2018.11.008
Guan, B., Liu, X., and Zhang, T. (2021). Investigation of a compact hybrid liquid-desiccant air-conditioning system for return air dehumidification. Build. Environ. 187, 107420. doi:10.1016/j.buildenv.2020.107420
Guan, B., Zhang, T., Jun, L., and Liu, X. (2020a). Exergy analysis and performance improvement of liquid-desiccant deep-dehumidification system: an engineering case study. Energy 196, 117122. doi:10.1016/j.energy.2020.117122
Guan, B. W., Liu, X. H., Zhang, Q. L., and Zhang, T. (2020b). Performance of a temperature and humidity independent control air-conditioning system based on liquid desiccant for industrial environments. Energy Build. 24, 109869. doi:10.1016/j.enbuild.2020.109869
Kumar, S., Ahmad, F., and Vohra, M. (2022). “Experimental investigation on hybrid liquid desiccant cooling system for hot and humid climatic conditions of India,” in Recent trends in thermal engineering: select proceedings of ICAST 2020 (Singapore: Springer), 129–138.
Lee, J. H., and Jeong, J. W. (2021). Hybrid heat-pump-driven liquid-desiccant system: experimental performance analysis for residential air-conditioning applications. Appl. Therm. Eng. 195, 117236. doi:10.1016/j.applthermaleng.2021.117236
Li, W., Yin, Y., and Wang, Y. (2022). Performance evaluation of a heat pump-driven liquid desiccant dehumidification system integrated with fresh air supply. Energy Build. 275, 112473. doi:10.1016/j.enbuild.2022.112473
Liu, X. H., Jiang, Y., and Qu, K. Y. (2007). Heat and mass transfer model of cross flow liquid desiccant air dehumidifier/regenerator. Energy Convers. Manag. 48, 546–554. doi:10.1016/j.enconman.2006.06.002
Liu, X. H., Xie, Y., Zhang, T., Chen, L., and Cong, L. (2018). Experimental investigation of a counter-flow heat pump driven liquid desiccant dehumidification system. Energy Build. 179, 223–238. doi:10.1016/j.enbuild.2018.09.007
Luo, J., and Yang, H. (2022). A state-of-the-art review on the liquid properties regarding energy and environmental performance in liquid desiccant air-conditioning systems. Appl. Energy 325, 119853. doi:10.1016/j.apenergy.2022.119853
Ma, Z., Chang, X., Zhang, T., Liu, X., and Guan, B. (2024). On-site measurement and optimization of energy efficiency of the cascading desiccant wheel deep dehumidification systems in the lithium-ion battery manufacturing factory. Energy Build. 304, 113833. doi:10.1016/j.enbuild.2023.113833
Mansuriya, K., Patel, V. K., Raja, B. D., and Mudgal, A. (2020b). Assessment of liquid desiccant dehumidification aided vapor-compression refrigeration system based on thermo-economic approach. Appl. Therm. Eng. 164, 114542. doi:10.1016/j.applthermaleng.2019.114542
Mansuriya, K., Raja, B. D., and Patel, V. K. (2020a). Experimental assessment of a small scale hybrid liquid desiccant dehumidification incorporated vapor compression refrigeration system: an energy saving approach. Appl. Therm. Eng. 17, 115288. doi:10.1016/j.applthermaleng.2020.115288
Oladosu, T. L., Baheta, A. T., and Oumer, A. N. (2021). Desiccant solutions, membrane technologies, and regeneration techniques in liquid desiccant air conditioning system. Int. J. Energy Res. 45 (6), 8420–8447. doi:10.1002/er.6482
Qi, R. H., Dong, C. S., and Zhang, L. Z. (2020). A review of liquid desiccant air dehumidification: from system to material manipulations. Energy Build. 215, 109897. doi:10.1016/j.enbuild.2020.109897
Salikandi, M., Ranjbar, B., Shirkhan, E., Shanmuga Priya, S., Thirunavukkarasu, I., and Sudhakar, K. (2021). Recent trends in liquid desiccant materials and cooling systems: application, performance and regeneration characteristics. J. Build. Eng. 33, 101579. doi:10.1016/j.jobe.2020.101579
Sampath, S. S., Kumar, S., and Reddy, S. V. K. (2020). Influence of different desiccants, flow type and packings on the liquid desiccant dehumidification system: a review. Int. J. Air-Conditioning Refrig. 28 (01), 2030002. doi:10.1142/s2010132520300025
Su, W., Lu, Z., She, X., Zhou, J., Wang, F., Sun, B., et al. (2022). Liquid desiccant regeneration for advanced air conditioning: a comprehensive review on desiccant materials, regenerators, systems and improvement technologies. Appl. Energy 308, 118394. doi:10.1016/j.apenergy.2021.118394
Yamaguchi, S., Jeong, J., Sarito, K., Miyauchi, H., and Harada, M. (2011). Hybrid liquid desiccant air-conditioning system: experiments and simulations. Appl. Therm. Eng. 31, 3741–3747. doi:10.1016/j.applthermaleng.2011.04.009
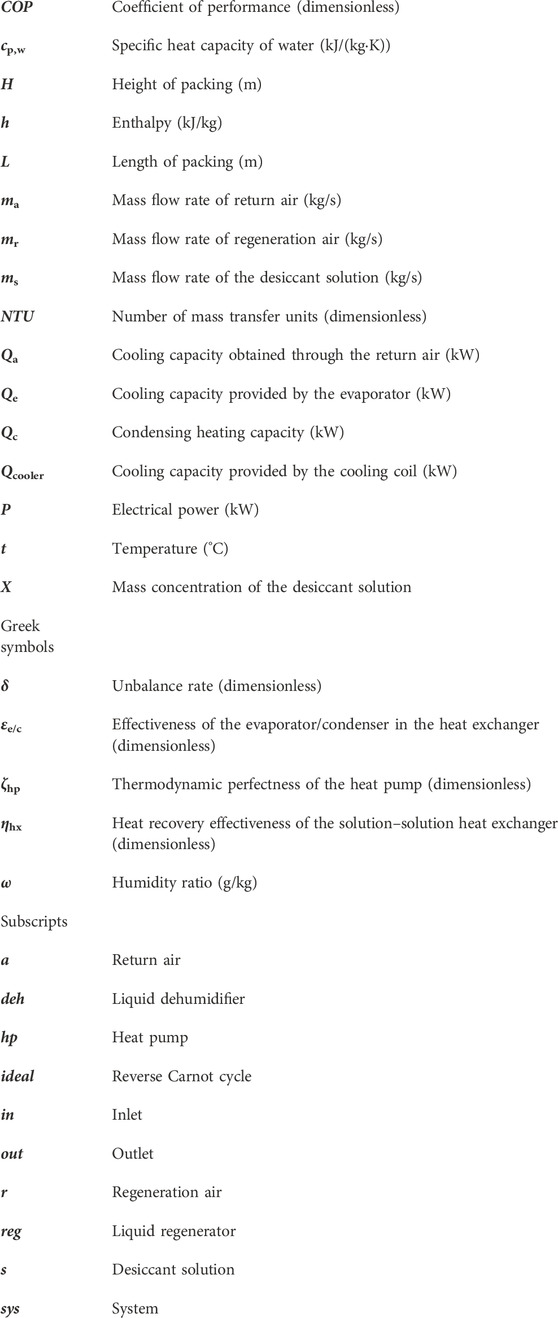
Nomenclature
Keywords: industrial building, humidity control, liquid desiccant, on-site measurements, energy savings, carbon emission
Citation: Huang L, Guan B, Qi M, Liu Y and Yang H (2024) Performance investigation of a hybrid liquid-desiccant air conditioning system in a pharmaceutical warehouse: a case study and refined strategy. Front. Built Environ. 10:1468537. doi: 10.3389/fbuil.2024.1468537
Received: 22 July 2024; Accepted: 19 August 2024;
Published: 04 September 2024.
Edited by:
Hasim Altan, Prince Mohammad bin Fahd University, Saudi ArabiaCopyright © 2024 Huang, Guan, Qi, Liu and Yang. This is an open-access article distributed under the terms of the Creative Commons Attribution License (CC BY). The use, distribution or reproduction in other forums is permitted, provided the original author(s) and the copyright owner(s) are credited and that the original publication in this journal is cited, in accordance with accepted academic practice. No use, distribution or reproduction is permitted which does not comply with these terms.
*Correspondence: Bowen Guan, Z3VhbmJ3QHhqdHUuZWR1LmNu