 Erdem Toprak
 Sebastia Olivella
 Xavier Pintado3†
- 1International Centre for Numerical Methods in Engineering (CIMNE) Barcelona, Barcelona, Spain
- 2Department of civil and environmental engineering, Universitat Politècnica de Catalunya, Barcelona, Spain
- 3Mitta Oy, Helsinki, Finland
- 4Posiva Oy, Eurajoki, Finland
This paper presents modelling of the long-term performance of engineered barrier systems (EBS) in crystalline host rock in terms of coupled thermo-hydro-mechanical (THM) processes in a specific case, considering also the impact of salinity linked with geochemistry. This study has been used as a supporting document for the safety case in the operating licence application for the Olkiluoto spent nuclear fuel repository in Finland. The disposal design chosen is the KBS-3V (Kärnbränslesäkerhet in Swedish, “nuclear fuel safety”; 3, version number; V, vertical) which consists of placing the canisters in vertical deposition holes surrounded by the EBS. The buffer components consist of compacted blocks of Wyoming-type bentonite surrounded by pillow pellets manufactured with the same material. Bulgarian and/or Italian granular filling (GraFi) materials are the backfilling material in the deposition tunnels. The Barcelona basic model (BBM) was considered for modelling the geomechanical behaviour of compacted buffer blocks and GraFi materials filling the deposition tunnels. The Barcelona expansive model (BExM), which consists of a double structure (macro–micro porosity), was considered for the pellets. A laboratory testing campaign (thermal conductivity, water retention curve, oedometer, and infiltration tests) was carried out in order to calibrate the THM model parameters of the corresponding materials. Model-data uncertainties, challenges in 3D THM modelling, and the methodology followed have been provided in terms of modelling capabilities. We implemented 3D THM simulation of an individual deposition hole (canister, notch/chamfer, and buffer materials) drilled into a deposition tunnel (backfill material) in CODE_BRIGHT as a finite element method (FEM) program. This study presents results related to THM performance of the EBS, such as peak temperature, time required to reach full saturation in buffer and backfill, the evolution of dry densities according to permeabilities, the development of swelling pressure in buffer and backfill, and, consequently, deformations in buffer and backfill domains. A sensitivity analysis plan was followed in order to deal with various factors affecting the long-term THM performance of the EBS. In the sensitivity analysis, buffer and backfill design options (different filling material alternatives), geological conditions (saline water, rock permeability, and heterogeneous rock) and numerical simulation options (different numerical model options, issues related to geometry and meshing) were investigated. The performance targets and design specifications set for the buffer and backfill are also discussed. The paper concludes with a summary how the THM design under a certain configuration (geometry, initial conditions, boundary conditions, and buffer and backfill materials) meets the performance targets set for the buffer, backfill, and host rock.
1 Introduction
Finland will be the first country in the world to be ready to start the final disposal of spent nuclear fuel. The Finnish final repository for spent nuclear fuel will consist of a series of deposition holes in the crystalline bedrock of the Fennoscandian Shield (Posiva, 2012). In order to protect and insulate the disposed materials, compacted blocks and pellets manufactured with Wyoming-type bentonite (Karnland et al., 2006; Kiviranta et al., 2016, among others) will be used as buffer material (Juvankoski et al., 2012; Karvonen, 2018a). Earlier blocks and pellets design for the backfill (Keto et al., 2013) have been changed to GraFi (granular filling). The long-term performance requirements set for GraFi in a disposal tunnel in the repository were discussed by Karvonen, 2018b.
Figure 1 shows the site location (a), the interim storage in water pools (b) (a few years after removal from the reactor, spent fuel is transferred to interim storage where it is stored in water pools—wet storage) and schematic description of the project (c). The final disposal is scheduled to start during the 2020s.
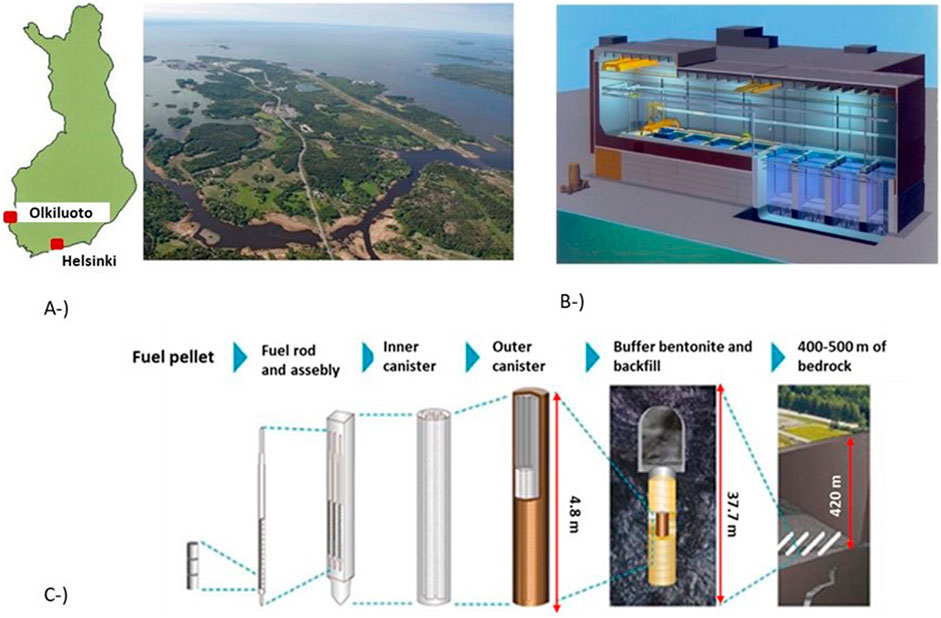
Figure 1. Site location (A), interim storage in water pools (B), and schematic description of project (C). (Figure credit: Posiva, 2012).
For this Olkiluoto repository, the thermal dimensioning was made assuming the canisters will be in rectangular panels of 900 canisters of BWR, VVER, or EPR spent fuel (Ikonen et al., 2018). In these panels, there will be 30 deposition tunnels, each with 30 deposition holes containing 30 canisters. The assumed disposal rate is 36 canisters per year. It will take 25 years to dispose of all the canisters in one panel. Ikonen (2003) proposed panels containing 30 deposition tunnels with 50 deposition holes in each tunnel.
There are two alternative disposal methods for storing the spent fuel in the so-called KBS-3 concept. The first alternative envisages vertically placing of the canisters in vertical deposition holes excavated in horizontal deposition tunnels (KBS-3V disposal method—Juvankoski and Marcos, 2010). The second alternative envisages that canisters being placed horizontally in horizontal tunnels (KBS-3H alternative; Posiva and SKB, 2017, and Damians et al., 2019). For Posiva, the KBS-3H is an alternative to the KBS-3V in the construction licence. This paper analyses the KBS-3V concept. Some changes have been made in the buffer and backfill design from the construction licence granted—for example, the 10 mm air gap (Toprak et al., 2018a) between the canister and the ring blocks has been modified to a 35 mm gap filled with pellets (Karvonen, 2018a; Posiva 2021). The block and pellet configuration and distribution in backfill have also been changed by filling the tunnel with the granular material GraFi (Karvonen, 2018b; Posiva 2021). Therefore, a more recent THM modelling and design of the repository was sought to investigate the long term THM response of the repository under the updated geometrical and material configuration.
Previous studies (e.g. Åkesson, et al., 2010; Pintado and Rautioaho, 2013; Toprak et al., 2013, 2016, and 2018) of THM modelling of the repository were carried out considering the KBS-3V disposal method under 2D axisymmetric geometries. As the canister and tunnel spacing is not same, it is difficult to reproduce the exact volume of the corresponding materials under 2D axisymmetric geometries. This paper shows modelling results in a 3D model geometry configuration, encompassing laboratory and in-situ measurements. In addition to the novelty of 3D model geometry and the characterization of the Italian and Bulgarian GraFi materials, BBM (Alonso et al., 1990) and a double structure model (BExM; Gens and Alonso, 1992) were used together for the first time under the same 3D model configuration. These two models have been used extensively in the analysis of swelling clays in spent nuclear fuel repositories (Chen and Ledesma, 2009; Gens et al., 2009; Åkesson et al., 2010; Toprak et al., 2013 and Toprak et al., 2018a; Pintado et al., 2017; Rodríguez-Dono et al., 2020). The BBM model has also been extensively checked in different studies related to clays (Gallipoli et al., 2010; D’Onza et al., 2015) and used for construction analysis (Alonso et al., 2005; Sadeghabadi et al., 2021; Showkat et al., 2022). The BExM has also been used by Lloret et al. (2003) and Navarro et al. (2014) to investigate the swelling and water uptake behaviour of double structured clay-based materials.
There are four major steps necessary to generate a proper and validated model. The first was to generate a proper geometrical configuration, taking into account current canister and tunnel spacing based on thermal dimensioning calculations (Section 2.1). Following the geometrical configuration being set, thermal boundary conditions were set according to a proposed initial canister power. The next step was to fit THM model parameters of the materials by means of the calibration (Section 2.1 and 2.2) and simulation (Section 2.3) of laboratory scale tests. As the last step, a base case was defined, and sensitivity analysis (Section 3) has been performed in order to deal with model/data uncertainties.
Performance targets related to swelling pressure limits, buffer upheave, hydraulic conductivity evolution of the EBS components, and the maximum temperature were investigated. Moreover, saturation times were obtained in different geological (fractured rock and saline groundwater) conditions.
2 THM processes and material model calibrations
The early phase thermo-hydro-mechanical (THM) evolution of buffer and backfill is characterised by transient conditions that include temperature changes promoted by the decay heat of the spent fuel contained in the canisters. At the same time, the buffer and backfill next to the host rock are able to uptake water and start swelling, depending on the availability of water from the geosphere and the THM properties of the buffer and backfill (Hjerpe et al. 2021). A laboratory testing campaign (thermal conductivity, water retention curve, oedometer, and infiltration tests) is required in order to define and set the THM model parameters of the corresponding materials that are part of the EBS.
Figure 2 shows the components of the EBS in the KBS-3V design being considered. The reference material for the backfill considered in this paper is Italian GraFi. However, Bulgarian GraFi has been considered as an alternative backfilling material (Karvonen, 2018b).
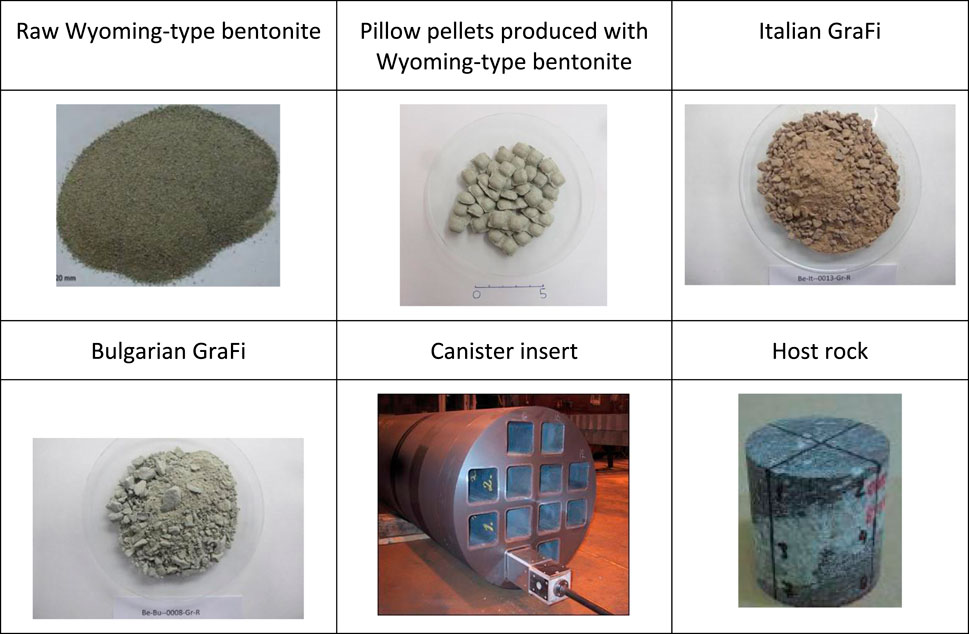
Figure 2. Materials and components in the KBS-3V disposal method.
Buffer consists of two main components (Juvankoski et al., 2012; Karvonen, 2018a) produced with Wyoming-type bentonite (Karnland et al. 2006; Kiviranta and Kumpulainen, 2011; Posiva, 2021). Pillow pellets are also manufactured from Wyoming-type bentonite. The characterization of the raw material for pellets is described in Kiviranta et al., 2016.
The canister consists of a copper shell and a nodular graphite-cast iron insert which holds the spent fuel elements (Ikonen and Raiko, 2013; Posiva, 2021). The host rock (Kukkonen, 2023) and rock fracture network are the other components of the KBS-3V design. Geometry, meshing, and detailed information about all components are in Section 3, which describes the base case.
The EBS components (buffer and backfill) are initially unsaturated. Table 1 lists initial liquid pressure (PL), initial degree of saturation (Sr), initial porosity (ϕi), and corresponding initial dry density (ρd) for the materials.

Table 1. Initial magnitude of THM parameters prior to emplacement.
The initial liquid pressures in the filling components have been calculated from the water content and dry density prescribed for the filling components in the buffer (Juvankoski et al., 2012) and backfill. Intrinsic permeability (k) is porosity dependent and will not be constant during the THM processes. Total permeability (kkrl) and thermal conductivity (λ) are dependent on the degree of saturation. Therefore, the magnitude of these parameters is included in Table 1. The variation of these parameters according to the porosity and degree of saturation will be discussed in subsequent sections.
2.1 Thermal process and model parameters
Following emplacement of the canisters, the spent nuclear fuel will undergo radioactive decay and generate heat that affects the EBS and host rock. The magnitude of applied heating power will govern the temperature levels in the repository. The decay function for canister power has been calculated based on the work of Ikonen (2003) and Hökmark et al. (2009) on the thermal design of the construction licence application for the repositories in Finland and Sweden, respectively (Figure 3). In order to calibrate the canister power decay function, 1700 W of initial canister power, waste deposition after 30 years of interim storage, and a burn-up of 38 M Wd/kgU have been considered. This power corresponds to the canisters with spent nuclear fuel from the Olkiluoto 1 and 2 reactors (Ikonen et al., 2018). The power as a function of time (Equation 1) for an individual canister can be expressed as (Ikonen, 2003; Hökmark et al. 2009):
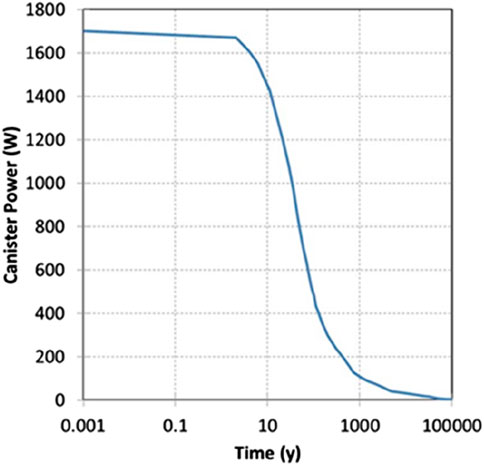
Figure 3. Canister power decay function.
In this expression, P (0) is the canister power at the time of deposition and ai and ti are parameters. More details associated with the calibration process of the heat decay function can be found in Toprak et al. (2018a).
In the repository, heat will be mainly transported by conduction. Heat dispersion is considered negligible, as the fluid fluxes are small due to the low hydraulic conductivity of all the materials. The advective/convective heat transport is relatively low because the amount of mass moving through the buffer and rock is small (their hydraulic conductivities are quite low). For this reason, the thermal dimensioning of the repository is carried out by solving just the energy balance equation, assuming only heat flux by conduction (Ikonen, 2003; Ikonen et al., 2018).
The non-advective heat flux is typically given by Fourier’s law:
where the thermal conductivity λ is often prescribed as a constant or dependent on water saturation. Thermal conductivity is calculated following Villar (2002):
Sl* and b being parameters, and where
In repository-like conditions, thermal conductivity will not be constant. Under initial conditions (Table 1), thermal conductivity has a lower value than saturated conditions. Figure 4A shows the initial conditions of the EBS components and the variation of the thermal conductivity according to the degree of saturation. In Code_Bright (Olivella et al., 2023), the liquid pressure is an input parameter, and the degree of saturation is calculated according to the water retention curve (WRC). As can be seen in Figure 4A, each material has an initial suction, a corresponding degree of saturation (calculated following Equation 7 and an initial thermal conductivity (calculated following Equation 4).
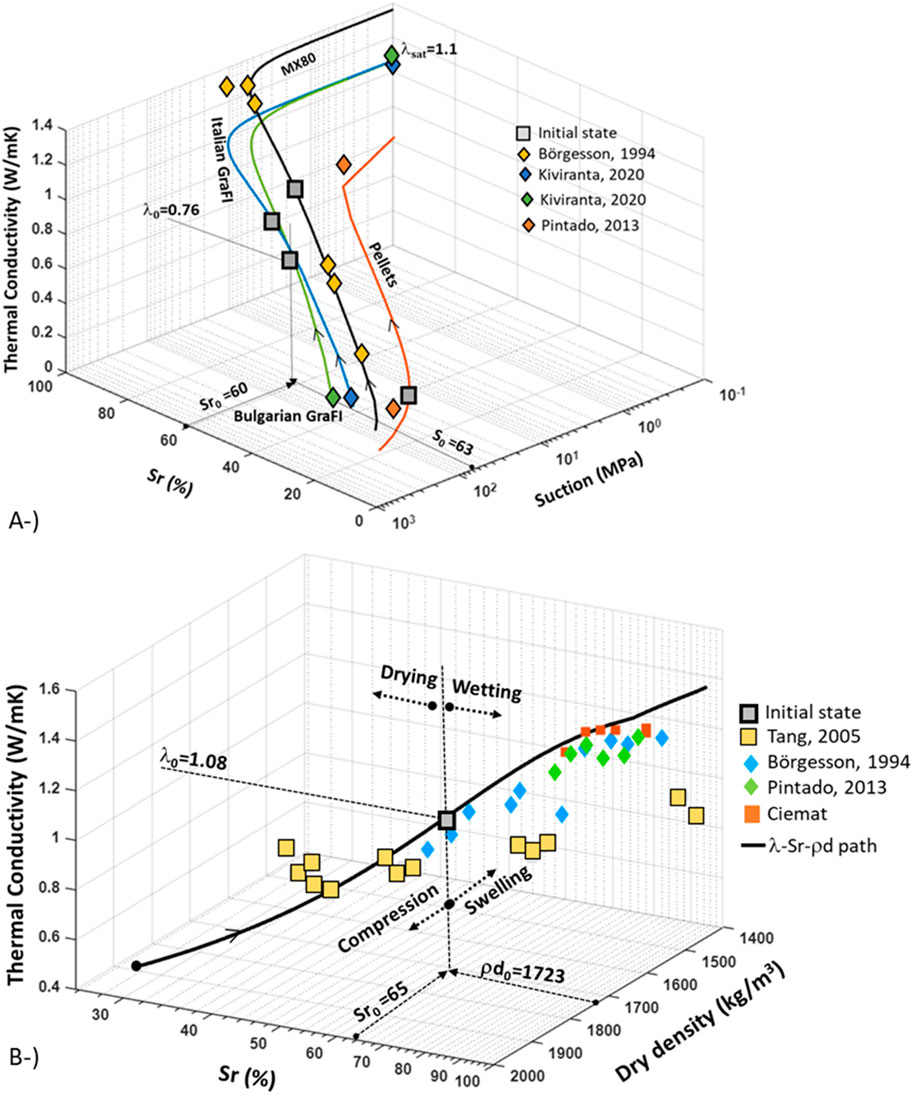
Figure 4. Thermal conductivity–Sr–Suction path for all EBS (A) components; thermal conductivity–Sr–dry density calibration path for Wyoming-type bentonite (B).
Thermal conductivity increases during saturation. On the other hand, Figure 4B shows the thermal conductivity degree of saturation and dry density path for Wyoming-type bentonite. A single calibration line was depicted for Wyoming-type bentonite based on test data (Börgesson et al., 1994; Tang and Cui, 2005; Pintado and Rautioaho, 2013). Ciemat data in Figure 4B were discussed in Pintado and Rautioaho, 2013. The dry density axis was adjusted from porosity-dependent WRC following Equations 8 and 9. In repository-like conditions, drying and, therefore, de-saturation will occur close to the canister. During drying, thermal conductivity will decrease. Upon wetting and saturation, some parts of the EBS will undergo swelling (e.g., upper buffer) and some sections (e.g., central backfill) will undergo compression. As WRC is porosity-dependent, the saturation process will be influenced by the mechanical process. As summarized in Figure 4B, thermal conductivity depends on hydro-mechanical coupling. Initial dry density, degree of saturation, and thermal conductivity are given in the figure. In the long term, the buffer will reach full saturation. However, final dry density in buffer or backfill depends on the long term THM interactions taking place in the deposition hole and tunnel. Therefore, the final dry density in this graph is merely representative and shows a continuous path. The model response will be discussed in Section 3 in terms of dry density evolution.
One of the other input parameters associated with the thermal process is the thermal expansion coefficient (Equation 6). The solid density is given by
where
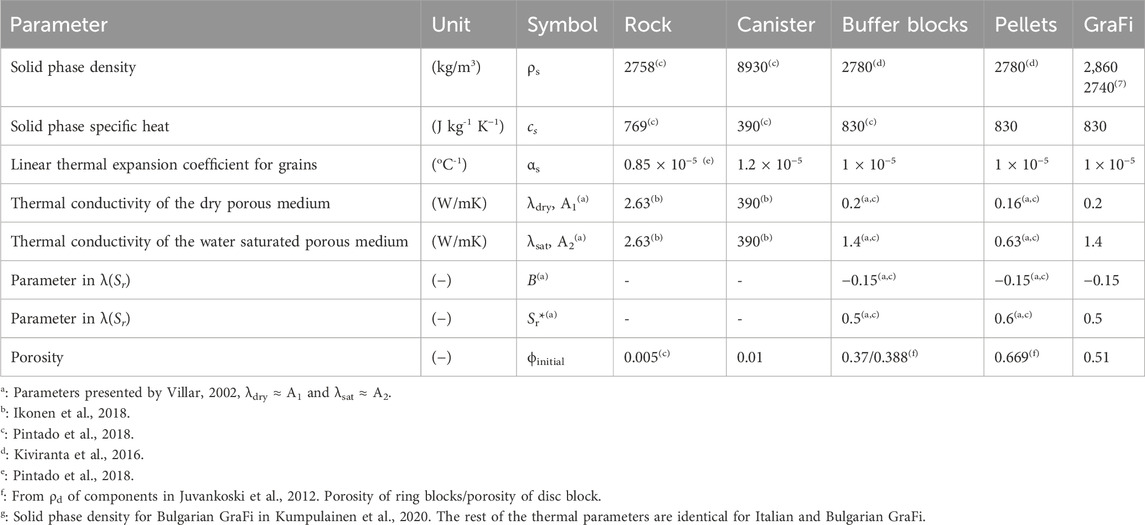
Table 2. Thermal parameters of model components.
The thermal effects on the hydro- (permeability) mechanical (swelling pressure) behaviour of compacted clays or bentonites (used as engineered barrier systems in deep geological repository design) is limited under the temperatures of 100°C, as shown by studies such as Villar et al. (2010). In this study, the maximum temperature was calculated as 80°C–85°C depending on the model configuration (Section 3). Therefore, temperature-dependent permeability or swelling pressure models (direct relationship between temperature-permeability or temperature-swelling pressure) are beyond the scope of this study.
2.2 Hydraulic process
The water moves from the rock or a rock fracture to the canister and saturates buffer and backfill. Given that the gas pressure is considered constant, there is no gas transport by advection. The water retention curve and intrinsic and relative permeability parameters are main input parameters in the model.
The liquid degree of saturation (shortened to the degree of saturation in the following) of the porous medium is related to the liquid pore pressure by use of a water retention curve, here exemplified by the water retention curve of van Genuchten (1980):
with
A water retention curve test was conducted for each material. The WRC parameters for compacted Wyoming-type bentonite and pillow pellets produced with the same bentonite were previously used in THM calculations under 2D axisymmetric models (Toprak et al., 2016; Toprak et al., 2018a). WRC parameters for Italian and Bulgarian GraFi are provided in Table 3. The calibrated WRC for each reference porosity is shown in Figure 5A. It must be noted that the reference porosity (ϕ0 in Equations 8 and 9) is not the initial porosity but the considered porosity for the calibration. In pillow pellets, reference porosity corresponds to macro-porosity when a double structure model is taken into account.
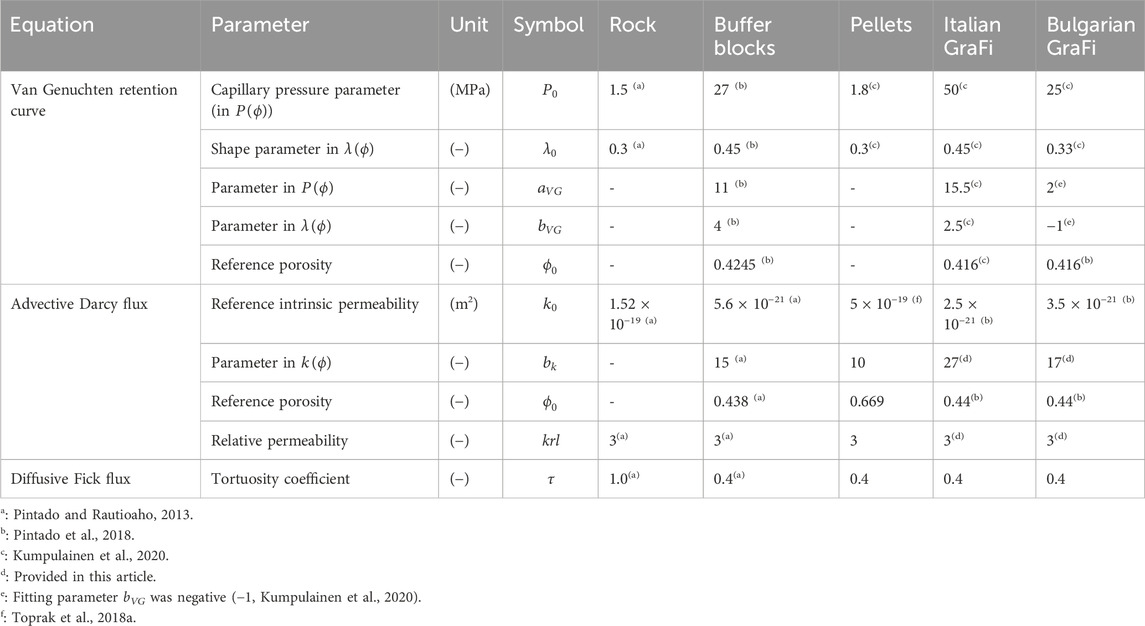
Table 3. Hydraulic parameters of model components.
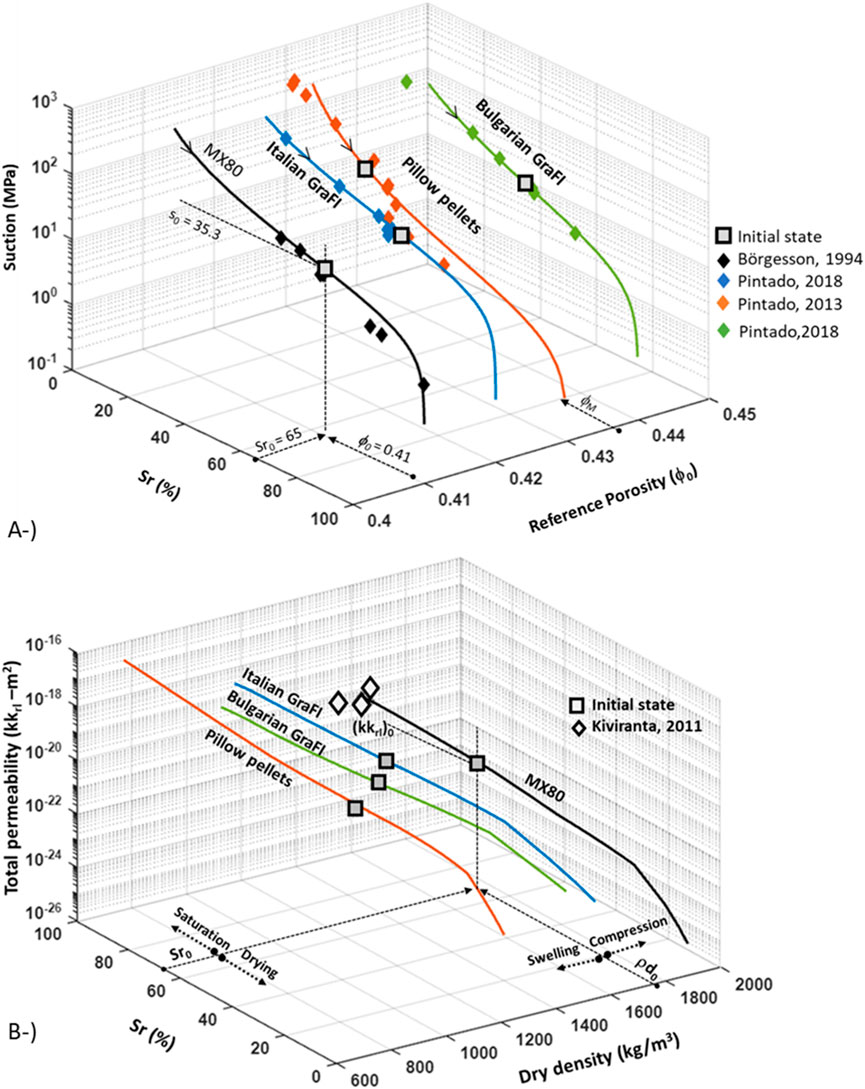
Figure 5. Water retention curve for all EBS components, fitted by reference porosities (A). (NB reference porosity for pellets corresponds to macro-porosity). Total permeability–Sr–dry density path for all EBS components (B).
The advective mass fluxes (Equation 10) include the phase velocity qα, typically given by Darcy’s law (Brown, 2002), which reads, for Code_Bright’s formulation,
where k (m2) is intrinsic permeability considered as a function of the porosity following (Åkesson et al., 2010; Pintado et al., 2018):
The relative permeability krl, given by Gens et al. (2009), Åkesson et al. (2010), and Chen and Ledesma (2009), is
Total permeability (kkrl) is a product of intrinsic and relative permeability. Figure 5B shows the total permeability degree of saturation and the dry density path for EBS components under repository-like conditions. Calibrated parameters are listed in Table 3. Although total permeability will decrease during drying close to the canister and will increase following saturation, intrinsic permeability will increase or decrease according to changes in porosity. The total permeability of Wyoming-type bentonite under saturated conditions for a given density is compared with test data (Kiviranta and Kumpulainen, 2011). It must be noted that these are continuous calibration lines based on initial conditions. The final state of dry density marked for each material is merely representative in Figure 5B. The long-term response of the materials in THM modelling will be shown in Section 3.
Diffusive (i.e., non-advective) mass fluxes are usually described by Fick’s law (τ: tortuosity, ϕ: porosity, ρg: density of gas phase, ρgw density of the vapour, Sg: degree of saturation, and Dw: diffusion coefficient):
where
where pg is the gas phase pressure.
The parameters used, such as shape parameter and tortuosity, are determined by the back-calculations of laboratory scale tests. An alternative way to determine these parameters can be microscopic techniques such as AI-based SEM (Chow et al., 2022) and CT scan analysis (Li et al, 2024). More information about back-analysis for the calculation of thermal and hydraulic parameters carried out with CODE_BRIGHT can be found in Pintado et al. (2002).
2.3 Mechanical process
The mechanical process is coupled with thermo-hydraulic processes. The heat flow will dry the bentonite, leading to a reduction in its volume, given that the drying induces shrinkage. Heat-flow will affect the ring blocks and disc blocks at the top and bottom of the canister and the pellets filling in the inner gap. Shrinkage is a local effect and finishes after a few years (if the host rock supplies enough water). The water will pass first from the host rock to the pellets and then from the pellets to the blocks. The clay minerals both in the pellets and the blocks will hydrate and swell. The hydration and swelling process in compacted bentonite such as the Wyoming-type is well known (see e.g., Villar, 2005; Karnland et al., 2006; Kiviranta et al., 2016; Sun, 2016; Kiviranta and Kumpulainen, 2011). Additional information can be found on the hydration and swelling of other clays, which could also be used as buffer materials, such as on FEBEX bentonite, the buffer material candidate for the Spanish design (Enresa, 2000; Villar, 2002), Kunigel and FoCa7 clays from Japan and France, respectively (Delage et al., 2010), or GMZ from China (Zhao et al., 2016).
Oedometer and infiltration tests have been performed on materials in order to calibrate mechanical model parameters. The simulation of laboratory scale tests for fitting the mechanical model parameters of blocks and pillow pellets manufactured with Wyoming-type bentonite were previously performed by Toprak et al. (2016) and Toprak et al. (2018a). This paper provides the simulation results of the oedometer (Figure 6A) and infiltration (Figures 6B, 7A) tests of Italian and Bulgarian GraFi materials. As shown in Figure 7A, the lower part of the sample undergoes swelling and the upper part undergoes compression in a swelling pressure test. As permeability is porosity dependent, it increases close to the injection point.
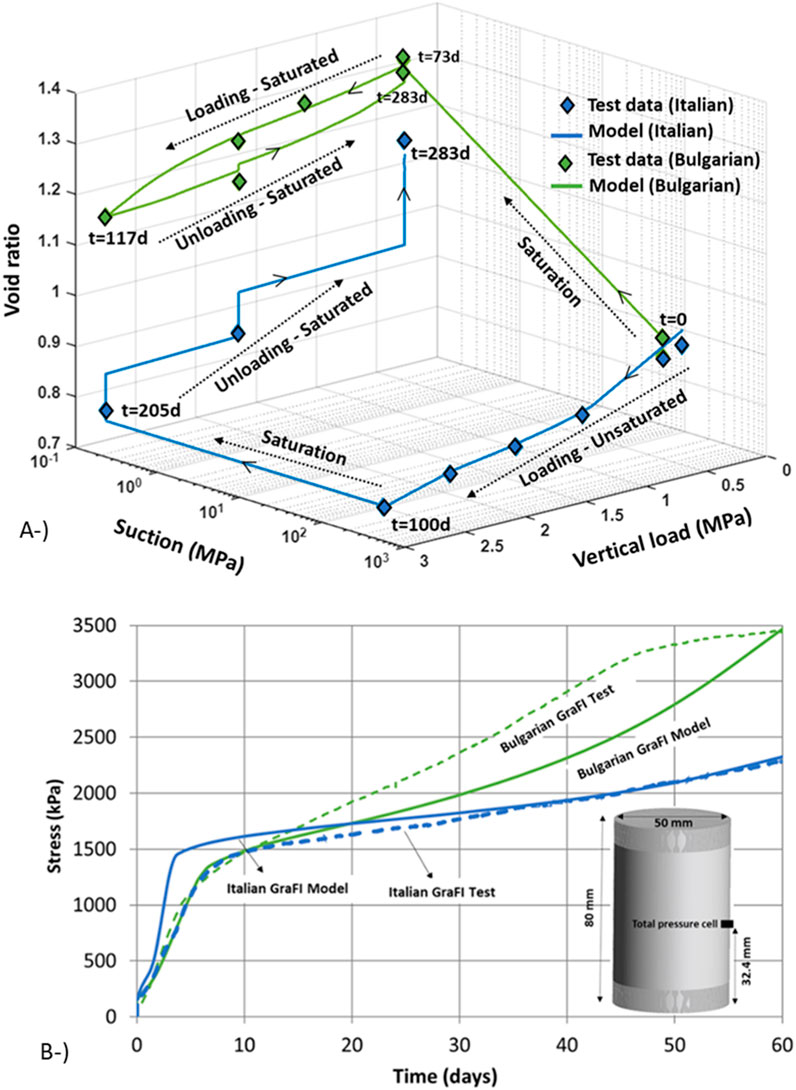
Figure 6. Oedometer (A) and infiltration test simulation results (B) for Italian and Bulgarian GraFi.
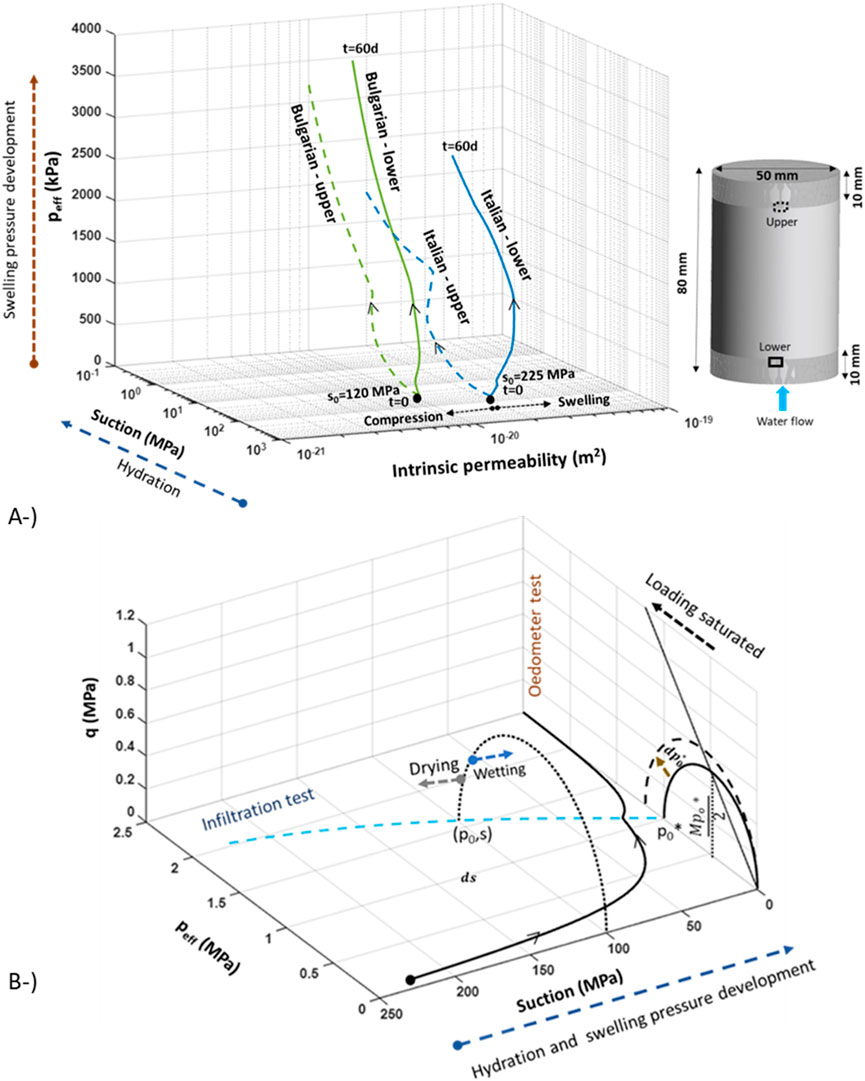
Figure 7. Swelling pressure–suction–intrinsic permeability path for infiltration tests performed on Italian and Bulgarian GraFi (A). q-peff-s path for Italian GraFi based on calibrated BBM parameters by means of simulation of oedometer and infiltration tests (B).
As can be seen in Figure 6, the oedometer tests were performed following different saturation and loading–unloading paths. Italian and Bulgarian GraFi have different swelling pressures. BBM has been used to simulate laboratory scale tests in order to fit mechanical model parameters. The elastic part of this model was extended to be able to deal with expansive clays. The limitations of this extension have been discussed in Alcoverro et al., 2023. The model formulation is described below (from Equations 15–21). The effective stress is defined as
is derived from
In this paper, κi and κs are constants (κi0 and κs0) as in the original BBM, with M being a critical state line parameter and p0 considered to be dependent on suction:
where pc is the reference stress, po* is the initial pre-consolidation stress for saturated conditions, λ(0) is the slope of void ratio in saturated conditions, r defines maximum soil stiffness, β controls the rate of increase of soil stiffness with suction, α1 and α3 are parameters for elastic thermal strain, ps0 is the tensile strength in saturated conditions, k takes into account the increase of tensile strength due to suction, and ρ takes into account the decrease of tensile strength due to temperature.
Hardening depends on plastic volumetric strain according to
Figure 7B shows q-peff-suction path for Italian GraFi. The path has been depicted based on calibrated BBM model parameters by means of modelling a laboratory scale test. As shown in Figure 7B, at least one oedometer and one infiltration test is required in order to fit BBM parameters. The LC curve and parameters associated with swelling are fitted by means of a swelling pressure test. Parameters associated with hardening and compressibility were fitted by oedometer test simulations. The BBM parameters for EBS components are listed in Table 4.
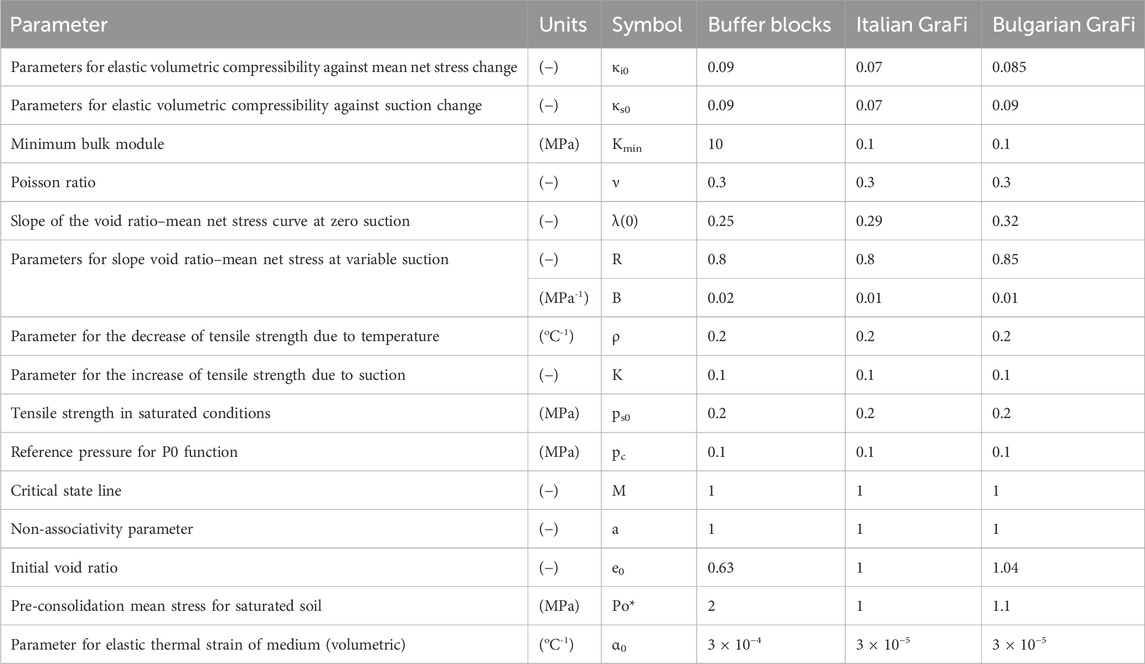
Table 4. BBM parameters of blocks produced with Wyoming-type bentonite and Italian and Bulgarian GraFi.
Pillow pellets in base case (Section 3) are modelled with an elastic model (Equations 22, 23) that considers swelling pressure development during hydration. Bulk modulus (Κ) is a function of void ratio (e), slope in e-ln (p′) diagram (κ), and mean effective stresses (p′ or peff). As e, κ, and p’ are known from previous calibration and modelling work (Toprak et al., 2018a), elastic modulus can be calculated using
Elastic parameters for the rock, canister, and pellets are listed in Table 5.
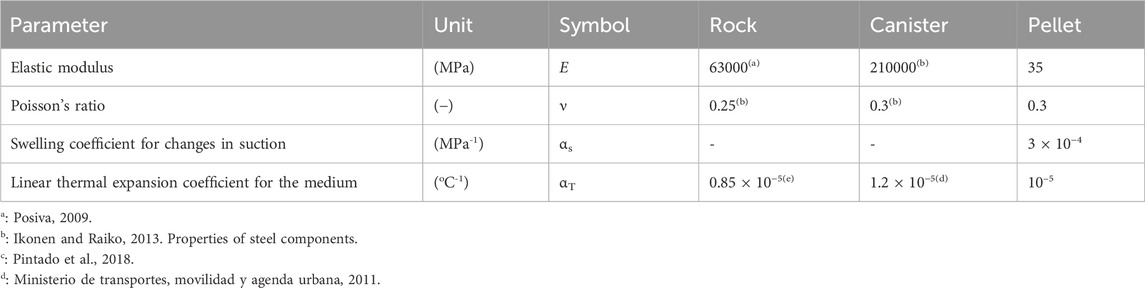
Table 5. Mechanical parameters (elastic) for rock, canister, and pellets.
The Barcelona expansive model (BExM) considers double porosity structure (micro and macro). In one case in sensitivity analyses (Section 3), BExM (from Equations 24–32) has been used as a mechanical model for pillow pellets. Model parameters (Table 6) have been calibrated following the simulation of oedometer and infiltration tests as discussed in Toprak (2018b).
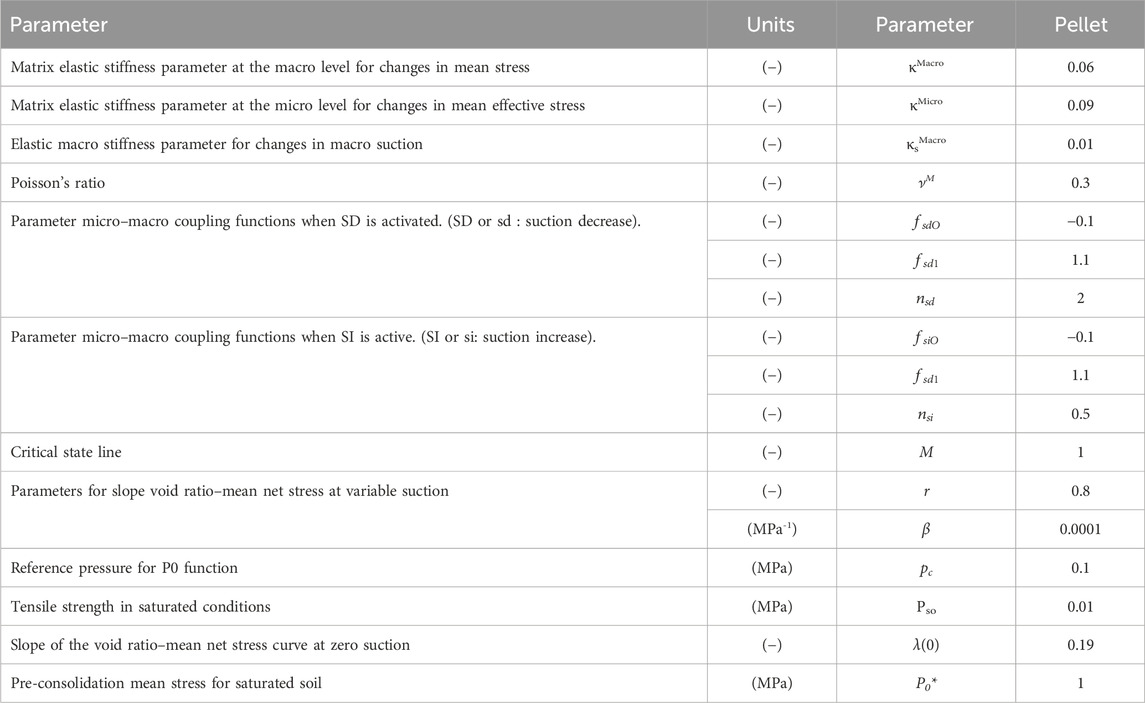
Table 6. BExM parameters for pellets.
Elastic volumetric strain of micro voids and macro voids:
Plastic strain of macro void:
Yield function:
where
2.4 Geo-chemical process
In addition to the principal THM processes taking place in the repository, there are other processes such as gas transportation, chemical reactions due to microbial activity, and changes in the groundwater composition (salinity changes) that might impact the long-term response of the repository. These processes might affect the performance targets of the buffer and backfill during the operational phase (Posiva, 2021). One of the cases of the sensitivity analyses (Section 3) —the impact of the salinity of the groundwater on the THM response of the repository—was investigated. Dixon (2000) and Vieno (2000) were considered as a basis for investigating the impact of salinity in the THM response of the system. When the dry density is higher than 900 kg/m3, no consistent reduction of the swelling pressure of bentonite-based materials tested under highly saline conditions can be observed relative to those observed under freshwater percolation.
Saline water reduces the swelling pressure (Karnland et al., 2006; Martikainen and Schatz, 2011). The hydro-mechanical parameters of materials in this project (clay and pellet-based material components) were set for different degrees of salinity considering the correlations given in Dixon (2000). Relationships between effective clay dry density (ECDD) and swelling pressure at various groundwater salinities and the expected bentonite pore water salinities in bentonite-groundwater systems have been described in Dixon (2000). ECDD is defined as dry mass clay/(volume occupied by clay + volume of voids). Given that the effect of salinity is larger at lower dry densities (Karnland et al., 2006), it can be concluded that salinity is expected to have more impact on pellet-based material components than in blocks or GraFi.
Under freshwater conditions, a certain proportion of the water is tightly adsorbed in clay particles and is thus not available for hydraulic processes. Under saline or “brine” conditions, the quantity of adsorbed water is lower, and for this reason the porosity available for water mass transport is higher, resulting in higher hydraulic conductivity. In order to deal with data uncertainty under saline conditions and following the correlations described in Dixon (2000), the intrinsic permeability of EBS components was increased one order of magnitude (merely representative) while swelling capacity was reduced 30% in all materials by means of modifying the κs0 parameter. For example, the intrinsic permeability of Italian GraFi was 2.5 × 10⁻²¹ (Table 3) and was increased to 2.5 × 10⁻²⁰ in saline water 70 g/L TDS conditions. The magnitude of κs0 for Italian GraFi was 0.07 (Table 4) in freshwater conditions and was decreased to 0.046 in saline water 70 g/L TDS conditions.
3 Model results and sensitivity analyses
Following the calibration of the THM parameters by means of back-calculations and simulations of laboratory scale tests, a base case was prepared in order to predict the long-term THM response of the repository. In the base case simulation, spent nuclear fuel from the Olkiluoto 1 and 2 reactors after 30 years in interim storage was simulated (initial heat power was 1700 W—Figure 3). The canister was placed at a depth of 436 m (initial temperature 10 ℃). The configuration of the repository had a 25-m deposition tunnel spacing and 8.9-m deposition hole spacing. Buffer and backfill components are shown in Figure 2. The buffer had three components manufactured with Wyoming-type bentonite: buffer ring blocks, buffer disc blocks, and pillow pellets. The backfill above the deposition hole was filled with Italian GraFi. The rock’s intrinsic permeability was considered to be 1.53 10⁻19 m2 (Pintado and Rautioaho, 2013), and the groundwater was assumed to be fresh water. The thickness of the inner gap filled with pellets was 35 mm. The materials and geometrical details are shown in Figure 8A. A more deformable and permeable EDZ (engineered damage zone—both one order of magnitude) for rock has been considered in order to reproduce the HM processes prior to emplacement of the EBS components. Initial stress was set as −10.57 MPa. The locations (P: point) considered to represent EBS components according to distance from the canister centre are shown in Figure 8B.
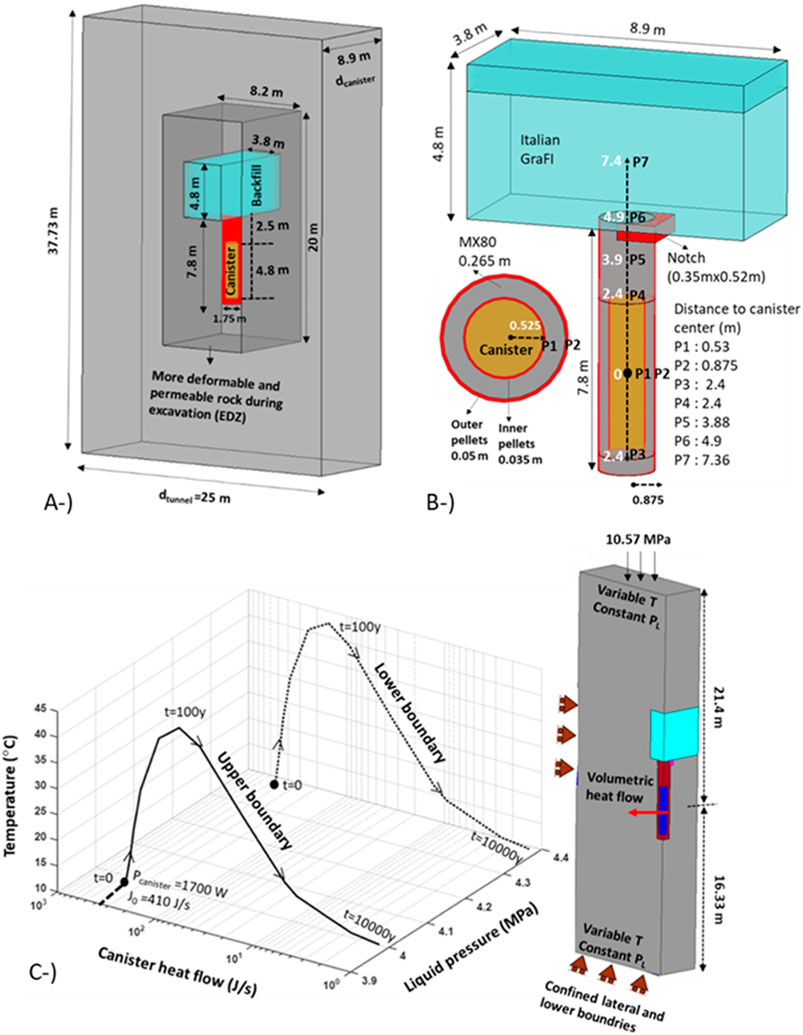
Figure 8. Geometrical details (A), locations considered (B), and boundary conditions (C).
The excavation sequence was simulated up to reaching the steady-state conditions (1 year). The canister and EBS components were installed following excavation. Degree of saturation, dry density, and other initial conditions of the materials during emplacement are listed in Table 1.
THM boundary conditions are shown in Figure 8C. Hydrostatic water pressure was set to upper and lower boundaries. The liquid pressure in the upper and lower boundaries corresponds to the distance to the surface. Temperature was variable in the upper and lower boundaries and calculated (Toprak et al., 2018a) according to distance from the canister considering canister initial power (Figure 3). As the upper and lower boundaries had different distances to the canister centre, the temperature evolution on these boundaries were different. Figure 8C shows how the temperature evolved under different but constant hydrostatic water pressure on the upper and lower boundaries according to heat flow from the canister. The canister was considered to be a separate material and the heat flow from the canister was modelled following a decay function of volumetric heat flow (Figure 3).
A sensitivity analysis plan was followed that took into account buffer and backfill design options, geological conditions, and numerical simulation options (Table 7).
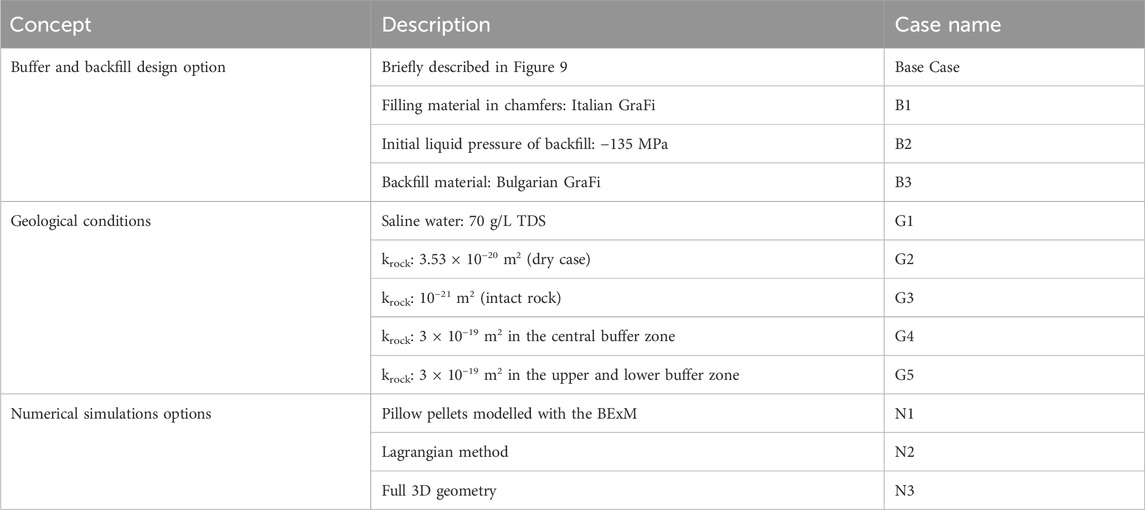
Table 7. Sensitivity analysis plan.
Sensitivity analysis represents alternative models, parameters, and/or initial and boundary conditions. Analysis of the sensitivity cases illustrates the effect of model and data (parameters, initial conditions, and boundary conditions) uncertainties. The sensitivity analysis was performed by changing different parameters of the components, such as the hydraulic conductivity of the rock, and changes in the design, such as changing the material in the deposition tunnel. The reference properties belong to a case defined as “base case” (geometry, initial conditions, and boundary conditions). A summary and the differences between the models are given in Figure 9. A 3D full geometry was prepared in Model N3, while sensitivity analyses have been performed considering a quarter geometry.
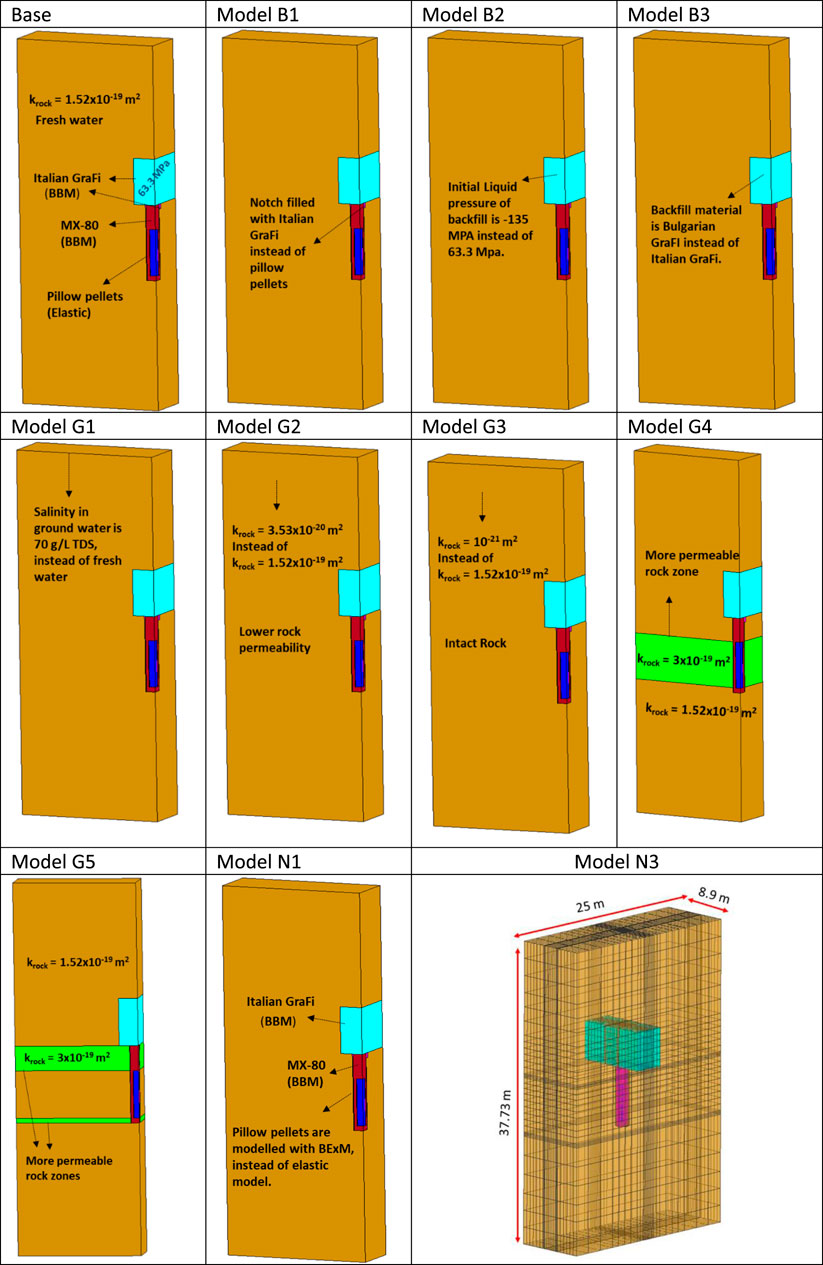
Figure 9. Models considered in the sensitivity analyses.
The main purposes for performing sensitivity analyses are as follows:
• To assess the consequences of future climate changes which might have an impact on groundwater properties due to the intrusion of fresh water into the repository after a glaciation (water from melted ice). The current groundwater at repository depth has a salinity of 10 g/L with variations from minimum values of 5 g/L in some parts of the deposition tunnel to a maximum calculated value for the operational phase between 12 and 25 g/L. However, the groundwater salinities may reach up to 50 g/L at the deepest part of the repository (Pastina and Hellä, 2010).
• To demonstrate the feasibility of the designed barriers under certain conditions, such as the initial conditions of the selected materials.
• To handle bedrock inflow conditions (presence of fractures and fracture locations).
• To evaluate alternative backfill materials in terms of the long-term safety of the repository after closure.
• To evaluate the buffer–backfill interaction in order to check the evolution of the buffer density. This interaction process was evaluated experimentally by Sandén et al., 2016 and numerically by Leoni et al. (2018).
• To develop a better understanding of the modelled system and test robustness.
Temperature distribution at earlier times (15 years) in buffer and backfill components are shown in Figure 10 for Case N3. The maximum temperature calculated was 78°C in the pillow pellet–canister interface. The temperature evolution in different locations (at different distances from the canister) is shown in Figure 11A. The temperature decreases according to the distance from the canister. The maximum temperature calculated in the backfill was 50°C–60°C. As shown in Figure 11A, a retardation in saturation due to low hydraulic conductivity resulted in a higher temperature in Case G3 (intact rock). The peak temperature was achieved at the canister mid-height and mostly affected the inner pellet gap (buffer pellets adjacent to the canister). Among the models, the maximum temperature was achieved in Case G3, peaking at 85°C. As the thermal conductivity increased according to the degree of saturation following Equation 3, a slower hydration resulted in lower thermal conductivity. Consequently, the heat dissipation following Equation 2 became slower and resulted in a higher a temperature.
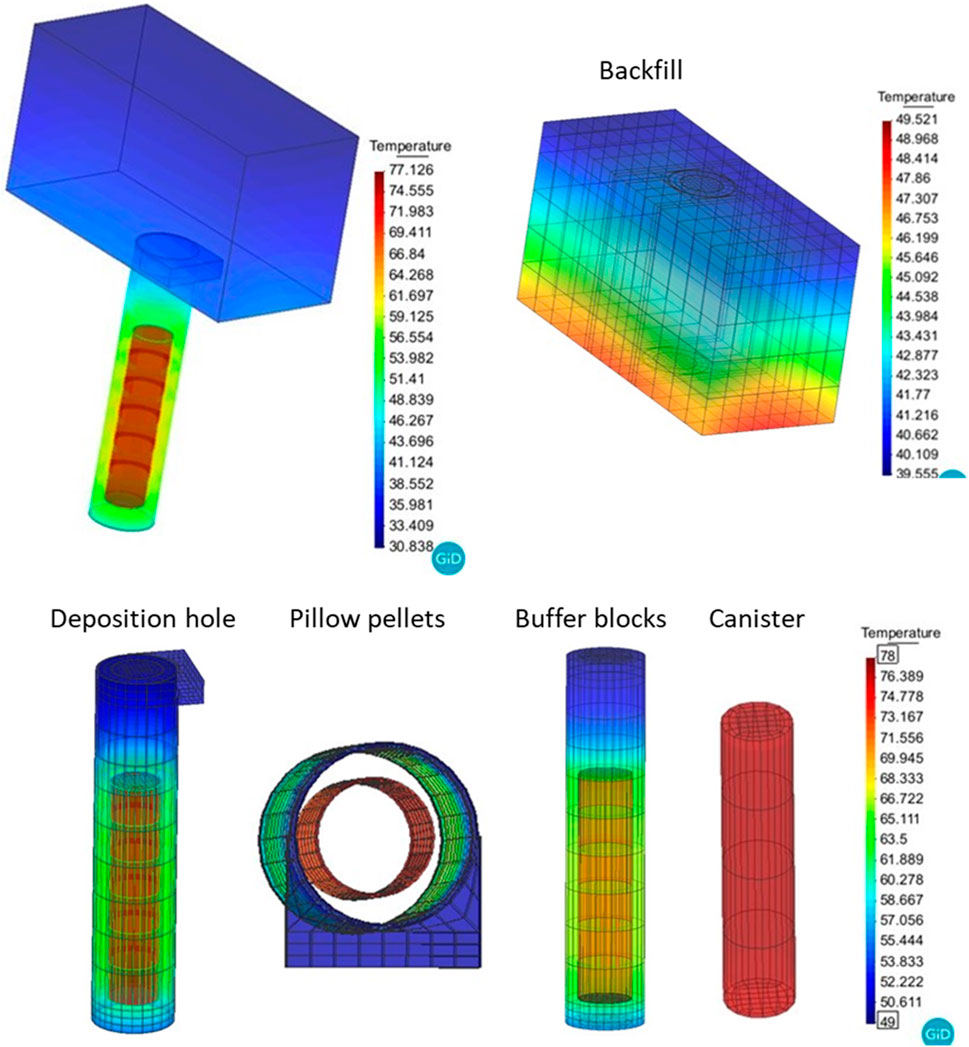
Figure 10. Distribution (15 years) of temperature in deposition tunnel (up) and deposition hole (down) in 3D full geometry (Model N3).
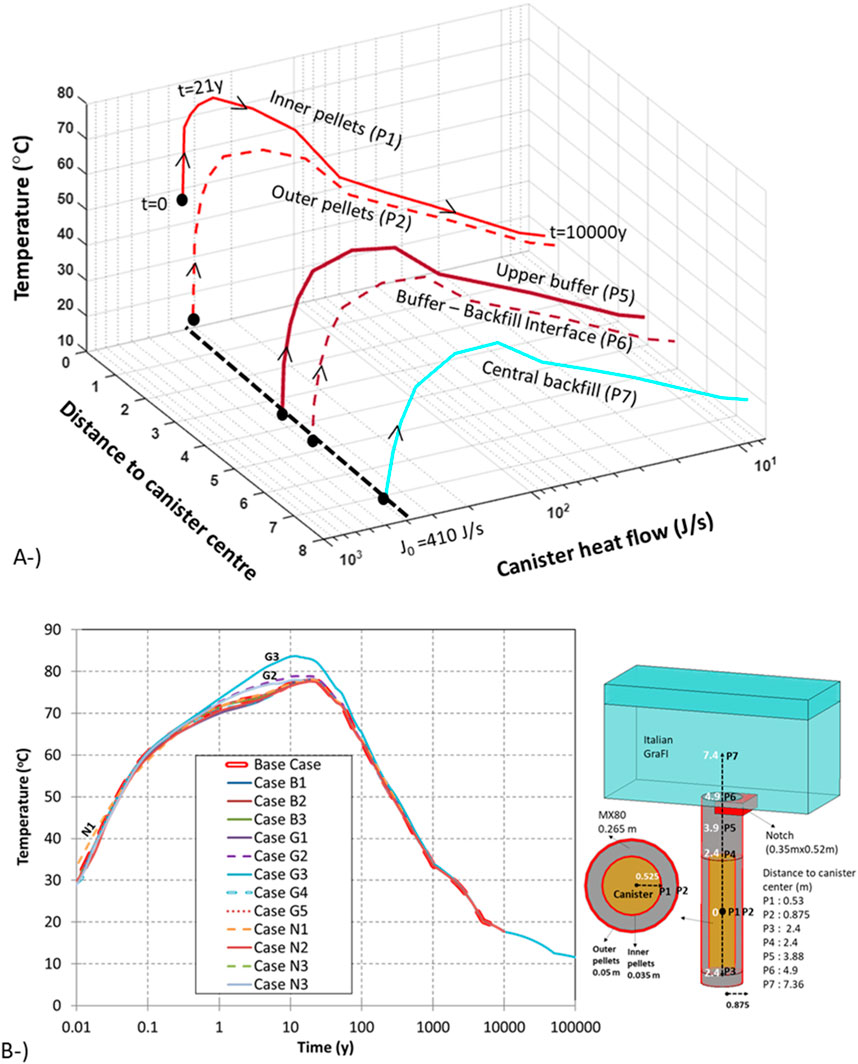
Figure 11. Evolution of temperature on the considered locations in Base Case (A). Evolution of temperature on canister wall-inner pellets contact in all models (B). Note: Case G3 was calculated up to 100,000 years and the rest of the models up to 10,000 years.
Several factors affect the maximum temperature and temperature evolution of the repository. Previous modelling (Toprak et al., 2018a) has shown that the repository design (tunnel and canister spacing), EBS design (air gap between canister and buffer disc), initial state of the components (initial degree of saturation), and the canister itself (initial canister power) play a role in the long-term evolution of temperature in the repository. In addition, rock intrinsic permeability is an important parameter that controls the saturation of the EBS components and accordingly has an impact on the achieved maximum temperature.
On the global scale, the temperature in a certain deposition hole will be controlled by its location within the repository. The local scale processes are associated with the temperature differences at various locations within the buffer or backfill. At the local scale, the state of the inner gap (filled with pillow pellets) and the buffer adjacent to the canister (i.e., dry or fully saturated, shrunken or swollen) is expected to be an important factor that controls the maximum temperature of the buffer and canister.
Temperature in the EBS is mainly controlled by the heat input and thermal conductivity of the buffer and bedrock (Toprak et al., 2018a). The thermal conductivity of the buffer is, in turn, a function of its saturation. In the long term, the saturation of the EBS will be controlled by the slow water-uptake from the host rock and/or a possible fracture.
Backfill temperature variations are moderate compared with those taking place in the buffer. The maximum temperature in backfill was calculated in the range of 50°C (Figure 11A). The mass of backfill is small compared with the surrounding rock mass, so the heat capacity and thermal conductivity of the rock will be more important in heat dissipation than the backfill thermal properties.
To ensure that the buffer’s maximum temperature is less than 100°C, the distance between deposition tunnels and individual deposition holes was chosen using a thermal dimensioning and optimization technique (Ikonen et al. 2018). THM sensitivity analysis was performed to determine the appropriate tunnel distance, canister distance, and canister decay heat power relations. The influence of the canister and tunnel spacing, the calibration of canister power function, and the numerical solution for thermal boundary conditions in THM modelling was given by Toprak et al. (2013 and 2016).
In previous modelling under a 2D axisymmetric model with a different backfill material (Toprak et al. 2018a), the following aspects were studied: the radiation term in thermal calculations, effect of air-gap thickness between buffer and canister, impact of the magnitude of thermal conductivity, magnitude of the thermal expansion coefficient of buffer and rock, initial water content of the buffer, and impact of the permeability of the rock. It was shown that maximum temperature might vary 80°C–105°C in different cases under different model configurations and material options.
Thermal dimensioning calculations (Ikonen et al. 2018) (not coupled) indicate that the canister surfaces reach their maximum temperature depending on the canister location approximately 10–30 years after emplacement. According to Ikonen et al. 2018, the surface temperature of the hottest canisters was estimated to be 90°C after a year of canister emplacement. In this paper, the coupled THM modelling leads to the highest buffer temperature of 80°C in base case. In THM-coupled modelling, the calculated maximum temperature is lower than the uncoupled thermal calculations. During hydration, the thermal conductivity increases in coupled THM modelling, resulting in a lower maximum temperature.
Wetting-drying-saturation and cooling paths for the selected points in the base case are shown in Figure 12A, where buffer and backfill wetting began immediately upon installation. As the outer pellet (P2) is adjacent to the rock wall, it is the first location that encounters groundwater and starts saturation. In contrast, inner pellets (P1) are far from the rock wall and adjacent to the canister. Therefore, saturation did not take place immediately in P1. In the inner pellets, drying occurs at the beginning of the simulation due to the heat supply from the canister. According to the graph in Figure 12A, the strongest drying lasts 2 years, and maximum temperature is reached at the end of 21 years. Following the severe drying process, a retardation in saturation was observed in the inner pellets. The graph shows that the inner (P1) and outer pellets (P2) started from the same initial conditions (degree of saturation and temperature). However, these two points followed a completely different saturation-temperature path. The time to reach the maximum temperature, the magnitude of the maximum temperature, and the time required to reach full saturation were significantly different in the inner and outer pellets.
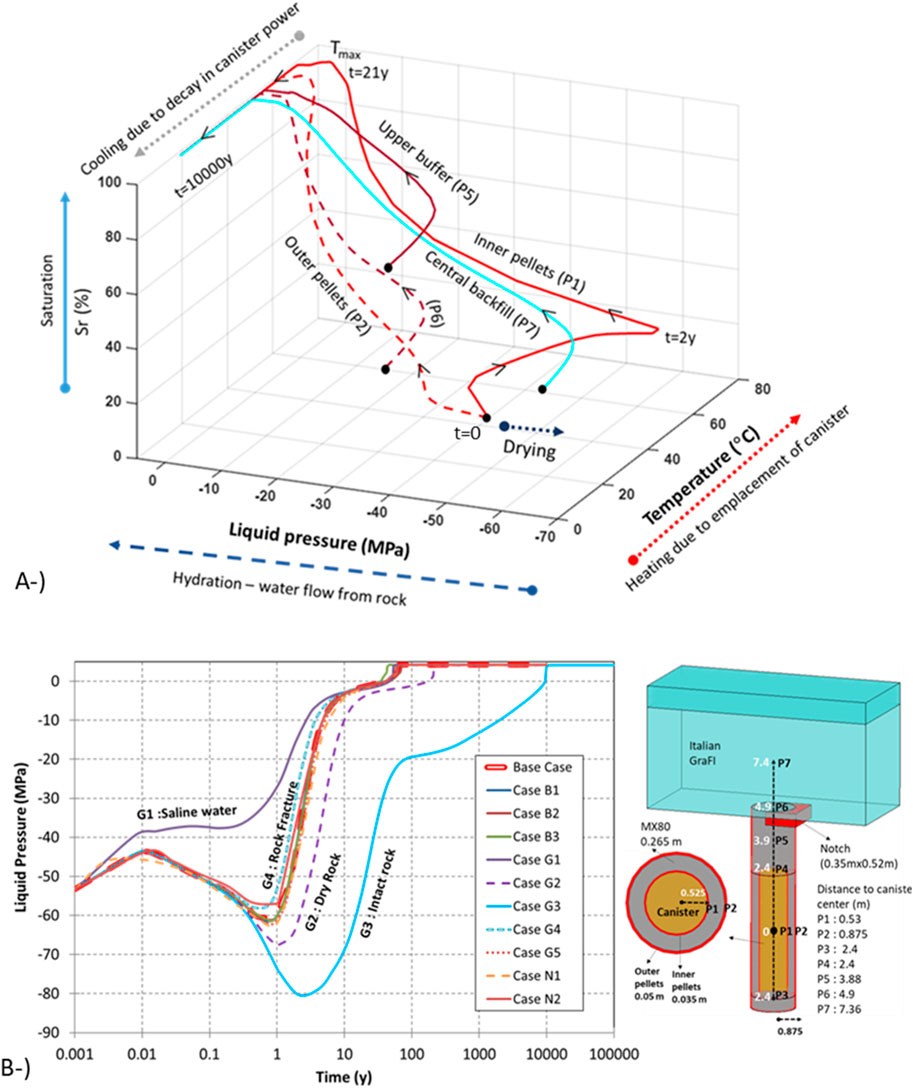
Figure 12. Sr–liquid pressure–temperature path for the locations considered in base case (A). Evolution of liquid pressure on upper buffer blocks (P5) in all models (B).
In the locations of the upper buffer (P5), buffer–backfill interface (P6), and central backfill (P7), there was no important drying process. As shown in Figure 12A, these locations were initially unsaturated. They followed a different temperature-saturation path. The maximum temperature peak in each location was different and depended on the distance from the canister. The time to reach full saturation in each location under the same model configuration depends on the material properties (THM model parameters) and distance from the rock and the canister.
Wetting of the granular backfill material (P7) was similar to the hydration process of the outer pellets (P2). The location closest to the rock walls encountered groundwater early, such as the backfill–host rock interface. The path depicted for backfill in Figure 12A considers the central part of the backfill. As the backfill material has a large volume, there will be important discrepancies in the time to reach full saturation within the backfill domain depending on the distance from the rock wall interface.
Due to vapour flow from the canister to the buffer (P3 and P4), a strong drying of the buffer below and above the canister was observed at early times (Figure 14A). During the drying process, the thermal conductivity (Equation 3) and total permeability (Equation 12) of the buffer decreased because of desaturation. Similar responses were observed in both laboratory (Pintado et al., 2002) and in-situ tests such as FEBEX (Gens et al., 2009) in the prototype cepository test (Chen and Ledesma, 2009) and the canister retrieval test (Kristensson and Börgesson, 2015). After 2–4 years, depending on the location, the dried bentonite started to rehydrate due to the dominant water flow from the rock, despite the continuous heat supply from the canister. The model response accords with previous studies (Johannesson 2007; Kristensson and Börgesson, 2015; Hakola et al. 2015), showing that the blocks around the canister (inner pellets) saturate faster than those above it due to slower water uptake (pellets are more permeable than clay blocks).
The liquid pressure evolution in the inner pellets (P1) in all sensitivity analysis cases is shown in Figure 12B. Heat supply from the canister generates a dryer area around the canister. The magnitude of the drying and the time to reach full saturation is different in the considered cases. Maximum drying was achieved in Model G3 (intact rock), whereas no important drying was observed in Model G1 (saline groundwater). The responses of the rest of the models were in the same range as the base case, showing some discrepancies according to rock permeability and initial conditions. As the micropores invaded macropores in Model N1 (pillow pellets modelled with BExM), intrinsic permeability decreased during saturation. Therefore, a higher retardation in saturation results in higher temperatures at early times in Model N1 than in base case. As summarized in Figures 12A and B, EBS components followed a different saturation-temperature path according to the distance from the canister and rock wall. The intrinsic permeability of the rock is an important parameter controlling not only the saturation-drying path but also the thermal process. Full saturation of the EBS components was achieved during the cooling period (after reaching the maximum temperature). The canister increases the temperature in the EBS (50°C–80°C depending on the location) and later temperatures gradually decreased towards the temperature of the host rock (10.5°C).
Figure 13A presents the path of effective stress-liquid pressure and temperature in the locations considered within the buffer and backfill. Effective stress corresponds to the swelling pressure once the material was fully saturated. The evolution of mean total and mean effective stresses have three components: swelling pressure developed during saturation (1), changes in hydrostatic pore pressure under saturated conditions (2), and thermal strains during the cooling period (3). The stress evolution was uniform within the buffer. The stress path in the inner pellets adjacent to the canister (P1) and in the outer pellets (P2) near the rock wall were completely different. Although the inner (P1) and outer pellets (P2) reached the same magnitude of mean effective stresses following saturation, the path that they followed was entirely distinct. The inner pellets (P1) first underwent drying, peaking at 80°C of maximum temperature and later saturated gradually. In contrast, the hydration started quickly in the outer pellets (P2), reaching a maximum temperature of 65°C. In both locations, the mean effective stresses were approximately 5 MPa in saturated conditions. The mean effective stresses gradually decreased during the cooling period because of thermal strains.
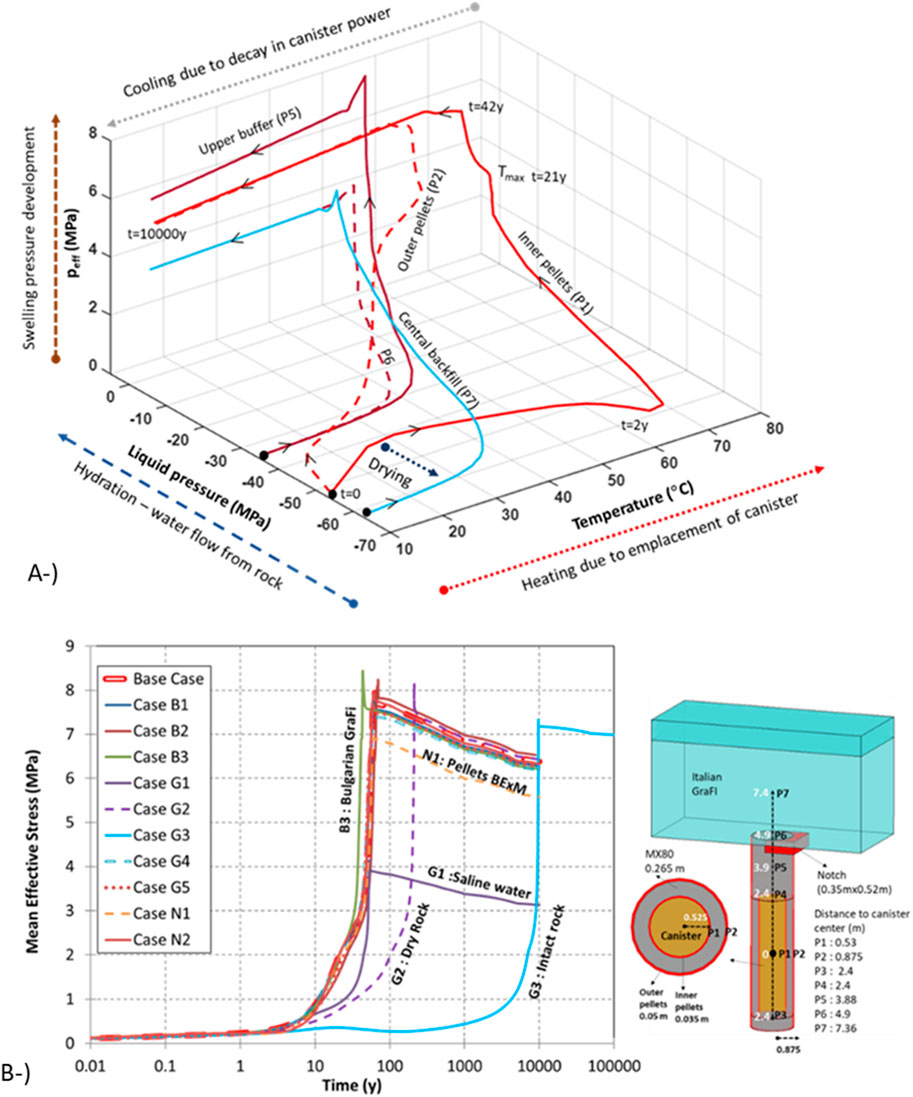
Figure 13. Swelling pressure–liquid pressure–temperature path for considered locations in base case (A). Evolution of mean effective stresses on upper buffer blocks (P5) in all models (B).
The mean effective stresses at the upper part of the buffer (P5) increased and peaked at approximately 8 MPa, but then decreased to approximately 5.6 MPa towards the end of the simulation. The earlier increase in mean effective stresses was a result of swelling as saturation took place. The magnitude of the swelling was controlled by the mechanical model (BBM). Swelling pressure was built up in response to saturation and differed as a result of initial variability in the emplacement dry-density values (buffer ring and disc have different initial porosities) in the buffer. In central backfill (P7), the developed mean effective stresses were lower than at the upper buffer (P5). The swelling pressure of bentonite depends on the composition of the material, so pellets, buffer blocks, and backfill peaked at different values of mean effective stresses. As shown in Figure 13A, the considered locations within the EBS followed different paths. They peaked at different temperatures under different wetting-saturation conditions and finally reached different values of mean effective stresses. The decrease in mean effective stresses during cooling due to thermal gradient (thermal strains) was controlled by thermal expansion; the magnitude of the decrease is different in EBS components (Figure 13A).
As the swelling capacity of the buffer blocks was larger than the pellets, the buffer blocks swelled towards the inner pellet fill and compressed the outer pellet fill. Similarly, the buffer blocks compressed the backfill because of their larger swelling capacity. The difference in the initial dry densities between the pellets and blocks was large (Table 1). Therefore, pellets and blocks underwent not only different swelling pressures but also different stiffnesses once they were saturated. Buffer blocks expanded and compressed the swollen pellets, resulting in a more uniform distribution of densities.
The evolution of mean effective stresses in the upper buffer (P5) in all models considered in the sensitivity analyses is shown in Figure 13B. Under saline water conditions (Model G1), the magnitude of mean effective stresses was the lowest. As discussed in Section 2.4, swelling capacity decreased in higher groundwater salinity rates. The magnitude of developed mean effective stresses was similar in the rest of the models. However, the evolution (the time to reach maximum stress level) was different and mainly controlled by rock permeability. In intact rock conditions (Model G3), the retardation in saturation was significantly high, so the mean effective stresses were not built up at earlier times. Another interesting observation is that the decrease in mean effective stresses in Model G3 was lower than in other models. In Model G3, there was almost a nonthermal gradient remaining once full saturation was reached. Therefore, thermal strains during the cooling period were limited compared to other models.
The buffer–backfill interface did not remain static during hydration because the buffer and backfill had different THM characteristics. As discussed in Section 2.3, the buffer has a higher swelling capacity than the backfill (Table 4). Therefore, the buffer expanded into the backfill (Figure 14). A BBI mock-up test (Rinta-Hiiro et al., 2017; Peura et al. 2016; Penttila et al. 2018; Pylkkanen 2019) confirmed that buffer upheaves under repository-like conditions.
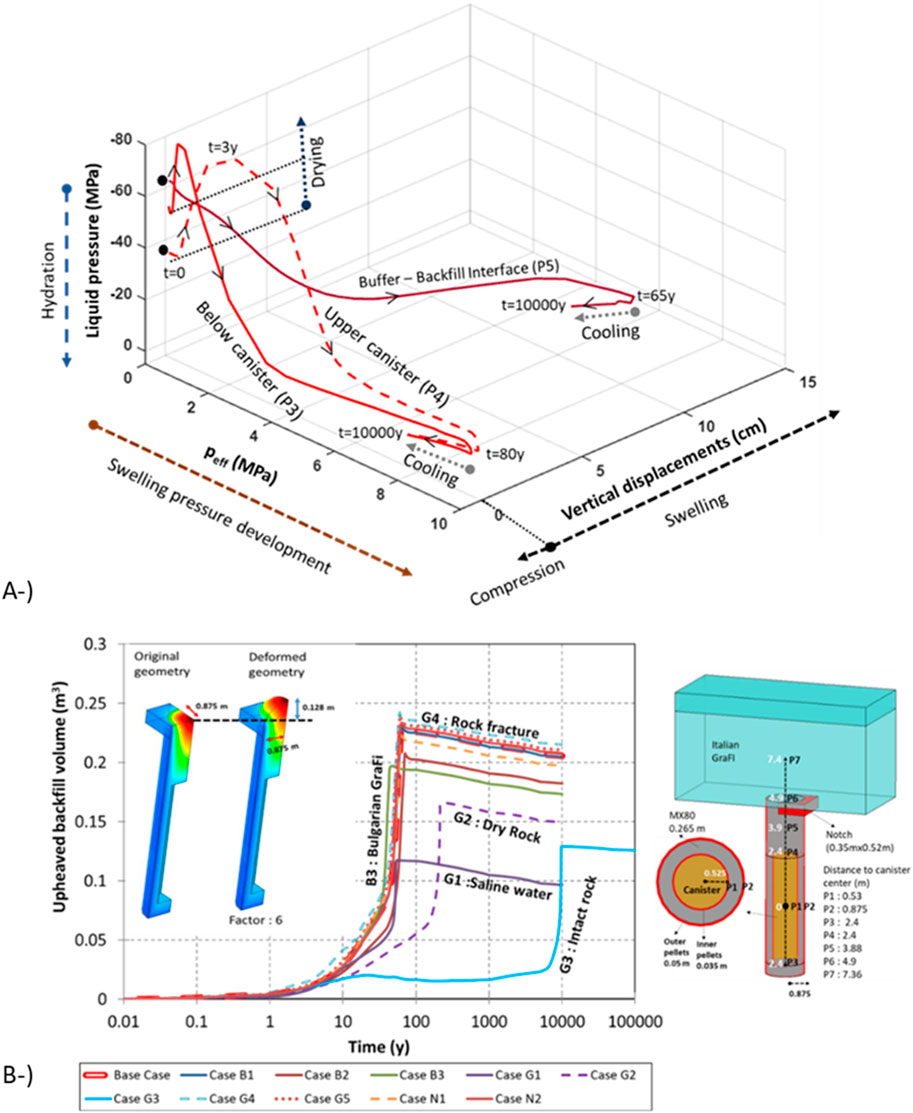
Figure 14. Liquid pressure–swelling pressure–vertical displacement path for locations considered in base case (A). Evolution of the volume of buffer penetrating backfill in all models (B).
Liquid-pressure mean effective stresses and the vertical displacement path for three points (below and upper canister and buffer–backfill interface) in the base case are shown in Figure 14A. In the locations of below (P3) and upper (P4) canister, liquid pressure first decreased as a result of drying (lasts 3 years). A small amount of shrinkage (compression) was observed below the canister because of the heating and emplacement of the canister. However, liquid pressure increased in the long term as hydration occurred. Following hydration, swelling of the buffer was observed in both locations (P3 and P4). After reaching full saturation (80 years for P3 and P4), there was a reduction in displacements because of thermal strains. Two points (P3 and P4) followed similar drying paths and reached the same swelling pressure (approx. 8 MPa), resulting in approximately 2 cm of vertical displacement at the end of the simulation.
In contrast to P3 and P4, there was no significant drying on the buffer–backfill interface (P6). Buffer upheaval mostly occurred years after the buffer and backfill were installed (65 years, Figure 14A). A maximum 13 cm of vertical displacements were achieved in the buffer–backfill interface at the end of the 65 years. Vertical displacements reduced during the cooling period due to thermal strains. Previous modelling studies (Toprak et al., 2018a) showed that filling the gap between the buffer and rock with water instead of pillow pellets (18 cm of vertical displacements) or a fracture passing from the upper part of the buffer (16 cm of vertical displacements) might result in higher vertical displacements in the buffer–backfill interface. A faster saturation of the buffer will lead to a higher buffer upheaval. Figure 14A summarizes the following steps: drying processes due to heat supply from the canister (1); saturation process because of water uptake from the rock (2); swelling process because of saturation (3); consequent development of displacements mainly on the buffer–backfill interface (4); reduction in displacements because of cooling shrinkage (5).
As the density of the buffer should remain 1950–2050 kg/m3 in saturated conditions (Juvankoski et al., 2012), the potential expansion of the buffer into the backfill should be limited. The volume change of the backfill caused by the buffer upheaval above the deposition hole should be less than 0.7 m3 (Posiva 2021). The evolution of the upheaved volume of backfill in all models considered in the sensitivity analysis is shown in Figure 14B. The magnitude of the upheaved volume of backfill depends on the model configuration. In slow saturation cases (Models G2 and G3) as well as under the saline groundwater configuration (Model G1), a lower displacement of the buffer and backfill interface was achieved. In Model B3 (backfill material: Bulgarian GraFi), the time to reach maximum displacements was shorter and the magnitude of the displacements was lower than the base case. As the Bulgarian GraFi is more permeable (Table 3) and has a larger swelling capacity than Italian GraFi (Figure 7B), the long-term THM response was different in Model B3. In all models, the upheaved backfill volume calculated was lower than 0.7 m3 and was approximately 0.23 m3 in the base case. It can be concluded that the main parameter affecting the amount of buffer upheaval was associated with the buffer saturation speed. Since saturation was slower in the backfill due to its higher volume, the faster the saturation, the more buffer upheaval there is. Increasing groundwater salinity also affects buffer upheaval. In higher salinities (Model G1), bentonite swelling pressure decreased. In Models G4 and G5 (more permeable rock around the canister), the vertical displacements were slightly higher in the buffer–backfill interface. As the host rock was initially saturated while buffer and backfill was ∼60% saturated at high suction (Table 1), there was a strong liquid pressure gradient from the host rock to the EBS components, resulting in desaturation of the host rock—albeit a slight desaturation caused by the pressure gradient. Therefore, the relative permeability as well as the water retention curve parameters of the host rock have a minor impact on the time required to full saturation.
Figure 15A shows the porosity–temperature–total permeability path for below canister (P3) and the buffer–backfill interface (P5) in the base case. The porosity decreased near the canister (P3) as a result of drying and suction, contracting the buffer earlier. Meanwhile, the porosity increased near the pellet–rock interface because of the hydration from the rock. Expansion of the buffer occurred in the locations close to the rock. The porosity change (P3) that occurred during the first few years because of drying recovered once the saturation took place due to the high swelling capacity of the buffer. During the drying of the buffer, the intrinsic permeability (Equation 11) decreased due to the reduction in porosity (P3) and total permeability decreased following Equation 12 because of de-saturation. Following saturation, the intrinsic permeability in the location considered (below canister P3) increased because of swelling, and total permeability increased due to saturation. Total permeability changed due to THM-coupled processes: drying due to heat supply (1), wetting due to hydration from rock (2), and swelling and compression (3) according to the distance from the canister and rock.
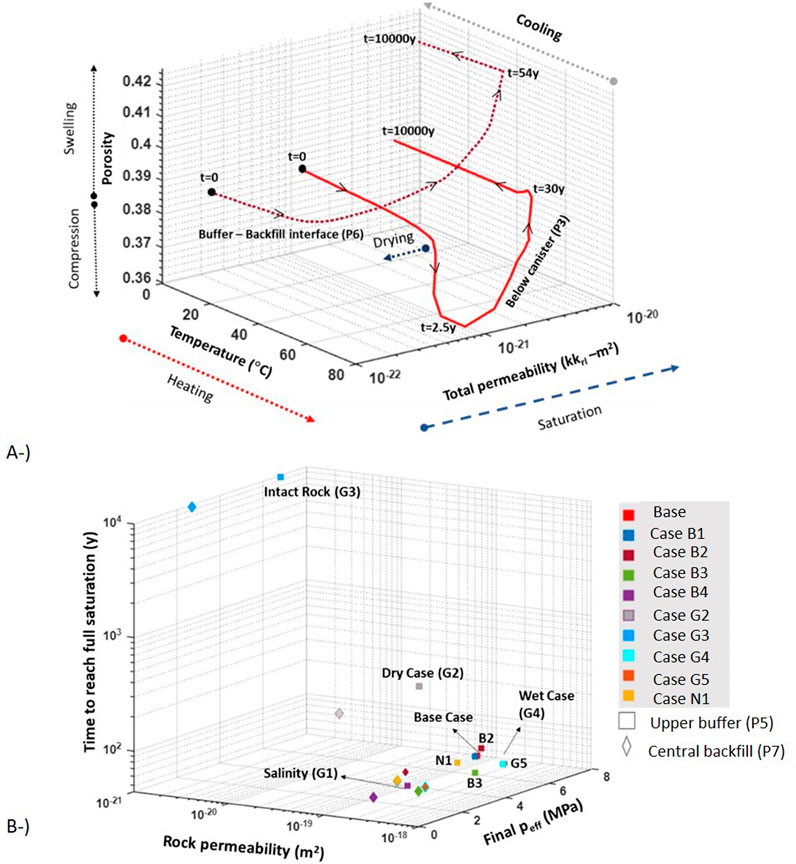
Figure 15. Porosity-temperature-total permeability path for considered locations (upper buffer and central backfill) in Base Case (A). The time to reach full saturation in upper buffer (P5) and central backfill (P7) and the magnitude of final mean effective stresses in all models according to rock intrinsic permeability (B).
There was no drying process at the buffer–backfill interface (P5). Intrinsic permeability increased in this location because of swelling, while total permeability increased during the saturation process. The maximum temperature was approximately 53°C, and the time to reach full saturation is approximately 60 years (Table 8). As is apparent from Figure 15A, the temperature–porosity–total permeability path depends on the location considered. The distribution of the porosity was nonuniform, corresponding to a nonuniform buffer density. The nonuniformity in porosity occurred due to THM processes in the buffer governed by the mechanical model (BBM).
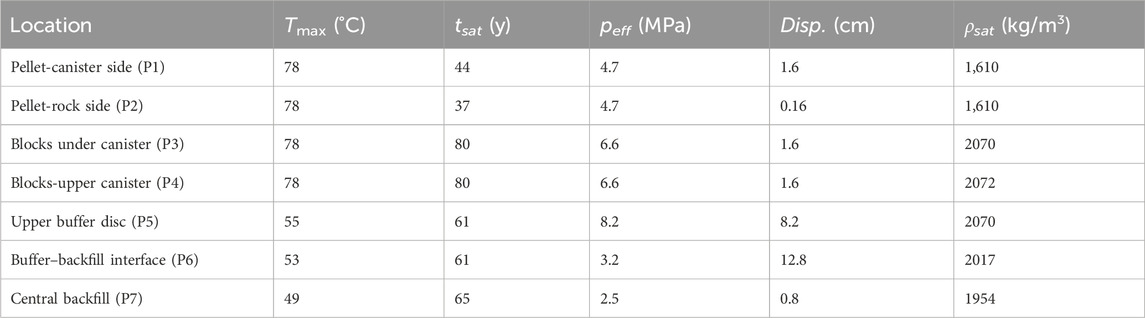
Table 8. Maximum temperature, time to reach full saturation, final mean effective stress, vertical displacements, and saturated density
Long-term results show that a full homogenization did not succeed in the buffer domain (Table 8). Laboratory tests performed to investigate the homogenization process indicate that the density differences were not completely homogenized among the samples (Dueck et al., 2016; Martikainen and Schatz 2018). In the base case, the model results showed a nonuniform porosity distribution in the buffer domain because of long-term THM processes. The time to reach full saturation and the final mean effective stresses in the given locations (upper buffer-P5 and central backfill-P7) in all models considered in the sensitivity analyses is shown in Figure 15B. The time required to reach full saturation and the magnitude of the swelling pressure depend on a number of parameters, the most important being the hydraulic properties of the rock and the bentonite. One of the main controlling parameters of the EBS saturation process is the rock’s intrinsic permeability according to the sensitivity analyses. Saturation time did not change significantly under the same rock permeability model configurations.
The saturation time was approximately 10,000 years when the rock was considered fully impervious (Model G3). In this intact rock case, the groundwater inflow was assumed to come from a few fractures distributed in deposition holes through the backfill. Although this case is unrealistic, it serves to address the saturation process under the lowest value of rock permeability.
With the expected rock intrinsic permeability of 1.52·10−19 m2 in the base case (Ahokas and Pentti 2016), the order of magnitude for the EBS component saturation time was tens of years. Table 9 lists the maximum temperature in the inner pellets (P1), the time to reach full saturation in the upper buffer (P5) and central backfill (P7), the final mean effective stresses in upper buffer (P5) and central backfill (P7), and the final vertical displacements in buffer-backfill interface (P6), in all cases considered in the sensitivity analyses.
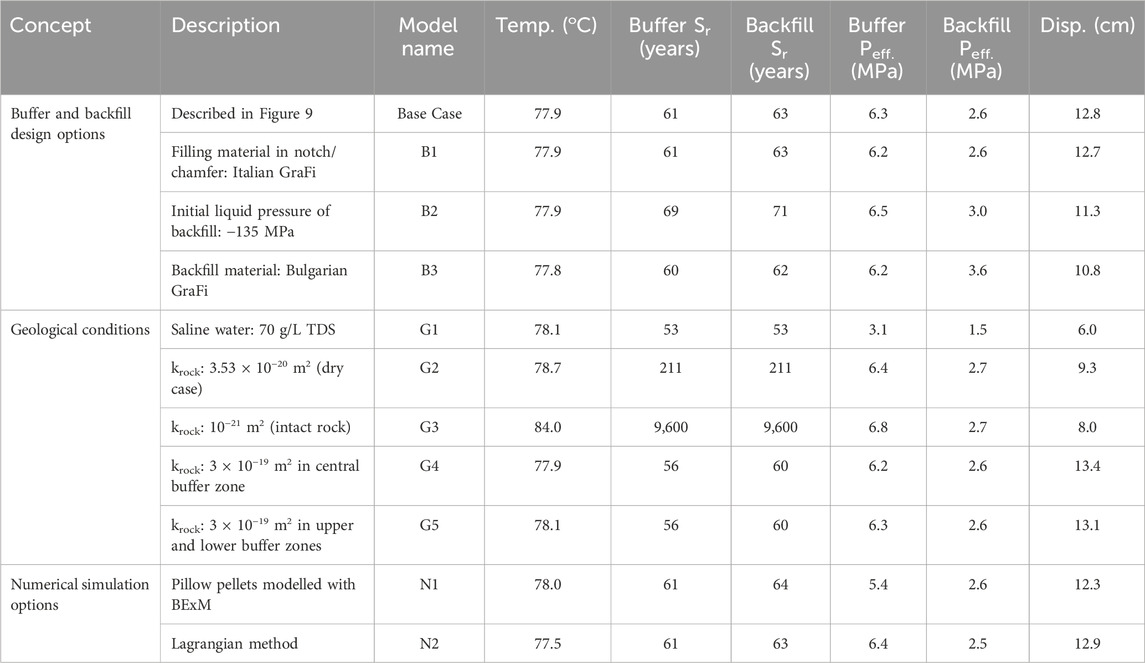
Table 9. Results in sensitivity analyses.
The maximum saturation time depends on the local conditions of the rock. A parameter study in rock permeability (Models G2, G4, and G5) was performed. If the permeability was approximately one order of magnitude lower (i.e., k = 3.53 × 10⁻²⁰), the saturation time in the buffer location (P5) increased to 211 years in Model G2. Increasing rock permeability by one order of magnitude in particular locations (Models G4 and G5—Figure 9) resulted in a decrease in saturation time to 56 years. When the groundwater was under saline conditions (Model G1), the time length required to full saturation decreased to 53 years.
In previous modelling under 2D axisymmetric calculations (Toprak et al., 2016 and Toprak et al., 2018a), the impact of the initial water content of the buffer, artificial wetting of pellets, fracture presence and positions, and the magnitude of tortuosity (Equation 13) were investigated in terms of saturation time.
There were important differences between the models in terms of long term THM response. In dry case (Model G2) and intact rock conditions (Model G3), where the rock was considered less permeable, saturation was slower than the base case. In the unrealistic case (Model G3; krock: 10−21 m2), temperature was the highest between the other models as thermal conductivity remained low for the long-term as a consequence of retardation in saturation. On the other hand, saturation was faster in Models B3 (backfill: Bulgarian GraFi), G1 (saline water 70 g/L TDS), G4 (krock: 3 × 10⁻¹⁹ m2 in central buffer zone), and G5 (krock: 3 × 10⁻¹⁹ m2 in upper and lower buffer zone) than the base case. Bulgarian GraFi was more permeable than Italian GraFi; therefore, hydration was faster in Model B3 (backfill: Bulgarian GraFi) than the base case. Saline groundwater results in a higher hydraulic conductivity (Section 2.4); hence, in Model G1 (saline water 70 g/L TDS), the saturation process of EBS components is quicker than in the base case. There was no significant drying of inner pellets adjacent to the canister in Model G1 (Figure 12B). Both in Models G4 (krock: 3 × 10⁻¹⁹ m2 in central buffer zone) and G5 (krock: 3 × 10⁻¹⁹ m2 in upper and lower buffer zones), saturation of the upper part of the buffer was faster than in the base case. Based on the results obtained, full saturation of the buffer (upper buffer–P5) is expected in 60–210 years. This was also the expected time frame where the buffer fulfils the saturation-dependent performance targets.
The Lagrangian method (Model N2), where the nodal coordinates are modified after each time increment, was also solved. If the deformations are too large, some elements may distort to become ill-conditioned, and the calculation stops. The impact of using the Lagrangian method was obvious when the filling material between canister and buffer was an air gap. Closure of the air gap was well reproduced in previous studies (Toprak et al., 2018a) using the updated Lagrangian method. However, there were no large displacements between the canister and buffer blocks when the filling material was pillow pellets. Therefore, there were no important differences observed between the base case and Model N2.
Table 10 summarizes the comparison of the some of the performance targets set for the buffer and backfill in the Finnish spent fuel repository design and the response of the base case presented in this article.
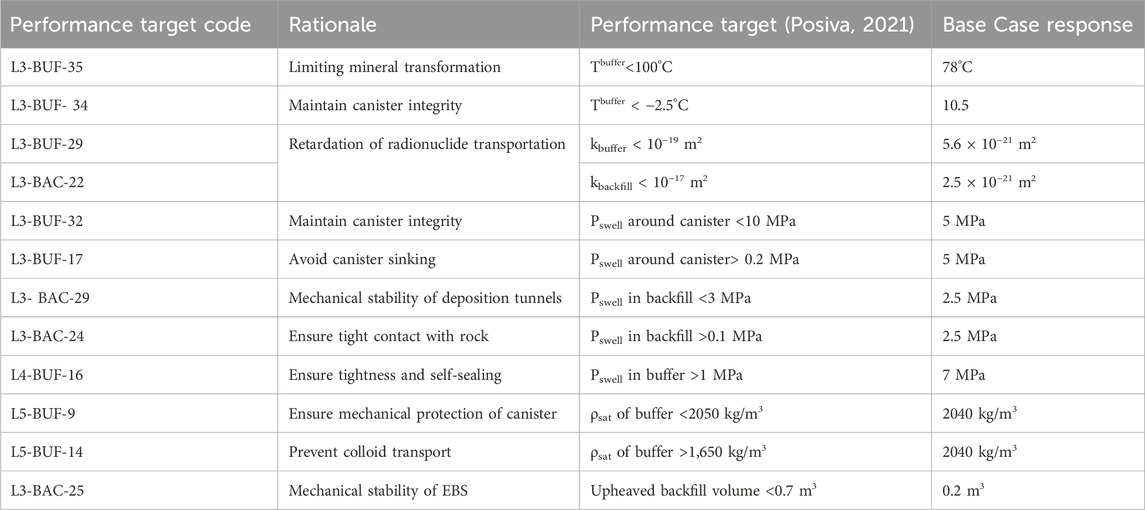
Table 10. Design criteria and performance targets for buffer and backfill.
One of the main aims of this study is to show the fulfilment of the performance targets (Posiva 2021), design criteria, and safety requirements set for the buffer and backfill under the recent model configuration. The current model (base case) under a certain geometrical configuration (tunnel and canister spacing, volume and dimensions of EBS components) with specific TH boundary conditions (hydrostatic water pressure and variable temperature in the upper and lower boundaries considering 1700 W of initial canister power) and selected materials under given initial conditions (buffer: blocks and pellets manufactured with Wyoming-type bentonite; backfill: Italian GraFi) fulfils the long term performance targets of the EBS components. As shown in the sensitivity analyses, the long-term THM response of the repository varies under different conditions.
4 Conclusion
An integrated numerical and experimental investigation was carried out to demonstrate the feasibility of 3D THM modelling of Finnish nuclear waste repository under a proper (geometrical configuration and thermal boundary conditions) and validated (canister heat flow function and material model parameters) model configuration. The results of this study have been used for the operating licence application for the world’s first final repository for spent nuclear fuel which is under commission.
Complex thermal models (saturation-dependent thermal conductivity), hydraulic models (porosity-dependent WRC and intrinsic permeability), and geo-mechanical models such as BBM and BExM (double structure model) were adapted in order to simulate the long term THM response of EBS components under a proper and validated 3D model configuration.
A base case was prepared considering certain initial conditions and a specific material data set. A sensitivity analysis plan based on the buffer and backfill design options (design with a different backfill material), geological conditions (fractures, groundwater salinity, and dry rock conditions) and numerical simulation options (including the Lagrangian method and different mechanical models suggested for pellets) was followed in order to deal not only with the uncertainties of the geological medium but also with the model/data uncertainties. The evolution of temperature, liquid pressure, degree of saturation, porosity, permeability, and mean effective stresses and displacements were investigated in terms of performance targets and safety requirements under different scenarios. It was shown that the simulations meet the performance target (Table 10) set for buffer and backfill. The long term THM response of the EBS components was illustrated in 3D graphs in order show strong THM-driven interactions between the EBS components and the host rock.
Gas transport processes, microbial activity, and geochemical coupling within the DGR design were beyond the scope of this study. Within the context of future experiments (e.g., Full Scale In Situ System Test—Posiva 2021), monitoring the evolution of temperature, pressures (gas and liquid), displacements, gases, and other safety-relevant invariants would contribute to the overall understanding of the THMC-G (thermo-hydro-mechanical-chemical and gas transport) processes occurring under repository-like conditions.
Data availability statement
The raw data supporting the conclusions of this article will be made available by the authors, without undue reservation.
Author contributions
ET: writing–original draft and writing–review and editing. SO: funding acquisition, project administration, software, supervision, and writing–review and editing. XP: data curation, investigation, and writing–review and editing. MN: funding acquisition, project administration, and writing–review and editing.
Funding
The author(s) declare that financial support was received for the research, authorship, and/or publication of this article. Financial support was granted by Posiva Oy (Finland) through a collaboration agreement with Mitta Oy (Finland) and CIMNE (Spain).
Conflict of interest
XP was employed by Mitta Oy. MN was employed by Posiva Oy.
The remaining authors declare that the research was conducted in the absence of any commercial or financial relationships that could be construed as a potential conflict of interest.
Publisher’s note
All claims expressed in this article are solely those of the authors and do not necessarily represent those of their affiliated organizations, or those of the publisher, the editors, and the reviewers. Any product that may be evaluated in this article, or claim that may be made by its manufacturer, is not guaranteed or endorsed by the publisher.
References
Ahokas, H., and Pentti, E. (2016). Hydrogeological properties at the demonstration area. ONKALO. POS-024695.
Åkesson, M., Börgesson, L., and Kristensson, O. (2010). SR Site data report. THM modelling of buffer, backfill and other system components. Updated 2013-12. SKB report TR-10-44.
Alcoverro, J., Pintado, X., Olivella, S., Toprak, E., and Niskanen, M. (2023). Analysis of the extension of the elastic parameters for modelling highly expansive unsaturated soils with the Barcelona basic model. Adv. Mater. Sci. Eng. 2023, 1196011–1196014. doi:10.1155/2023/1196011
Alonso, E. E., Gens, A., and Josa, A. (1990). A constitutive model for partially saturated soils. Géotechnique 40 (3), 405–430. doi:10.1680/geot.1990.40.3.405
Alonso, E. E., Olivella, S., and Pinyol, N. M. (2005). A review of beliche dam. Géotechnique 55 (4), 267–285. doi:10.1680/geot.55.4.267.65493
Börgesson, L., Fredrikson, A., and Johannesson, L. E. (1994). Heat conductivity of buffer materials. SKB-TR-94-29.
Brown, G. O. (2002). Henry Darcy and the making of a law. Water Resour. Res. 38 (7), 1106. doi:10.1029/2001WR000727
Chen, G. J., and Ledesma, A. (2009). Coupled thermohydromechanical modeling of the full-scale in situ test “Prototype repository”. J. Geotechnical Geoenvironmental Eng. 135 (1), 121–132. doi:10.1061/(asce)1090-0241(2009)135:1(121)
Chow, J. K., Li, Z., Su, Z., and Wang, Y. H. (2022). Characterization of particle orientation of kaolinite samples using the deep learning-based technique. Acta Geotech. 17, 1097–1110. doi:10.1007/s11440-021-01266-x
Damians, I. P., Olivella, S., and Pintado, X. (2019). Three dimensional thermo-hydraulic modelling for KBS-3H alternative. Geomechanics energy Environ. 17, 47–56. doi:10.1016/j.gete.2018.07.002
Delage, P., Cui, Y. C., and Tang, A. M. (2010). Clays in radioactive waste disposal. J. rock Mech. geotechnical Eng. 2 (2), 111–123. doi:10.3724/sp.j.1235.2010.00111
Dixon, D. A. (2000). Porewater salinity and the development of swelling pressure in bentonite-based buffer and backfill materials. Posiva Rep. 2000-04.
D’Onza, F., Wheeler, S. J., Gallipoli, D., Barrera Bucio, M., Hofmann, M., LloretCabot, M., et al. (2015). Benchmarking selection of parameter values for the Barcelona basic model. Eng. Geol. 196, 99–118. doi:10.1016/j.enggeo.2015.06.022
Dueck, A., Goudarzi, R., and Börgesson, L. (2016). Buffer homogenization, status report 3. Stockholm, Sweden. SKB Technical report TR-16-04.
Enresa (2000). FEBEX project. Full-scale engineered barriers experiment for a deep geological repository for high level radioactive waste in crystalline host rock. Final Rep. Enresa technical publication 1/2000.
Gallipoli, D., D’Onza, F., and Wheeler, S. J. (2010). A sequential method for selecting parameter values in the Barcelona Basic Model. Can. Geotechnical J. 47, 1175–1186. doi:10.1139/t10-017
Gens, A., and Alonso, E. E. (1992). A framework for the behaviour of unsaturated expansive clays. Can. Geotechnical J. 29 (6), 1013–1032. doi:10.1139/t92-120
Gens, A., Sánchez, M., Guimarães, L. N., Alonso, E. E., Lloret, A., Olivella, O., et al. (2009). A full-scale in situ heating test for high-level nuclear waste disposal: observations, analysis and interpretation. Géotechnique 59 (4), 377–399. doi:10.1680/geot.2009.59.4.377
Hakola, I., Kivikoski, H., Löija, M., and Marjavaara, P. (2015). “Designing, commissioning and monitoring of 40% scale bentonite buffer test,” in Working report 2015-08. Eurajoki, Finland: Posiva Oy.
Hjerpe, T., Marcos, N., Ikonen, A. T. K., Reijonen, H., and Åstrand, P.-G. (2021). “Safety case for the operating licence application: FEP database description,” in Working report 2020- 19. Eurajoki, Finland: Posiva Oy.
Hökmark, H., Lönnqvist, M., Kristensson, O., Sundberg, J., and Hellström, G. (2009). Strategy for thermal dimensioning of the final repository for spent nuclear fuel. SKB Rapp. R-09-04.
Ikonen, K. (2003). Thermal analyses of spent nuclear fuel repository. Eurajoki, Finland. Posiva Report 2003-04.
Ikonen, K., Kuutti, J., and Raiko, H. (2018). Thermal dimensioning of the Olkiluoto repository – 2018 update. Eurajoki, Finland. Posiva working report 2018-26.
Ikonen, K., and Raiko, H. (2013). Thermal dimensioning of Olkiluoto repository for spent fuel. Eurajoki, Finland. Posiva working report 2012-56.
Johannesson, L. (2007). “Aspö hard rock laboratory. Canister retrieval test,” in Dismantling and sampling of the buffer and determination of density and water ratio. SKB IPR-07-16. Stockholm, Sweden: Swedish Nuclear Fuel and Waste Management Co.
Juvankoski, M., Ikonen, K., and Jalonen, T. (2012). Buffer production line 2012. Design, production and initial state of the buffer. Posiva Report 2012-17. Eurajoki, Finland
Juvankoski, M., and Marcos, N. (2010). Design basis for buffer components. Eurajoki: Finland. Posiva working report 2009-132.
Karnland, O., Olsson, S., and Nilsson, U. (2006). Mineralogy and sealing properties of various bentonites and smectite-rich clay materials. Stockholm, Sweden. SKB report TR-06-30.
Karvonen, T. (2018a). “Buffer design freeze 2018 – initial state of the buffer for Turva-2020,” in AINS database: projekti-1697-10/2018, Initial state of the buffer for TURVA-2020, 15.3.2019 (Eurajoki, Finland: Posiva Oy). Technical Memorandum, kronodoc: POS-027475.
Karvonen, T. (2018b). “Backfill design freeze 2018 – initial state of the backfill for Turva-2020,” in AINS database: projekti-1697-10/2018, Initial state of the backfill for TURVA-2020, 15.3.2019 (Eurajoki, Finland: Posiva Oy). Technical Memorandum, kronodoc. POS- 027474.
Keto, P., Hassan, Md, Karttunen, P., Kiviranta, L., Kumpulainen, S., Korkiala-Tanttu, L., et al. (2013). Backfill production line 2012. Design, production and initial state of the deposition tunnel backfill and plug. Eurajoki: Finland. Posiva Report 2012-18.
Kiviranta, L., and Kumpulainen, S. (2011). Quality control and characterization of bentonite materials. Eurajoki, Finland: Finland. Posiva working report 2011-84, 2011.
Kiviranta, L., Kumpulainen, S., Pintado, X., Karttunen, P., and Schatz, T. (2016). Characterization of bentonite and clay materials. Eurajoki: Finland. Posiva working report 2016-05.
Kristensson, O., and Börgesson, L. (2015). Canister retrieval test. Stockholm, Sweden. SKB report TR-14-19.
Kukkonen, I. (2023). Thermal properties at Olkiluoto: in-Situ heat transfer experiments, thermal conductivity and diffusivity measurements and drill core samples with the optical thermal scanning method. Posiva working report 2023-10.
Kumpulainen, S., Kiviranta, L., Pintado, X., Adesola, F., Hassan, Md.M., Leino, T., et al. (2020). THMC properties of alternative buffer and backfill materials, measurement uncertainties and quality control aspects. Tech. Memo. Kronodoc. POS-.
Leoni, M., Börgesson, L., and Keto, P. (2018). Numerical modelling of the buffer swelling test in Aspö HRL. Stockholm, Sweden.
Li, Z., Zhang, Z., Tai, P., Shen, P., and Li, J. (2024). Investigation of morphological effects on crushing characteristics of calcareous sand particle by 3D image analysis with spherical harmonics. Powder Technol. 433, 119204. doi:10.1016/j.powtec.2023.119204
Lloret, A., Villar, M. V., Sánchez, M., Gens, A., Pintado, X., and Alonso, E. E. (2003). Mechanical behaviour of heavily compacted bentonite under high suction changes. Géotechnique 53 (1), 27–40. doi:10.1680/geot.53.1.27.37258
Martikainen, J., and Schatz, T. (2011). Laboratory tests to determine the effect of Olkiluoto bonding brine water on buffer performance. Eurajoki: Finland. Posiva working report 2011-68.
Martikainen, J., and Schatz, T. (2018). Initial buffer and backfill wetting: pellet-filling component. Posiva working report 2016-53.
Ministerio de transportes, movilidad y agenda urbana (2011). Structural steel code EAE. Madrid, Spain.
Navarro, V., Asensio, L., Yustres, A., Pintado, X., and Alonso, J. (2014). An elastoplastic model of bentonite free swelling. Eng. Geol. 181, 190–201. doi:10.1016/j.enggeo.2014.07.014
Olivella, S., Vaunat, J., and Rodriguez-Dono, A. (2023). Code_Bright 2023 user’s guide. Available at: https://deca.upc.edu/en/projects/code_bright/downloads/users_guide.
Pastina, B., and Hella, P. (2010). Models and data report 2010. Posiva Report 2010-1. Eurajoki: Finland.
Penttila, M., Pylkkanen, K., and Kolisoja, P. (2018). “Buffer – backfill interaction tests II, Posiva Oy,” in Internal Posiva memorandum. Eurajoki, Finland: POS-029790.
Peura, J., Rinta-Hiiro, V., Loimula, K., Kuutti, J., Laikari, A., Löija, M., et al. (2016). Buffer – backfill interaction testing, Posiva Oy, internal Posiva memorandum, POS-029790
Pintado, X., Kristensson, O., Malmberg, D., Åkesson, M., Olivella, S., and Puig, I. (2017). TH and THM modelling of a KBS-3H deposition drift. Posiva working report 2016-25. Eurajoki, Finland
Pintado, X., Ledesma, A., and Lloret, A. (2002). Backanalysis of thermohydraulic bentonite properties from laboratory tests. Eng. Geol. 64, 91–115. doi:10.1016/s0013-7952(01)00110-7
Pintado, X., and Rautioaho, E. (2013). Thermo-hydraulic modelling of buffer and backfill. Eurajoki: Finland. Posiva Report 2012-48.
Posiva, (2012). Safety case for the disposal of spent nuclear fuel at Olkiluoto – performance assessment 2012. Eurajoki: Finland. Posiva Report 2012-04.
Posiva, S. K. B. (2017). “KBS-3H System design phase 2011-2016: final report,” in Posiva and SKB 06 report. Eurajoki, Finland.
Pylkkanen, K. (2019). Buffer – backfill interaction test V, Posiva Oy, internal Posiva memorandum. POS-029790.
Rinta-Hiiro, V., Peura, J., Bohner, E., Holt, E., and Heino, V. (2017). “1/6 scale laboratory experiment for bentonite buffer and backfill interaction in KBS-3V nuclear waste disposal concept,” in 7th international conference on clays in natural and engineered barriers for radioactive waste confinement. Davos, Switzerland, 156–157.
Rodríguez-Dono, A., Olivella, S., and Mokni, N. (2020). Assessment of a high-level spent nuclear fuel disposal model. Environ. Geotech. 7 (1), 42–58. doi:10.1680/jenge.18.00017
Sadeghabadi, A., Noorzad, A., and Zad, A. (2021). Numerical and experimental modeling of geomechanical behavior of partially saturated soils. Int. J. Geo-Engineering 12, 25. doi:10.1186/s40703-021-00154-3
Sandén, T., Nilsson, U., and Andersson, L. (2016). “Investigation of parameters influencing bentonite block quality,” in Laboratory investigation. SKB report P-16-06. Stockholm, Sweden.
Showkat, R., Mohammadi, H., and Sivakumar Babu, G. L. (2022). Effect of rainfall infiltration on the stability of compacted embankments. Int. J. geomechanics 22 (7). doi:10.1061/(asce)gm.1943-5622.0002425
Sun, L. (2016). The effects of structural and environmental factors on the swelling behavior of montmorillonite beidellite smectites: a molecular dynamics approach. Dissertation: University of Eastern Finland, Faculty of Science and Forestry, Department of Chemistry.
Tang, A.-M., and Cui, Y.-J. (2005). Controlling suction by the vapour equilibrium technique at different temperatures and its application in determining the water retention properties of MX80 clay. Can. Geotechnical J. 42, 287–296. doi:10.1139/t04-082
Toprak, E. (2018b). Long term response of multi-barrier schemes for underground radioactive waste disposal. Barcelona, Spain: PhD dissertation Technical University of Catalonia.
Toprak, E., Olivella, S., Mokni, M., and Pintado, X. (2013). Thermo-hydro-mechanical modelling of buffer, Synthesis report. Eurajoki: Finland. Posiva Report 2012-47.
Toprak, E., Olivella, S., and Pintado, X. (2016). Coupled THM modelling of engineered barriers for the final disposal of spent nuclear fuel isolation, 443. Geological Society of London: Special Publications, 1–17.
Toprak, E., Olivella, S., and Pintado, X. (2018a). Modelling engineered barriers for spent nuclear fuel repository using a double-structure model for pellets. J. Environ. Geotechnics 7 (1), 72–94. doi:10.1680/jenge.17.00086
van Genuchten, R. (1980). A closed-form equation for predicting the hydraulic conductivity of unsaturated soils. Soil Sci. Soc. Am. J. 44 (5), 892–898. doi:10.2136/sssaj1980.03615995004400050002x
Vieno, T. (2000). “Groundwater salinity at Olkiluoto and its effects on a spent fuel repository,” in Posiva report 2000-11. Eurajoki: Finland.
Villar, M. V. (2002). Thermo-hydro-mechanical characterization of a bentonite from Cabo de Gata. A study applied to the use of bentonite as sealing material in high level radioactive waste repositories. ENRESA Tech. Rep. 01/2002-258.
Villar, M. V. (2005). MX-80 bentonite, Thermo-hydro-mechanical characterization performed at CIEMAT in the context of the prototype project. Madrid, Spain. CIEMAT technical report CIEMAT/DIAE/54540/2/04.
Villar, M. V., Gómez-Espina, R., and Lloret, A. (2010). Experimental investigation into temperature effect on hydro-mechanical behaviours of bentonite. J. Rock Mech. Geotechnical Eng. 2 (1), 71–78.
Keywords: nuclear waste repository design, engineered barrier system, THM coupled processes, BBM, double structure model, CODE_BRIGHT
Citation: Toprak E, Olivella S, Pintado X and Niskanen M (2024) 3D THM modelling of Finnish spent nuclear fuel repository. Front. Built Environ. 10:1465051. doi: 10.3389/fbuil.2024.1465051
Received: 15 July 2024; Accepted: 19 August 2024;
Published: 26 September 2024.
Edited by:
Yifei Sun, Hohai University, ChinaReviewed by:
Rui Chen, Harbin Institute of Technology, Shenzhen, ChinaZhixiong Zeng, Nanjing University, China
Copyright © 2024 Toprak, Olivella, Pintado and Niskanen. This is an open-access article distributed under the terms of the Creative Commons Attribution License (CC BY). The use, distribution or reproduction in other forums is permitted, provided the original author(s) and the copyright owner(s) are credited and that the original publication in this journal is cited, in accordance with accepted academic practice. No use, distribution or reproduction is permitted which does not comply with these terms.
*Correspondence: Erdem Toprak, ZXJkZW0udG9wcmFrQHVwYy5lZHU=
†ORCID:Xavier Pintado, orcid.org/0000-0002-4055-4505