- 1Department Civil, Architectural, and Environmental Engineering, North Carolina Agricultural and Technical State University, Greensboro, NC, United States
- 2College of Business, Lamar University, Beaumont, TX, United States
The study proposes incorporating human bodily comfort performance through a simulation method to assess the impact of urban microclimate conditions in an urban campus area. A human comfort performance matrix is used based on PET value and gender’s thermal stress conditions. The investigation serves as a way to evaluate open spaces’ climatic performance quantitatively through energy simulation. The method shows a way to measure urban comfort regarding gender perspectives early in the urban decision-making process. The findings of this research have practical implications for urban decision-makers to use robust simulation tools to optimize open space configurations based on gender’s thermal performances.
1 Introduction
Thermal comfort in urban spaces is shaped by factors such as urban microclimates, gender differences, and the specific types of urban locations. Studies show that urban spaces impact human comfort in atmospheric conditions by air temperature, humidity, wind speed, and radiation. Thermal comfort is not a uniform experience across all individuals, where gender is a significant factor influenced by physiological and psychological differences. Women, for instance, generally have lower metabolic rates than men, which can affect their perception of thermal comfort in various settings (Yang et al., 2021; Zhang and Zhu, 2022). However, studies found no significant difference in neutral temperatures between the genders, but females express more dissatisfaction in thermal responses (Karjalainen, 2012; Wang et al., 2018). Despite the growing recognition of these factors, there is often a gap in urban planning due to a lack of knowledge among practitioners on how to incorporate gender-specific thermal comfort considerations at the early stage of the design process. There are studies on measuring gender-based thermal comfort on existing sites through field surveys (Muhy Al-Din et al., 2024). ENVI-met simulation is also used in studies to measure the general human comfort responses in specific areas (Acero and Herranz-Pascual, 2015). Nevertheless, those studies do not show how a computer-simulated environment informs the gender-based comfort level in the 3D environment. This gap underscores the need for more research and education to ensure thermal comfort is effectively integrated into planning processes. Besides, outdoor thermal comfort is inherently more complex to assess than indoor comfort due to the variability in weather conditions, lack of climate control, and diverse human activities and adaptations. Various thermal comfort indices have been developed to evaluate comfort, incorporating environmental and personal factors to assess how individuals perceive and respond to their thermal environment. In this study at North Carolina Agricultural and Technical State University, we utilized simulations to predict human comfort levels along a specific walking route based on a developed human comfort performance matrix. This study contributes by presenting a quantitive method based on simulation and visual representation to understand the impact of spaces on different genders at different times of the year.
The configuration and characteristics of urban environments have a direct impact on thermal comfort, influencing factors such as solar radiation, wind patterns, and heat retention (Oke, 1982). In research, it has been argued that strategic urban planning can mitigate these effects by incorporating green infrastructure, such as parks, green roofs, and tree-lined streets, which help cool the urban environment (Bowler et al., 2010; Gill et al., 2007). Building orientation and height can optimize natural ventilation and solar access in outdoor condition (Emmanuel and Steemers, 2018). Studies also showed that gender differences also impact thermal comfort (Jin et al., 2020; Karjalainen, 2012; Kumar and Sharma, 2022; Muhy Al-Din et al., 2024; Tung et al., 2014). However, as we mentioned earlier, most of these investigations on gender differences and thermal comfort were primarily based on field and questionnaire surveys, not on using secondary data through computer simulation. Besides, these studies were developed to report the thermal impact conditions for specific sites. They did not offer any framework that urban decision-makers could use to visualize the impact of urban users at the early stage of design development. In that regard, our study showed a way to visualize the quantitative data of urban thermal comfort, specifically location-based, and can be used in any other urban context.
2 Human comfort matrix
In contrast to the well-established field of indoor comfort, the study of outdoor thermal comfort is relatively recent. Assessing comfort outdoors presents a more intricate challenge than indoor settings, primarily due to the spatial and temporal fluctuations in meteorological factors. Factors such as the absence of climate control, diverse physical and socio-cultural adaptations of individuals, and the broad range of outdoor activities and users contribute to this complexity. Consequently, it is inappropriate to apply indoor thermal comfort methods directly to outdoor thermal comfort assessment (Cilek, 2021; Johansson et al., 2014). Evaluating outdoor thermal comfort requires consideration of both human characteristics and climatic variables. The indices for thermal comfort have been categorized as subjective or objective factors. Subjective indices are behavioral and psychological, and objectives are air temperature, wind, humidity, radiation, metabolic heat, and clothing insulation. They can be used to assess the linkages between the outdoor environment and human wellbeing.
There are several indices to measure thermal comfort; among them, the most used are Predicted Mean Vote (PMV), Universal Thermal Climate Index (UTCI), and Physiological Equivalent Temperature (PET). Human comfort can be defined as a meteorological condition in which individuals prefer neither warmer nor cooler temperatures, i.e., the preferred temperature. The concept is closely related to thermal stress (Nasir et al., 2013). Researchers explored many methods to predict the thermal sensation of people in their environment based on personal, environmental, and physiological variables and factors (Lin et al., 2009; Ying et al., 2011). In this study, we used the Physiological Equivalent Temperature (PET) method to measure the outdoor thermal comfort index based on a prognostic model of the human energy balance. The value depends on the cloth value, body type, height and mass, wind speed and direction, relative humidity, direct and indirect radiation value, radiant temperature, thermal stress, core body temperature, skin temperature, etc.
The PET is the only established method that considers the perceived thermal stress level in the measurement system. The PET analysis emerges as a significant component, providing a more comprehensive understanding of how individuals perceive and respond to their thermal environment. PET considers both the thermal conditions of the surroundings and the physiological responses of the human body, offering a more nuanced evaluation of comfort. The PET index, initially introduced by Höppe in the 1990s, considers factors such as air temperature, humidity, air velocity, and clothing insulation, similar to other thermal comfort indices (Höppe, 1999). However, what sets PET apart is its incorporation of the human body’s heat balance, accounting for factors like metabolic rate and the evaporative heat loss from the skin. This index aims to express the thermal environment with an equivalent air temperature that would produce the same physiological responses as the actual environment. The PET value represents the perceived temperature by the human body, considering its physiological efforts to maintain thermal equilibrium (Matzarakis et al., 2007).
3 Methodology and case site
The study was primarily based on simulation data conducted in the Rhino Grasshopper Ladybug platform, where the tool helped to place humans as points in four different locations to identify the differences in the physiological impact of thermal comfort. As we mentioned earlier, PET was considered as it measures both the thermal conditions of the surroundings and the physiological responses of the human body, offering a more nuanced evaluation of comfort. The PET index includes air temperature, humidity, air velocity, and clothing insulation, similar to other thermal comfort indices. It also considers the human body’s heat balance based on factors like metabolic rate and the evaporative heat loss from the skin. The PET value represents the perceived temperature by the human body, considering its physiological efforts to maintain thermal equilibrium.
At first, a 3D contextual model of the NCAT-selected buildings and the surroundings with an accurate topographical model was developed to integrate into the simulated environment. Then, the model was integrated with the PET simulation model, and the simulation was run. The data collection and analysis all completely relied on the tool’s operability. The collected data then clustered for four seasons for males and females and their clo value, which had already been coded in the script of Ladybug for PET Body Parameter, PET Comfort, and UTCI components (Figure 1). The collected simulated data was saved for further statistical analysis to find the impact of thermal stress on on-campus users. The Ladybug simulation used the components to calculate the PET results for specific locations for each hour of the year, which requires Energyplus weather data to feed the data in the system. Four locations have been selected for a fixed met activity walking and a fixed cloth value of 1, representing three pieces of cloth. The human factors are categorized under gender, male and female. The average height of the Males is around 1.75 m, and the average height of the Females is 1.55 m. They are 24 years old with an average body mass of 62 kg. The simulation tool also allowed us to calculate the surface heat gain regarding sun hours.
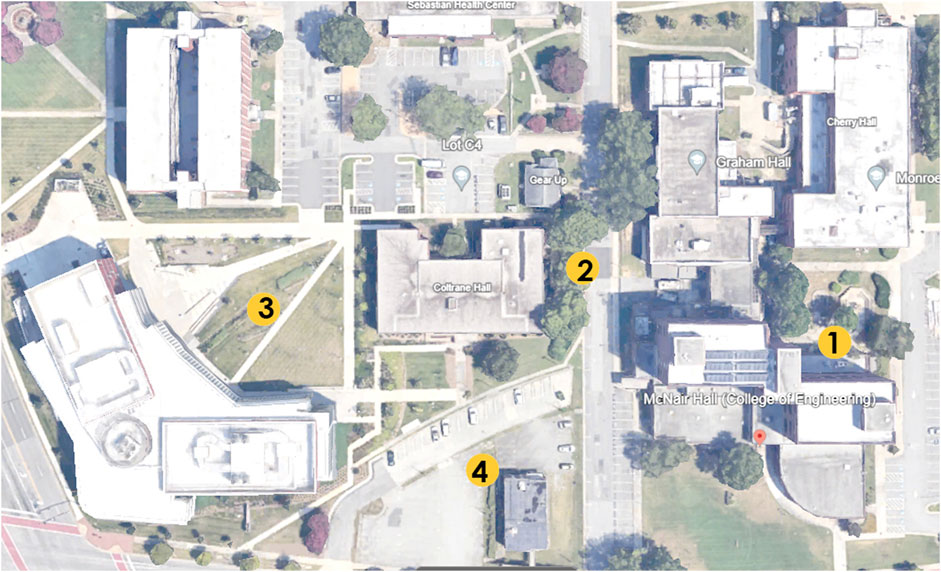
The locations are picked around the North Carolina A& T State University campus, among the College of Engineering Buildings McNair Hall, Graham Hall, Monroe Hall, and MERIC Buildings. North Carolina generally has a humid subtropical climate (Köppen climate classification Cfa), except in the higher elevations of the Appalachians, which have a subtropical highland climate. The locations co-ordinates are 36°04′20 ′N 79°46′32′W, 36°04′20′N 79°46′36′W, 36°04′20′N 79°46′39′W & 36°04′18′N 79°46′37′W. Location 1 is an open shaded courtyard among McNair Hall, Graham Hall, and Monroe Hall (Figure 2). McNair Hall has the highest stories of five levels, and Graham and Monroes are four-storied beam-column structures with brick walls. Location 2 is the entry of the Coltrane Hall. Location 3 is on the open elevated entry slope of the Harold Martin Sr Engineering, Research, and Innovation Complex (MERIC). Location 4 is on the paved parking lot between MERIC and Coltrane Hall.
4 Results
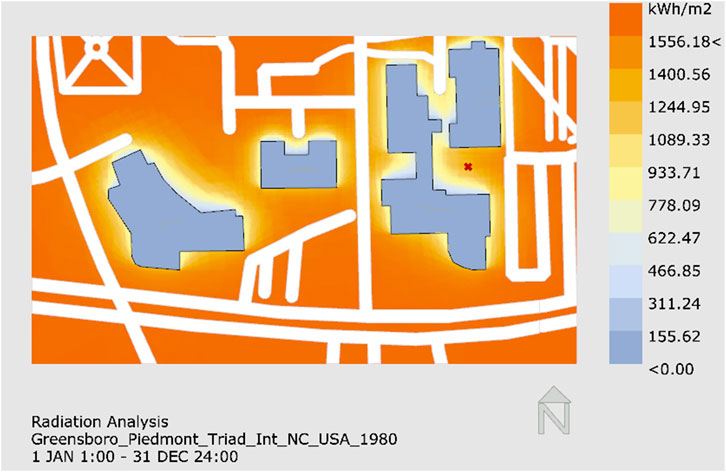
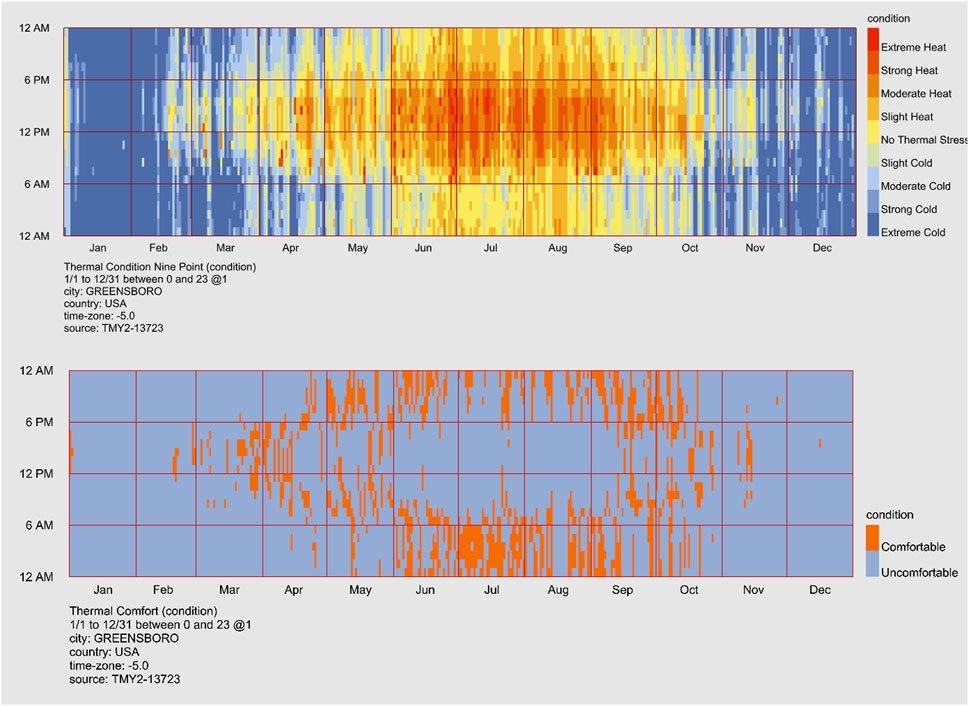
Simulations were conducted by placing points as humans in four positions on four sites. The visual interpretation of the data came out in a distinct format for every simulation task. In the ground surface radiation simulation, a significant part of the open landscape gains around 1,400 to 1700 kWh/m2 of solar energy, impacting pedestrian users’ outdoor comfort (Figure 3). These results also give us insights into how this renewable energy can be used as sustainable energy resources for future campus design alteration. In the third attempt at measuring, we calculated the Universal Thermal Climate Index (UTCI) in four scenarios (Sun and Wind, Sun and No Wind, Wind and No Sun, and No Wind and No Sun) (Figure 4). With a fixed metabolic rate of around 2.4 met, they naturally adapt their clothing to the outdoor temperature. This algorithm is helpful for human biometeorology. This study informs us how the human body feels in certain weather conditions in Greensboro, which is also true in the case of NCAT’s urban outdoor campus. From this simulation, we figured that 43.67% of the time, outdoor comfort can be felt in the weather conditions of Greensboro while both sun and wind prevail. Studies recommended that it is better to calculate the physiologically equivalent temperature (PET) to understand better how the human body feels like temperature. PET gives us information on feel-like temperature. The comfortable temperature in Greensboro’s outdoor conditions is 64.4°F to 78.8°F during the months, predominantly from mid-April to mid-October, from 6 p.m. to 6 a.m.
5 Statistical comparison PET values
One of the purposes of this study is to identify the differences in thermal comfort for closely located places in different building settings for the same environmental conditions. To do that, from the simulation, we collected hourly basis data for a year for each location for both male and female genders. The data has been clustered with columns of Year Hour, PET Value (F), Gender, Core Body Temperature (F), Skin Temperature (F), Thermal Stress Condition, Core Body Condition, Average Height (cm), Wind Speed (mph), Surface/Dry Bulb Temperature/Air Temperature, Relative Humidity (%), Direct Normal Radiation (Wh/m2), Diffuse Horizontal Radiation (Wh/m2), Horizontal Infrared Radiation (Wh/m2), Barometric Pressure (Pa), Mean Radiant Temperature (F), Cloth Value and MET activity.
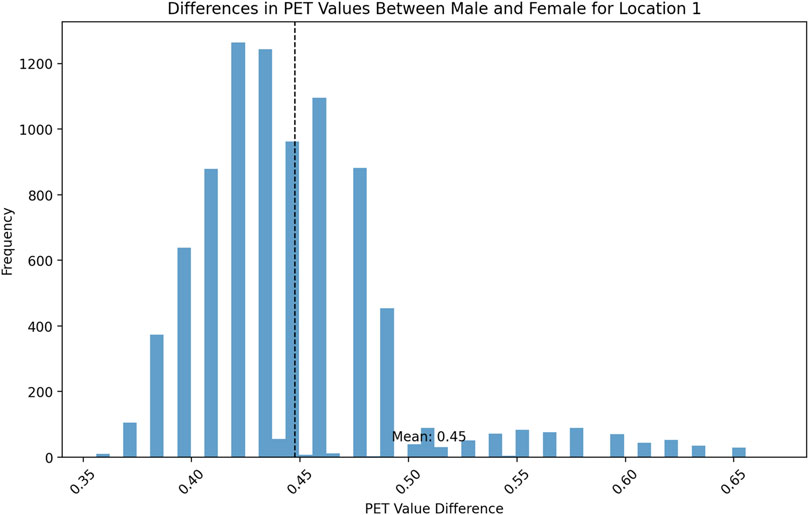
The histogram below visualizes the differences in PET values between males and females for Location 1 (Figure 5). The dashed line represents the mean difference. It summarizes the differences in PET values between males and females for Location 1. The mean difference is approximately 0.447, with a standard deviation of 0.048, indicating that, on average, males have a slightly higher PET value than females at this location. The differences range from about 0.356 to 0.668, with the median difference being 0.435.
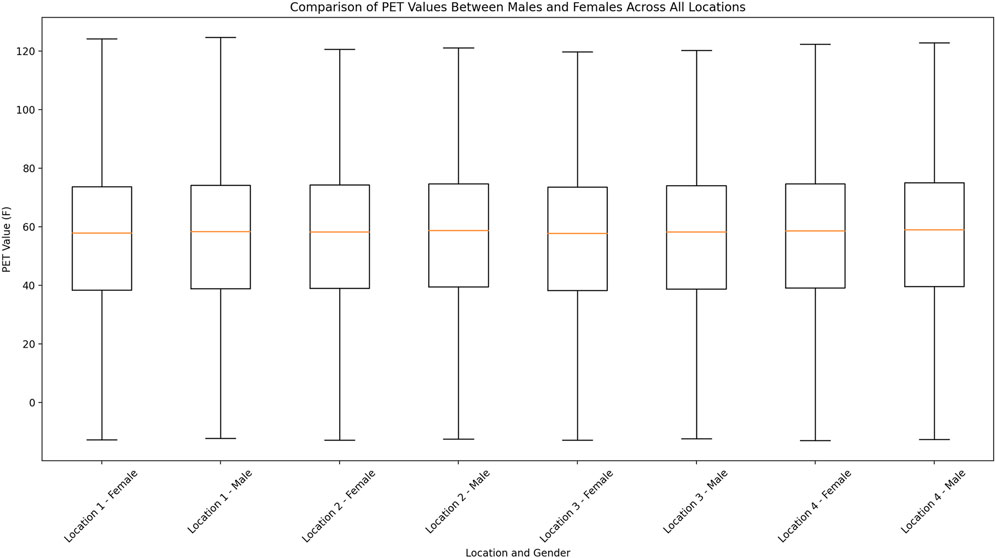
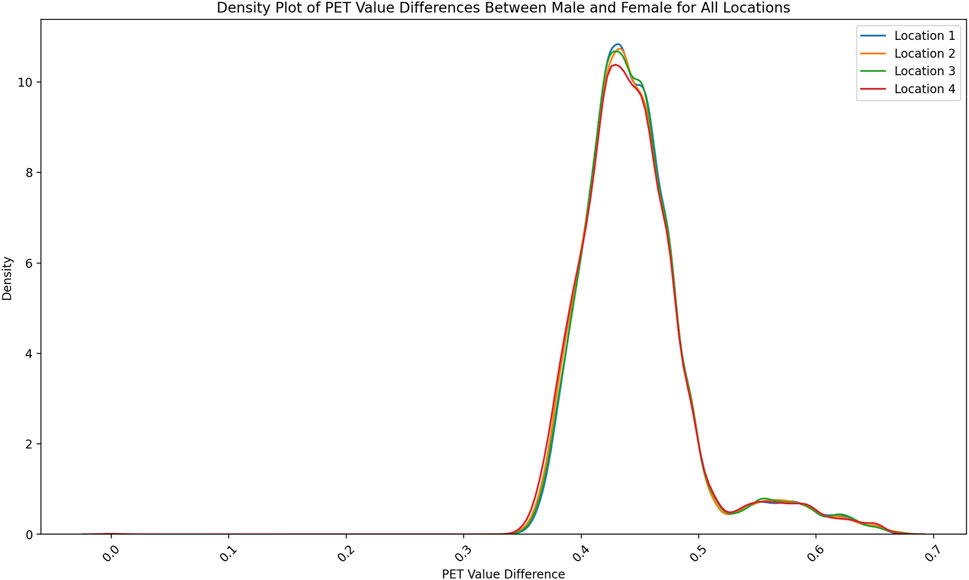
No significant differences exist between males and females for all locations in the box plot (Figure 6). However, the density plot shows PET value differences between males and females for all locations (Figure 7). Each curve represents one location, comparing how the PET value differences are distributed across the different locations. The density plot illustrates the distribution of the differences in PET values between males and females across all four locations. Each line represents the density of these differences for a specific location, showing where many of the data points lie and how they spread out. The peaks of the lines indicate the most common difference values, while the width of the lines shows the variance in the data.
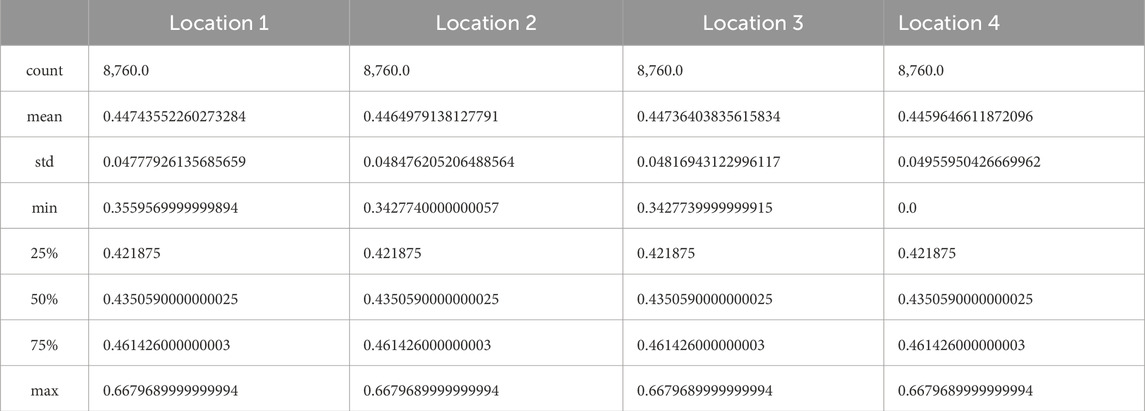
The mean difference ranges from approximately 0.446–0.447 across the locations (Table 1), indicating a slight but consistently higher PET value for males. The standard deviation is around 0.048 to 0.050, showing similar variability across locations. The minimum difference observed is 0.0 for Location 4, and around 0.343 for other locations. The 25th percentile is 0.422, the median (50th percentile) is 0.435, and the 75th percentile is 0.461 for all locations, suggesting that half of the differences lie within this range. The maximum difference is the same for all locations, at approximately 0.668.
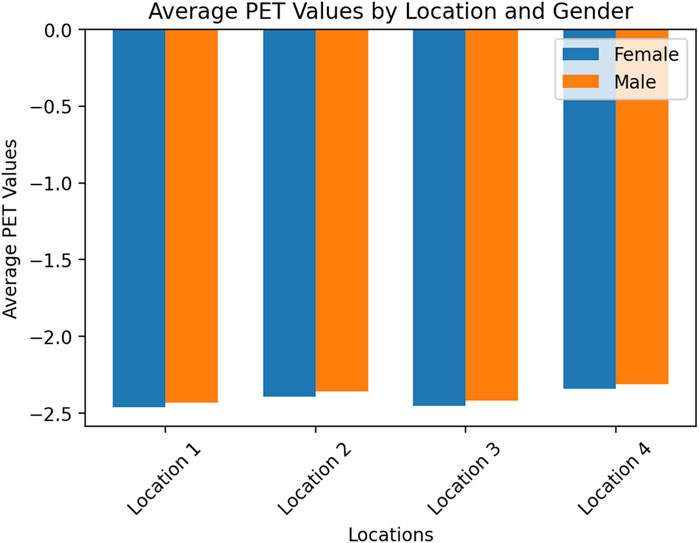
The bar chart above visualizes the average PET values by location and gender (Figure 8). It shows a comparison across the four locations for both females and males. The negative values suggest a measure of thermal stress, with lower values potentially indicating higher stress levels.
All locations show similar patterns, with females having slightly higher (less negative) average PET values than males (Figure 8). From the chart and the average values, Location 4 seems to have the least negative average PET values for both genders, suggesting it may have the least thermal stress according to this metric.
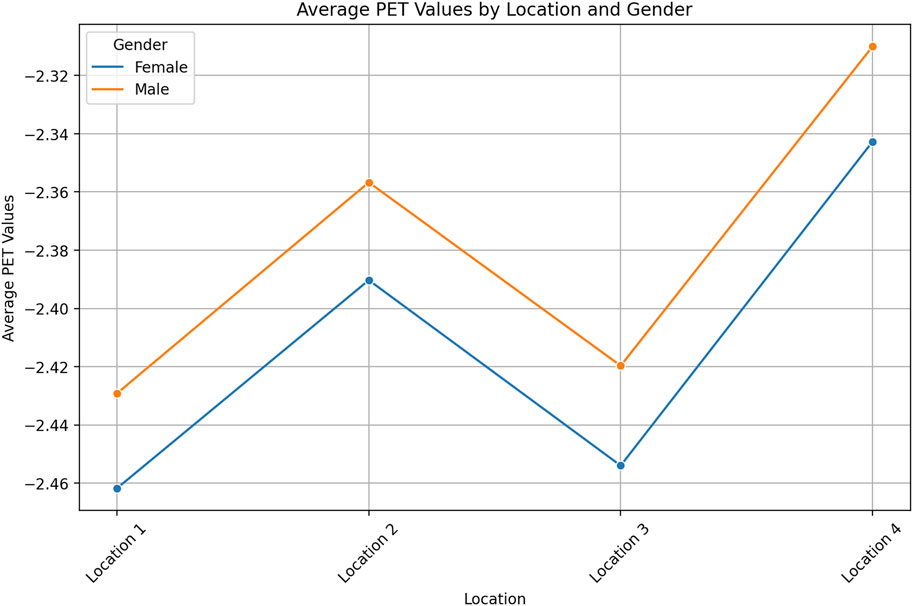
The line chart displays the average PET values across the four locations, differentiated by gender (Figure 9). It illustrates the trends and allows for easy comparison between the different groups. The line chart visualizes each location’s average Physiological Equivalent Temperature (PET) values, separated by gender. The chart shows a trend where Location 4 has the highest (least negative) average PET values for both genders, suggesting it is the least thermally stressful environment. Conversely, Location 1 and Location 3 exhibit more thermal stress with lower average PET values. Across all locations, females have slightly higher average PET values than males, indicating a small but consistent gender difference in thermal stress perception or reporting. This visualization helps quickly identify patterns and differences in thermal stress across different demographics and locations.
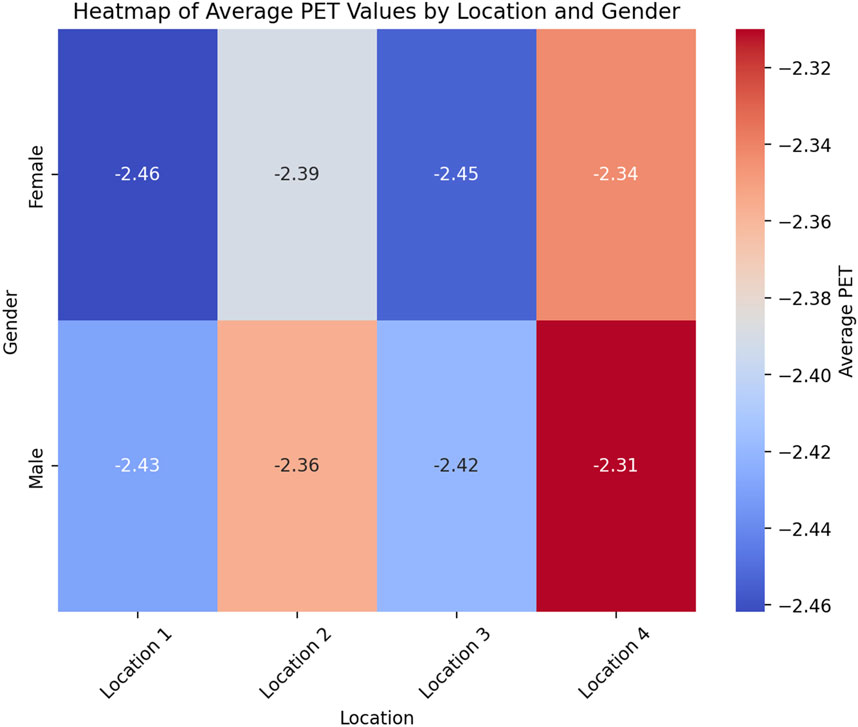
The heatmap provides a color-coded representation of the average PET values by location and gender (Figure 10). Here is an elaborative explanation:
• The color intensity represents the level of thermal stress, with cooler colors indicating lower stress and warmer colors indicating higher stress.
• Location 4 is noticeably cooler for both genders, suggesting it is the most comfortable in terms of thermal conditions.
• Locations 1 and 3 are warmer, especially for males, indicating higher thermal stress.
• Females generally experience slightly less thermal stress than males, as indicated by the cooler colors in their rows across all locations.
This visualization allows for an immediate visual comparison of thermal comfort levels across different demographics and locations.
5.1 Predict thermal stress
The study utilizes the Python-based statistical tool to predict thermal stress for a specific gender at a certain time of day. We use the code to predict the thermal stress for any location, day, time, and gender. Below is one of the Python codes we use to predict the thermal stress condition from the large, simulated dataset.
# Load the dataset for Location 1 Male
location_1_male_df = all_dataframes [“Location 1_Male Age 24 Excel Data. xlsx”][“Location 1”]
# Check the first few rows of the dataframe to understand its structure
print (location_1_male_df.head ())
# Print out the columns to check for the correct column names
print (location_1_male_df.columns)
# Convert “Year Hour” to a datetime format and set it as the index
location_1_male_df [“Datetime”] = pd. to_datetime (location_1_male_df [“Year Hour”], unit = “h,” origin = pd.Timestamp (“2023–01–01”))
location_1_male_df.set_index (“Datetime,” inplace = True)
# Filter the data for December 30th at 10:00
filtered_df = location_1_male_df.loc [“2023–12–30 10:00:00”]
# Assuming “Thermal Stress Condition” is the column that indicates thermal stress.
#Extract the thermal stress condition for the specified time
thermal_stress_condition = filtered_df ['Thermal Stress Condition']
# Display the thermal stress condition
print (“Thermal Stress Condition for a male at Location 1 on December 30th at 10:00:,” thermal_stress_condition)
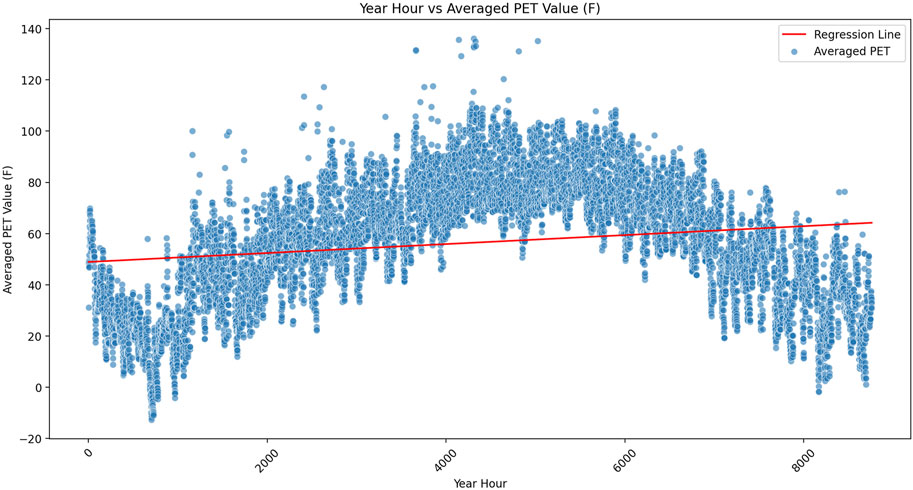
We also developed another python code to predict the PET value in terms of Year Hours to understand the linear relationship with the time and comfort data. The code below is used to frame out the linear regression. At first, we trained the linear regression model, which gives us the results: the coefficient for year hour is approximately 0.0017, the mean squared error of the model is 559.93, and the coefficient of determination (R^2) is 0.03, indicating a very weak predictive power.
The scatter plot shows the averaged PET values for each “Year Hour,” and the red line represents the regression line based on the linear model. This visualization helps us understand the general trend of PET values over time.
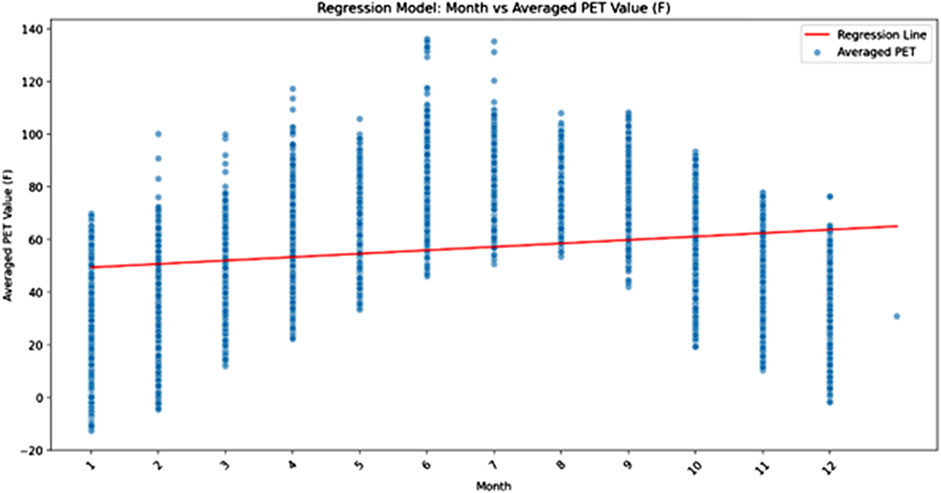
The regression model to predict the PET value using months as the predictor has been created. Here are the model details: Regression Coefficient: 1.3014, Regression Intercept: 48.0470, Model Score (R2): 0.0350 (Figures 11, 12). The model score indicates that the model explains only 3.5% of the variance in the PET values, which suggests that the model has very low predictive power. The regression line plotted on the scatter plot of averaged PET values shows the general trend according to this model.
6 Discussion and conclusion
The study results are detailed across various simulation tasks that examine the outdoor thermal comfort at North Carolina A&T State University. The simulations revealed significant findings regarding ground surface radiation and its effect on pedestrian comfort. Specifically, the open landscape areas showed solar energy gains ranging from 1,400 to 1,700 kWh/m2, significantly impacting users’ outdoor comfort. This data also suggests that such renewable energy could be harnessed for sustainable energy resources in future campus designs. Additionally, simulations indicated that under specific conditions—such as the presence of both sun and wind—Greensboro’s weather could provide outdoor comfort 43.67% of the time. The comfortable temperature range for these conditions is identified as 64.4°F–78.8°F, predominantly from mid-April to mid-October.
Further analysis focused on the Universal Thermal Climate Index (UTCI) across various scenarios involving different combinations of sun and wind. This algorithm helped predict how the human body perceives temperature under varying conditions, highlighting that metabolic rate and clothing adaptation significantly influence thermal comfort. The study utilized the Physiological Equivalent Temperature (PET) to understand better how environmental conditions affect perceived temperature. The statistical comparison of PET values showed a notable difference between genders, with males generally experiencing higher PET values than females across all locations. This gender-based disparity aligns with existing literature on physiological tolerance differences.
Across all locations, females have slightly higher average PET values than males, indicating a small but consistent gender difference in thermal stress perception or reporting. This also aligns with the argument of females’ high physiological tolerance capability (Tung et al., 2014). The difference in thermal stress perceptions between males and females also aligns with the investigation of Yin et al. (2012), which indicates that men can perceive slightly higher maximum temperatures than women. It also highlights that while individual sensitivity to temperature varies, factors like solar radiation and wind speed similarly influence gender perceptions.
The predictive modeling aspect of the study forecasts thermal stress at specific times and locations. Linear regression models were developed to understand the relationship between time and comfort data, although the models exhibited low predictive power. The regression coefficient for predicting PET values was minimal, indicating only a slight trend over time. The study’s findings underscore the importance of considering various environmental and personal factors in designing comfortable outdoor spaces on urban campuses. Despite the weak predictive models, the visual interpretations and statistical analyses provide valuable insights into optimizing outdoor thermal environments for diverse users.
The study has several potential limitations. Firstly, the linear regression models used for predicting Physiological Equivalent Temperature (PET) values demonstrated low predictive power, which may affect the reliability of forecasts. Assumptions made during simulations about weather conditions and user behavior might not fully capture real-world scenarios. Gender-based differences in PET values were noted, but other factors like age and health, which also impact thermal comfort, were not addressed. The study’s focus on a specific period (mid-April to mid-October) may not account for seasonal variations or extreme weather. Additionally, the simulations might not fully represent spatial variability across campus locations. While the study suggests using solar energy, it does not explore the practical challenges of integrating renewable energy into campus infrastructure. Validation and calibration of the simulation models are crucial, and any limitations in these processes could affect the accuracy of the findings. Finally, if data granularity is insufficient, localized conditions may be overlooked, impacting comfort. These limitations highlight the need for further research to refine predictions and account for diverse factors influencing outdoor thermal comfort.
In conclusion, this study underscores the importance of integrating gender-specific thermal perceptions into urban energy simulation. By analyzing outdoor thermal comfort through simulation at North Carolina A&T State University, the research reveals significant differences in how males and females experience thermal stress, emphasizing the need to consider these variations early in urban decision-making. Although the predictive models exhibited low accuracy, the findings provide valuable insights for creating more inclusive and comfortable outdoor environments. The study highlights that factors like solar radiation and wind conditions affect thermal comfort across genders differently, suggesting that these should be carefully balanced in future campus designs. While further research is needed to refine predictive models and consider additional variables, this work establishes a foundation for using advanced simulations to inform urban design and planning. Integrating gender-specific data into the design process can lead to more equitable and sustainable outdoor spaces better suited to diverse user needs.
Data availability statement
The original contributions presented in the study are included in the article/Supplementary Material, further inquiries can be directed to the corresponding author.
Author contributions
SuC: Conceptualization, Data curation, Funding acquisition, Investigation, Methodology, Software, Supervision, Validation, Writing–original draft, Writing–review and editing. SaC: Data curation, Formal Analysis, Writing–review and editing. MR: Visualization, Writing–original draft.
Funding
The author(s) declare that financial support was received for the research, authorship, and/or publication of this article. The research got support from the North Carolina Agricultural and Technical State University Provost Fellowship 2023 Seed Fund.
Acknowledgments
We acknowledge using an AI tool, Julias AI, for statistical analysis in this article.
Conflict of interest
The authors declare that the research was conducted in the absence of any commercial or financial relationships that could be construed as a potential conflict of interest.
Publisher’s note
All claims expressed in this article are solely those of the authors and do not necessarily represent those of their affiliated organizations, or those of the publisher, the editors and the reviewers. Any product that may be evaluated in this article, or claim that may be made by its manufacturer, is not guaranteed or endorsed by the publisher.
Supplementary material
The Supplementary Material for this article can be found online at: https://www.frontiersin.org/articles/10.3389/fbuil.2024.1449351/full#supplementary-material
References
Acero, J. A., and Herranz-Pascual, K. (2015). A comparison of thermal comfort conditions in four urban spaces by means of measurements and modelling techniques. Build. Environ. 93, 245–257. doi:10.1016/j.buildenv.2015.06.028
Bowler, D. E., Buyung-Ali, L., Knight, T. M., and Pullin, A. S. (2010). Urban greening to cool towns and cities: a systematic review of the empirical evidence. Landsc. Urban Plan. 97 (3), 147–155. doi:10.1016/j.landurbplan.2010.05.006
Cilek, M. U. (2021). Outdoor thermal comfort indicators and indices. Academic Research and Reviews in Architecture, Planning and Design Sciences, 19.
Emmanuel, R., and Steemers, K. (2018). Connecting the realms of urban form, density and microclimate. Taylor & Francis 46, 804–808. doi:10.1080/09613218.2018.1507078
Gill, S. E., Handley, J. F., Ennos, A. R., and Pauleit, S. (2007). Adapting cities for climate change: the role of the green infrastructure. Built Environ. 33 (1), 115–133. doi:10.2148/benv.33.1.115
Höppe, P. (1999). The physiological equivalent temperature–a universal index for the biometeorological assessment of the thermal environment. Int. J. Biometeorology 43, 71–75. doi:10.1007/s004840050118
Jin, H., Liu, S., and Kang, J. (2020). Gender differences in thermal comfort on pedestrian streets in cold and transitional seasons in severe cold regions in China. Build. Environ. 168, 106488. doi:10.1016/j.buildenv.2019.106488
Johansson, E., Thorsson, S., Emmanuel, R., and Krüger, E. (2014). Instruments and methods in outdoor thermal comfort studies–The need for standardization. Urban Clim. 10, 346–366. doi:10.1016/j.uclim.2013.12.002
Karjalainen, S. (2012). Thermal comfort and gender: a literature review. Indoor air 22 (2), 96–109. doi:10.1111/j.1600-0668.2011.00747.x
Kumar, P., and Sharma, A. (2022). “Analysis of gender differences in thermal sensations in outdoor thermal comfort: a field survey in northern India,” in Climate change and pragmatic engineering mitigation (New York, NY: Jenny Stanford Publishing), 247–267.
Lin, T.-P., de Dear, R., Matzarakis, A., and Hwang, R.-L. (2009). “Prediction of thermal acceptability in hot-humid outdoor environments in Taiwan,” in The seventh international conference on urban climate.
Matzarakis, A., Rutz, F., and Mayer, H. (2007). Modelling radiation fluxes in simple and complex environments—application of the RayMan model. Int. J. Biometeorology 51, 323–334. doi:10.1007/s00484-006-0061-8
Muhy Al-Din, S. S., Nia, H. A., and Rahbarianyazd, R. (2024). Towards sustainable living through thermoneutral temperature management in subtropical steppe climates. Sustainability 16 (13), 5699. doi:10.3390/su16135699
Nasir, R. A., Ahmad, S. S., and Ahmed, A. Z. (2013). Physical activity and human comfort correlation in an urban park in hot and humid conditions. Procedia-Social Behav. Sci. 105, 598–609. doi:10.1016/j.sbspro.2013.11.063
Oke, T. R. (1982). The energetic basis of the urban heat island. Q. J. R. meteorological Soc. 108 (455), 1–24. doi:10.1002/qj.49710845502
Tung, C.-H., Chen, C.-P., Tsai, K.-T., Kántor, N., Hwang, R.-L., Matzarakis, A., et al. (2014). Outdoor thermal comfort characteristics in the hot and humid region from a gender perspective. Int. J. biometeorology 58, 1927–1939. doi:10.1007/s00484-014-0795-7
Wang, Z., de Dear, R., Luo, M., Lin, B., He, Y., Ghahramani, A., et al. (2018). Individual difference in thermal comfort: a literature review. Build. Environ. 138, 181–193. doi:10.1016/j.buildenv.2018.04.040
Yang, L., Zhao, S., Gao, S., Zhang, H., Arens, E., and Zhai, Y. (2021). Gender differences in metabolic rates and thermal comfort in sedentary young males and females at various temperatures. Energy Build. 251, 111360. doi:10.1016/j.enbuild.2021.111360
Yin, J., Zheng, Y., Wu, R., Tan, J., Ye, D., and Wang, W. (2012). An analysis of influential factors on outdoor thermal comfort in summer. Int. J. biometeorology 56, 941–948. doi:10.1007/s00484-011-0503-9
Ying, C.-H., Lin, C.-H., and Hwang, R.-L. (2011). “The thermal comfort level of activities on public outdoor space,” in 2011 international conference on consumer electronics, communications and networks (CECNet).
Keywords: outdoor comfort, gender perception, energy simulation, PET, UTCI
Citation: Chowdhury S, Chowdhury S and Rezve MFH (2024) Using simulated human comfort matrix to measure urban campus gender-based thermal performances. Front. Built Environ. 10:1449351. doi: 10.3389/fbuil.2024.1449351
Received: 14 June 2024; Accepted: 23 September 2024;
Published: 18 October 2024.
Edited by:
Stephen Siuyu Lau, The University of Hong Kong, Hong Kong SAR, ChinaReviewed by:
Hasim Altan, Prince Mohammad bin Fahd University, Saudi ArabiaHourakhsh Ahmadnia, Alanya University, Türkiye
Copyright © 2024 Chowdhury, Chowdhury and Rezve. This is an open-access article distributed under the terms of the Creative Commons Attribution License (CC BY). The use, distribution or reproduction in other forums is permitted, provided the original author(s) and the copyright owner(s) are credited and that the original publication in this journal is cited, in accordance with accepted academic practice. No use, distribution or reproduction is permitted which does not comply with these terms.
*Correspondence: Shuva Chowdhury, c2Nob3dkaHVyeUBuY2F0LmVkdQ==
 Shuva Chowdhury
 Sharmistha Chowdhury2
 Md Fahim Hasan Rezve
