 Monica V. Sanchez-Sepulveda1*
 Joan Navarro2
 Daniel Amo-Filva2
 David Fonseca1
 Felipe Antúnez-Anea2Albert Barranco-Albalat1
- 1Departament of Architecture, La Salle, Ramon Llull University, Barcelona, Spain
- 2Departament of Engineering, La Salle, Ramon Llull University, Barcelona, Spain
The concentration of populations in large cities has resulted in significant challenges affecting residents’ quality of life, particularly mobility and environmental pollution. Addressing these issues is crucial for enhancing environmental, social, and economic wellbeing. This study proposes leveraging Open Data repositories to identify critical points in urban infrastructure for promoting accessible, sustainable, and healthy mobility. We hypothesize that by analyzing and optimizing urban infrastructure based on available data, it is possible to mitigate the negative impacts of urbanization on mobility and environmental quality. A data-driven tool, incorporating data visualization, exploratory analyses, and classification and clustering algorithms, was employed to develop a system that not only presents data intuitively but also offers insights and recommendations for improvement. The findings, based on a case study in Barcelona, are transferable to other cities worldwide, offering valuable insights for urban planning professionals in future city improvement projects. While the city of Barcelona serves as a case study, the methodology is transferable to other cities worldwide.
1 Introduction
In July 2022, the Barcelona City Council initiated the “Grants for Young and Emerging Research Projects” (BarcelonaAyuntamiento de, 2022) intending to solidify the city’s status as a scientific hub and provide new opportunities for young professionals interested in embarking on or furthering their careers in research. The challenge outlined in this plan involves generating innovative ideas that seek to address urban challenges in Barcelona, which can then be substantiated by scientific evidence and contribute to future policy decisions. The City Council’s proposal outlined three thematic axes, of which “Health and Wellbeing in the City” was selected for this work. This focal point is presented as a reflection of the city’s commitment to tackling multifaceted issues impacting its residents’ quality of life (Nieuwenhuijsen et al., 2024).
Within the realm of urban challenges, mobility stands out as a paramount concern, both in Barcelona and cities worldwide (Turoń, Czech, and Juzek, 2017; Gabrielli et al., 2014; Balletto, Ladu, and Camerin, 2022). Rapid urbanization and population growth have exacerbated congestion, pollution, and safety hazards, undermining residents’ access to safe and sustainable transportation options (Healthy Cities, 2023). Despite concerted efforts by municipal authorities and researchers to address these challenges, there remains a notable gap in the literature about comprehensive, data-driven approaches to urban mobility solutions.
Specifically, previous research has thoroughly examined the diverse mobility challenges confronting cities such as Barcelona, there is a notable absence of comprehensive methodologies and resources capable of methodically analyzing and resolving these issues (Soriano-Gonzalez et al., 2023). Traditional approaches often fall short in capturing the complex interplay of architectural, environmental, and social factors influencing mobility patterns, hindering the development of effective intervention strategies (Saelens, Sallis, and Frank, 2003; Ravazzoli and Torricelli, 2017).
The project “ACCIONA Y CONECTA: Barcelona Towards Accessible, Sustainable, and Healthy Mobility” (Sanchez-Sepulveda et al., 2023) aims to address a common issue in major cities worldwide, that is, the increasing population density in urban centers. This issue has not only been tackled by the Barcelona City Council but is also a highly developed area of concern on a global scale in projects addressing the Sustainable Development Goals (SDGs) to seek solutions and improvements for the sustainability challenges of our current society (Weymouth and Hartz-Karp, 2018; Blasi, Ganzaroli, and De Noni, 2022). We chose Barcelona as the case study because it has a high population density, well-developed public transportation system, and ongoing efforts to promote sustainable urban mobility (Plan de Movilidad Urbana, 2024) | Movilidad y transportes | Ayuntamiento de Barcelona” 2023).
The work presented below will focus on the realm of mobility, using Barcelona as a case study, to develop a data-driven tool that not only facilitates the intuitive visualization and assessment of the city parameters but also offers improvement suggestions to promote safe, sustainable, healthy, equitable, and intelligent mobility for pedestrians and cyclists. In this regard, different well-known tools and algorithms from the field of data mining have been utilized. Although, as mentioned, the project is developed for the city of Barcelona, the methodology employed in this work has been selected so it can be extracted and applied to other cities. This process unfolds in the following steps:
• Identifying the architectural and urban measurable parameters that have the most significant impact on pedestrian and cyclist traffic in the city.
• Creating a data-driven tool/system to support urban design professionals in making decisions that contribute to improving the population’s health.
• Thoroughly analyzing the state, distribution, and utilization of Barcelona’s streets.
• Evaluating the reliability of the obtained results.
The goal of the project is to develop a system that represents the quality of various aspects related to mobility, both from the pedestrian or “walkability” perspective and the cyclist or “cyclability” perspective, giving actionable insights and, thus, providing the opportunity to different types of users to evaluate changes and options for improving the urban environment. That is, the overarching objective of this research is to take advantage of already available urban data in open data repositories to provide urban planners with a data-driven tool able to calculate the walkability and cyclability score of a street segment.
2 Conceptual framework
Over the past few decades, the global urban structure has undergone significant changes (Frolking et al., 2013). In the mid-20th century, only about 30% of the world’s population resided in urban areas, but by 2009, this percentage had risen to 50% (Cuberes, 2020). Currently, more than 80% of the world’s Gross Domestic Product (GDP) is concentrated in urban centers (Desarrollo urbano: Panorama general, 2021), and approximately 56% of the global population, which is roughly 4.4 billion people, live in cities, with expectations of this growth continuing to increase (Gu, Andreev, and Dupre, 2021).
Therefore, it is crucial that future urbanization projects and adopted policies take this scenario into account to minimize their adverse impacts (Khan et al., 2021). In any case, urban growth is a global phenomenon that affects us not only at demographic and economic levels but also in other aspects, especially urban sustainability, as discussed below (Phillis, Kouikoglou, and Verdugo, 2017).
Well-developed cities such as Barcelona, are also suffering from mobility and traffic congestion problems, primarily due to the excessive use of private vehicles (López, Ortega, and Pardo, 2020). It should be noted that, at times, this use is due to the inadequacy of a public transportation network incapable of meeting the travel demand (Fonseca et al., 2021). Nonetheless, according to the European Climate Action Progress Rhoads et al., 2023.1, the motorized transport sector represents 29% of total greenhouse gas emissions in Spain.
The aforementioned population growth together with global challenges such as climate change or urbanization demand innovative solutions to address the challenges associated with citizen mobility systems (Martin et al., 2023). That is, making them more efficient, accessible, and sustainable (Piccinini et al., 2016). Indeed, it is worth noting that sustainable mobility—public transit, cycling, walking, electric vehicles—aims to minimize environmental harm and footprint while ensuring equitable access to transportation services (Litman and Burwell, 2006). For instance, recent research on micro-mobility has underlined its significance as a low-carbon and transformative urban transport mode (Abduljabbar, Liyanage, and Dia, 2021; Rhoads, Solé-Ribalta, and Borge-Holthoefer, 2023). Nonetheless, cities like Barcelona—which are recognized for their high population density (see Figure 1) and well-developed public transportation systems—that promote these sustainable transportation practices, still face significant pollution issues, particularly from road traffic-related suspended particles and nitrogen dioxide (Badach, Wojnowski, and Gębicki, 2023; Gómez-Losada et al., 2019).
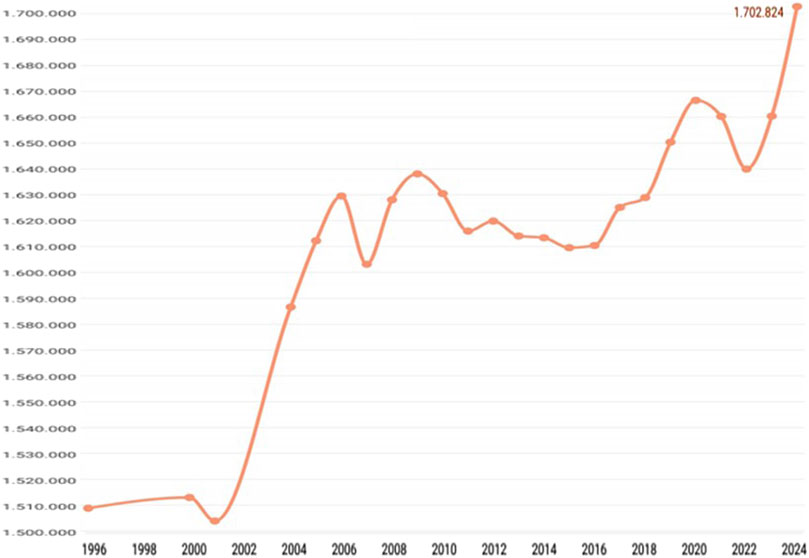
Figure 1. Population growth in Barcelona from 1996 to 2024 (Palmer, 2024).
Global initiatives aim to convert urban public spaces into cleaner, safer environments by prioritizing pedestrians and promoting active transportation, showcasing the benefits of traffic pacification to highlight the health impacts of motorized transportation and pollution (Declaració d’emergència climàtica, 2020; Fusco, 2016; Jardim et al., 2023). Urban design significantly influences walkability, impacting public health, safety, transportation efficiency, and overall quality of life, with recent research emphasizing its role alongside genetics, lifestyle, and socioeconomic factors in determining community health outcomes (Grazuleviciene et al., 2021; Duc and Ngan, 2022; Giles et al., 2021). Thus, applying social innovation strategies to prioritize pedestrians’ mobility and promoting cycling transportation poses a unique opportunity to respond to broader societal changes beyond climate change and environmental footprint (Tonne et al., 2021; Krottje, 2022).
With urban populations continuously growing, it is crucial to develop urbanization policies that optimize active transportation like walking and cycling (Cong, Kwak, and Deal, 2022). Public administrations are increasingly adopting transparency and efficiency through open data repositories, providing valuable insights into urban life. These repositories offer diverse city-related information, enabling the shaping of policies promoting walkability and cyclability in transportation (Delgado-Enales et al., 2023; Rhoads et al., 2023). Focusing on the city of Barcelona (Contaminació BCN, 2021) air pollution in Barcelona is largely attributed to traffic and exceeds the recommended levels of suspended particulate matter and nitrogen dioxide set by the World Health Organization (Blanchar, 2022). As per the Barcelona City Council website (Plan de Movilidad Urbana, 2024 Movilidad y transportes Ayuntamiento de Barcelona” 2023), currently, 26% of daily commutes in the city are conducted via private vehicles. The distribution among various modes of transportation is illustrated in the following chart (Figure 2).
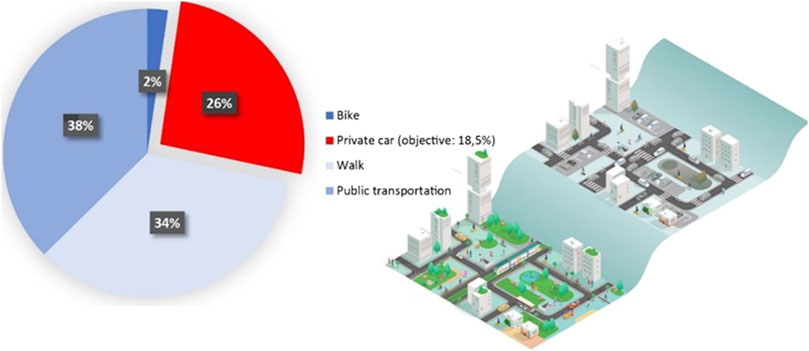
Figure 2. Distribution of commutes in Barcelona and Urban Mobility Plan of the Barcelona City Council (Plan de Movilidad Urbana, 2024 | Movilidad y transportes | Ayuntamiento de Barcelona” 2023).
As observed, the objective of the Urban Mobility Plan for 2024 is to reduce private vehicle transportation from 26% to 18.5%. This translates to an increase in the proportion of commutes carried out by sustainable means such as walking, public transportation, or cycling to 81.5%, compared to the current 74%. In Figure 2, the Urban Mobility Plan of the Barcelona City Council shows on the left the current city model, dominated by private vehicle mobility and extensive urban space occupied by parking. On the right, the desired vision for the future is presented: centered on pedestrians and cyclists, featuring ample green spaces, and prioritizing public transportation over private vehicles (Shammas et al., 2023).
Barcelona is actively pursuing measures to create a more peaceful urban environment, with the overarching goal of improving air quality, creating more communal spaces, and reducing accidents and noise pollution (López, Ortega, and Pardo, 2020). Implementing traffic calming measures not only enhances public safety but also encourages citizens to choose public transportation, walking, or cycling for their daily commutes (Baobeid, Koç, and Al-Ghamdi, 2021; Buehler and Pucher, 2023; Kormos, Sussman, and Rosenberg, 2021). Prioritizing sustainable, non-disruptive, safe, efficient, and accessible modes of transportation, such as walking and cycling, not only mitigates pollution but also revitalizes public spaces, which should rightfully belong to the community to enhance the overall quality of life (Ravazzoli and Torricelli, 2017). Given their collective benefits and alignment with societal wellbeing, walking, public transport, and cycling are deemed as the future of mobility in Barcelona (Sola, 2020).
To conceptualize a more ecologically sustainable proposal, it is essential to have data-driven systems and models that characterize the current situation and can simulate future scenarios for decision-making (Geertman and Stillwell, 2020; Kunze et al., 2012). Assessing the pedestrian-friendliness and safety of urban areas is essential for creating inviting and secure environments for residents and visitors alike (Turoń, Czech, and Juzek, 2017; Saelens, Sallis, and Frank, 2003). This involves evaluating walkability alongside safety measures across various neighborhoods, establishing relevant criteria, and devising strategies for accessible, sustainable, and safe urban mobility that fosters social and economic interactions. With urbanization on the rise, prioritizing sustainability and walkability in cities has become paramount (Ravazzoli and Torricelli, 2017). Therefore, integrating environmental, economic, and social considerations into urban planning is crucial for creating healthier, more attractive, and economically robust urban spaces. Thus, objectively evaluating the walkability and safety aspects of urban environments is vital in this endeavor, offering a means to mitigate environmental impact, stimulate economic vitality, and improve the wellbeing of urban dwellers. Achieving this objective assessment necessitates leveraging data and digital technologies for collecting, processing, and analyzing urban data comprehensively.
3 Methodology
The methodology employed in this study is inspired by (Lausch, Schmidt, and Tischendorf, 2015) and encompasses the following steps:
1. Preliminary information availability search and feature selection. This step aims to browse and explore available datasets from Open Data repositories in the city of interest. For instance, some well-known cities having open data available are as follows:
• Barcelona: Ajuntament de Barcelona’s Open Data Service https://opendata-ajuntament.barcelona.cat/en (568 datasets available).
• Helsinki: Helsinki Region Infoshare https://hri.fi/en_gb/(593 datasets available).
• London: Open Data Service London Datastore https://data.london.gov.uk/(1922 datasets available).
• Madrid: Open Data portal of the Madrid city council https://datos.madrid.es/portal/site/egob (598 datasets available).
• New York City: NYC Open Data: https://opendata.cityofnewyork.us/(2701 datasets available)
After selecting the city of interest and their associated datasets (of topics appropriate to the study scope), it is time to preliminarily assess its quality by identifying the percentage of missing values, outliers, and inconsistencies to obtain an initial assessment of the quality of the dataset. Also, conduct exploratory data analysis to understand the characteristics and distributions of the variables. The output of this step is a list of datasets—each one related to one of the topics of interest (e.g., bike lanes, urban furniture)—to be used and a set of features to be considered (e.g., location of trees, width of sidewalks).
2. Convert categorical variables into numerical representations. This step consists of transforming categorical values into numerical vectors—typically using one-hot encoding (Seger, 2018)—to facilitate their integration into subsequent analyses. The output of this step is a group of datasets in the same format (e.g., Comma-Separated Values also known as CSV) each one having only numerical data.
3. Dealing with null and inconsistent values. This step aims to refine the quality and completeness of the dataset by inferring feasible values for fields with null or inconsistent entries. For instance, it is very common that these open datasets have empty values (i.e., null) or values that are wrong (e.g., height of a tree with a negative value) (Mcardle and Kitchin, 2016). The output of this step is a group of curated datasets with no null or inconsistent data.
4. Handling data with associated geometry. As data of interest are still dispersed into different datasets, it is necessary to establish a link between every instance of each dataset in order to analyze them as whole. Hence, this step aims to adapt geospatial data, integral to urban infrastructure analysis, and to incorporate spatial dimensions into the analytical framework. The output of this step is a single georeferenced dataset.
5. Data clustering for discovering hidden patterns in data: Once data are preprocessed, organized, and cleaned as described in the previous steps, this step aims to group data in a set of clusters (i.e., groups of data with a similar pattern) to identify inherent and hidden patterns (Bholowalia and Kumar 2014; Bodoia, 2016) that may help on explain its dynamics and would aid the extraction of meaningful insights. For instance, it could be discovered that narrow streets, streets with no urban vegetation (e.g., trees), and noisy streets, belong to the same cluster. The output of this step is a set of data (i.e., street sections) clusters with similar characteristics.
6. Building an explainable model of the clustering process. Although the clustering algorithms used in the previous step aim to group data with similar characteristics, such grouping might be difficult to understand at humans’ eyes due to the large number of data and features inside a cluster. Therefore, this step aims to complement the insights extracted from the previous stage by modeling and analyzing the inherent relationships of data in a human-readable way between various factors influencing urban mobility and environmental quality, enhancing interpretability and actionable decision-making. The output of this step is an explainable model—such as a decision tree (Blanco-Justicia and Domingo-Ferrer 2019)—that describes the configuration of the data clusters built in the previous stage.
7. Computation of the final metrics of interest upon all the available data. For the sake of this research (i.e., sustainable mobility for improved quality of life), we will focus on inferring a walkability and cyclability score to each street segment according to the available open data (e.g., pollution, noise, sidewalks width, etc.). Leveraging machine learning techniques such as XGBoost (Chen and Guestrin, 2016) and Random Forest (Wu et al., 2015), this step aims to provide a comprehensive assessment of walkability and cyclability scores. As a result for this specific research, the output of this step is a list of street sections and their associated walkability and cyclability scores.
3.1 Preliminary information search
The preliminary information search is aimed to identify the fundamentals in which the collected data must revolve. Among all the sources consulted, “SUMA-USC” (ESMARTCITY, 2016) stands out, from which aspects that would later be evaluated by the application were adopted:
• Modal distribution: related to the road network,
• Urban layout: related to the physical characteristics of sidewalks,
• Urban scenery: related to street elements that have the most influence on pedestrians and cyclists,
• Safety: focusing on factors affecting the perception of pedestrians and cyclists,
• Environmental: related to environmental conditions.
Therefore, the proposed data-driven system must display a map for each of these dimensions for pedestrians and cyclists.
3.2 Data extraction and processing
This phase consists of identifying reliable data sources to populate the dimensions identified in the previous stage. For the specific case of Barcelona city, we have to select the single data source associated to this city, that is the Open Data BCN platform (Open Data BCN, 2023). Note that this is a public service that provides a huge amount of urban data collected by the Barcelona City Council.
It is worth noting that in this repository, data are not curated (i.e., missing, or inconsistent values) and delivered in different formats:
• CSV: comma-separated values text files,
• ZIP CSV: CSV files contained within compressed folders,
• JSON: JavaScript Object Notation format for data interchange,
• GEOJSON: used for encoding geographic data structures,
• SHP: files with associated geometric information.
To facilitate the analysis of diverse urban datasets in Barcelona, several preprocessing steps were undertaken to ensure data accuracy and usability. These steps involved standardizing variable names, addressing language-related issues, handling null values, and transforming categorical variables into binary formats where necessary. Each dataset, ranging from geographic and infrastructure data to traffic accidents and public transport, underwent specific preprocessing tailored to its content. These efforts aimed to streamline subsequent analyses and provide valuable insights into urban mobility, safety, and infrastructure development. After obtaining the datasets, the extracted data needs to be further processed to curate them. This processing mainly involves the following:
• Eliminating data that is considered irrelevant and/or inconsistent for the aspect to be analyzed. That is, data that does not belong to any of the following categories: Modal Distribution (15% of the data), Urban Layout (28% of the data), Urban Scenery (29% of the data), Safety (23% of the data), or Environmental (5% of the data). Table 1 depicts the variables of the dataset associated to each one of these categories.
• Handling null values.
• Renaming variables for better comprehension and replacing improperly encoded characters such as accented letters and diacritics (see Table 1).
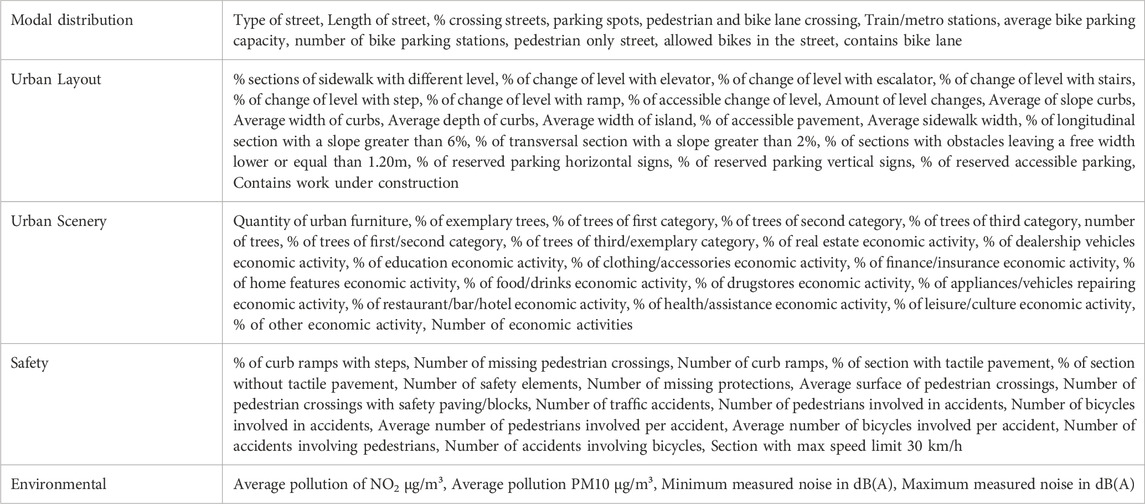
Table 1. Selected variables of the dataset associated to each category.
However, the variety of formats still prevents their representation using a common language. The following subsections provide details about the procedures followed to work with the variety of data obtained and how each case was standardized. Note that as each analysis is using a different subset of these data and, thus, these procedures must be carried for each analysis.
3.2.1 Data processing with one-hot encoding
The One-Hot Encoding algorithm allows for the conversion of a text-formatted variable into a numerical format (Rodríguez et al., 2018). In this context, categorical variables, such as “type,” are transformed into a set of binary variables. For example, consider a variable named “type” with values “bench,” “table,” or “chair.” One-Hot Encoding, in simplified terms, changes the nature of the question to a series of questions that can be answered with either a “Yes” (or, in this work, a value of 1) or a “No” (a value of 0). Following the previous example, instead of asking, “What type is it?” you ask, “Is it a bench?”, “Is it a table?” and “Is it a chair?” for all data instances, accepting only “Yes” or “No” as responses (values of one or 0, respectively).
In summary, instead of asking the instance what it is, you ask one by one about all the things it could be, and you obtain a response based on ones and zeros for all instances. As the algorithm fails for null values (those left blank), clustering techniques can be used to assign them a feasible value. In this regard, an algorithm called K-Nearest Neighbors (KNN) has been used to impute values to the remaining null values based on their K-Nearest Neighbors (Triguero et al., 2019). As this is done with a real-world dataset in which a ground truth is not available, typical approaches based on finding the optimal value of k using cross-validation cannot be conducted reliably. Therefore, we k = 3 has been selected, which aims to balance the bias-variance trade-off inherent in KNN algorithms: a small k, such as k = 1, may overfit the local noise in the data, whereas a larger k might over smooth important local variations. Using k = 3 strikes a compromise, offering robust and reliable imputations based on our qualitative observations. This means that each null value will be assigned the average value of its three nearest neighboring data points.
Once this step is completed, the data format is standardized from text to numeric (i.e., vector). However, there are still formats like SHP that have associated geometric shapes in the files. In these cases, the geometry can appear in the form of coordinates or line strings (polygons).
3.2.2 Handling data with associated geometry
A preliminary step is required to standardize the reference system for all data. In this regard, reference system 4,326, also known as WGS84 (Kumar, 1988) has been selected. This ensures that all data are correctly georeferenced, and as a result, their positions within the maps are consistent.
Next, the geometry must be standardized in each of its formats (coordinates or line strings) to represent all data as segments. To achieve this, influence areas or “buffers” must be drawn around each data point, and different operations need to be performed based on each format:
• Coordinate Format: The “join” operation is conducted between the data’s geometry and the buffer, followed using the “intersects” operation to perform the union in case of intersection.
• Line string Format (polygons): In this case, the “within” operation is used, which excludes segments of geometry that are outside the corresponding influence area.
As a result, a single dataset composed of a total of 14,301 instances (stored in a CSV) was obtained, where each one represents a different street section of Barcelona, which is accompanied by 87 collected variables that will be analyzed throughout the project. Now, the data will be ready for further processing.
3.2.3 Data Clustering for Processing Numerical Variables
In the case of variables with assigned numerical values, as exemplified in various categories such as, for example, Noise Level (dB) (in the Environmental Category in Table 1), Number of accidents (in the Safety Category in Table 1), Quantity of parking spaces (in the Modal Distribution category in Table 1), Average width of free walking space (in the Urban Layout category in Table 1), or Quantity of urban furniture elements (in the Urban Scenery category in Table 1)—please note that this is not an exhaustive listing of all the variables of the dataset with numerical variables but just an illustrative selection.
The K-Means clustering algorithm proposed by Stuart Lloyd in 1957 is utilized. Its objective is to divide a set of N numerical data points into K clusters (Bodoia, 2016; Balcan, Dick, and White, 2018). Each cluster is represented by its centroid, which is the mean of all the data in that cluster. During the clustering process, each data point is assigned to the cluster whose centroid is closest to it in terms of Euclidean distance or another specified distance metric. The algorithm operates as follows:
1. Randomly select K initial centroids from the data points.
2. Assign each data point to its nearest centroid.
3. Calculate the mean of the data points assigned to each centroid and update the position of each centroid.
4. Repeat steps 2 and 3 until there is no significant change in the centroids or until a maximum number of iterations is reached.
5. Each data point is assigned to the cluster to which its centroid belongs.
In simplified terms, this process allows the conversion of a range of values into intervals represented by groups known as “clusters”, which can later be used to assign a score to each value based on the range in which it falls. This step establishes the ranking system for each parameter. To ensure that the score aligns with the actual value, it is necessary to quantify the magnitude of the effect that each variable has on the others by means of a correlation matrix.
Using the “elbow method,” a commonly used technique in cluster analysis (Bholowalia and Kumar 2014), the optimal number of clusters K is determined in a way that minimizes the margin of error. This method consists of plotting this variation against the number of clusters and identifying the point where adding another cluster no longer significantly contributes to the total variation, resembling the shape of an “elbow.” It is worth noting that the selected value of K has practical and business implications: while low values of K offer poor interpretation and segmentation because most of data fall in the same cluster, high values of K also offer poor interpretation because data are too segmented.
3.2.4 Decision tree
The data processing methodology described in sections 3.2.1 to 3.2.4 was performed for all variables in the Modal Distribution, Urban Layout, Urban Scene, Safety, and Environmental categories, resulting in a distinct color map for each variable. The next step is to create a map for each of these categories. In each map was assigned a score to each segment for the corresponding category. This score would be assigned based on the scores the segment had in the variables related to the dimension of the map.
To assign clusters to each segment (Modal Distribution Cluster, Urban Layout Cluster, Urban Scene Cluster, Safety Cluster, and Environmental Cluster), and thereby assign the corresponding score to each theme cluster (Guggari, Kadappa, and Umadevi, 2019), a decision tree can be used.
A decision tree is a machine-learning tool that generates a decision model based on feature values. The system checks whether a certain condition is met or not and performs a new check based on the result, repeating the process until there is nothing else to check. For the sake of this research, it was decided which conditions to check and in what order these checks should be made. In this case, a method called “Grid Search” (Pontes et al., 2016) was used to determine the optimal values for the decision tree, which were then used for the checks. In this work, each data point is assigned to the corresponding cluster based on the decisions made throughout the decision tree (i.e., the “path” the tree has followed). As a result, the tree provides an explainable view of the results achieved by the K-Means clustering conducted at the previous stage.
3.2.5 Final walkability and cyclability score
After calculating the scores for each of the dimensions identified at the first stage (Urban Layout, Urban Scene, Modal Distribution, Safety, and Environmental), the final score in terms of walkability and cyclability for each segment in Barcelona was determined. Two different methods have been implemented for this purpose:
• Version 1: The scores for each category are summed to obtain an overall score for each segment. It is essential to note that this is a preliminary approach and does not consider the relative weight of different categories.
• Version 2: The scores are calculated using a clustering technique, similar to what has been done for each category. Once the model is implemented, the strengths and weaknesses of each group will be compared to assign each score. In this case, more accurate and well-founded results will be obtained.
3.3 Results evaluation
To assess the reliability of the results obtained, two different methods have been used: “XGBOOST” (Chen and Guestrin, 2016) and “Random Forest”. Both are methods applied to decision trees to improve the decision-making process of the algorithm, each with a different focus:
• XGBoost: It is a sequential method, which means that it trains the decision tree to reduce variance and make it more “stable” in its predictions with each application.
• Random Forest: In this method, several decision trees are trained simultaneously to make predictions increasingly close to the actual result, increasing the accuracy of the resulting model and making it more “reliable” (Wu et al., 2015).
3.4 Development of the final system
Finally, an online dashboard has been developed using Tableau Public, which can be accessed online (Walkability and Cyclability - Barcelona, 2023), that incorporates and visualizes the outcome of the entire process.
4 Results
After applying the methods described in the previous section, the importance of certain variables in defining groups and the scores received by each segment in each category is emphasized. These variables, detailed below, directly impacted the overall walkability and cyclability indices of Barcelona’s segments. In the following sections, we present the primary results obtained in the main districts of Barcelona (Figure 3): Ciutat Vella, Eixample, Gracia, Horta-Guinardó, Les Corts, Nou Barris, Sant Andreu, Sant Marti, Sants-Montjuic, and Sarria-Sant Gervasi.
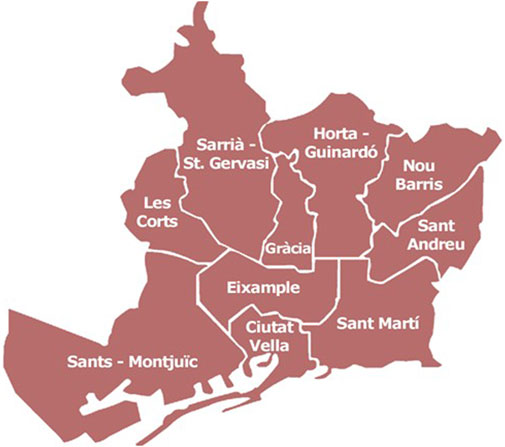
Figure 3. Barcelona districts.
4.1 Urban scene
After four iterations applying the methods described in the previous section to select the most relevant variables and simplify the analysis, 4 clusters were identified in the stage described in Section 3.2.3 (Data Clustering for Processing Numerical Variables):
• Cluster 1 → Dark Green (4 points): This cluster stands out for its high economic activity and ranks second in the number of trees. This group of segments achieved the highest score, considering that the ‘economic_act_quantity’ variable has a more direct influence on walkability and cyclability and, therefore, has been given greater importance compared to the number of trees.
• Cluster 2 → Light Green (3 points): It ranks second considering its good performance in terms of economic activity.
• Cluster 3 → Yellow (2 points): Despite having a low value in economic activity, it stands out for its high number of trees.
• Cluster 0 → Red (1 point): It has the lowest values in both variables and, thus, the group is considered the least favorable.
The amount of commercial activity and the number of trees were the determining attributes in this classification. The clusters with higher scores exhibited high economic activity and a significant number of trees.
When analyzing the centroids of each cluster about the variables, the following remarks can be observed (see Figure 4). If we visualize the relationship between the two variables, we obtain the following results. It is worth noting that the cluster centroids are distinguished by the “+” sign.
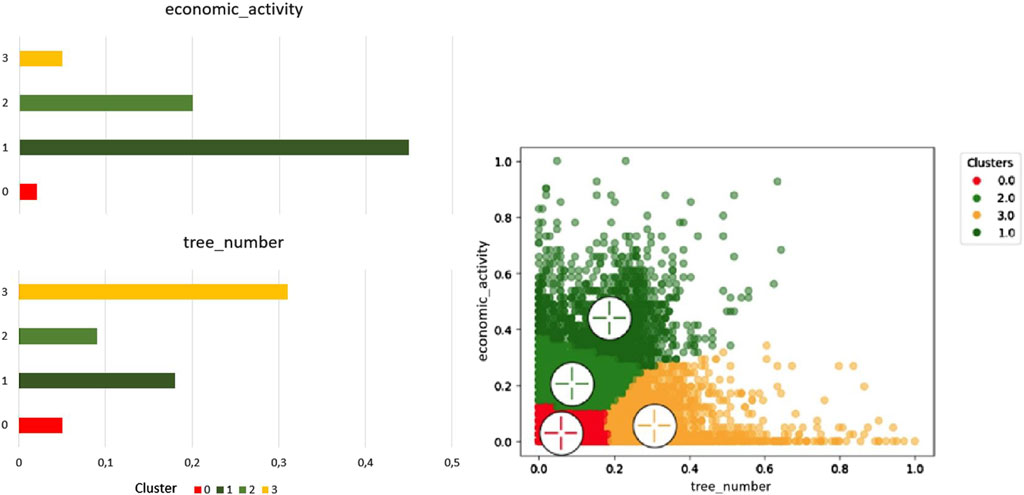
Figure 4. Cluster centroids comparison and Cluster Centroids representation in 2D. Iteration four in Urban Scene.
After using K-nearest neighbors (KNN), and assigning clusters through decision trees, the results of the urban scene analysis on the map of Barcelona are presented (Figure 5). The findings reflect consistent patterns, where more central areas with higher economic activity are grouped in clusters one and 2. On the other hand, in the more peripheral areas are where clusters with a higher number of trees and lower economic activity are located.

Figure 5. Barcelona map. Iteration four in Urban Scene.
4.2 Urban layout
After three iterations, applying the methods described in the previous section to select the most relevant variables and simplify the analysis, 4 clusters have been identified in the stage described in Section 3.2.3 (Data Clustering for Processing Numerical Variables). Elevation changes, the percentage of obstacles with a clear passage width of less than or equal to 1.20 m, and the percentage of segments with a longitudinal slope greater than 6% were the most influential variables. In this case, segments with low slopes, no elevation changes, and few obstacles with a narrow clear passage width received the highest scores.
When analyzing the centroids of each cluster based on the variables, the following results have been observed:
• Cluster 1 → Green (4 points): Shows the best results in all variables, earning the highest score in urban fabric.
• Cluster 0 → Yellow (3 points): Although it has the highest number of obstacles with a clear passage width of less than 1.20 m, it does not present the additional challenges of clusters two and three in terms of steep slopes and the number of elevation changes.
• Cluster 3 → Red (2 points): Its segments are primarily characterized by longitudinal slopes greater than 6%.
• Cluster 2 → Dark Red (1 point): It has been assigned the lowest score as it is characterized by the highest number of elevation changes, considering these to be a significant obstacle to walkability.
It is worth mentioning that it makes sense for both clusters two and 3, which have high levels of slopes and elevation changes, to also have a high percentage of obstacles with a clear passage width of less than 1.20 m. The relationship between the three variables for each of the clusters can be observed in the following Figure 6.
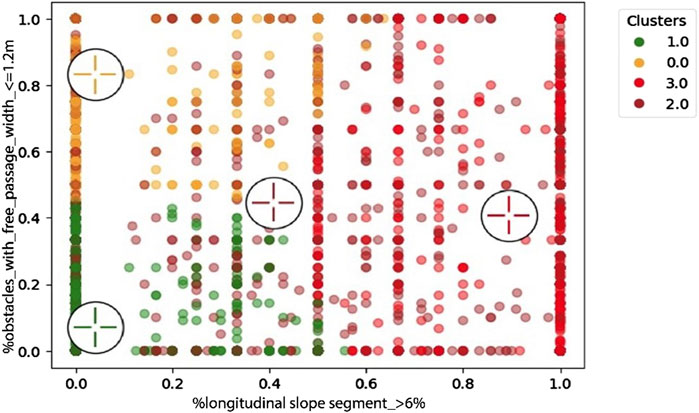
Figure 6. Cluster centroids in 2D. Iteration three in urban layout.
Again, when visualizing the final representation of the map of Barcelona, considering the variables studied, the results seem to accurately reflect the distinctive characteristics of each sector of the city (Figure 7). Elevated areas of the city, such as Tibidabo and Montjuic, are appropriately associated with clusters two and 3, which have a high number of elevation changes and steep slopes.
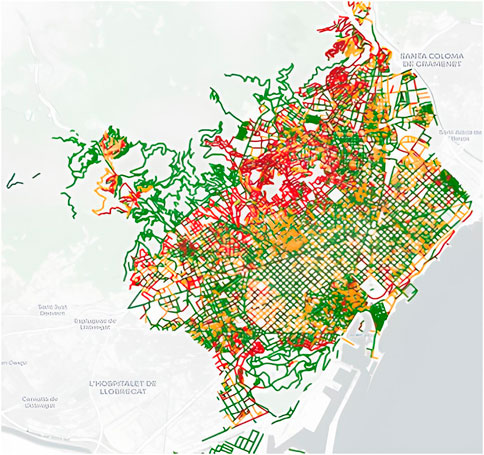
Figure 7. Map of barcelona without NULLS - Iteration three in urban layout.
On the other hand, neighborhoods like Gracia and Ciutat Vella, known for their narrow streets and architectural peculiarities, have a high percentage of obstacles with a clear passage width of less than 1.20 m, according to our classification in cluster 0. This aligns with the reality of these neighborhoods, where historical urban design can pose challenges to walkability and cyclability.
Furthermore, the consistency between the basic knowledge of the city and its data-driven representation of district characteristics validates the subsequent representations of new study variables, creating a consistent model for work and study.
4.3 Safety
This category is strongly influenced by the number of accidents involving pedestrians or bicycles and the segments with a maximum speed of 30 km/h. Segments with no accidents and a maximum speed of 30 km/h receive the highest scores. Since the analysis needs to be conducted for both walkability and cyclability, a score has been assigned to each cluster from two different perspectives: as a pedestrian and as a cyclist.
After three iterations, 4 clusters have been identified in the stage described in Section 3.2.3 (Data Clustering for Processing Numerical Variables). The analysis of the centroids yields the following results:
• Cluster 3 → Green (4 points): Segments without accidents and a maximum speed of 30 km/h. In this regard, it achieves the highest score.
• Cluster 1 → Yellow (3 points): Segments without accidents but, unlike the previous cluster, without a speed limit, which poses a higher risk for cyclists.
• Cluster 0 → Red (2 points): Involves pedestrian accidents but not cyclist accidents
• Cluster 2 → Dark Red (1 point): Involves both pedestrian and cyclist accidents, which is why it received the lowest rating.
The segments with a higher number of accidents, represented in red and dark red, are concentrated in the central area of the city, particularly in the l'Eixample neighborhood, where traffic flow is considerably high (Figure 8). In contrast, segments with fewer accidents or no accidents are primarily located in the peripheral areas of the city.
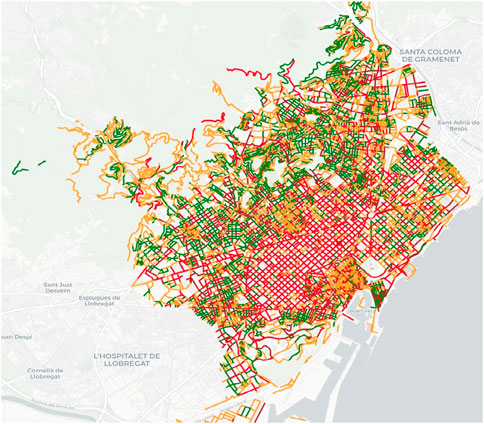
Figure 8. Barcelona Map. Iteration three from the pedestrian and cyclist Safety Perspective.
4.4 Modal distribution
The final analysis combines variables such as pedestrian segments, the presence of a bike lane, road type, and whether the road is bikeable determined by the scores obtained. Specifically, for pedestrians, segments exclusively for pedestrians that are also considered bikeable have received the highest rating. On the other hand, for cyclists, segments with bike lanes (some of which are also bikeable) receive the highest scores.
For this analysis, as in the case of Safety, it is necessary to separate it into two perspectives: that of the pedestrian and that of the cyclist, thus obtaining two modal distribution scores, one for each case. From the pedestrian perspective, after three iterations, 5 clusters have been identified in the stage described in Section 3.2.3 (Data Clustering for Processing Numerical Variables). The analysis of the centroids enables us to outline the following remarks:
• Cluster 2 → Dark Green (5 points): These are only pedestrian segments, and at the same time, they are considered bikeable, so they receive the highest score.
• Cluster 4 → Light Green (4 points): The cluster is characterized by including segments with bike lanes. Considering that these segments showed better results in terms of the percentage of pedestrian accidents than segments exclusively considered bikeable, they are ranked second in the classification.
• Cluster 1 → Yellow (3 points): It is characterized by having bikeable segments, which demonstrates a higher percentage of pedestrian accidents than those with bike lanes.
• Cluster 0 → Red (2 points): This group includes both bikeable and non-bikeable segments.
• Cluster 3 → Dark Red (1 point): This group consists solely of segments not suitable for cyclists, which does not promote healthy activity. These often correspond to highways or areas that are difficult to access for neither cyclists nor pedestrians, which is why they receive the lowest score.
It is worth noting that clusters one and three belong to secondary roads, groups 2 and 4 have a percentage of primary roads, and cluster 0 includes road types that are categorized as “other” (roundabouts, highways, intersections in squares, etc.) in the dataset. The results are displayed in Figure 9.
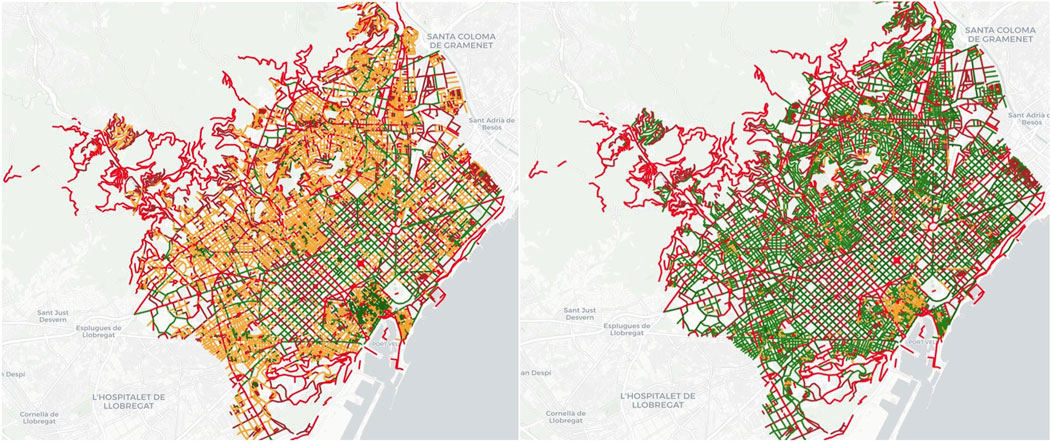
Figure 9. Barcelona Map. Iteration three from the pedestrian and cyclist’s perspective in the modal distribution.
From the cyclist’s perspective, the analysis process was similar to that carried out from the pedestrian perspective, but the assignment of scores to each cluster varies. The following are the obtained remarks:
• Cluster 4 → Dark Green (5 points): In this classification, special attention has been paid to the “bikeable segment” variable. This group stands out as it contains roads with bike lanes, some of which are also bikeable, thus taking the top position.
• Cluster 1 → Light Green (4 points): The segments within this cluster consist mainly of exclusively bikeable roads, which avoid interaction between cyclists and pedestrians.
• Cluster 2 → Yellow (3 points): This group contains bikeable roads that are also pedestrian segments.
• Cluster 0 → Red (2 points): This group is characterized by a combination of both bikeable and non-bikeable roads.
• Cluster 3 → Dark Red (1 point): It is rated the lowest because it is directly composed of non-bikeable roads.
When observing the different colors of each segment on the map of Barcelona, the differences in score assignments concerning the pedestrian perspective are evident.
4.5 Environmental layout
From this last perspective, the noise level and the average NO2 pollution play the most important role. Segments with lower noise levels and NO2 pollution have received the highest ratings. After three iterations, 4 clusters have been identified in the stage described in Section 3.2.3 (Data Clustering for Processing Numerical Variables):
• Cluster 0 → Green (4 points): Segments in this cluster stand out for having the lowest levels of noise and NO2 pollution. For this reason, they receive the highest rating.
• Cluster 1 → Yellow (3 points): This group shows low noise levels but high pollution levels. Since noise perception is more immediate than NO2 pollution when walking or cycling, this cluster is ranked second.
• Cluster 3 → Red (2 points): The cluster has low pollution levels but high noise levels, so it is ranked third.
• Cluster 2 → Dark Red (1 point): This group of segments has the highest values in terms of noise and NO2 pollution, receiving the lowest rating.
Figure 10 shows the distribution of each of the clusters on the map of the city of Barcelona. As it can be seen, the results are consistent: the most polluted and noisy segments are located in the city center (cluster 2). On the other hand, there is less noise in more pedestrian areas like the neighborhoods of Gracia and Ciutat Vella (cluster 1). The Poblenou area (cluster 3), although noisy, has lower NO2 pollution as it is a bit further from the center. Finally, the more distant, less dense, and quieter areas show the best results in both variables (cluster 0).

Figure 10. Map of Barcelona after imputing null values with KNN - Environmental.
5 Discussion
5.1 Final weighting of walkability and cyclability
Based on all the weighted and analyzed data layers, the final scoring in terms of walkability and cyclability must be performed for each segment of Barcelona. To do this, we have applied the clustering technique mentioned earlier.
For walkability, a methodology like the one presented in the previous sections has been applied: the elbow method, the K-Means algorithm, and centroid visualization. The following clusters have been obtained:
• Cluster 4 → Dark Green (5 points): Represents areas with high scores in all categories, particularly excelling in urban scene, modal distribution, and pedestrian safety. Despite showing low scores in environmental aspects, it is considered the best in the reality of Barcelona.
• Cluster 3 → Light Green (4 points): This group stands out in urban layout. However, environmental scores are also low, and a poor score in the urban scene category is added.
• Cluster 1 → Yellow (3 points): These segments are primarily affected by a low score in safety and the environment, which have a greater impact on walkability than the weaknesses of the previous cluster.
• Cluster 0 → Red (2 points): This group is characterized by low scores in the urban layout category. It is in worse condition than the previous one because the urban layout, such as slopes and obstacles, is more noticeable and has a more immediate impact on pedestrians than other factors like safety and the environment.
• Cluster 2 → Dark Red (1 point): Segments marked with this color show low scores in modal distribution and urban scenes. It is important to note that they have been assigned the lowest score since these segments are considered practically impassable for pedestrians.
The same process is followed for cyclability. After identifying the centroids of each group, the following results can be obtained:
• Cluster 3 → Dark Green (5 points): This group receives a very high rating in all categories, particularly excelling in safety and modal distribution. While it does not achieve the highest values in environmental aspects, it is inferred that this group primarily contains suitable and pleasant routes for cyclists, with a high level of safety, placing it at the top position.
• Cluster 1 → Light Green (4 points): Stands out in modal distribution and urban scene but performs less well in terms of safety and environmental factors.
• Cluster 4 → Yellow (3 points): This group is characterized by a low score in urban layout. Although it may have strengths in other areas, slopes, and level changes are highly noticeable factors that hinder cyclist traffic.
• Cluster 0 → Red (2 points): While this group excels in terms of urban layout, it shows a low score in modal distribution and urban scene. Performance in modal distribution considered a critical factor determining the feasibility of cycling, results in a low score for this group.
• Cluster 2 → Dark Red (1 point): Excels in urban layout but performs poorly in terms of safety, environmental aspects, and modal distribution. Despite the robustness of its urban layout, its poor performance in terms of circulation places it in the lowest position.
The results of both studies are displayed in the following Figure 11.
Figure 11. Final Cluster Representation on the Map of Barcelona: (left) Walkability, (right) Cyclability.
In terms of walkability, the segments in Cluster 4, visualized in dark green, are in central and pedestrian-friendly areas, primarily in historic neighborhoods like Ciutat Vella and Gracia. These areas stand out for their high scores in nearly all categories, especially in urban scenes, modal distribution, and pedestrian safety. While they have some limitations in environmental aspects, these segments offer the best walking experience in the city. Cluster 3, represented in light green, is in areas that share similarities with Cluster four but also includes neighborhoods like Poblenou. These segments are characterized by a lower urban scene score, mainly due to lower economic activity and a higher presence of trees. However, despite these differences, these areas continue to provide a favorable environment for walkability in contrast to other sectors of the city. Cluster one is primarily found in the L'Eixample district, a central and busy area. These segments suffer a decrease in their score due to safety and environmental factors. In contrast, the segments in Cluster 0, highlighted in red, are in elevated areas such as Tibidabo and Montjuïc. These areas are characterized by the urban layout, mainly the slopes and obstacles, which affect their score and, therefore, their ease of passage. Finally, the segments corresponding to Cluster 2 (dark red) are located on the city’s outskirts. Characterized by their low modal distribution and urban scene score, these segments are the least suitable for pedestrians, as they correspond to routes or locations that are difficult to access and are outside the city.
Regarding cyclability, consistent results have been obtained when considering the specific characteristics of each cluster. Overall, the lack of cycling lanes and bike paths in central segments of the city negatively impacts modal distribution, leading to different results compared to walkability. The segments in Cluster 3, visualized in dark green, extend through central areas of the city with high safety levels and a favorable modal distribution, earning them a high rating. However, they do not achieve the highest values in terms of environmental aspects. Cluster 1, represented in light green, covers areas like Cluster three but with a marked contrast in terms of safety. These segments are marked by a high accident rate, particularly in the Eixample district, which could be attributed to the high flow of people due to its high economic activity. The segments in Cluster 4, marked in yellow, are mainly located in elevated areas of the city like Tibidabo and Montjuic. Steep slopes penalize this group with a low urban layout score. The segments in Cluster 0, highlighted in red, are mostly located in peripheral areas and face difficulties in cycling. Despite having a good urban layout, poor modal distribution, and a low urban scene score ultimately affect their rating. Finally, the segments in Cluster 2, marked in dark red, are in central areas but are characterized by limitations for bicycle traffic. The absence of speed limits for vehicles, the lack of bike lanes, and low scores in environmental and safety aspects give them the lowest rating among the groups.
5.2 Policy and planning implications of the methodology
The methodology presented in this study offers a comprehensive framework for enhancing urban infrastructure and promoting sustainable mobility. By employing a data-driven tool that integrates data visualization, exploratory analyses, and classification and clustering algorithms, urban planners can gain valuable insights into the current state of urban mobility and environmental conditions. The implications for policy and planning are significant, as detailed below:
5.2.1 Identification of critical points and decision support
• Critical Infrastructure Points: The data-driven approach helps identify critical points in urban infrastructure that impact pedestrian and cyclist traffic. This identification allows for targeted interventions where they are most needed, such as enhancing pedestrian pathways or improving cycling lanes.
• Informed Decision-Making: The dashboard presents data in an intuitive format, enabling urban planners and policymakers to make informed decisions. By visualizing the current conditions and potential improvements, the tool supports the development of strategies that align with sustainability goals.
5.2.2 Planning and resource allocation
• Prioritizing Investments: Numerical scores for walkability and cyclability allow planners to prioritize investments in infrastructure. Areas with low scores can be earmarked for immediate improvements, ensuring resources are allocated effectively to enhance overall mobility.
• Scenario Analysis: The tool can simulate various planning scenarios, helping policymakers understand the potential impacts of different interventions. This capability is crucial for planning long-term strategies that balance economic, environmental, and social factors.
5.2.3 Enhancing public engagement and transparency
• Public Awareness: The dashboard can be used to raise public awareness about mobility issues and the planned interventions. By making this data publicly accessible, cities can engage residents in the planning process, fostering a sense of community involvement and support for sustainable initiatives.
• Transparency: Transparent data sharing enhances accountability. When residents can see the data and understand the rationale behind planning decisions, it builds trust between the community and the local government.
5.3 Utilization of numerical scores and dashboard in planning
The numerical scores and dashboard developed in this study can be utilized in several ways to support urban planning. Scores for walkability and cyclability provide a quantitative assessment of current conditions, serving as benchmarks to measure progress over time and ensure that interventions lead to tangible improvements. By identifying specific areas with low scores, urban planners can target interventions more effectively, such as improving sidewalks, lighting, or green spaces in streets with low walkability scores. The insights gained from the data can inform the formulation of policies aimed at promoting sustainable mobility, such as incentivizing public transportation use or expanding cycling infrastructure. The dashboard can highlight areas where investments are most needed, guiding the allocation of financial and human resources to areas that will yield the greatest benefits in terms of improved mobility and environmental quality. The system also allows for ongoing monitoring and evaluation of urban mobility conditions, enabling planners to track changes over time, assess the effectiveness of interventions, and make data-driven adjustments to strategies as needed.
The data-driven methodology and tools developed in this study provide urban planners with robust resources for enhancing urban infrastructure and promoting sustainable mobility. By leveraging numerical scores and an intuitive dashboard, policymakers can make informed decisions, prioritize interventions, and engage the public in the planning process. Ultimately, this approach supports the creation of healthier, more sustainable, and more equitable urban environments.
5.4 Transferability and customization of the methodology
Although this study focuses on Barcelona, the methodologies, and data-driven approaches we’ve developed can be adapted to other cities. Here are the key steps to ensure effective transferability and customization:
1. Identify and Collect Local Data: Find open data repositories in the new city and gather relevant information on urban infrastructure, transportation, and the environment.
2. Adjust Parameters and Weightings: Customize the tool’s parameters to reflect the specific characteristics and priorities of the new city.
3. Implement Clustering and Analysis Algorithms: Use the same algorithms applied in Barcelona, ensuring they are compatible with the new data.
4. Provide Tailored Insights: Generate actionable recommendations for improving urban mobility that align with local policy goals.
By following these steps, our tools can offer tailored insights and recommendations for different urban contexts. This approach allows urban planners and policymakers to make informed decisions to enhance urban mobility and quality of life. We’ve already started applying this methodology in Madrid and Helsinki, and the results are publicly available on our project website: https://accionayconecta.barcelona/replicabilidad/.
6 Conclusion
The project presents the design of a multiple-stage data analysis model that, through the importation of various sources, allows for the representation of walkability and cyclability in the city of Barcelona. The discussion and weighting of walkability and cyclability are essential processes in the evaluation and improvement of urban infrastructure. In these processes, various variables and criteria that influence the quality of the walking and cycling experience in a city are analyzed and assigned values.
The validation of the method is based on an understanding of the environment, which is obtained through various layers: firstly, being the place of residence of the study authors; secondly, Barcelona being a continuous object of study by architectural faculties, particularly those affiliated with the authors in the last 25 years; and finally, due to the coherence of the representation obtained with previous studies. To evaluate the walkability and cyclability scores of street segments, a data analytics pipeline has been built. The proposed solution consists of several interconnected components, each serving specific functions within the analytical pipeline:
• Data Ingestion and Preprocessing Module: The system ingests data from various sources from the Barcelona Open Data repository. It preprocesses the data to handle missing values, outliers, and inconsistencies, ensuring data quality and compatibility with subsequent analysis.
• Exploratory Data Analysis (EDA) Module: This module conducts exploratory data analysis to uncover patterns, correlations, and anomalies within the data. It employs visualization techniques to provide users with insights into urban infrastructure characteristics and trends.
• Machine Learning Modeling Module: The heart of the system, this module utilizes machine learning algorithms to model complex relationships between urban variables and predict outcomes of interest. In this case, the obtained models predict the walkability and cyclability scores of a given street section.
• Spatial Analysis and Visualization Component: Geospatial analysis techniques are integrated into the system to analyze spatial distributions, patterns, and relationships within urban infrastructure data. Interactive maps and spatial visualizations facilitate the exploration of spatial insights and inform decision-making.
• Decision Support System (DSS): The system incorporates a decision support system (i.e., decision tree) that synthesizes the findings from exploratory analysis, machine learning models, and spatial analysis into actionable insights for urban planners and decision-makers.
The implementation of this pipeline has enabled practitioners to observe that the obtained data consistently aligned with the physical reality of Barcelona, indicating that the interpretation and preprocessing of variables were appropriate. During the assessment of the scores, and through a pilot study based on a qualitative Delphi approach involving specific users of the areas under investigation, it has been confirmed that the results are coherent, yielding satisfactory results of around 85% in metrics such as accuracy and sensitivity of the represented concepts.
Through the XGBoost algorithm, which exhibited the best performance, key variables displaying significant variability between segments and directly influencing walkability and cyclability were identified. These variables include the number of pedestrians and bicycles involved in accidents, level changes, minimum noise level, economic activity, segments with a longitudinal slope greater than 6%, and the average NO2 pollution level. In the pedestrian score, although modal distribution variables appeared on the list, their influence was less pronounced. In contrast, for cyclability, modal distribution played a more significant role, while the impact of urban scenery was less prominent.
Despite all the aforementioned factors, it can be observed that there are segments in the application where the overall score significantly differs from the scores of Modal Distribution, Urban Layout, Urban Scene, Safety, and Environmental aspects. It should be clarified that this is not an error on the part of the application but rather related to the weighting of certain variables in the calculation of the final score. In other words, even with common variables, the weight of these variables varies in each score, which can lead to significantly different scores assigned by two different decision trees. In this regard, a future line of work focuses on quantitative validation with users, allowing for the adjustment of specific weights in certain situations and based on the area or activity to provide a better representation of the space and its characteristics.
In conclusion, we have identified the relevant variables that allow for the identification and discussion of the environmental improvement of cities. The next steps involve the engagement of stakeholders such as residents, cyclists, pedestrians, urban planners, and local authorities in the discussion and weighing, which is crucial. In this regard, the proposed approach for the future will entail conducting a study that combines qualitative and quantitative methods to assess walkability and cyclability. Qualitative insights from users and experts can complement quantitative data, providing a more comprehensive perspective.
We have also observed that assigning weights to each variable or criterion is a pivotal step. This process involves determining which variables have a greater or lesser impact on the quality of walkability and cyclability. These weights can be based on the perceived importance of each variable or on quantitative data that supports their influence. This aspect is fundamental for adapting to local contexts as it recognizes that the needs and challenges of walkability and cyclability may vary depending on the specific local context. An effective solution in one city may not be suitable in another. Therefore, it is essential to tailor the weighting to the specific conditions and characteristics of each area and to incorporate continuous monitoring and adaptation. Once the weighting is established, it is crucial to continuously monitor and adjust as needed. Cities evolve, and policies and infrastructure must evolve as well to maintain and enhance walkability and cyclability.
Data availability statement
The raw data supporting the conclusions of this article will be made available by the authors, without undue reservation.
Author contributions
MS-S: Conceptualization, Funding acquisition, Investigation, Methodology, Project administration, Supervision, Validation, Writing–review and editing. JN: Conceptualization, Investigation, Methodology, Supervision, Validation, Writing–review and editing. DA-F: Resources, Validation, Writing–review and editing, Methodology, Supervision. DF: Validation, Writing–review and editing, Resources. FA-A: Data curation, Formal Analysis, Investigation, Software, Visualization, Writing–original draft. AB-A: Writing–review and editing.
Funding
The author(s) declare that financial support was received for the research, authorship, and/or publication of this article. The project has been financed by the Barcelona City Council and the Ministry of Science and Innovation within the framework of Barcelona’s Cultural and Scientific Capital. Acceptance grant code 22S09490-001.
Acknowledgments
The authors gratefully acknowledge the financial support provided by the Barcelona City Council and the Ministry of Science and Innovation within the framework of Barcelona’s Cultural and Scientific Capital, the guidance of the Edgelands Institute and the support of La Salle, Ramon Llull University.
Conflict of interest
The authors declare that the research was conducted in the absence of any commercial or financial relationships that could be construed as a potential conflict of interest.
Publisher’s note
All claims expressed in this article are solely those of the authors and do not necessarily represent those of their affiliated organizations, or those of the publisher, the editors and the reviewers. Any product that may be evaluated in this article, or claim that may be made by its manufacturer, is not guaranteed or endorsed by the publisher.
Footnotes
1https://climate.ec.europa.eu/document/download/c9c92d31-1ffa-4639-8e78-cd4dc64e6b86_en?filename=es_2023_factsheet_en.pdf
References
Abduljabbar, R. L., Liyanage, S., and Hussein, D. (2021). The role of micro-mobility in shaping sustainable cities: a systematic literature review. Transp. Res. Part D Transp. Environ. 92 (March), 102734. doi:10.1016/j.trd.2021.102734
Badach, J., Wojnowski, W., and Gębicki, J. (2023). Spatial aspects of urban air quality management: estimating the impact of micro-scale urban form on pollution dispersion. Comput. Environ. Urban Syst. 99 (January), 101890. doi:10.1016/j.compenvurbsys.2022.101890
Balcan, M.-F. F., Dick, T., and White, C. (2018) “Data-driven clustering via parameterized Lloyd’ s families,” in Advances in neural information processing systems, 31.
Balletto, G., Ladu, M., and Camerin, F. (2022). “Sustainable urban mobility planning and walkability in the post pandemic era. Assessing the role of urban enclaves,” in Computational science and its applications – ICCSA 2022 workshops. Editors O. Gervasi, B. Murgante, S. Misra, A. M. A. C. Rocha, and C. Garau (Cham: Springer International Publishing), 257–266. doi:10.1007/978-3-031-10542-5_18
Baobeid, A., Koç, M., and Al-Ghamdi, S. G. (2021). Walkability and its relationships with health, sustainability, and livability: elements of physical environment and evaluation frameworks. Front. Built Environ. 7 (September). doi:10.3389/fbuil.2021.721218
Barcelona, Ayuntamiento de (2022). “Subvenciones para proyectos de investigación joven y emergente | Info Barcelona | Ayuntamiento de Barcelona.” 2022. Available at: https://www.barcelona.cat/infobarcelona/es/tema/educacion-y-estudios/subvenciones-para-proyectos-de-investigacion-joven-y-emergente_1190730.html.
Bholowalia, P., and Kumar, A. (2014). EBK-means: a clustering technique based on elbow method and K-means in WSN. Int. J. Comput. Appl. 105 (9), 17–24. doi:10.4236/jdaip.2020.83010
Blanchar, C. (2022). La contaminación en Barcelona llega a triplicar los nuevos límites fijados por la OMS. El País. Available at: https://elpais.com/espana/catalunya/2022-01-10/la-contaminacion-en-barcelona-llega-a-triplicar-los-nuevos-limites-fijados-por-la-oms.html (Accessed January 10, 2022).
Blanco-Justicia, A., and Domingo-Ferrer, J. (2019). “Machine learning explainability through comprehensible decision trees,” in Machine learning and knowledge extraction. Editors A. Holzinger, P. Kieseberg, A. M. Tjoa, and E. Weippl (Cham: Springer International Publishing), 15–26. doi:10.1007/978-3-030-29726-8_2
Blasi, S., Ganzaroli, A., and De Noni, I. (2022). Smartening sustainable development in cities: strengthening the theoretical linkage between smart cities and SDGs. Sustain. Cities Soc. 80 (May), 103793. doi:10.1016/j.scs.2022.103793
Buehler, R., and Pucher, J. (2023). Overview of walking rates, walking safety, and government policies to encourage more and safer walking in europe and north America. Sustainability 15 (7), 5719. doi:10.3390/su15075719
Chen, T., and Guestrin, C. (2016). “XGBoost: a scalable tree boosting system,” in Proceedings of the 22nd ACM SIGKDD international conference on knowledge discovery and data mining (New York, NY, USA: Association for Computing Machinery), 785–794. KDD ’16. doi:10.1145/2939672.2939785
Cong, C., Kwak, Y., and Deal, B. (2022). Incorporating active transportation modes in large scale urban modeling to inform sustainable urban development. Comput. Environ. Urban Syst. 91 (January), 101726. doi:10.1016/j.compenvurbsys.2021.101726
Contaminació BCN (2021). Contaminació BCN. Available at: https://contaminacio.barcelona/.
Cuberes, D. (2020). Concentración de la población y crecimiento económico. Papeles Econ. Española 164, 88–99.
Declaració d’emergència climàtica (2020). Declaració d’emergència climàtica. Available at: https://www.barcelona.cat/emergenciaclimatica/es/home-ca (Accessed January 15, 2020).
Delgado-Enales, I., Ser, J. D., and Molina-Costa, P. (2023). A framework to improve urban accessibility and environmental conditions in age-friendly cities using graph modeling and multi-objective optimization. Comput. Environ. Urban Syst. 102 (June), 101966. doi:10.1016/j.compenvurbsys.2023.101966
Desarrollo urbano: Panorama general (2021). Text/HTML. World Bank. Available at: https://www.bancomundial.org/es/topic/urbandevelopment/overview.
Duc, T. V. M., and Ngan, Le T. K. (2022). Smart cities, healthy citizens: integrating urban public health in urban planning. Rev. Contemp. Bus. Anal. 5 (1), 28–44.
ESMARTCITY (2016). “WCT: Walkability City Tool, una herramienta de análisis de la caminabilidad” in ESMARTCITY. Available at: https://www.esmartcity.es/comunicaciones/wct-walkability-city-tool-herramienta-analisis-caminabilidad (Accessed May 27, 2016).
Fonseca, D., Sanchez-Sepulveda, M., Necchi, S., and Peña, E. (2021). Towards smart city governance. Case study: improving the interpretation of quantitative traffic measurement data through citizen participation. Sensors 21 (16), 5321. doi:10.3390/s21165321
Frolking, S., Milliman, T., Seto, K. C., and Friedl, M. A. (2013). A global fingerprint of macro-scale changes in urban structure from 1999 to 2009. Environ. Res. Lett. 8 (2), 024004. doi:10.1088/1748-9326/8/2/024004
Fusco, G. (2016). Beyond the built-up form/mobility relationship: spatial affordance and lifestyles. Comput. Environ. Urban Syst. 60 (November), 50–66. doi:10.1016/j.compenvurbsys.2016.07.011
Gabrielli, S., Forbes, P., Jylhä, A., Wells, S., Sirén, M., Hemminki, S., et al. (2014). Design challenges in motivating change for sustainable urban mobility. Comput. Hum. Behav. 41 (December), 416–423. doi:10.1016/j.chb.2014.05.026
Geertman, S., and Stillwell, J. (2020). Planning support science: developments and challenges. Environ. Plan. B Urban Anal. City Sci. 47 (8), 1326–1342. doi:10.1177/2399808320936277
Giles, L. V., Koehle, M. S., Saelens, B. E., Sbihi, H., and Carlsten, C. (2021). When physical activity meets the physical environment: precision health insights from the intersection. Environ. Health Prev. Med. 26 (1), 68. doi:10.1186/s12199-021-00990-w
Gómez-Losada, Á., Santos, F. M., Gibert, K., and Pires, J. C. M. (2019). A data science approach for spatiotemporal modelling of low and resident air pollution in Madrid (Spain): implications for epidemiological studies. Comput. Environ. Urban Syst. 75 (May), 1–11. doi:10.1016/j.compenvurbsys.2018.12.005
Grazuleviciene, R., Andrusaityte, S., Dėdelė, A., Grazulevicius, T., Valius, L., Rapalavicius, A., et al. (2021). Urban environment and health: a cross-sectional study of the influence of environmental quality and physical activity on blood pressure. Int. J. Environ. Res. Public Health 18 (11), 6126. doi:10.3390/ijerph18116126
Gu, D., Andreev, K., and Dupre, M. E. (2021). Major trends in population growth around the world. China CDC Wkly. 3 (28), 604–613. doi:10.46234/ccdcw2021.160
Guggari, S., Kadappa, V., and Umadevi, V. (2019). “Theme-based partitioning approach to decision tree: an extended experimental analysis,” in Emerging research in electronics, computer science and technology. Lecture notes in electrical engineering. Editors V. Sridhar, M. C. Padma, and K. A. Radhakrishna Rao (Singapore: Springer), 117–127. doi:10.1007/978-981-13-5802-9_11
Jardim, B., Neto, M. de C., and Barriguinha, A. (2023). A street-point method to measure the spatiotemporal relationship between walkability and pedestrian flow. Comput. Environ. Urban Syst. 104 (September), 101993. doi:10.1016/j.compenvurbsys.2023.101993
Khan, I., Hou, F., Hoang, P.Le, and Ali, S. A. (2021). Do natural resources, urbanization, and value-adding manufacturing affect environmental quality? Evidence from the top ten manufacturing countries. Resour. Policy 72 (August), 102109. doi:10.1016/j.resourpol.2021.102109
Kormos, C., Sussman, R., and Rosenberg, B. (2021). How cities can apply behavioral science to promote public transportation use. Behav. Sci. and Policy 7 (1), 95–115. doi:10.1177/237946152100700108
Krottje, I. S. (2022). How our living environment influences our perception of health (Doctoral dissertation). Master. Available at: https://frw.studenttheses.ub.rug.nl/4067/.
Kunze, A., Burkhard, R., Gebhardt, S., and Tuncer, B. (2012). Visualization and decision support tools in urban planning. Commun. Comput. Inf. Sci., 279–298. doi:10.1007/978-3-642-29758-8_15
Lausch, A., Schmidt, A., and Tischendorf, L. (2015). Data mining and linked open data – new perspectives for data analysis in environmental research. Ecological modelling. Use Ecol. Indic. models 295 (January), 5–17. doi:10.1016/j.ecolmodel.2014.09.018
Litman, T., and Burwell, D. (2006). Issues in sustainable transportation. Int. J. Glob. Environ. Issues 6 (4), 331–347. doi:10.1504/IJGENVI.2006.010889
López, I., Ortega, J., and Pardo, M. (2020). Mobility infrastructures in cities and climate change: an analysis through the superblocks in Barcelona. Atmosphere 11 (4), 410. doi:10.3390/atmos11040410
Kumar, M. (1988). World geodetic system 1984: A modern and accurate global reference frame. Mar. Geod. 12 (2), 117–126. doi:10.1080/15210608809379580
Martin, H., Wiedemann, N., Reck, D. J., and Raubal, M. (2023). Graph-based mobility profiling. Comput. Environ. Urban Syst. 100 (March), 101910. doi:10.1016/j.compenvurbsys.2022.101910
Mcardle, G., and Kitchin, R. (2016). Improving the veracity of open and real-time urban data. Built Environ. 42 (3), 457–473. doi:10.2148/benv.42.3.457
Nieuwenhuijsen, M., de Nazelle, A., Pradas, M. C., Daher, C., Dzhambov, A. M., Echave, C., et al. (2024). The superblock model: a review of an innovative urban model for sustainability, liveability, health and well-being. Environ. Res. 251 (June), 118550. doi:10.1016/j.envres.2024.118550
Open Data BCN (2023). Servei de Dades Obertes de l’Ajuntament de Barcelona. Available at: https://opendata-ajuntament.barcelona.cat/.
Palmer, J. (2024). La población de Barcelona crece por segundo año consecutivo y se sitúa en 1,7 millones de habitantes. Available at: https://www.elnacional.cat/es/barcelona/poblacion-barcelona-crece-por-segundo-ano-consecutivo-se-situa-en-17-millones-habitantes_1226724_102.html.
Phillis, Y. A., Kouikoglou, V. S., and Verdugo, C. (2017). Urban sustainability assessment and ranking of cities. Comput. Environ. Urban Syst. 64 (July), 254–265. doi:10.1016/j.compenvurbsys.2017.03.002
Piccinini, E., Flores, C. K., Vieira, D., and Kolbe, L. 2016. The future of personal urban mobility – towards digital transformation.
Plan de Movilidad Urbana (2024). Plan de Movilidad Urbana 2024 | Movilidad y transportes | Ayuntamiento de Barcelona. Available at: https://www.barcelona.cat/mobilitat/es/quienes-somos/plan-de-movilidad-urbana.
Pontes, F. J., Amorim, G. F., Balestrassi, P. P., Paiva, A. P., and Ferreira, J. R. (2016). Design of experiments and focused grid search for neural network parameter optimization. Neurocomputing 186 (April), 22–34. doi:10.1016/j.neucom.2015.12.061
Ravazzoli, E., and Torricelli, G. P. (2017). Urban mobility and public space. A challenge for the sustainable liveable city of the future. J. Public Space 2 (2), 37–50. doi:10.5204/jps.v2i2.91
Rhoads, D., Rames, C., Solé-Ribalta, A., González, M. C., Szell, M., and Borge-Holthoefer, J. (2023). Sidewalk networks: review and outlook. Comput. Environ. Urban Syst. 106 (December), 102031. doi:10.1016/j.compenvurbsys.2023.102031
Rhoads, D., Solé-Ribalta, A., and Borge-Holthoefer, J. (2023). The inclusive 15-minute city: walkability analysis with sidewalk networks. Comput. Environ. Urban Syst. 100 (March), 101936. doi:10.1016/j.compenvurbsys.2022.101936
Rodríguez, P., Bautista, M. A., Gonzàlez, J., and Escalera, S. (2018). Beyond one-hot encoding: lower dimensional target embedding. Image Vis. Comput. 75 (July), 21–31. doi:10.1016/j.imavis.2018.04.004
Saelens, B. E., Sallis, J. F., and Frank, L. D. (2003). Environmental correlates of walking and cycling: findings from the transportation, urban design, and planning literature. Ann. Behav. Med. 25 (2), 80–91. doi:10.1207/S15324796ABM2502_03
Sanchez-Sepulveda, M. V., Fonseca Escudero, D., Navarro, J., and Amo-Filva, D. (2023). “Towards accessible, sustainable and healthy mobility: the city of Barcelona as case study,” in Learning and collaboration technologies (Cham: Springer), 91–104. doi:10.1007/978-3-031-34411-4_8
Seger, C. (2018). An investigation of categorical variable encoding techniques in machine learning: binary versus one-hot and feature hashing (Dissertation). Available at: https://urn.kb.se/resolve?urn=urn:nbn:se:kth:diva-237426 (Accessed March 13, 2013).
Shammas, Al, Pedro Gullón, T., Klein, O., and Francisco, E. (2023). Development of a GIS-based walking route planner with integrated comfort walkability parameters. Comput. Environ. Urban Syst. 103 (July), 101981. doi:10.1016/j.compenvurbsys.2023.101981
Sola, A. (2020) “HACIA UNA CIUDAD MÁS HUMANA. Calles Pacificadas, Más Vida de Barrio,” in El Periódico, 2020.
Soriano-Gonzalez, R., Perez-Bernabeu, E., Ahsini, Y., Carracedo, P., Camacho, A., and Juan, A. A. (2023). Analyzing key performance indicators for mobility logistics in smart and sustainable cities: a case study centered on Barcelona. Logistics 7 (4), 75. doi:10.3390/logistics7040075
Tonne, C., Adair, L., Adlakha, D., Anguelovski, I., Belesova, K., Berger, M., et al. (2021). Defining pathways to healthy sustainable urban development. Environ. Int. 146 (January), 106236. doi:10.1016/j.envint.2020.106236
Triguero, I., García-Gil, D., Maillo, J., Luengo, J., García, S., and Herrera, F. (2019). Transforming big data into smart data: an insight on the use of the k-nearest neighbors algorithm to obtain quality data. WIREs Data Min. Knowl. Discov. 9 (2), e1289. doi:10.1002/widm.1289
Turoń, K., Czech, P., and Juzek, M. (2017). The concept of a walkable city as an alternative form of urban mobility. Sci. J. Silesian Univ. Technol. Ser. Transp. 95 (June), 223–230. doi:10.20858/sjsutst.2017.95.20
Walkability and Cyclability - Barcelona (2023). Tableau public. Available at: https://public.tableau.com/app/profile/felipe.ant.nez/viz/WalkabilityandCyclability-Barcelona/CyclabilityBarcelona.
Weymouth, R., and Hartz-Karp, J. (2018). Principles for integrating the implementation of the sustainable development goals in cities. Urban Sci. 2 (3), 77. doi:10.3390/urbansci2030077
Keywords: data science, mobility, urban planning, geographic information systems, Barcelona
Citation: Sanchez-Sepulveda MV, Navarro J, Amo-Filva D, Fonseca D, Antúnez-Anea F and Barranco-Albalat A (2024) A data-driven approach to enhance urban infrastructure for sustainable mobility and improved quality of life in highly populated cities. Case study: Barcelona. Front. Built Environ. 10:1439700. doi: 10.3389/fbuil.2024.1439700
Received: 28 May 2024; Accepted: 23 August 2024;
Published: 05 September 2024.
Edited by:
Jiazhen Zhang, University of Mons, BelgiumReviewed by:
Timothy Beatley, University of Virginia, United StatesGeorge Karani, Cardiff Metropolitan University, United Kingdom
Copyright © 2024 Sanchez-Sepulveda, Navarro, Amo-Filva, Fonseca, Antúnez-Anea and Barranco-Albalat. This is an open-access article distributed under the terms of the Creative Commons Attribution License (CC BY). The use, distribution or reproduction in other forums is permitted, provided the original author(s) and the copyright owner(s) are credited and that the original publication in this journal is cited, in accordance with accepted academic practice. No use, distribution or reproduction is permitted which does not comply with these terms.
*Correspondence: Monica V. Sanchez-Sepulveda, bW9uaWNhLnNhbmNoZXpAc2FsbGV1cmwuZWR1