 Carlos Quishpe-Otacoma1
 Ken Tello-Ayala
 Christian Málaga-Chuquitaype
 Natividad García-Troncoso
- 1Escuela Superior Politécnica del Litoral, ESPOL, Facultad de Ingeniería en Ciencias de la Tierra, Guayaquil, Ecuador
- 2Department of Civil and Environmental Engineering, Imperial College London, London, United Kingdom
- 3Center of Nanotechnology Research and Development (CIDNA), Escuela Superior Politécnica del Litoral (ESPOL), Campus Gustavo Galindo, Guayaquil, Ecuador
This paper examines the influence of connection detailing on the cyclic behavior of steel-concrete shear walls. To this end, experimental and numerical studies are conducted on two steel-concrete walls with identical flexural-compression diagrams but different construction methods and connection detailing. The first wall is characterized by transverse reinforcement anchored in the concrete columns along with connectors welded to the steel elements. In contrast, the second specimen incorporates transverse reinforcement directly welded to the columns and uses double the number of connectors used in the first specimen. The experimental set-up, material characteristics and construction details are described first. This is followed by a detailed account of the experimental results and observations. The experimental results are complemented with advanced Finite Element (FE) simulations to gain insight and understanding on the behavior of steel-concrete shear walls. The data presented in this paper provides valuable information for the development of mixed steel-concrete walls. A number of design improvements and practical implications are drawn from the results. It is demonstrated that the use of straight connectors between edge columns and the reinforced concrete core significantly reduces joint cracking compared to curved connectors.
1 Introduction
Shear walls are extremely popular as part of the lateral load resisting system in earthquake prone regions. In this regard, they are essential to provide buildings with enough lateral load-carrying capacity, stiffness and ductility protect the lives of their occupants in the face of these catastrophic events. In this context, mid-to high-rise buildings are of special relevance because, given their weight and size, they must withstand large lateral forces that can drive their response well into the nonlinear range. In addition, shear walls are often preferred over moment resisting frames since they can achieve important lateral stiffness, hence ensuring that maximum admissible drift limits are satisfied.
There is a wide variety of shear wall types. Besides traditional reinforced concrete walls, which have been extensively studied and regulated (Sosa et al., 2017; Wallace and Moehle, 1992; Park et al., 1987; Thomsen and Wallace, 2004), there are also Concrete-filled Composite Plate Shear Walls (CCPSW), which are composed of structural steel columns and edge beams, along with metal plates that provide stiffness to the wall and serve as formwork for the reinforced concrete core. Their main advantage is their high strength and cost reduction (Wright et al., 1991; Yan et al., 2021; Yan et al., 2016).
A type of wall that is increasing in use in recent years is composed of Concrete-Filled Steel Tube (CFST) columns and structural steel beams that function as edge elements for reinforced concrete core walls (Quishpe, 2015). These walls are usually referred to as composite walls and they are the focus of this study. Several investigations have been conducted on various configurations of CFST (Qian et al., 2012; Zhou et al., 2020; Ren et al., 2018), they have shown that walls with metal columns at their ends exhibit a considerable improvement in energy dissipation capacity and an increase in stiffness and ductility relative to their counterparts without metal boundary elements. These key characteristics have motivated the use of CFST in medium to high-rise buildings and have led to extensive research on different connection configurations and joining methods.
Zhou et al. (Zhou et al., 2020) considered the use of prefabricated concrete coated with high-strength concrete and CFST columns at their ends. They subjected several specimens to quasi-static reverse cyclic loading to study the connection, out-of-plane loading, and axial loading. Their results showed that this type of wall exhibits good integrity against extreme events. Even the specimens that endured large load eccentricities demonstrated favorable performance thanks to the synergistic response of the steel columns filled with high-strength concrete. Fengming et al. (Ren et al., 2018) studied shear walls with a reinforced concrete (RC) core and two square steel columns filled with concrete (CFST), but they incorporated carbon fiber reinforced polymer (CFRP) in the concrete core. The response of this specimen was compared to conventional RC shear walls and shear walls made solely with CFST. The results showed a superior load capacity, reaching levels similar to double-skin CFST shear walls, but with better ductility and energy dissipation. Bai et al. (Bai et al., 2019) analyzed low aspect ratio shear walls, where CFST columns are incorporated within the RC core. This resulted in an improvement in shear behavior, transforming the wall into a system of walls with vertical slots, preventing recurring failures due to brittle shear and improving existing deformation.
It is clear from the previous studies that the incorporation of metal columns not only enhances the seismic performance of shear walls but also provides significant connectivity advantages since the connection between the steel beam and column is more reliable and easier to construct than its alternatives. Accordingly, this system offers faster construction compared to conventional RC shear walls. This is due to the simultaneous construction of the steel frame and the RC core, which reduces fabrication time. Moreover, in this type of walls the boundary steel frames prevent the development of conventional cracks in the RC core.
Liao et al. (2012) analyzed the behavior of high-strength concrete (HCR) shear walls using reinforced concrete (RC) columns at the edges and compared it with the behavior of columns reinforced with steel fiber-reinforced concrete (SRC). They employed a finite element (FE) model and subjected it to axial and lateral loads. For the SRC wall, they used a portal boundary frame consisting of I-shaped beams and columns, with welding used for the connections. Their results showed that the deformations met the Chinese regulations and represented a viable option for areas with high seismic hazards. SRC columns provided greater resistance against overturning moments, while the RC core contributed more towards the shear resistance. The aspect ratio of the wall (height-to-width ratio) directly influenced the lateral load capacity of the wall. A lower aspect ratio resulted in a higher lateral load capacity and improved ductility. These findings were validated through experimental analysis to ensure the reliability of their numerical model.
By comparison with studies on the overall behavior of hybrid walls, only a few studies have been conducted regarding the connection between the reinforced concrete web and the steel edge elements. For instance, Dan et al. (2011) evaluated the arrangement and type of steel sections, but with only one type of connection, namely, employing steel bolts. Saari et al. (2004) analyzed the behavior of shear stud connectors in composite shear walls in order to determine how the structural behavior of a RC wall differs from a wall with steel edge columns. An experimental study was designed to quantify the strength and deformations of the studs. It was found that providing confinement to the studs increased their load capacity and decreased their deformation. If this confinement was not provided, the wall would develop an unsatisfactory behavior at the joint.
The objective of this research is to determine the structural behavior of composite walls consisting of columns and flanges constructed with metallic elements and a concrete core. Additionally, to analyze the influence of the type and spacing of the connection between the metallic edge elements and the core, considering four types of connections, and two types of connections between the wall and the foundation as described in Section 2.1.
2 Experimental program
2.1 Design experimental specimens
In this study, the analysis of two shear walls will be carried out: 1) in the first one (Wall 1), the transverse and longitudinal steel reinforcement of the web will be anchored to the structural steel edge columns and no welding is used, conversely 2) the second wall (Wall 2) differs from Wall 1 since the joints between the transverse and longitudinal reinforcement of the web and the structural steel edge elements are welded. Both walls have been designed to have the same flexural-compression diagram, shown below in Figure 1. The ‘nominal’ graphs used the nominal design strength of the materials (concrete f´c = 280 kg/cm2, rebars fy = 4,200 kg/cm2, steel A36 fy = 2,531 kg/cm2), while the curves named ‘tested’ were obtained by using the real experimentally obtained strength values. “Mn” is the bending moment, while “Pn” represents the axial force. ∅ represents the capacity reduction factor. Calculated with Eq. 1.
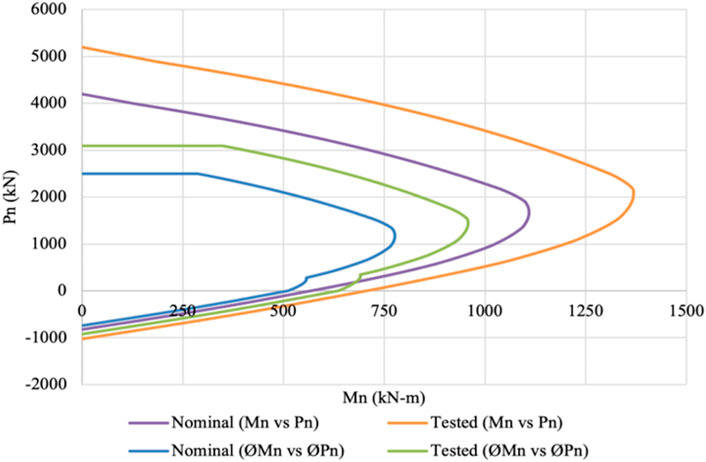
Figure 1. Design flexo-compression Diagram of both shear walls.
Section 2.2 describes the properties, tests and experimentally obtained strengths. The capacity reduction factor was calculated with Eq. 1 described in ACI 318–19:
where,
Shear Wall 1 consists of a structure formed by a reinforced concrete web confined by reinforced concrete columns with a cross section of 0.20 × 0.15 m and a reinforcement of 4 8-mm ASTM A 615 corrugated rods. In addition, the wall has 150 × 150 × 2mm steel edge columns and a 300 × 150 × 2mm steel edge beam. The wall is 1.20 m wide, 4.20 m tall, and 0.15 m thick.
Figure 2A shows a schematic diagram of the elements of Wall 1. As shown in this figure, the reinforcing steel bars of the core pass through the columns and edge beam and are anchored into the concrete embedded within these steel elements. To enhance the connection between the two elements, the reinforcement steel is bent into a vertical hook within the edge elements.
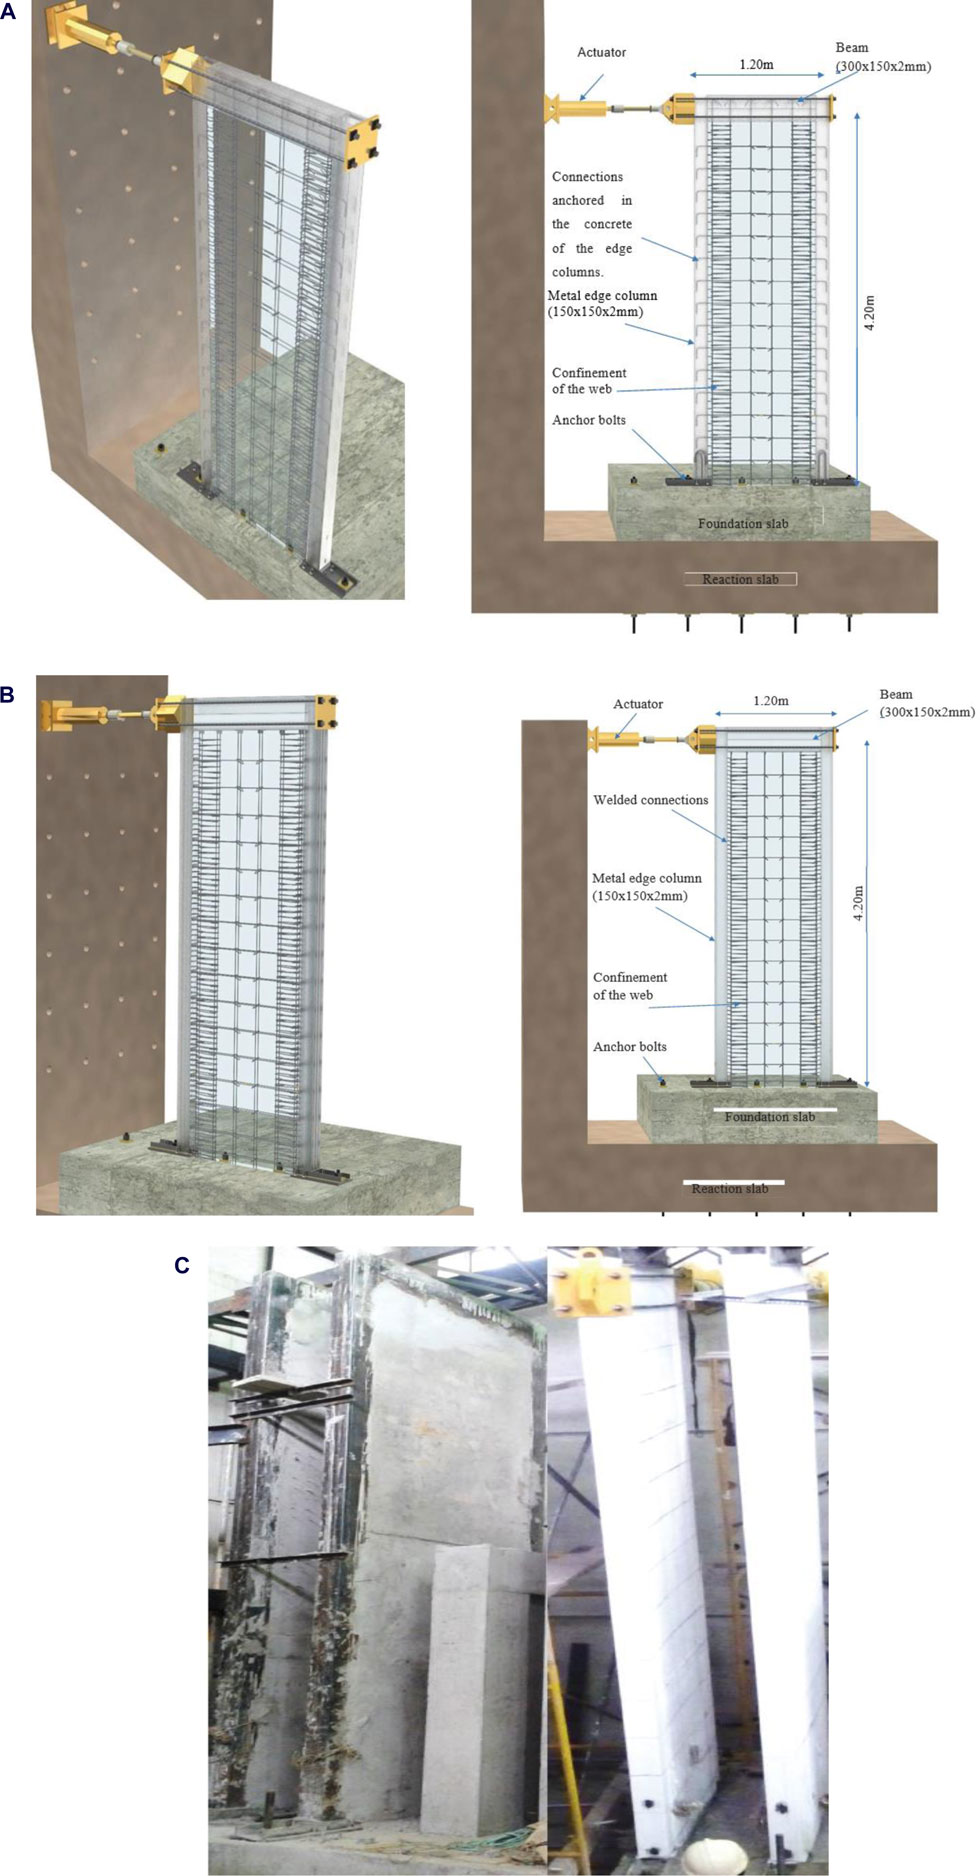
Figure 2. (A) Shear Wall 1 (B) Shear Wall 2, (C) Experimental setup.
Shear Wall 2 and its components are show in Figure 2B. In this case, the reinforcing steel bars of the core are connected to the edge elements through welding using E−7018 electrodes. The cross-sections of the edge elements are the same as Wall 1. Both walls have the same overall global dimensions. Figure 2C shows the experimental setup.
Both walls are reinforced with transverse and longitudinal reinforcement 8-mm bars spaced at 250 mm intervals. This spacing was determined in accordance with capacity design principles so as to provide greater shear strength than the corresponding flexural strength. Regarding the wall heads, it was ensured that the required compressive stress was less than 20% of the compressive strength of the concrete. This is determined using Eq. 2.
where
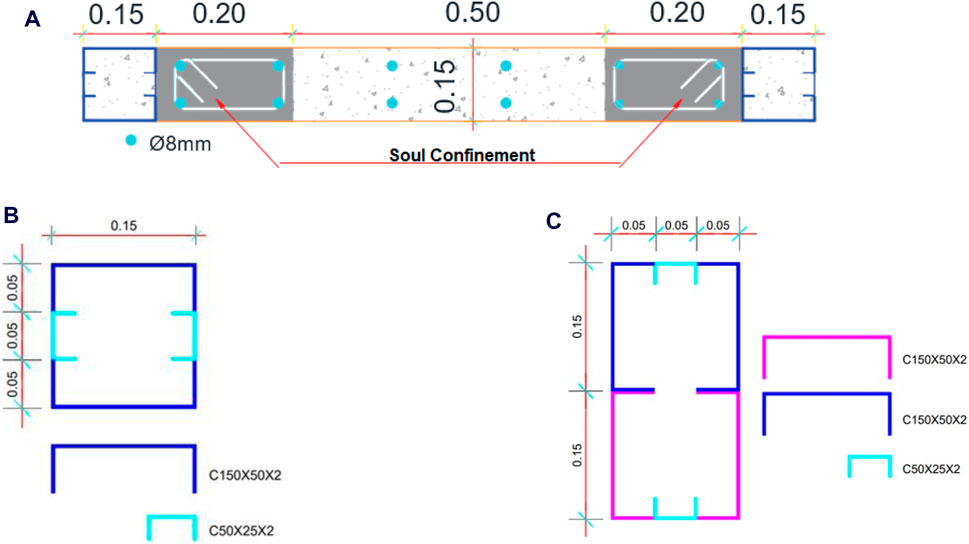
Figure 3. (A) Cross section of walls 1 and 2, (B) edge columns section, (C) edge beam section.
The cracking moment and lateral load were calculated to identify the appearance of the initial cracks in the experiment. The following equation was used for this purpose:
where the t factor takes values between 2 and 4, as presented in Table 1, while
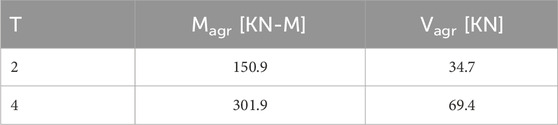
Table 1. Cracking actions (moment and shear).
The foundation (where the walls are anchored) consisted of a 2.80 m by 2.80 m reinforced concrete slab of a thickness of 0.60 m. The edge columns were anchored to the foundation by means of anchor plates and rods. Figure 4A shows a diagram of the elements that make up the mechanical anchorage between the edge columns of Wall 1 and the foundation slab. This anchorage consists of 6Ø18mm, 4Ø22 mm and a 30 mm diameter anchor bolt that is fixed through nuts to the plate at the base.
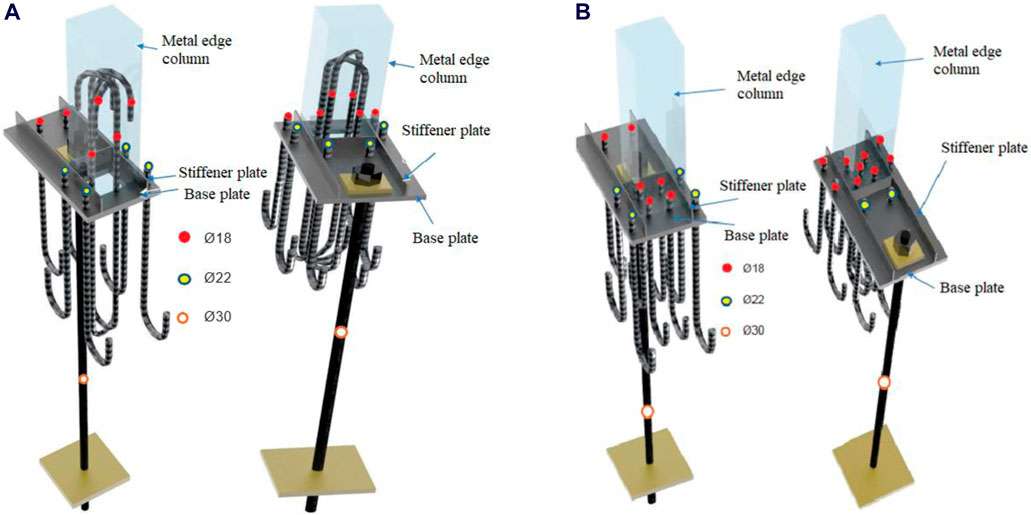
Figure 4. Anchoring of edge columns: (A) Shear Wall 1, (B) Shear Wall 2.
Wall 2 has a similar anchorage to Wall 1, with the difference that the rods are not anchored by means of a hook at the top to the edge column. In this case they are only anchored to the base plate by welding. A schematic representation of this is shown in Figure 4B. Shear connectors were placed between the edge columns and the reinforced concrete web so that both elements work together under the imposed loads. Figure 5 shows the shape and arrangement of shear connectors in each of the wall types.

Figure 5. Stud connectors: (A) Shear Wall 1, (B) Shear Wall 2.
It can be appreciated from Figure 5 that both walls have different arrangement of connectors to their left and right edge columns. In both walls, the connection with the left edge column has “U" type shear connectors, with the rod going through and being welded to the column. Conversely, in the right columns, “I" type connectors were used. This was done to analyze the influence that the shape of the connector has on the ultimate response of the walls. As shown in Figure 5A (Wall 1), the reinforcing steel of the wall web passes through the steel column and is anchored to the concrete by means of a hook, while in 5(b) (Wall 2) the reinforcing steel is connected by welding and a metal backing angle. Wall 2 has twice as many shear connectors as Wall 1.
2.2 Material properties
For the reinforcing steel used in the core of the shear walls 8-mm ASTM A7615 grade 60 bars with a yield stress fy = 420 MPa were used. The concrete was manufactured in situ with a compressive strength of 20 MPa. The metal edge columns were fabricated with cold-formed profiles ASTM A36 with a fy = 250 MPa.
Tests were carried out on 6 specimens of 8 mm diameter reinforcing steel rods corresponding to the web of the shear wall to determine their mechanical properties such as tensile strength and stiffness. SMAW type arc welding with coated electrode was used with a direct overlapping partial penetration type joint. Two specimens were used as control samples, two were welded using E7018 electrodes and the last two using E9018 electrodes. The results of this material characterization are reported in Table 2 while Figure 6A presents a selection of representative stress-strain relationships. Similarly, the sections used for the edge elements of the shear walls were tested in tension. The stress-strain graph obtained from this are shown in Figure 6B. Besides, three concrete cylinders used in the casting of the shear walls were tested to obtain their compressive strength. The results obtained are shown in Table 3.
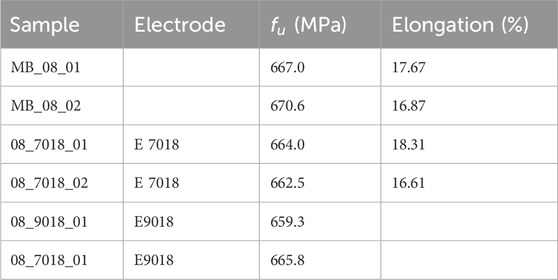
Table 2. Mean Material properties of steel rebar.
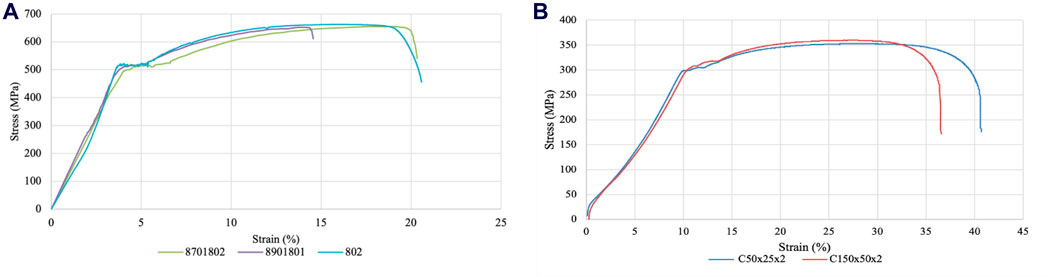
Figure 6. Stress strain graph: (A) reinforcing steel Ø8 mm, (B) edge elements.
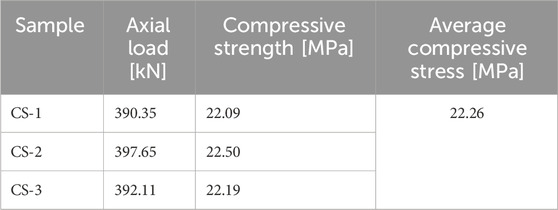
Table 3. Concrete sample compressive strength.
2.3 Testing methodology
The walls were tested using an actuator with a maximum lateral thrust capacity of 200 kN. The test method involves the application of cyclic horizontal loads of quasi-static nature. All specimens were subjected to cyclically increasing lateral loads starting from left to right in the same plane as the load frame. The shear walls are anchored to the reaction floor as illustrated in Figure 2.
The overall load-displacement relationships were obtained from the load-cell and transducer incorporated within the actuator. Besides, to measure the existing deformations in the structural steel, strain gauges of Tokyo Sokki Kenkyujo Co. Ltd. brand were attached. The specifications are shown in Table 4. To this end, both walls have 10 strain gauges located as shown in Figure 7.
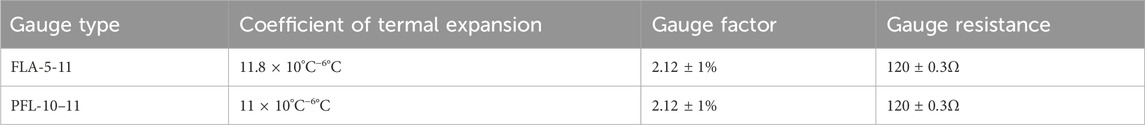
Table 4. Technical specifications of strain gauges. (Ltd. Tokyo Sokki Kenkyujo Co., 2024 n.d.).
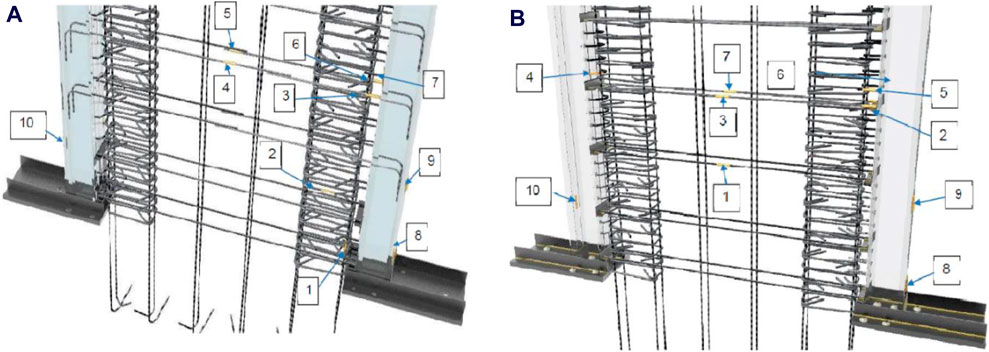
Figure 7. Strain gauges: (A) Shear wall type 1, (B) Shear wall type 2. The numbers in the figure show the position of LVDTs.
Figure 8 show the experimental load cycle history of the first and second wall. They are different because the operation of the actuator is manual. The loading cycle used complies with the JGJ 101–96 standard, considering a displacement-controlled analysis. Δy represents the displacement at the yield point of the wall, while Δ represents the measured displacement.
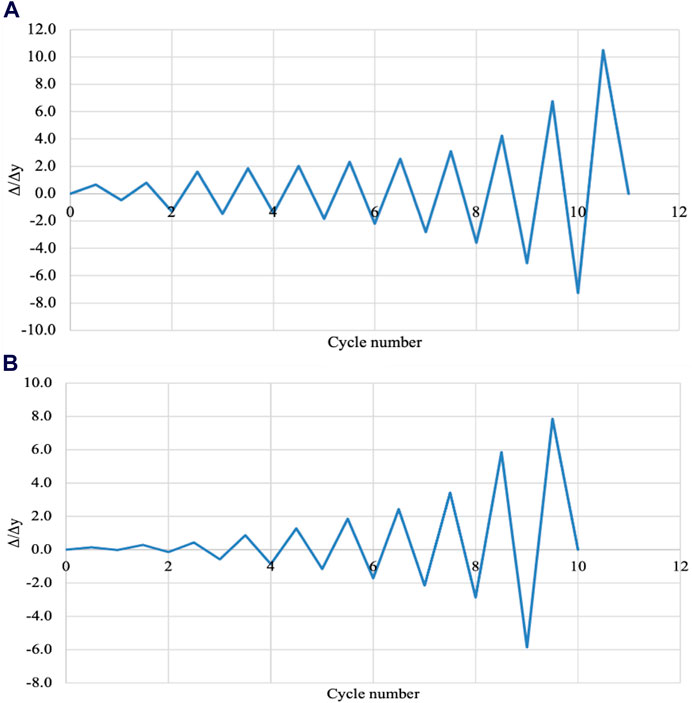
Figure 8. Load cycle history applied to: (A) Wall 1, (B) Wall 2.
3 Results and analysis
As mentioned above, the design of the walls under consideration implies a higher shear capacity relative to their flexural capacity. Hence, the walls were expected to fail in bending. In the case of Wall 1, the edge columns experienced local buckling at the base and subsequently low-cycle fatigue and element failure at which point its axial load carrying capacity was lost. Figure 9A shows the structural low-cycle fatigue fracture of the left column, which was more affected by the lack of concrete at the base. Given the height of 4.35 m coupled with space congestion of the reinforcing steel used for the anchorage between the foundation and the wall, some segregation was evident as shown in Figure 9C. Both edge columns had stiffening plates placed on the flanges, but local bending and buckling was observed in the web of the columns, since they did not have stiffening elements, as shown in Figure 9B.
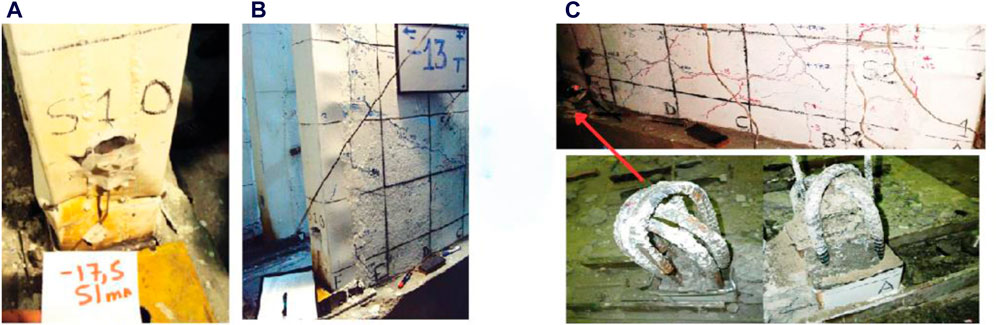
Figure 9. Structural fatigue in Wall 1: (A) buckling of left edge column, (B) local buckling in the web of the columns, (C) failure of the connection between edge columns and foundation.
Wall 2 did not present any concrete segregation problems within the metal edge columns. In this case, the failure mechanisms at the base were due to tensile action, as shown in Figure 10.
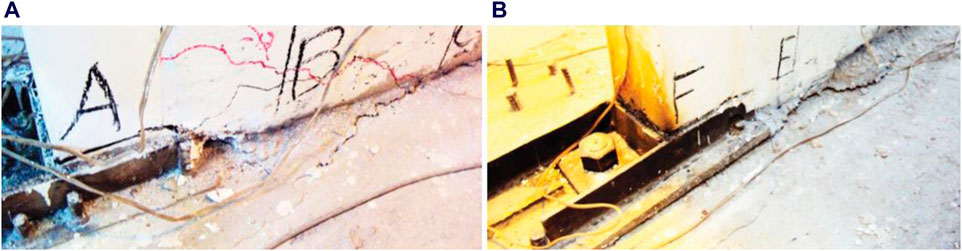
Figure 10. Structural fatigue in Wall 2: left edge column (A), right edge column (B).
Figure 11 shows the predominant cracks at the base of both walls, (a) shows the cracking in Wall 1, which occurs above the base, while in the case of Wall 2 shown in Figure 11B cracking develops between the wall and the foundation. The gray elements represent the edge columns of the walls.
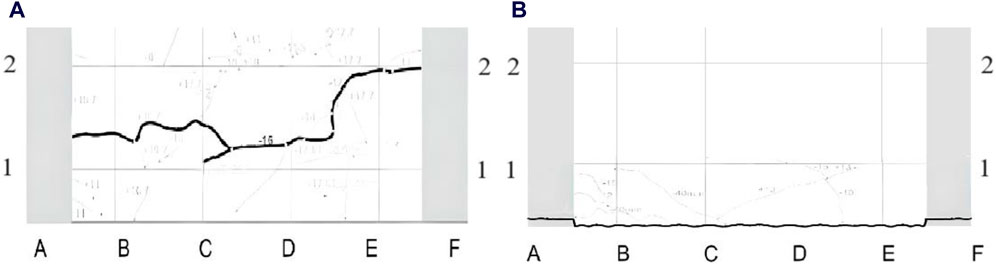
Figure 11. Predominant cracks: Wall 1 (A), Wall 2 (B).
Figure 12 shows the hysteresis of both shear walls considering LVDT 1. The position of the LVDTs was shown in Figure 13. As can be seen, both walls have very similar resistances; however, Wall 1 shows greater deformation with respect to Wall 2. Their peak loads are 135.24 kN and 172.48 kN, respectively, which are consistent with the flexo-compression diagram calculated before.
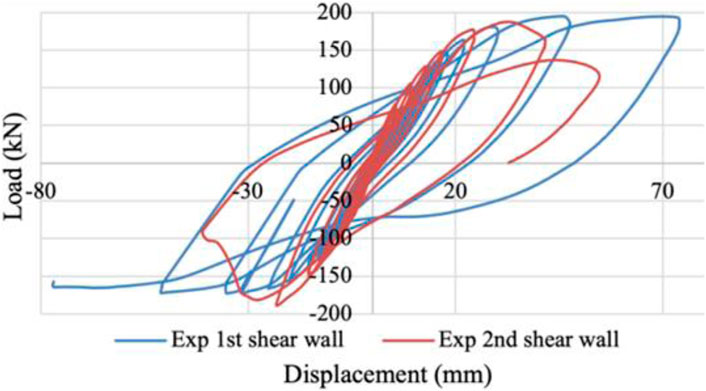
Figure 12. Hysteresis of first shear wall and second shear wall.
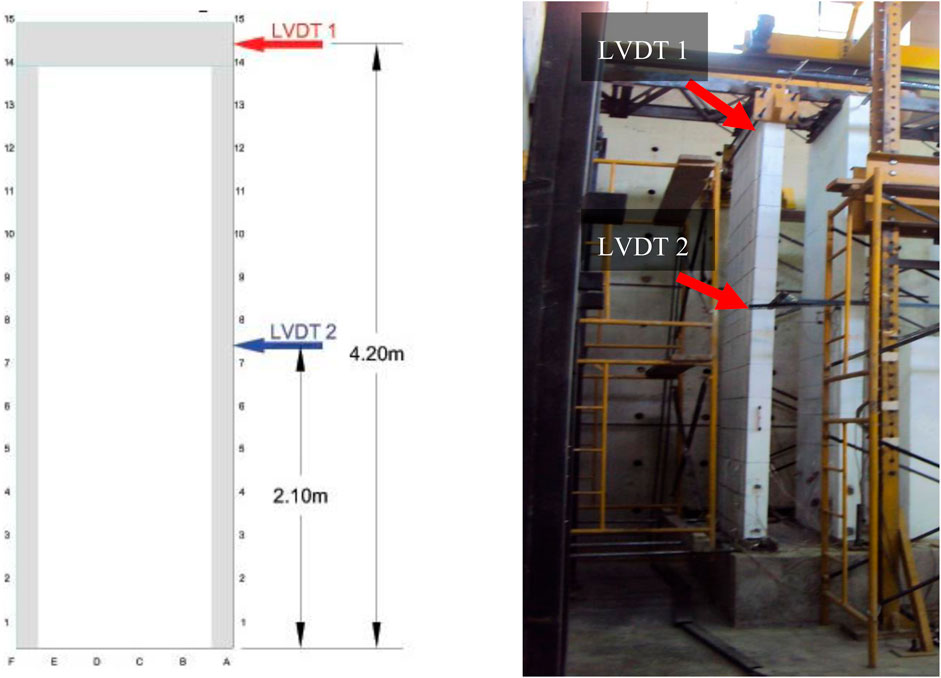
Figure 13. Position of the LVDTs.
Similar behavior is observed in the linear range showing equal displacement, while in the nonlinear range the behavior of the edge columns of wall 1 produces greater deformation under the imposed cyclic loads. Table 5 shows the maximum and minimum values of load and deformation at the top of the wall.
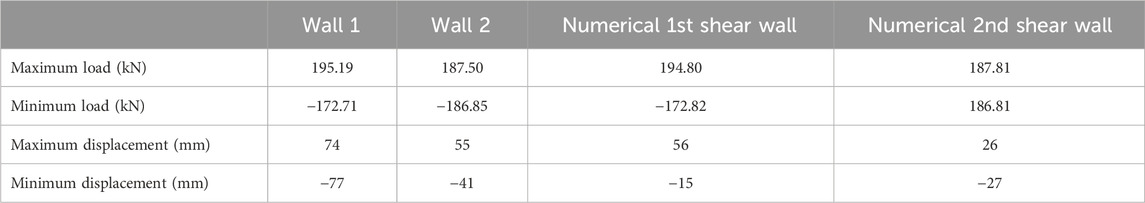
Table 5. Maximum load and displacement in experimental and numerical model.
The hysteretic relationship of Wall 1 is notoriously asymmetric with a variation between positive and negative loading since the negative loading caused the failure at the base of the edge column due to compression. While in Wall 2 a more symmetric behavior is observed. Although Wall 1 experienced a compressive failure at its top, it withstood a higher load compared to Wall 2, which failed at the base of the head due to tension. This phenomenon can be explained by the presence of reinforcing bars passing through the anchor plates. Despite not having an adequate development length to ensure optimum bond to the concrete, these reinforcing bars contributed to the increase in the flexural strength of the first wall.
Regarding the connections between the metallic edge elements and the reinforced concrete web of the shear wall, Figure 14 shows the cracks at the edge between the metallic elements and the reinforced concrete web. As can be seen from this figure, in Wall 1 the curved connectors show cracking up to +137 kN compared to the straight connectors that only reach −108 kN. In general, there is no great difference between the number or thickness of the cracks. While in Wall 2 a smaller number of cracks is observed with respect to Wall 1, this is due to the fact that they have twice as many connectors, which has allowed eliminating the cracking at the edges.
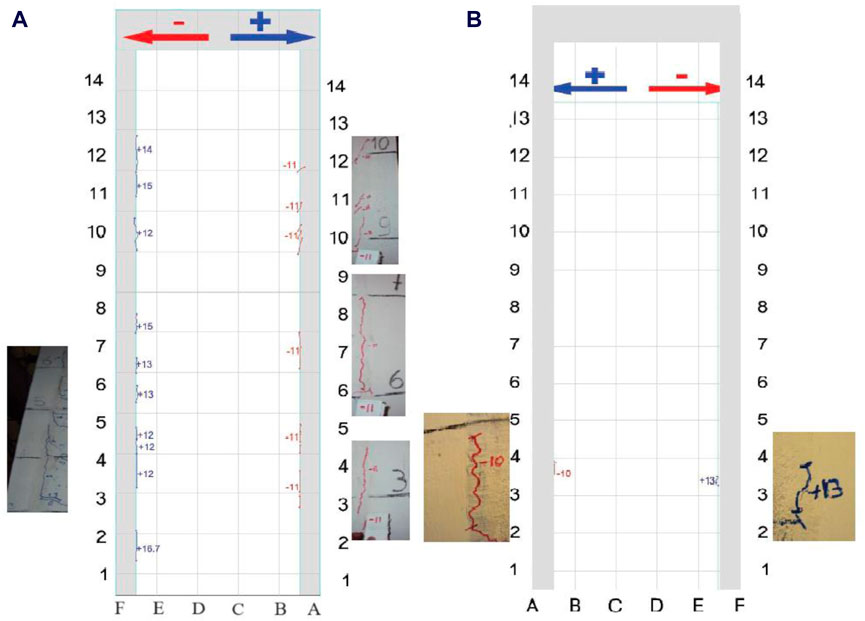
Figure 14. Cracks between the metal edge columns and the reinforced concrete core: Wall 1 (A), Wall 2 (B).
Figure 15 shows the cracks in the web of the shear walls. The cracks in blue correspond to those produced by the positive load, while those in red correspond to the negative load. Figure 15A shows the initial cracks, these were predicted by the cracking moment calculation, which determined that the first cracks would occur between 34 kN and 68 kN, while experimentally the first cracks were observed at 49 kN and 58.8 kN in wall type 1 and type 2 consecutively. (b), and (c) shows the cracks present in first and second wall respectively after the entire test was concluded. In wall 1, cracks were observed with inclinations up to 55°, predominantly between 22° and 37°, while in wall 2 the maximum inclinations were up to 53°.
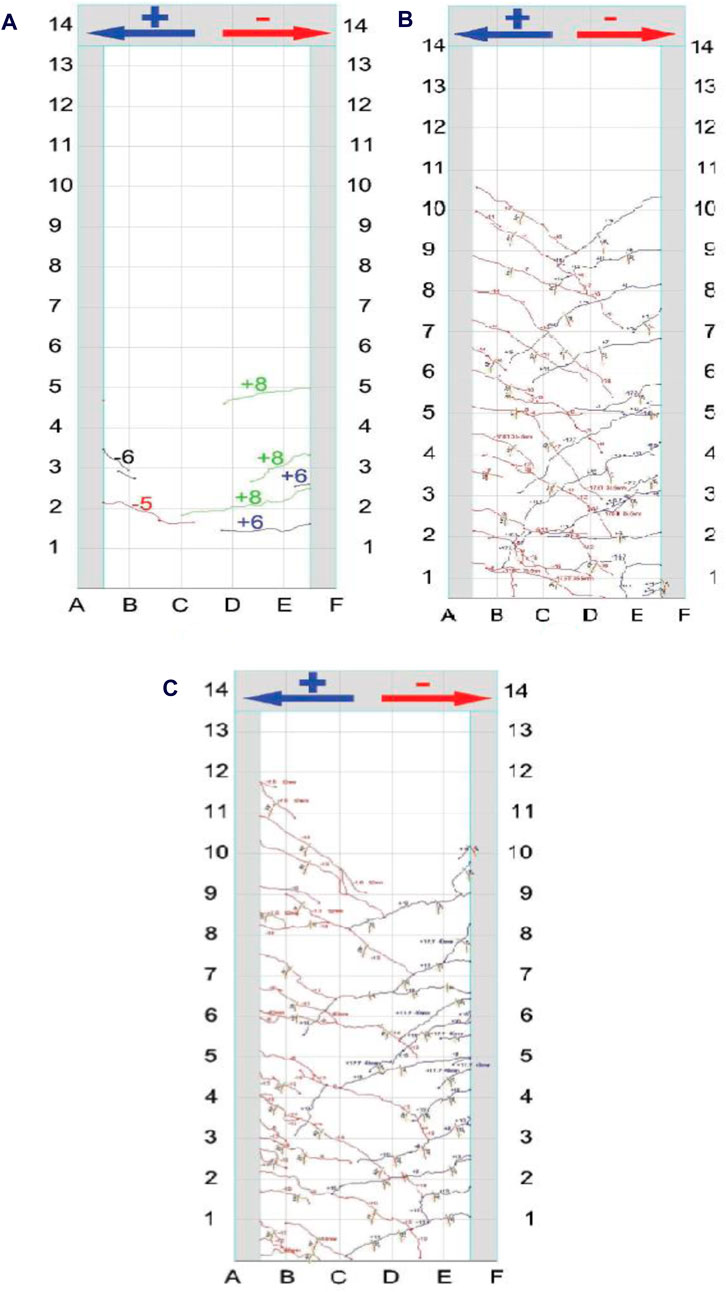
Figure 15. Cracks in the reinforced concrete web: Initial cracks in both walls (A), final cracks in first wall (B), second wall (C).
Figure 16 shows the location of strain gauges that will be used to make comparisons between the two walls. In the case of (a) and (b) the deformation in the reinforcing steel connecting the foundation to the metal edge columns was measured, (c) and (d) analyze the horizontal steel located in the concrete core web, and finally (e) and (f) analyze the behavior of the reinforcing steel connection by means of rods that pass through the metal column and are attached with a hook at 90° to the internal concrete of the column and rods that are welded to the column, and stiffened by an angle.
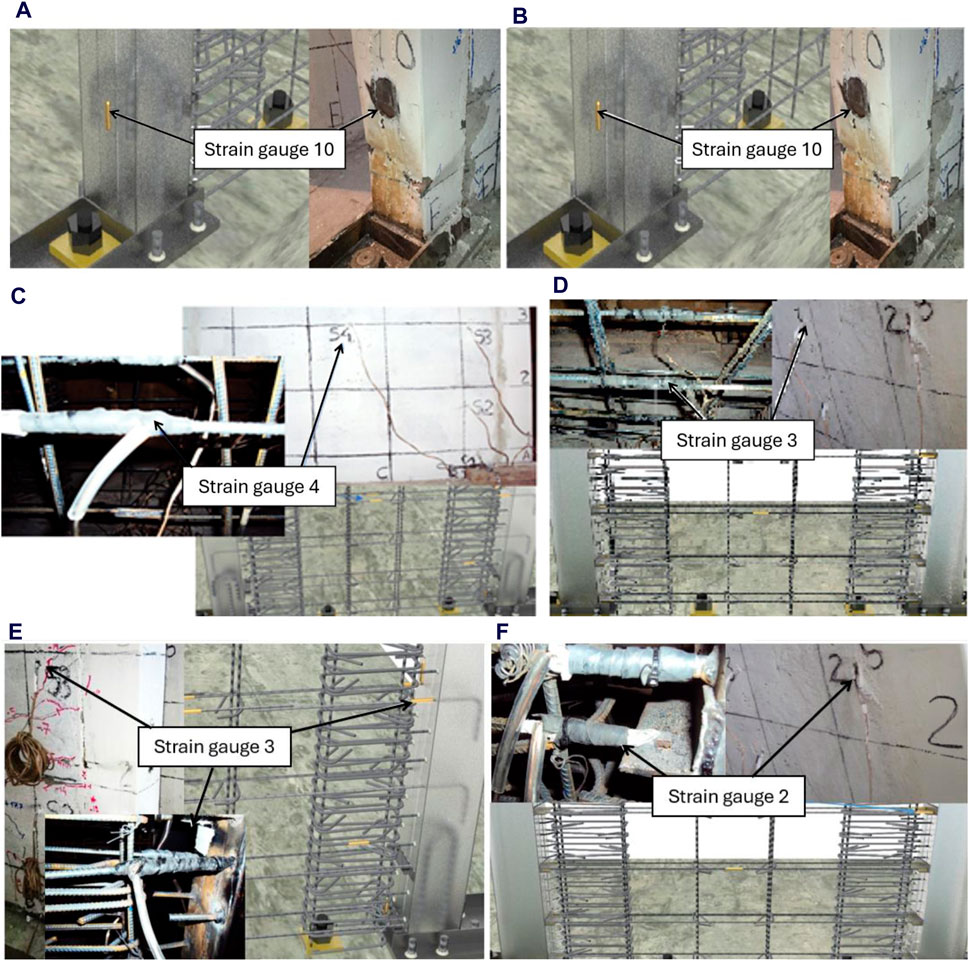
Figure 16. Strain gauge location: in first wall (A) gauge 10, (C) gauge 4, (E) gauge 3, in second wall (B) gauge 10, (D) gauge 3, (F) gauge two.
Figure 17A shows the displacement of the reinforcing steel connecting the foundation to the shear wall with respect to the load used. For this case, a very similar behavior is observed in the longitudinal steels of both walls obtaining similar displacements. In both cases the reinforcing steel has an almost linear behavior, where the reinforcing steel is passing the elastic limit.

Figure 17. Load vs. displacement: (A) first wall strain gauge 10 vs. second wall strain gauge 10, (B) first wall strain gauge 4 vs. second wall strain gauge 3, (C) first wall strain gauge 3 vs. second wall strain gauge two.
Figures 17B, C analyze the behavior of the horizontal reinforcing steel. In both positions, the reinforcing steel does not reach the yield stress. This is because the heads and the web work together, and the test presents a maximum load of 196 kN. While the shear strength of the wall is 399.35 kN.
The displacements of strain gauges 2 and 3 of the second wall show less deformation than 3 and 4 of wall 1. This is because it is welded at the edge elements and stiffened by an angle as illustrated in Figure 16.
4 Numerical analysis
4.1 Design of numerical modeling
Numerical modeling was undertaken with the help of SeismoStruct (Seismosoft, 2022), a finite element (FEM) software used to simulate the hysteretic response of the shear walls under lateral cyclic loading. The same material properties described in section 2.2 were used. The bilinear model was used for steel with an Fy = 420MPa, and the nonlinear model of Mander considering an f’c = 18 MPa was used for concrete. Inelastic force-based portal frame elements - infrmFB–were used, which enables the representation of spatial portal frame members considering both geometric and material nonlinearities. This methodology is used in order to achieve a more accurate and realistic modeling of such structural elements. A schematic of the numerical model used is shown in Figure 18.
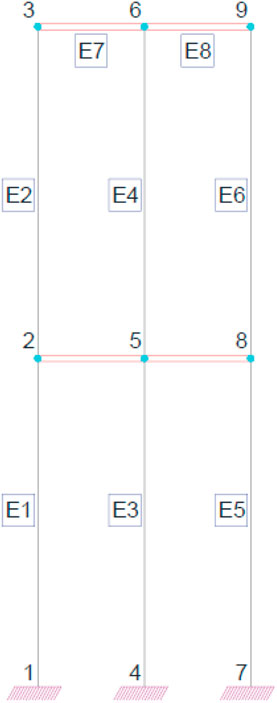
Figure 18. Nodes and elements of the mathematical model.
E1, E2, E5, E6, E7, E8 represent the concrete-filled steel columns and beams that function as shear wall edge elements. E3, E4 correspond to the reinforced concrete web The concrete elements were modeled considering the nonlinear Mander model shown in Figure 19. To predict the dynamic behavior of the structure, the load-time curve described in Section 2.3 was employed.
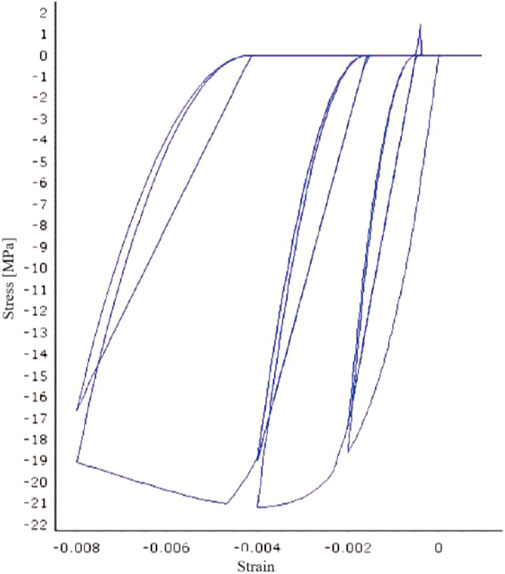
Figure 19. Nonlinear Mander model.
4.2 Hysteresis numerical curve
Figure 20 shows a comparison of the numerical and experimental load versus displacement envelopes. The blue lines represent the experimental results, and the red lines represent the numerical results. A relatively good match is observed. In particular, the capacity and stiffness are reasonably well predicted.
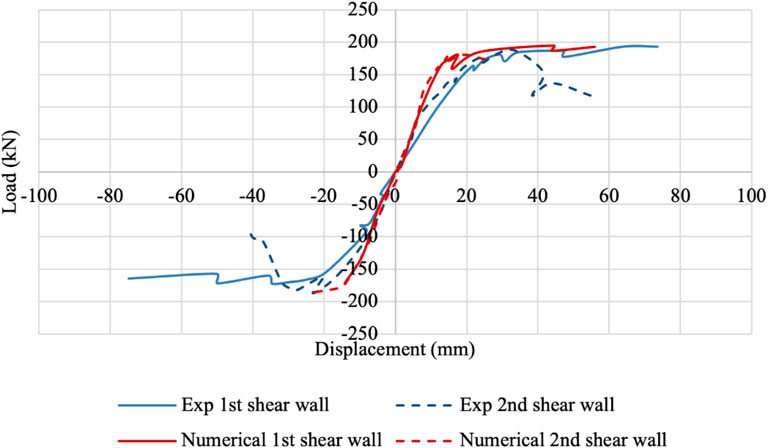
Figure 20. Numerical an experimental load vs. displacement envelope.
Figure 21 shows the hysteretic curves of the experimental and numerical analyses of the hysteresis curve of each wall.

Figure 21. Numerical an experimental hysteresis curve.
As can be seen there is greater experimental deformation than predicted in the numerical analysis. This is because the experimental edge columns suffered a local buckling at the base due to the lack of concrete. On the other hand, in Wall 2, the experimental deformation is very similar to that estimated by the numerical model. However, the numerical model seems unable to correctly predict the pinching response observed during the experiments, which may be attributed to the unintended segregation of concrete and other local strain concentrations that are not captured by the numerical model.
Both walls achieve very similar resistances, meeting the expected design specifications; however, it is observed that increasing the number of connectors reduces the cracks that appear at the junction between the steel flanges and the concrete core. Although no improvement is observed when using curved connectors in both tested walls, an enhancement in the energy dissipation capacity is observed with an increase in the number of connectors.
5 Conclusion
An experimental study has been carried out to examine the cyclic response of two types of mixed steel-concrete shear walls formed by reinforced concrete cores flanked at their sides by composite steel-concrete columns. The first wall type (referred to as Wall 1) had connectors inserted into the core of the metal edge columns, while, in the second case, the connectors were welded to metal angles that had been welded to the edge composite elements. Four types of connections between the metal edge elements and the concrete web were analyzed.
The findings of this study proof that it is possible to establish a reliable connection between the concrete core and the steel heads, with the purpose of obtaining a shear wall that complies with the relevant design calculations. This technique is applicable in real constructions, allowing to take advantage of all the benefits that these components offer.
It was also observed that the concrete present inside the column plays a vital role in the response of the walls. The strength of the concrete contributes to withstand the compressive forces generated by the lateral load, thus ensuring the stability and proper performance of the wall. The correct selection and sizing of the materials used in the construction of the head, together with the quality of the concrete, are essential aspects to ensure structural integrity and responsiveness to lateral loads.
It can be seen that both walls reach similar lateral strength capacities. The first wall reaches a maximum load of 195.20 kN while the second wall records a load of 187.50 kN. However, it is important to note that Wall 1 experiences failure when compressing the heads due to a deficiency in the casting of the concrete at the base. This highlights the importance of a correct construction and casting process at the base of the walls since it can significantly influence their resistance capacity and the efficient use of the anchors used.
Although the loads cycles histories were slightly different by the limitation of the manual operation of the actuator, both walls show a similar behavior. The same is true for numerical models, which give a correct approximation of the key response characteristics of the envelope of their responses.
Data availability statement
The raw data supporting the conclusions of this article will be made available by the authors, without undue reservation.
Author contributions
CQ-O: Conceptualization, Data curation, Formal Analysis, Investigation, Methodology, Software, Validation, Writing–original draft. KT-A: Formal Analysis, Investigation, Visualization, Writing–original draft. CM-C: Methodology, Validation, Visualization, Writing–original draft, Writing–review and editing. NG-T: Investigation, Methodology, Supervision, Validation, Visualization, Writing–original draft, Writing–review and editing.
Funding
The author(s) declare that no financial support was received for the research, authorship, and/or publication of this article.
Acknowledgments
The authors gratefully acknowledge the support provided by M.Sc. Patricio Placencia from EPN through the provided support, materials and experiments is gratefully acknowledged. Also, the support of the CIV team is gratefully acknowledged.
Conflict of interest
The authors declare that the research was conducted in the absence of any commercial or financial relationships that could be construed as a potential conflict of interest.
Publisher’s note
All claims expressed in this article are solely those of the authors and do not necessarily represent those of their affiliated organizations, or those of the publisher, the editors and the reviewers. Any product that may be evaluated in this article, or claim that may be made by its manufacturer, is not guaranteed or endorsed by the publisher.
References
Bai, L., Zhang, C., and Xiong, E. (2019). Investigations on the shear mechanism of steel-tube-reinforced concrete shear walls with a low shear-span ratio. KSCE J. Civ. Eng. 23, 2983–2996. doi:10.1007/s12205-019-1170-3
Dan, D., Fabian, A., and Stoian, V. (2011). Theoretical and experimental study on composite steelconcrete shear walls with vertical steel encased profiles. J. Constr. Steel Res. 67, 800–813. doi:10.1016/j.jcsr.2010.12.013
Liao, F. Y., Han, L. H., and Tao, Z. (2012). Performance of reinforced concrete shear walls with steel reinforced concrete boundary columns. Eng. Struct. 44, 186–209. doi:10.1016/j.engstruct.2012.05.037
Ltd Tokyo Sokki Kenkyujo Co (2024). F series GOBLET general use strain gauge. Available at: https://tml.jp/e/product/strain_gauge/f_list.html.
Park, Y. J., Reinhorn, A. M., and Kunnath, S. K. (1987). IDARC: inelastic damage analysis of reinforced concrete frame - shear-wall structures. Tech. Rep. NCEER-87-0008, Natl. Cent. Earthq. Eng. Reasearch, State Univ. N. Y. Buffalo.
Qian, J., Jiang, Z., and Ji, X. (2012). Behavior of steel tube-reinforced concrete composite walls subjected to high axial force and cyclic loading. Eng. Struct. 36, 173–184. doi:10.1016/j.engstruct.2011.10.026
Quishpe, C. P. (2015). Estudio de la conexiones para muros estructurales mixtos acero-concreto, 153.
Ren, F., Chen, J., Chen, G., Guo, Y., and Jiang, T. (2018). Seismic behavior of composite shear walls incorporating concrete-filled steel and FRP tubes as boundary elements. Eng. Struct. 168, 405–419. doi:10.1016/j.engstruct.2018.04.032
Saari, W. K., Hajjar, J. F., Schultz, A. E., and Shield, C. K. (2004). Behavior of shear studs in steel frames with reinforced concrete infill walls. J. Constr. Steel Res. 60, 1453–1480. doi:10.1016/j.jcsr.2004.03.003
Seismosoft (2022). SeismoStruct. Available at: https://seismosoft.com/product/seismostruct/?attribute_licence-type=6%20months&gad_source=1&gclid=CjwKCAjwmrqzBhAoEiwAXVpgoqrE0zN3T9Zef8n3p60PymSgi6e6gwWFGKWogjCozic0Jd_dMucYsRoCwVQQAvD_BwE (Accessed June 15, 2024).
Sosa, D., Arévalo, D., Mora, E. D., Correa, M. B., Albuja, D., and Gómez, C. (2017). Experimental and analytical study of slender reinforced concrete shear wall under cyclic in-plane lateral load. Math. Probl. Eng. 2017, 1–14. doi:10.1155/2017/4020563
Thomsen, J. H., and Wallace, J. W. (2004). Displacement-based design of slender reinforced concrete structural walls—experimental verification. J. Struct. Eng. 130, 618–630. doi:10.1061/(ASCE)0733-9445(2004)130:4(618)
Wallace, J. W., and Moehle, J. P. (1992). Ductility and detailing requirements of bearing wall buildings. J. Struct. Eng. 118, 1625–1644. doi:10.1061/(ASCE)0733-9445(1992)118:6(1625)
Wright, H. D., Oduyemi, T. O. S., and Evans, H. R. (1991). The experimental behaviour of double skin composite elements. J. Constr. Steel Res. 19, 97–110. doi:10.1016/0143-974X(91)90036-Z
Yan, J. B., Hu, H. T., and Wang, T. (2021). Seismic behaviour of novel concrete-filled composite plate shear walls with boundary columns. J. Constr. Steel Res. 179, 106507. doi:10.1016/j.jcsr.2020.106507
Yan, J.-B., Liu, X.-M., Liew, J. Y. R., Qian, X., and Zhang, M.-H. (2016). Steel–concrete–steel sandwich system in Arctic offshore structure: materials, experiments, and design. Mater. Des. 91, 111–121. doi:10.1016/j.matdes.2015.11.084
Keywords: mixed steel-concrete, shear wall, connections, cyclic load, numerical modeling
Citation: Quishpe-Otacoma C, Tello-Ayala K, Málaga-Chuquitaype C and García-Troncoso N (2024) Experimental and numerical cyclic response of mixed steel-concrete shear walls. Front. Built Environ. 10:1435899. doi: 10.3389/fbuil.2024.1435899
Received: 21 May 2024; Accepted: 12 July 2024;
Published: 15 August 2024.
Edited by:
Ernesto Grande, University of Cassino, ItalyReviewed by:
Valentina Tomei, University of Cassino, ItalyValentina Cima, University Guglielmo Marconi, Italy
Copyright © 2024 Quishpe-Otacoma, Tello-Ayala, Málaga-Chuquitaype and García-Troncoso. This is an open-access article distributed under the terms of the Creative Commons Attribution License (CC BY). The use, distribution or reproduction in other forums is permitted, provided the original author(s) and the copyright owner(s) are credited and that the original publication in this journal is cited, in accordance with accepted academic practice. No use, distribution or reproduction is permitted which does not comply with these terms.
*Correspondence: Natividad García-Troncoso, bmxnYXJjaWFAZXNwb2wuZWR1LmVj