 Kenji Fujii
94% of researchers rate our articles as excellent or good
Learn more about the work of our research integrity team to safeguard the quality of each article we publish.
Find out more
ORIGINAL RESEARCH article
Front. Built Environ., 03 July 2024
Sec. Earthquake Engineering
Volume 10 - 2024 | https://doi.org/10.3389/fbuil.2024.1431000
This article is part of the Research TopicAdvancing Energy Dissipation and Vibration-Control Systems for Structural ResilienceView all articles
Steel damper columns (SDCs) are energy-dissipating members that are suitable for reinforced concrete (RC) moment-resisting frames (MRFs) and those often used for multistory housing. In a previous study, the authors proposed an energy-based prediction procedure for the peak and cumulative response of an RC frame building with SDCs. In this procedure, the accuracy of the equivalent velocity of the maximum momentary input energy (VΔE1*)–peak equivalent displacement (D1*max) relationship is essential for improved prediction. In this article, the seismic capacity curve (VΔE1*–D1*max relationship) of RC MRFs with and without SDCs is evaluated using incremental critical pseudo-multi impulse analysis (ICPMIA). In the ICPMIA, which is based on a study by Takewaki and coauthors, the structure is subjected to various intensities of critical pseudo-multi impulsive lateral force. An ICPMIA of planer four 8- and 16-story RC MRFs with and without SDCs is performed to obtain their structural behaviors under various intensities of pulsive input. Then, the seismic capacity curve obtained from the ICMPIA results are compared with the predicted results based on the simplified equations. The main findings of this article are as follows. (i) The seismic capacity curve of RC MRFs without SDCs strongly depends on the number of impulsive lateral forces (Np). As Np increases, the seismic capacity decreases. The predicted seismic capacity curve severely underestimates that obtained from the ICMPIA in the case of large Np. This trend is notable when the level of pinching behavior in the RC members is severe. (ii) In the case of an RC MRF with SDCs, however, the influence of Np on its seismic capacity curve is small. The predicted seismic capacity curve agrees very well with that obtained from the ICMPIA. The influence of the level of pinching behavior in RC members on the seismic capacity curve is small.
The peak deformation, cumulative strain energy, and residual deformation are essential parameters in assessing the seismic performance of structural members. Two energy-based seismic intensity parameters—the maximum momentary input energy (Hori et al., 2000; Inoue et al., 2000; Hori and Inoue, 2002) and the total input energy (Akiyama, 1985; Akiyama, 1999)—are related to the peak and cumulative responses, respectively. According to a study by Hori and Inoue (2002), the peak displacement of a structure can be evaluated by considering the energy balance during a half cycle of the structural response using the maximum momentary input energy. Meanwhile, the cumulative strain energy of structural members can be evaluated by considering the energy balance during an entire seismic event using the total input energy.
The motivation for using energy dissipation devices (dampers) is to mitigate damage to beams and columns during strong seismic events. A dual system which consists of an elastic flexible main frame with stiff hysteresis dampers, e.g., a damage-tolerant structure (Wada et al., 2000), is one solution for creating structures with superior seismic performance. In such a dual system, dampers play important roles (a) to reduce the peak displacement of the system and (b) to reduce the cumulative damage to beams and columns by absorbing seismic energy before it reaches the beams and columns. Accordingly, a building with such a dual system is more resilient than one with a traditional earthquake-resistant system. e.g., a traditional moment-resisting frames (MRFs): in the case of traditional MRFs, most of the seismic energy is absorbed by the plastic hinges at the beam ends. Conversely, in the case of a dual system, most of the seismic energy is absorbed by the dampers; therefore, the seismic energy absorbed by the beams and columns is much smaller than in the case of traditional MRFs. Steel damper columns (SDCs; Katayama et al., 2000) are dampers suitable for reinforced concrete (RC) multistory housing. A SDC consists of a damper panel made of low-yield-strength steel plate, which absorbs the hysteresis energy, and a roll-formed H-section column, which behaves elastically. Numerous studies have been conducted on the seismic rehabilitation of existing RC buildings using SDCs (Fujii and Miyagawa, 2018; Fujii et al., 2019) and the seismic design of new RC MRFs with SDCs (Fujii and Kato, 2021; Mukoyama et al., 2021).
For evaluating the relationship between the seismic intensity and response parameters discussed above, the incremental dynamic analysis (IDA) (Vamvatsikos and Cornell, 2002) is the most rigorous method. In IDA, an nonlinear time-history analysis (NTHA) of the model is performed using the time-history of the ground accelerations. It is no doubt that the IDA is the most rigorous method for evaluating the response parameters. However, the IDA result is complex to understand with respect to the nonlinear structural characteristics because the IDA result is intricately intertwined with the nonlinear structural characteristics and the ground motion characteristics. As an alternative of IDA method, the incremental N2 (IN2) method has been proposed by Dolšek and Fajfar (2004). In IN2, a nonlinear static (pushover) analysis of the model is performed to obtain the nonlinear structural characteristics. Then, the seismic response (the seismic intensity corresponds to a certain peak displacement) is evaluated based on the inelastic spectra. The IN2 result is simpler and easier to understand than IDA result. However, only the peak deformation can be obtained from the IN2 results: the IN2 cannot predict the cumulative strain energy and residual deformation. In addition, its accuracy strongly depends on several assumptions, that the structure oscillates predominantly in a fundamental mode and that the spectra are inelastic. Therefore, another method which can predict the peak deformation, cumulative strain energy and residual deformation would be useful: this method would be better if its result is not too complicated to understand as IDA. Specifically, for the damage evaluation of damper panel in SDC, its peak shear strain and cumulative strain energy are needed. In addition, the problem of residual deformation would be more important for RC MRFs with SDCs, because the larger residual deformation may occur due to the presence of hysteresis dampers. Therefore, the evaluation of three parameters described above is important for RC MRFs with SDCs.
The concept of energy balance is quite useful to understand how such dampers work to improve the seismic performance of buildings. Recent advances in energy-based earthquake engineering can be found in Benavent-Climent and Mollaioli (2021) and Varum et al. (2023). Following Akiyama (1985), Benavent-Climent and his research group proposed a simplified seismic retrofitting design method for RC frames using dampers (Benavent-Climent, 2011; Benavent-Climent and Mota-Páez, 2017; Mota-Páez, et al., 2021; Benavent-Climent et al., 2024).
Takewaki and his research group (Kojima and Takewaki, 2015a; Kojima and Takewaki, 2015b; Kojima and Takewaki, 2015c; Kojima et al., 2015; Akehashi and Takewaki, 2021; Akehashi and Takewaki, 2022) have introduced the concepts of critical double impulse (DI) and critical multi impulse (MI) as substitutes for near-fault and long-duration earthquake ground motions. First, the concept of the critical DI was introduced to derive the upper bound of the earthquake input energy to a building structure (Kojima et al., 2015). Following this study, the critical response of an undamped elastoplastic single-degree-of-freedom (SDOF) model subjected to near-fault and long-duration earthquake ground motions was examined (Kojima and Takewaki, 2015a; Kojima and Takewaki, 2015b; Kojima and Takewaki, 2015c). Then, Akehashi and Takewaki introduced pseudo-double impulse (PDI) (Akehashi and Takewaki, 2021) and pseudo-multi impulse (PMI) (Akehashi and Takewaki, 2022) to form a multi-degree-of-freedom (MDOF) model. In PDI and PMI analyses, the MDOF model oscillates predominantly in a single mode, considering the impulsive lateral force corresponding to a certain mode vector. When the impulsive lateral force corresponding to the first mode vector is considered, the MDOF model oscillates predominantly in the first mode.
An energy-based prediction procedure for the peak and cumulative response of RC MRFs with SDCs has been proposed (Fujii and Shioda, 2023). In the presented procedure, the building model is converted to an equivalent SDOF model that represents the first modal response based on a monotonic pushover analysis result. Then, the peak displacement is predicted using the maximum momentary input energy (Hori and Inoue, 2002), while the cumulative energy dissipation demand is predicted using the total input energy (Akiyama, 1985). In this procedure, the accuracy of the equivalent velocity of the maximum momentary input energy of the first modal response (
• The verification in the previous study (Fujii, 2024) was limited because the number of impulsive inputs is fixed to two in a critical PDI analysis. The accuracy of the predicted
• In the simplified equation using
The residual displacement (Farrow and Kurama, 2003) is another essential parameter that is important to discuss in the repair of structures after earthquakes. The residual displacement is also important when the seismic sequence is considered (Ruiz-García and Negrete-Manriquez, 2011; Ruiz-García, 2012a; Ruiz-García, 2012b; Tesfamariam and Goda, 2015; Hoveidae and Radpour, 2021; Fujii, 2022). Specifically, Ruiz-García (2012b) pointed out that the residual displacement of a stiffness-degrading SDOF model is smaller than that of an elastoplastic SDOF model, even though the peak displacement of a stiffness-degrading SDOF model is larger than that of an elastoplastic SDOF model. In addition, Hoveidae and Radpour (2021) found that the large residual displacement after a mainshock can significantly increase the peak response under an aftershock. In Fujii (2024), the residual displacement obtained from the critical PDI analysis of RC MRFs with SDCs is larger than that of RC MRFs without SDCs: the residual equivalent displacement reaches close to 30% of the peak equivalent displacement in the case of RC MRFs with SDCs. This is larger than that obtained in the NTHA considering the ground motion records (Fujii, 2022). Therefore, the residual displacement obtained from the critical PDI analysis may be the upper bound. Accordingly, the influence of the number of impulsive inputs (
Given the above-outlined background, this study addresses the following questions.
(i) Considering the critical response of an RC MRF with SDCs subjected to critical PMI input, what is the dependence of the
(ii) How does the pinching behavior of RC members affect the
(iii) How do
(iv) How does
In this article, the seismic capacities of RC MRFs with and without SDCs are evaluated using incremental critical pseudo-multi impulse analysis (ICPMIA). Then, the
The rest of this paper is organized as follows. Section 2 outlines the critical PMI analysis and ICPMIA. Section 3 presents four RC MRFs with and without SDCs and the analysis methods. Section 4 describes the responses of the RC MRFs obtained from the critical PDI and PMI analysis results, focusing in particular on (i) the pulse velocity (
First, an outline of the critical PMI analysis is described as follows. Note that this analysis is based on the critical PDI analysis presented in Fujii (2024). Figure 1 outlines the critical PMI analysis.
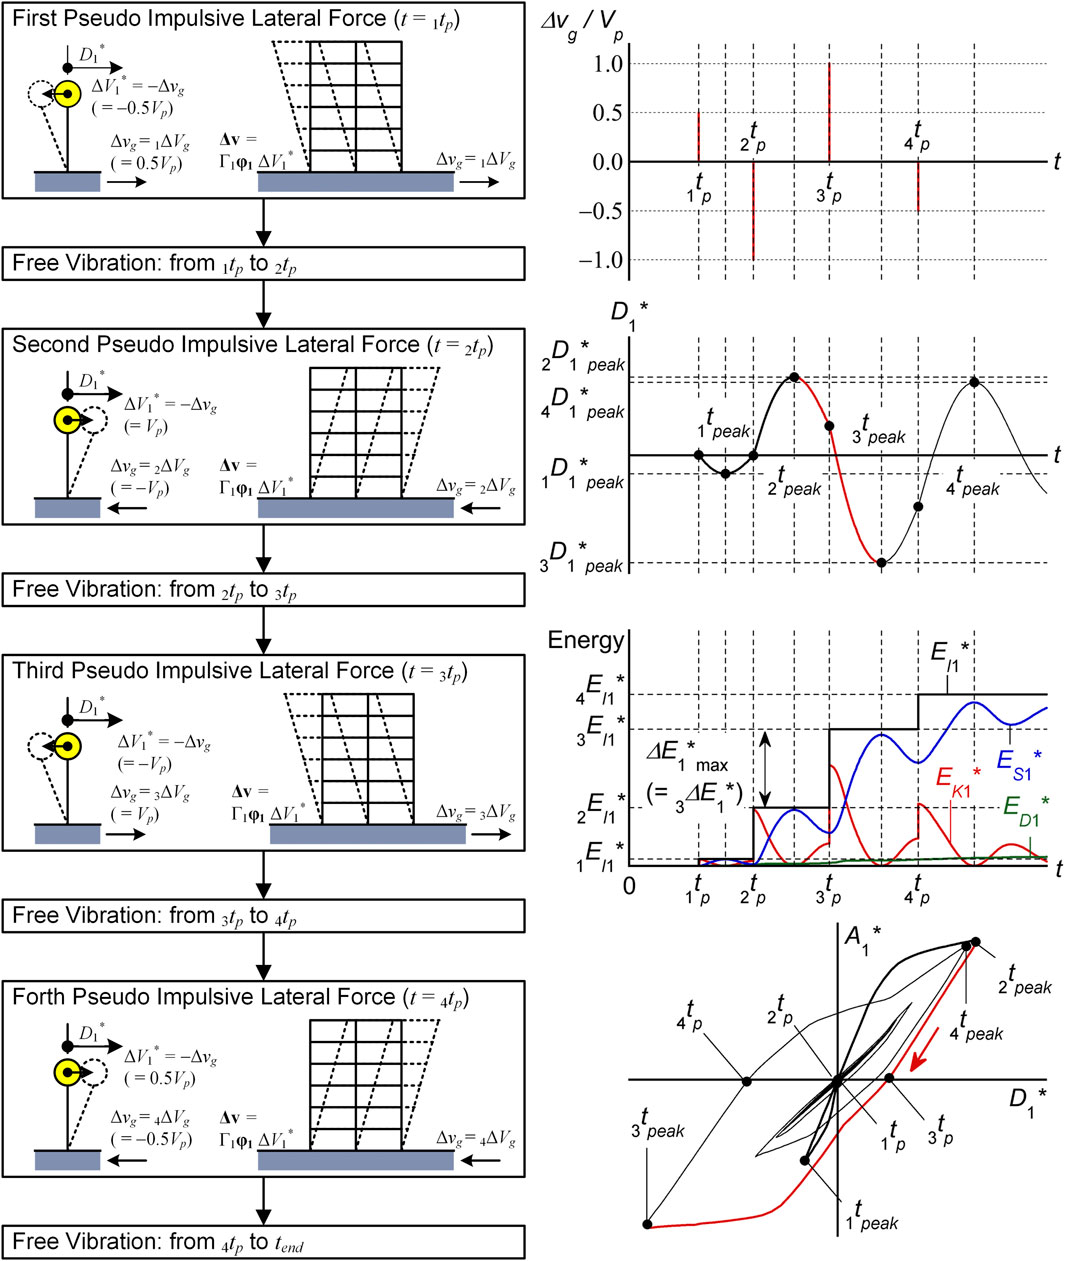
Figure 1. Outline of the critical PMI analysis.
Following a study by Kojima and Takewaki (2015c), the ground acceleration (
In Eq. 1,
where
Next, consider a planer frame building model (number of stories,
where
The equivalent acceleration
Note that the relative equivalent acceleration
Details of the critical PMI analysis is shown in the in the Supplementary Appendix S1 of this article.
The peak equivalent displacement of the first modal response over the course of the entire seismic event (
In Eq. 11,
In Eq. 12,
The equivalent velocity of the maximum momentary input energy of the first modal response (
In addition, the equivalent velocity of the cumulative input energy of the first modal response (
Incremental critical pseudo-multi impulse analysis (ICPMIA) is a parametric analysis method used to evaluate the nonlinear response of a structure by performing a critical PMI analysis considering various pulse velocities (
The
The four planar building models analyzed in this study are 8- and 16-story RC MRFs with and without SDCs. Figure 2 shows the simplified plan and elevation of the RC MRF building models. The two models labeled Type Dp (8Story-Dp and 16Story-Dp) are the same as those used in Fujii and Shioda (2023). The two models made from Type Dp by removing all SDCs are referred to as Type O (8Story-O and 16Story-O). All RC MRFs analyzed herein were designed according to the strong-column/weak-beam concept, except at the foundation level beam and in the case of steel damper columns installed in an RC frame. In the latter case, at the joints between an RC beam and a steel damper column, the RC beam was designed to be sufficiently stronger than the yield strength of the steel damper column considering strain hardening. Sufficient shear reinforcement of all RC members was provided to prevent premature shear failure. The failure of beam–column joints is not considered because it is assumed that sufficient reinforcement is provided. The natural periods of the first modal response in the elastic range (
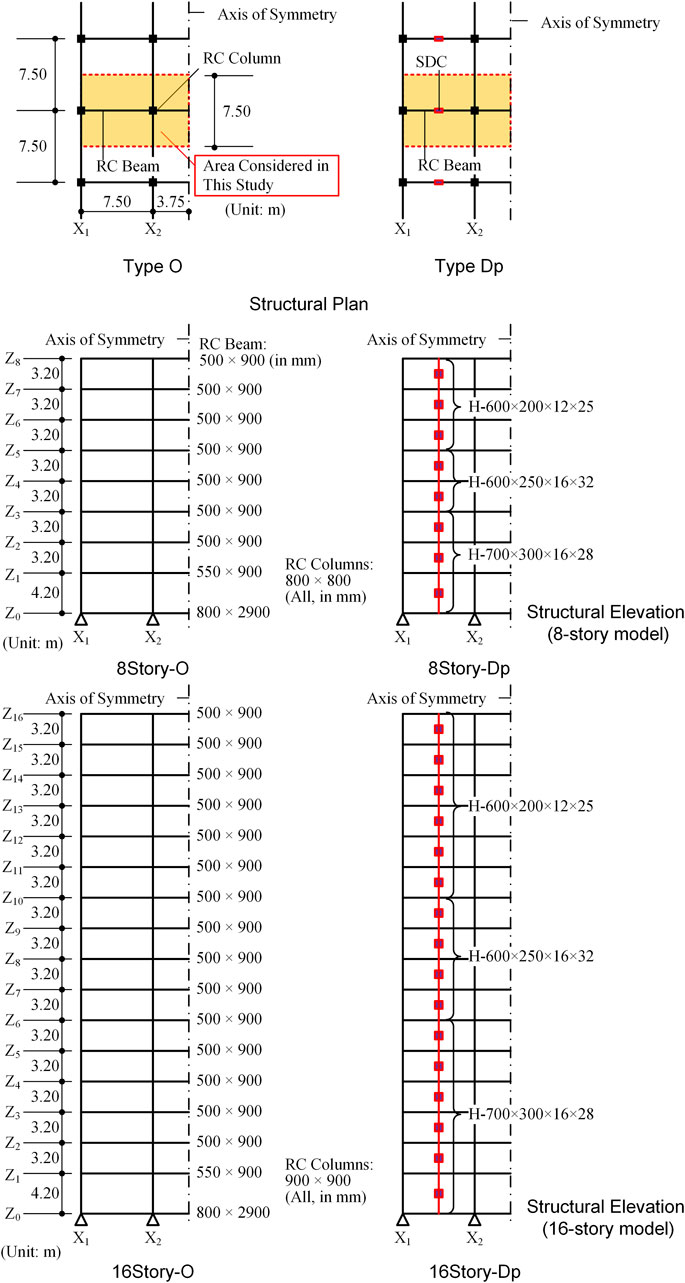
Figure 2. Simplified structural plan and elevation of RC MRF building model.
The nonlinear behavior of the RC members and SDCs is modeled as in previous studies (Mukoyama et al., 2021; Fujii, 2022; Fujii and Shioda, 2023), except the hysteresis rule used for the RC members. Figure 3 shows the nonlinear force–deformation relationship. In this study, the pinching behavior of the RC members is considered. The pinching model is assumed to be a linear combination of perfectly non-pinching and perfectly pinching models. The perfectly non-pinching model is identical to the stiffness degradation model used for RC members in previous studies (Mukoyama et al., 2021; Fujii, 2022; Fujii and Shioda, 2023). Meanwhile, the perfectly pinching model is a model that has no energy hysteresis energy dissipation in symmetric loading. A parameter
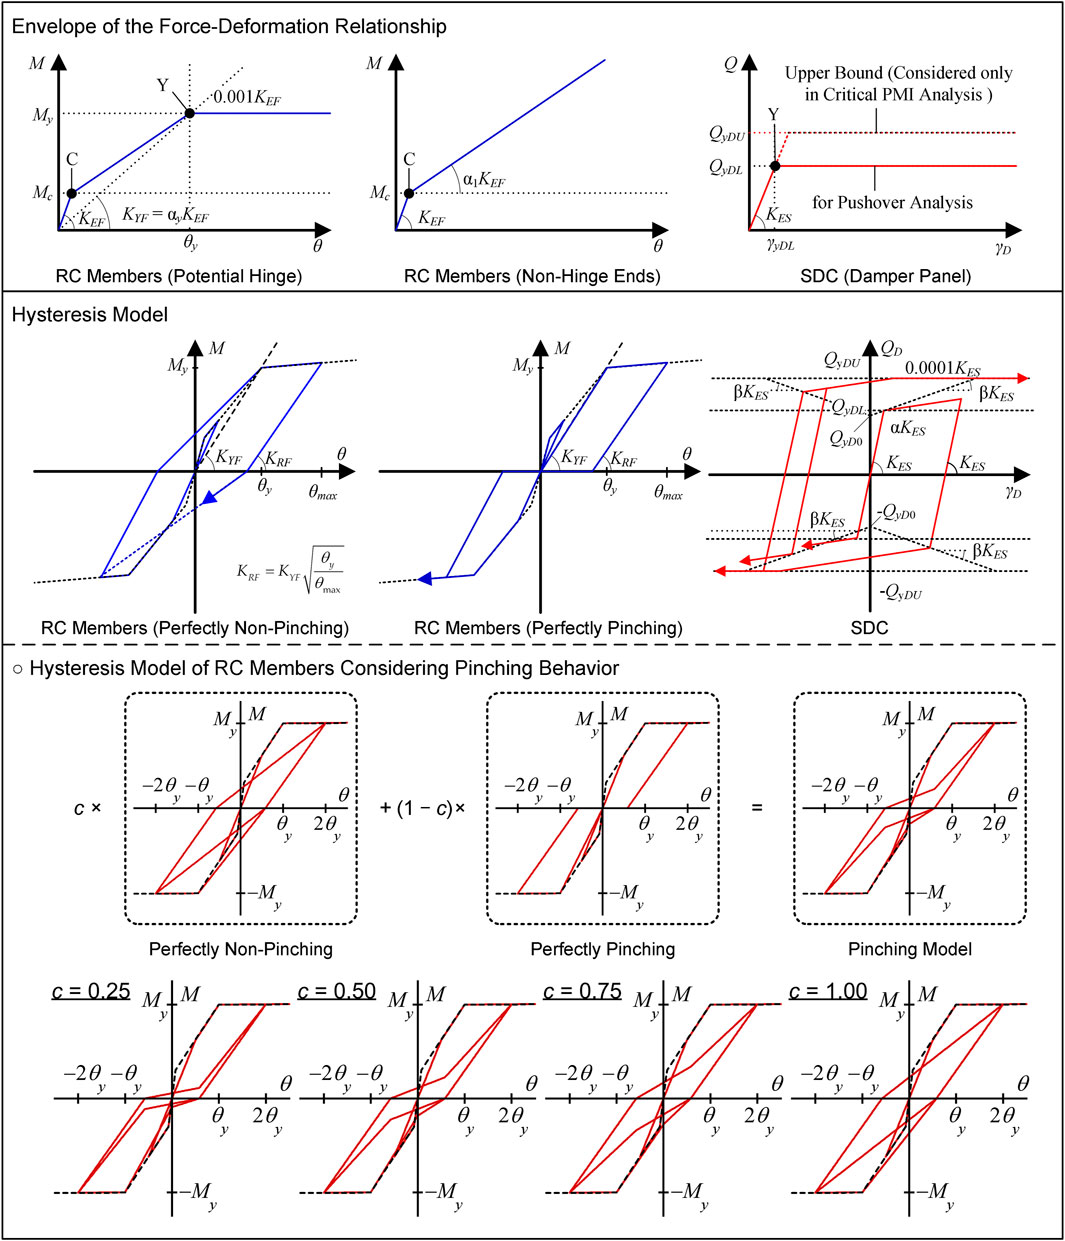
Figure 3. Nonlinear force-deformation relationship of members.
In this study, the pulse velocity (
The range of
This section describes the responses of the RC MRFs obtained from the critical PDI and PMI analysis results, focusing in particular on (i) the pulse velocity (
Figure 4 compares the relationship between the pulse velocity (
• The peak equivalent displacement (
• For Type O, the increase in
• For Type Dp, however, the increase in
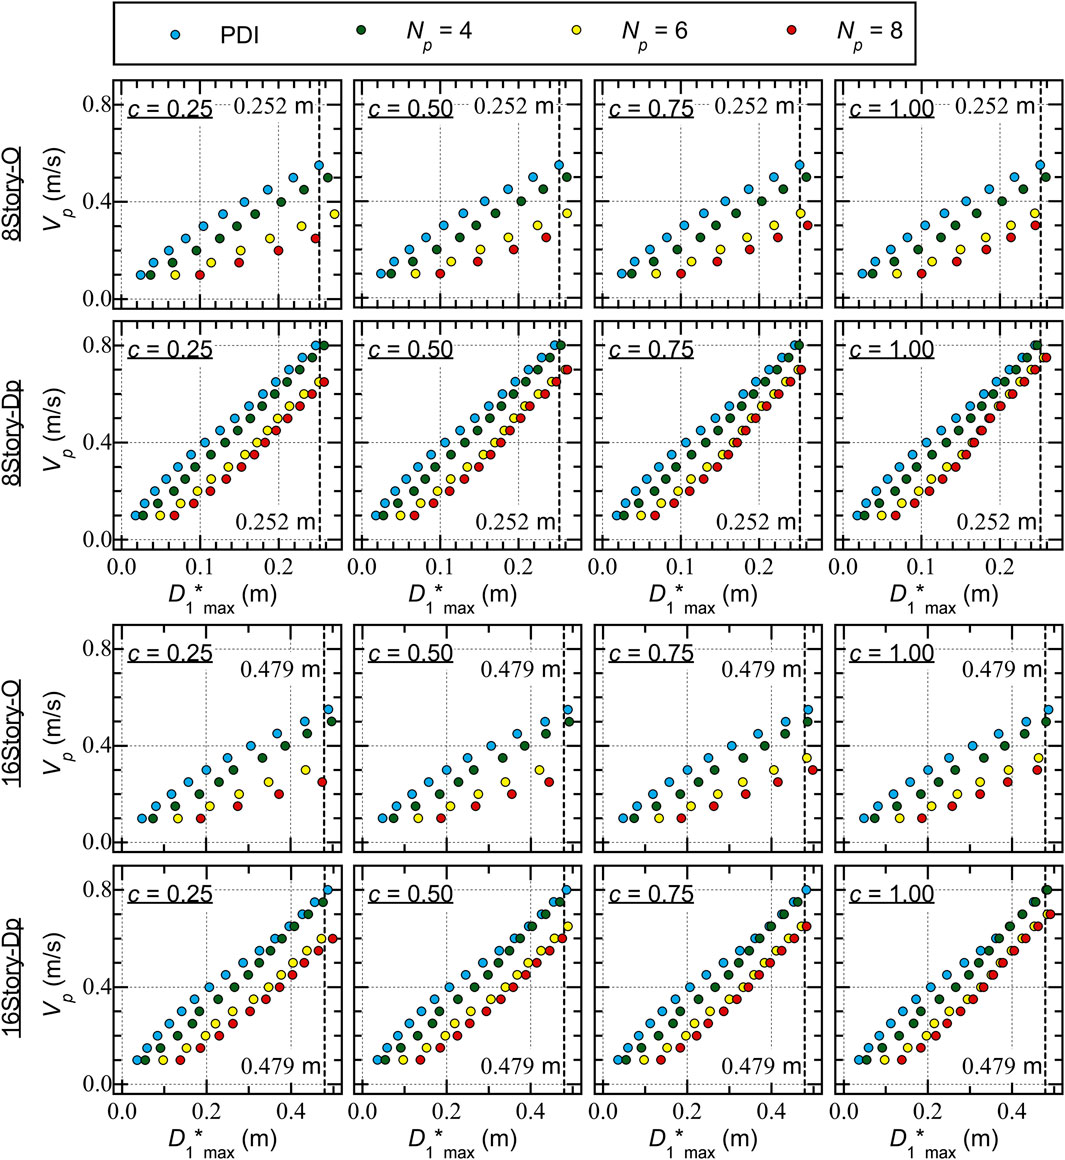
Figure 4. Relationship between pulse velocity (Vp) and peak equivalent displacement (D1*max).
Figure 5 compares the peak story drift. Here, the cases
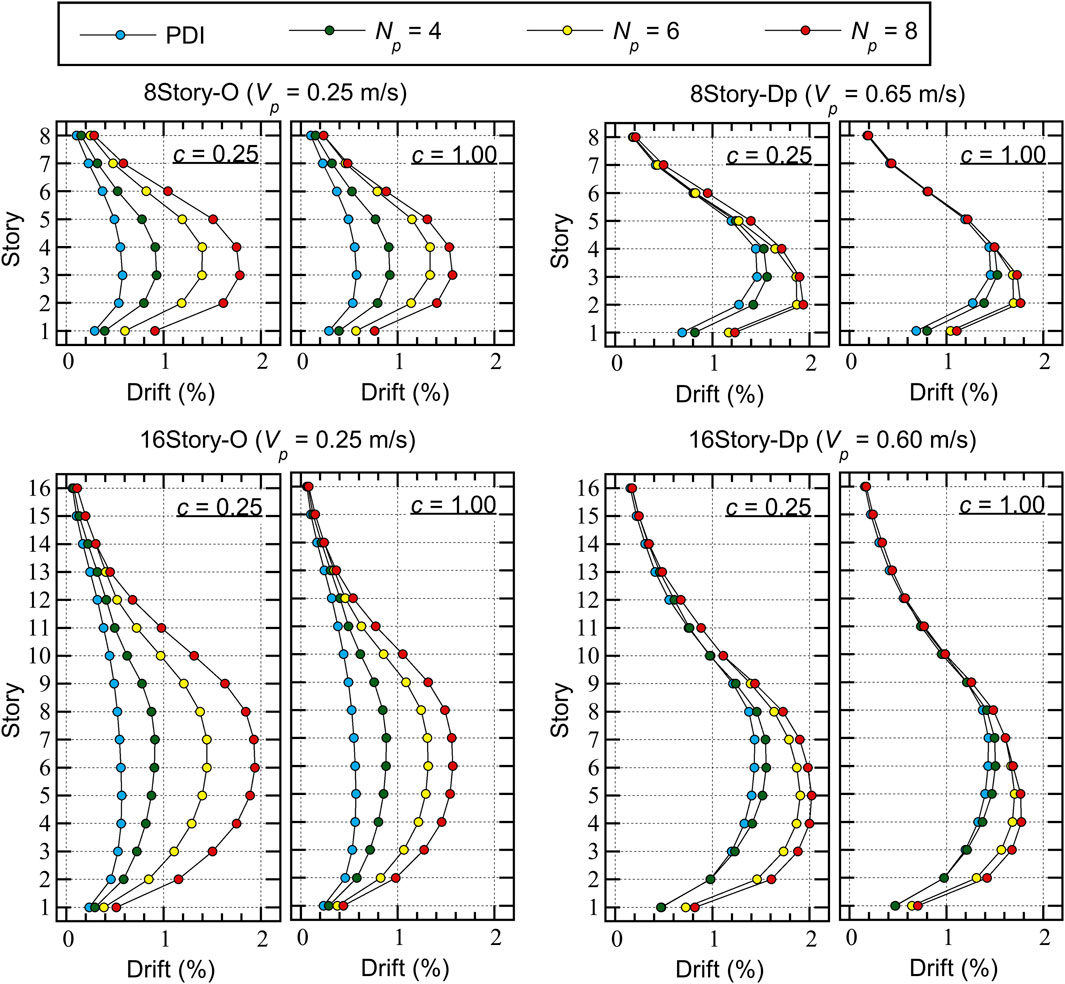
Figure 5. Comparisons of the peak story drift.
The following conclusions can be drawn from Figure 5.
• For Type O, the increase in the peak story resulting from the increase in
• For Type Dp, however, the increase in the peak story drift as a result of the increase in
Figure 6 shows the hysteresis loops of the first modal response (
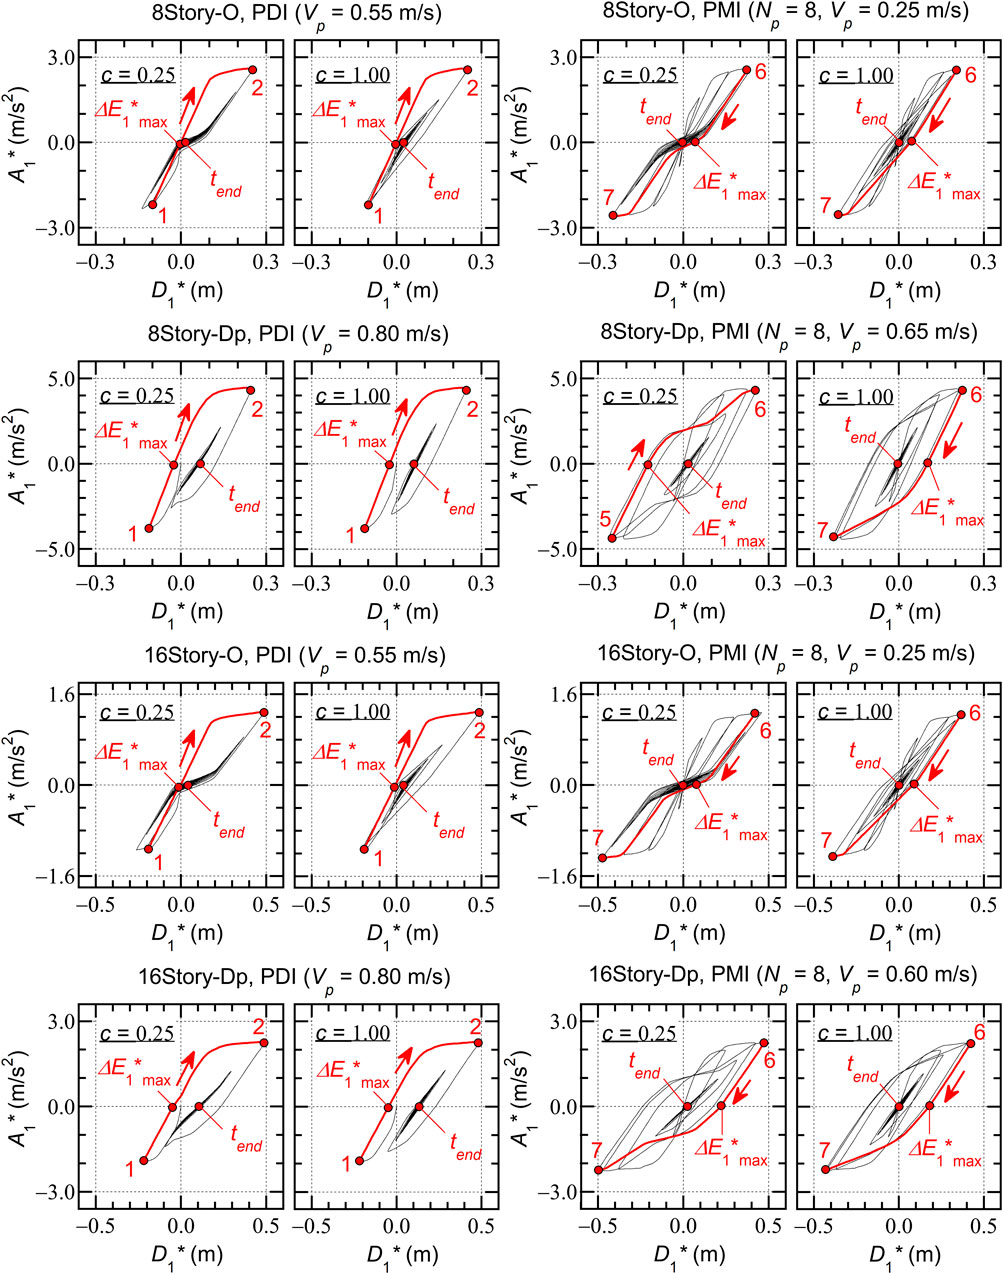
Figure 6. Hysteresis loop and residual displacement.
The following conclusions can be drawn from Figure 6.
• In the critical PDI analysis results (
• In the critical PMI analysis results (
Figure 7 shows the residual equivalent displacement ratio (
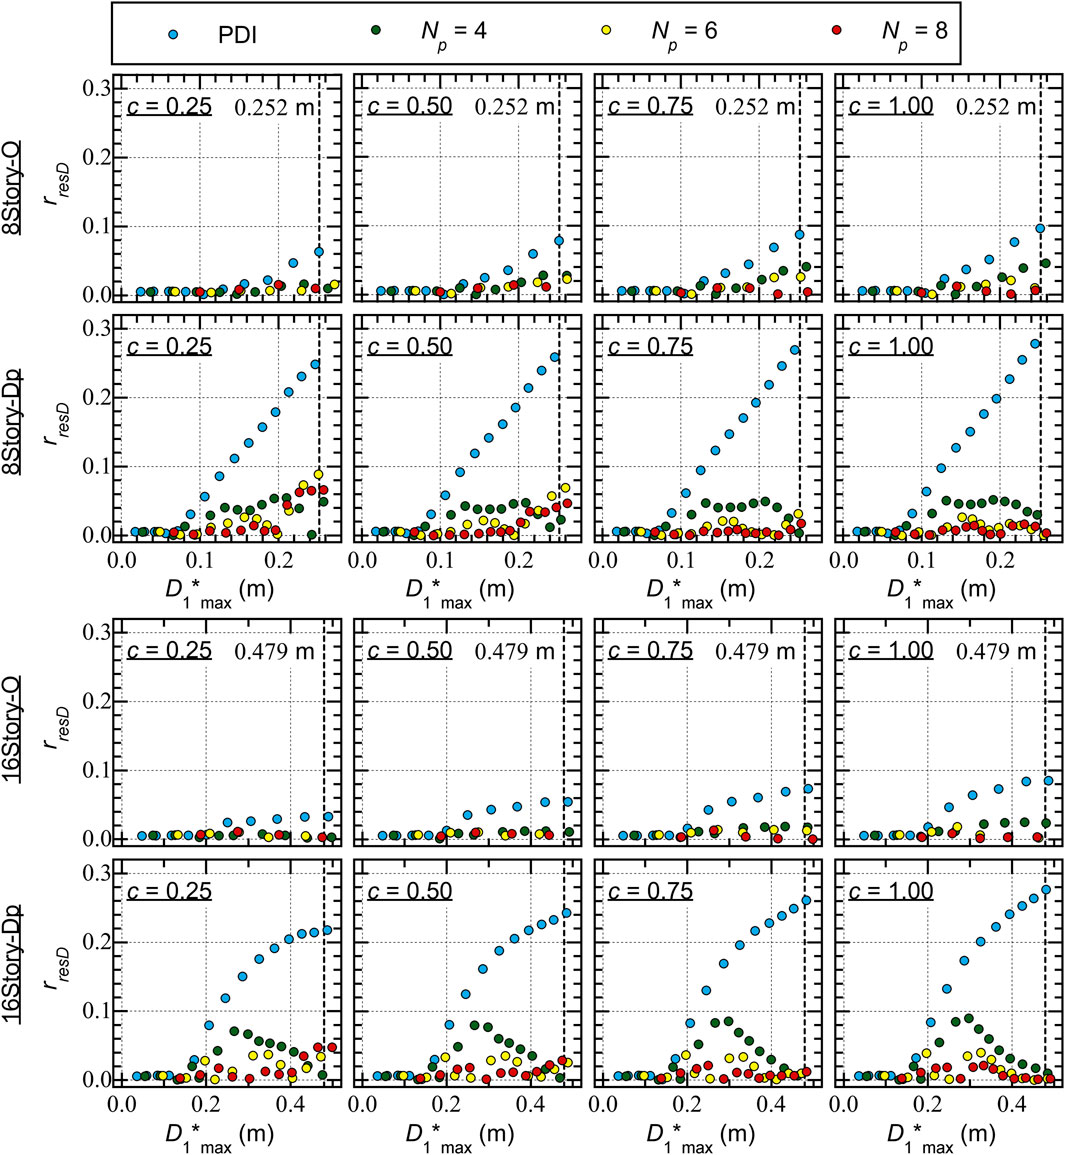
Figure 7. Residual equivalent displacement ratio.
The following conclusions can be drawn from Figure 7.
• For Type O,
• For Type Dp, the
Figure 8 compares the ratios of the cumulative strain energy of the entire frame model (
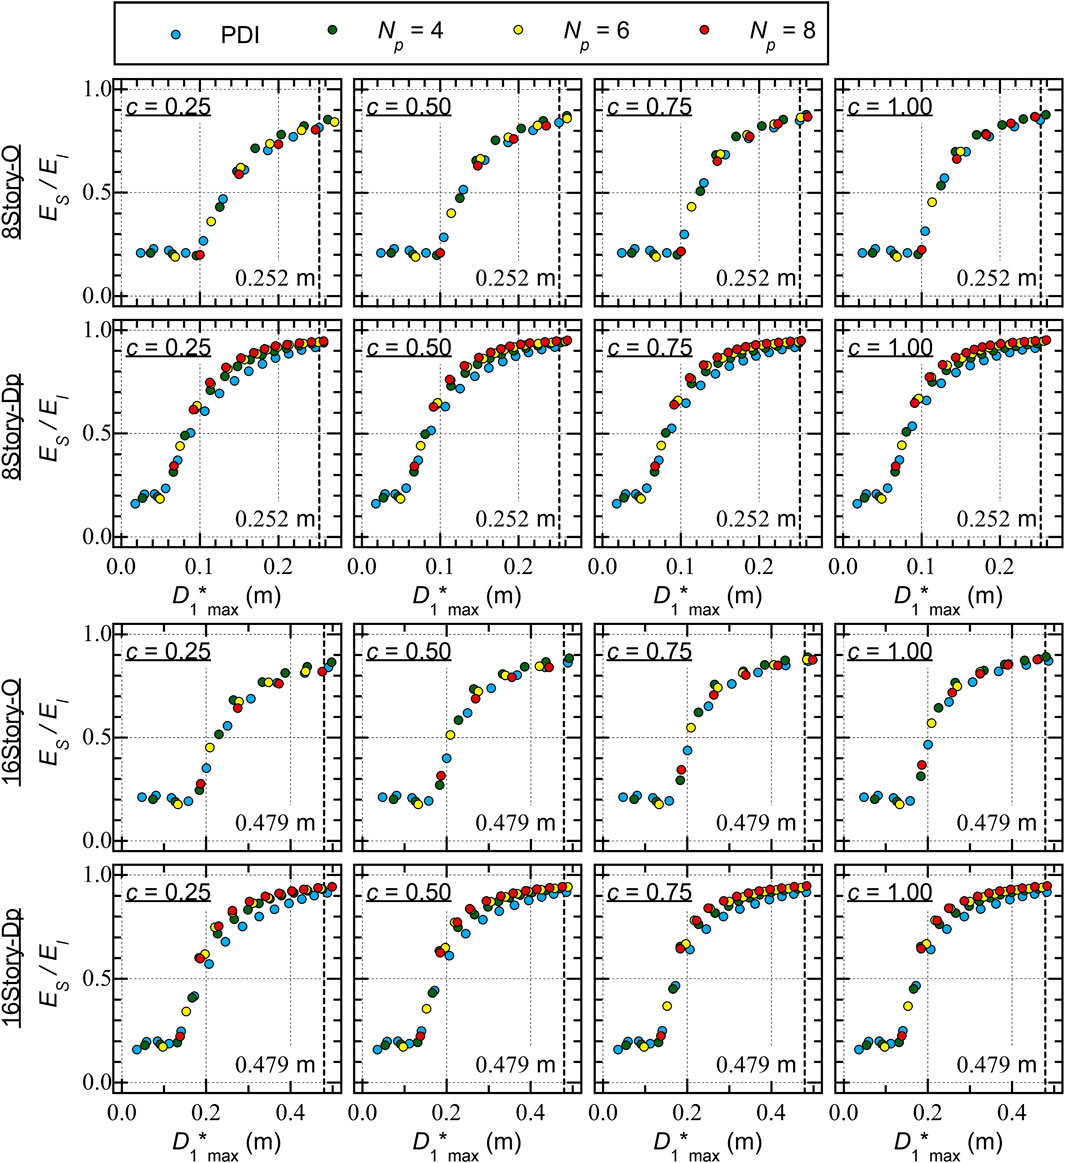
Figure 8. Ratio of the cumulative strain energy at the end of the simulation.
For Type O, the following conclusions can be drawn from Figure 8.
• For 8story-O, the
• For 16story-O, the
• The difference in the
In addition, the following conclusions can be drawn from Figure 8 for Type Dp.
• The
• In the PMI analysis results (
Next, the discussion focuses on the cumulative strain energy ratio of the RC MRF (
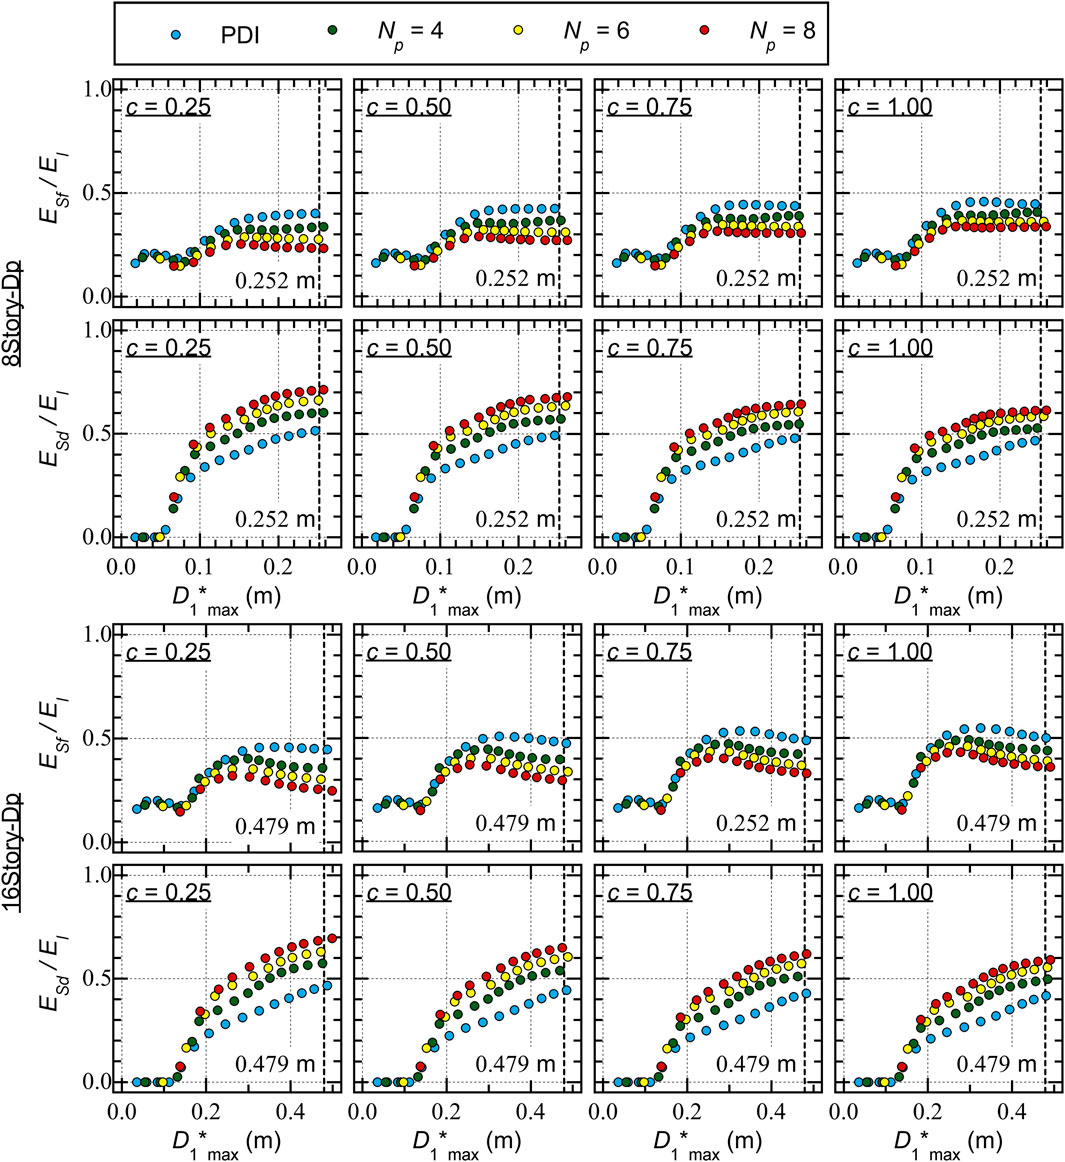
Figure 9. Ratio of the cumulative strain energy of RC MRF and SDCs at the end of the simulation.
For 8story-Dp, the following conclusions can be drawn from Figure 9.
• The
• The
In addition, the following conclusions can be drawn from Figure 9 for 16story-Dp.
• The
• The
It should be emphasized that the increase of the
This section summarizes the responses of the RC MRF models with and without SDCs as obtained from the critical PMI analysis results.
A) The influence of the number of pseudo impulsive lateral forces (
B) In the PMI analysis results (
C) The residual displacement obtained from the PMI analysis results is smaller than that obtained from the PDI analysis results (
D) The ratio of the cumulative strain energy of the entire frame model (
This section focuses on comparisons with the predicted results based on the study of Fujii and Shioda (2023) and the ICPMIA results. First, simplified equations for calculating the energy dissipation capacity during a half cycle of the structural response are formulated. Next, the seismic capacity curve (the
First, a pushover analysis of the
In Eqs 17, 18,
In Eq. 18,
Here,
Then, the energy dissipation capacity during a half cycle of the structural response of the equivalent SDOF model (
The contributions of the hysteretic dissipated energy of the RC MRFs and SDCs are calculated using Eqs 23, 24:
In Eqs 23, 24, the functions
The values of
The derivations of Eqs 25, 26 can be found in Supplementary Appendix S2 of this article.
The contributions of the viscous damping are calculated such that
In Eq. 28,
The equivalent velocity of the energy dissipation capacity during a half cycle of the structural response of the equivalent SDOF model corresponding to
Figure 10 shows the calculated seismic capacity curves (the
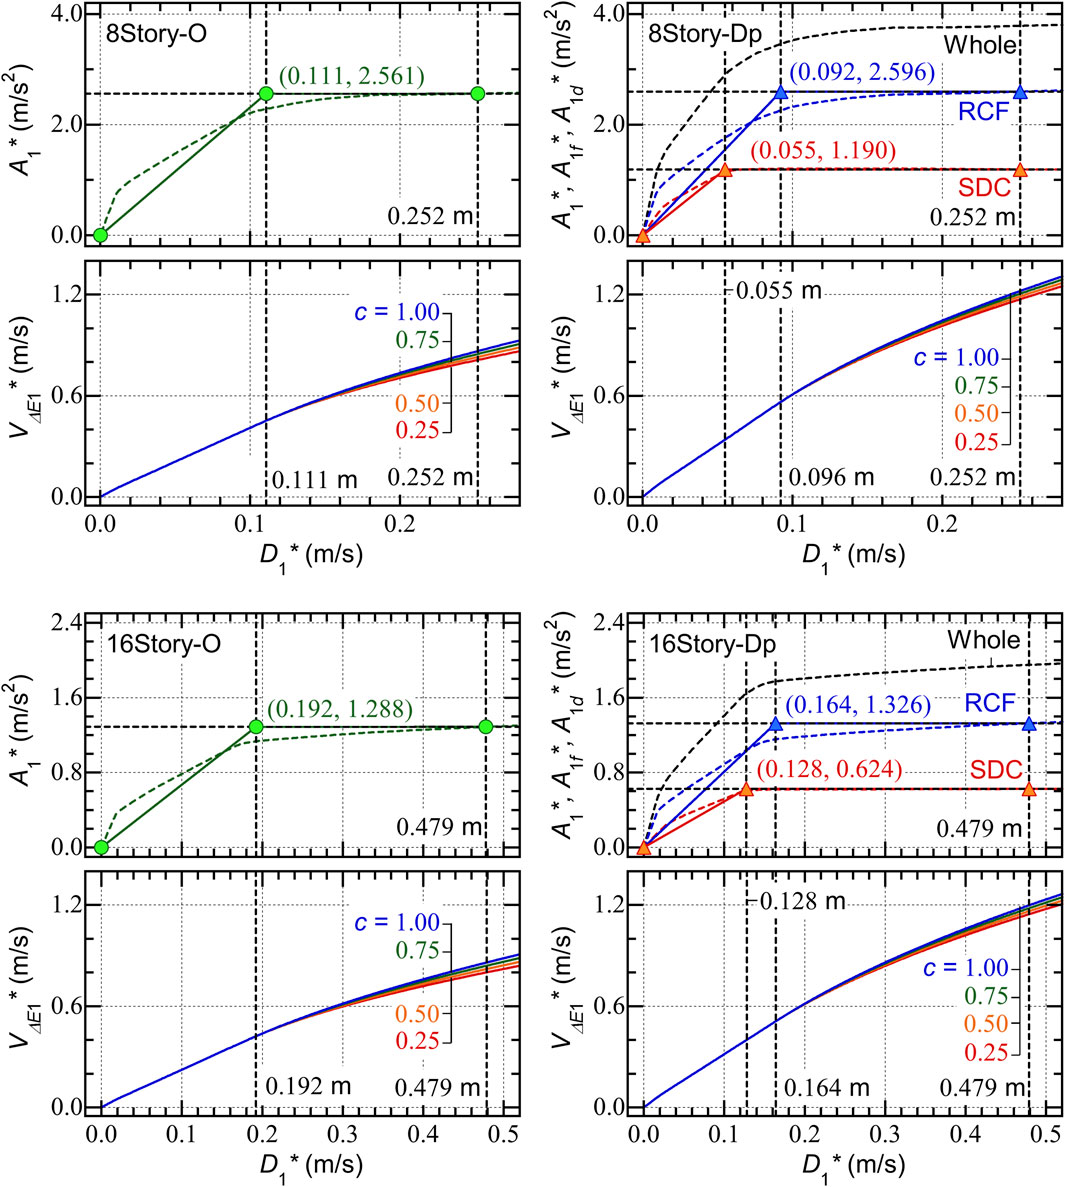
Figure 10. Capacity curves of MRF models calculated from the pushover analysis results.
Figure 11 shows comparisons between the predicted seismic capacity curves and the ICPMIA analysis results. The following conclusions can be drawn.
• For Type O, the plots obtained from the PDI and PMI analysis (
• For Type Dp, the plots obtained from the PDI and PMI analysis (
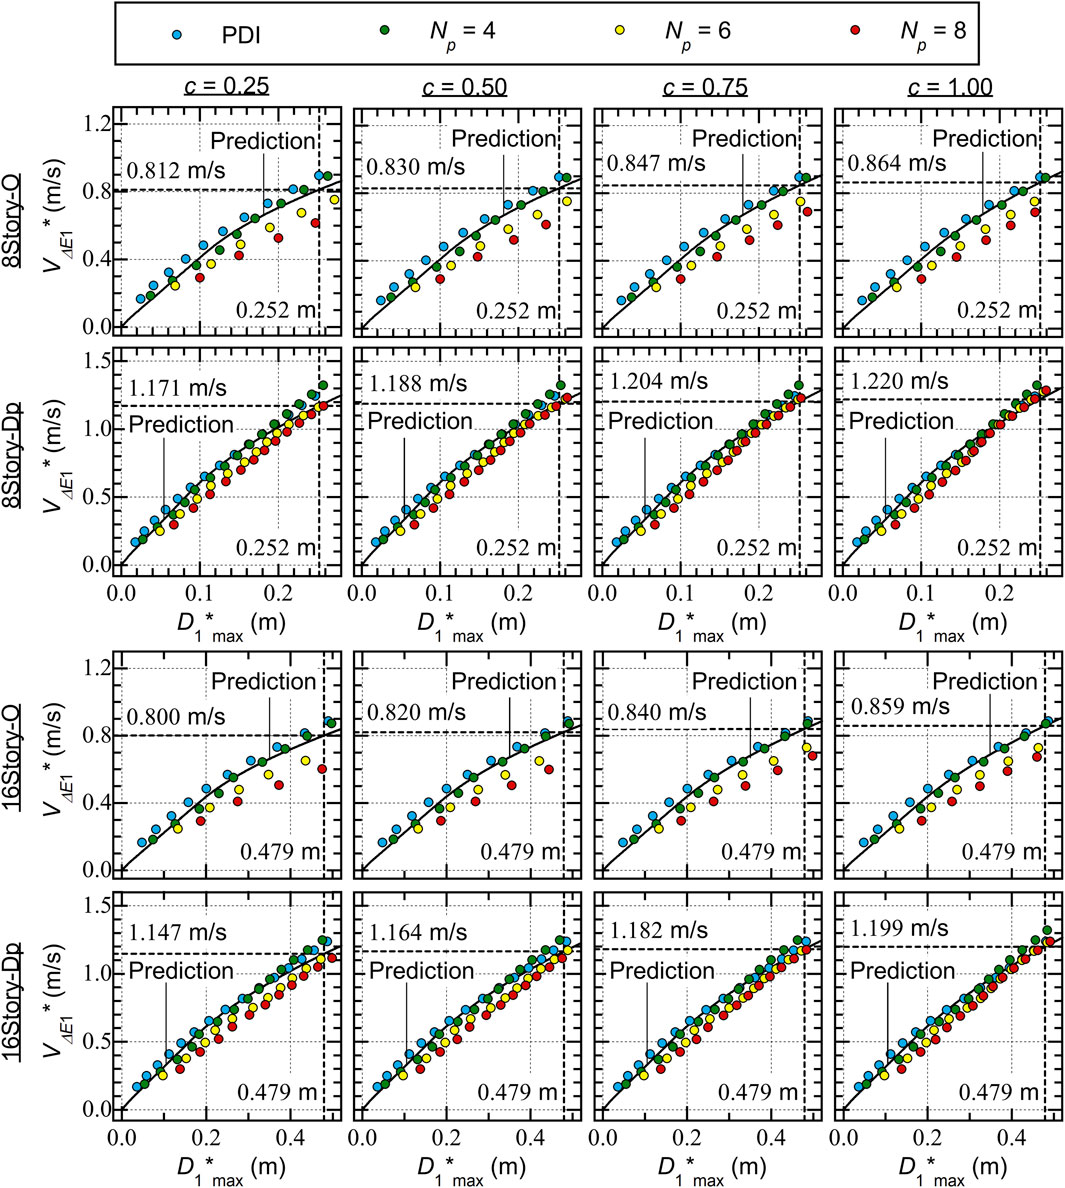
Figure 11. Comparisons with the predicted capacity curves and the VΔE1*-D1*max relationship obtained from ICPMIA results.
The results shown in Figure 11 indicate that the accuracy of the predicted capacity curve is acceptable for Type Dp, while the predicted capacity curve is unacceptably underestimated for Type O for larger
where
• For Type O, the
• For Type Dp, the
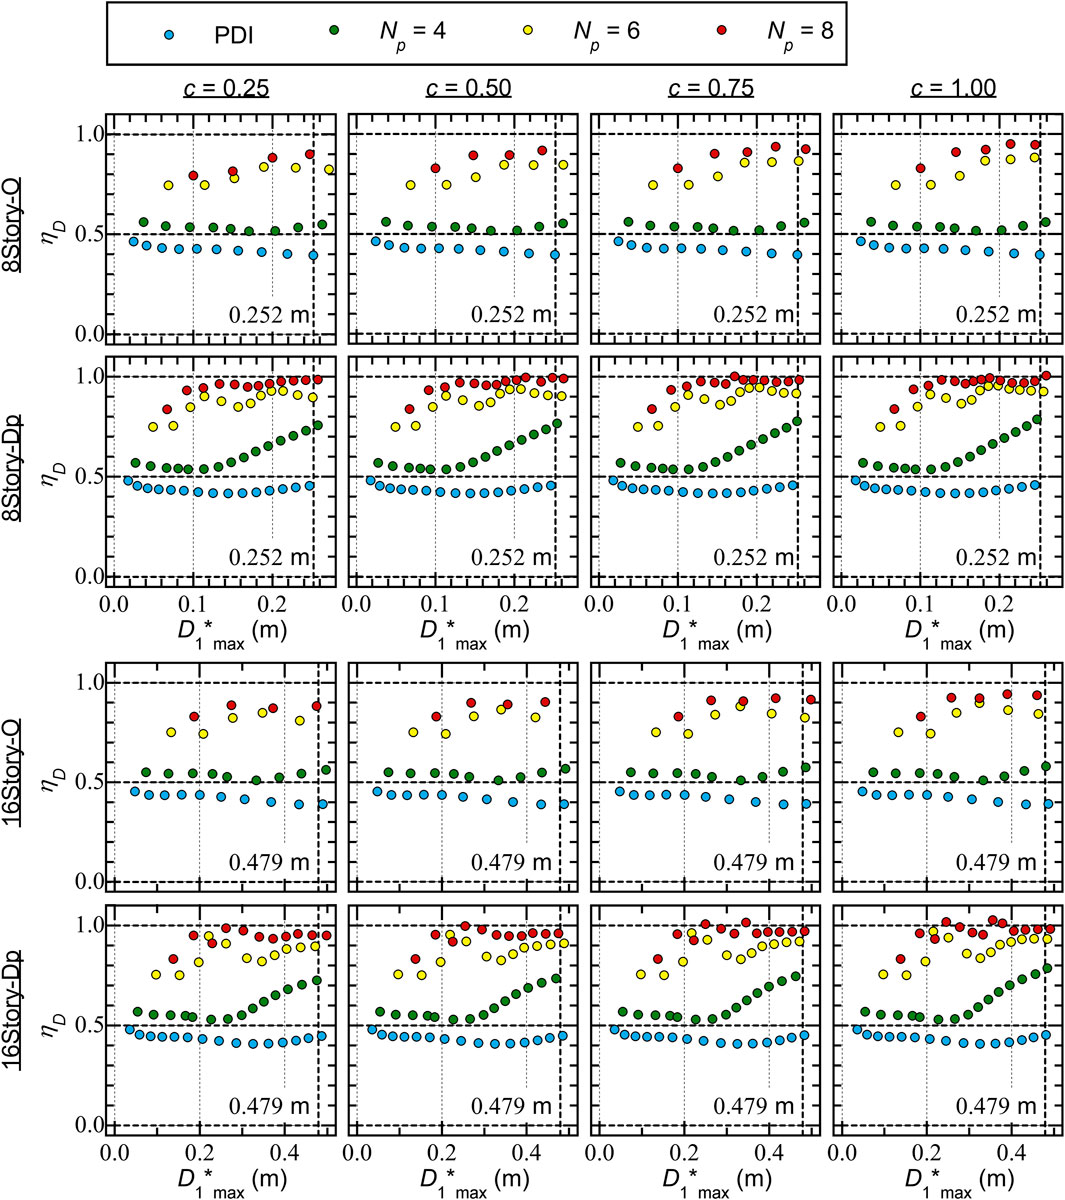
Figure 12. Ratio of the displacements in the positive and negative directions (ηD).
The results shown in Figure 12 indicate that the
Next, the relationship between the energy dissipation capacity during a half cycle of the structural response and
In Eqs 32, 33, the functions
In addition, the contribution from the viscous damping (
In Eq. 36,
Figure 13 shows the relationships between the energy dissipation capacity calculated from Eqs 32–36 and the
• The contribution from the hysteretic dissipated energy of the RC MRFs (
• The variation in the calculated
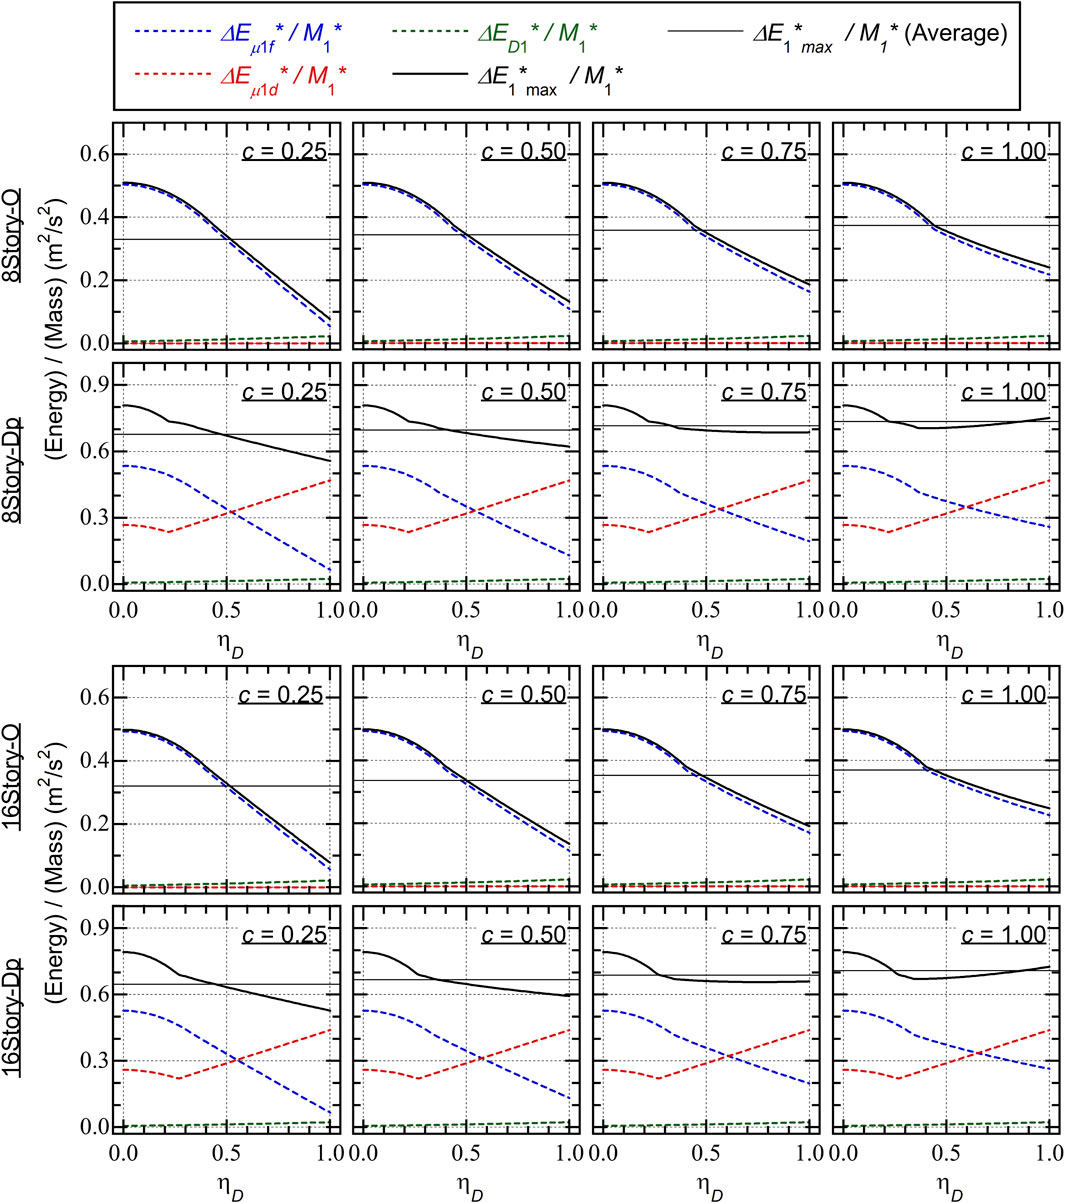
Figure 13. Relations between the calculated dissipated energy per unit mass and ηD.
The following conclusions can be drawn for Type Dp from Figure 13.
• The contribution from the hysteretic dissipated energy of the SDCs (
• The variation in the calculated
The results shown in Figures 12, 13 can explain why the Type O
Note that the contribution of the hysteresis energy of the RC MRFs (
This section focuses on comparisons with the predicted results based on Fujii and Shioda (2023) and the ICPMIA results. Based on these comparisons, the following conclusions can be drawn.
A) In the case of RC MRFs without SDCs, the
B) In the case of RC MRFs with SDCs, the
C) The ratio of the displacements in the positive and negative directions (
In this article, the seismic capacities of RC MRFs with and without SDCs were evaluated using incremental critical pseudo-multi impulse analysis (ICPMIA). The main results and conclusions can be summarized as follows.
(i) In the case of RC MRFs without SDCs, the influence of
(ii) In the case of RC MRFs without SDCs, the influence of the pinching behavior of RC members on the
(iii) For RC MRFs with SDCs, the ratio of the cumulative strain energy of the RC MRFs (
(iv) The residual equivalent displacement ratio (
Conclusion (i) supports the accuracy of the prediction procedure (Fujii and Shioda, 2023). Specifically, the predicted
As described in conclusion (ii), the pinching behavior of RC members affects notably the
Another finding of interest is the dependence of the calculated energy dissipation capacity (
Note that the results shown in this study are, so far, valid only for RC MRF models with and without SDCs. Therefore, apart from further verifications using additional building models, the following questions remain unanswered, although the list below is not comprehensive.
• How can the number of impulsive inputs
• Can the prediction procedure (Fujii and Shioda, 2023) properly predict the cumulative strain energies of RC MRFs and SDCs obtained by the critical PMI analysis results? As far as the peak response is concerned, the prediction procedure has been validated. However, the prediction procedure has not been validated for the cumulative response. In such a validation, the pinching behavior of the RC members and the number of impulsive inputs
• Can the ICPMIA be extended for the case of seismic sequences? To the author’s best knowledge, the NTHA is the only method that analyzes the responses of structures subjected to seismic sequences. However, the results obtained from NTHA are too complex to derive general conclusions. This is because the NTHA results are intricately intertwined with the nonlinear structural characteristics and the ground motion characteristics. In the case of a seismic sequence, the complexity increases because of the mainshock-aftershock (or foreshock-mainshock) combined ground motions. The nonlinear characteristics of the damaged structure would likely be easier to understand using ICPMIA.
The raw data supporting the conclusion of this article will be made available by the authors, without undue reservation.
KF: Conceptualization, Data curation, Formal Analysis, Investigation, Methodology, Project administration, Resources, Software, Validation, Visualization, Writing–original draft, Writing–review and editing.
The author(s) declare that financial support was received for the research, authorship, and/or publication of this article. This study received financial support from JSPS KAKENHI Grant Number JP23K04106.
We thank Martha Evonuk, PhD, from Edanz (https://jp.edanz.com/ac), for editing a draft of this manuscript.
The author declares that the research was conducted in the absence of any commercial or financial relationships that could be construed as a potential conflict of interest.
All claims expressed in this article are solely those of the authors and do not necessarily represent those of their affiliated organizations, or those of the publisher, the editors and the reviewers. Any product that may be evaluated in this article, or claim that may be made by its manufacturer, is not guaranteed or endorsed by the publisher.
The Supplementary Material for this article can be found online at: https://www.frontiersin.org/articles/10.3389/fbuil.2024.1431000/full#supplementary-material
ICPMIA = incremental critical pseudo-multi impulse analysis. MDOF = multi-degree-of-freedom. MRF = moment-resisting frame. NTHA = nonlinear time-history analysis. PDI = pseudo-double impulse. PMI = pseudo-multi impulse. RC = reinforced concrete. SDC = steel damper column. SDOF = single-degree-of-freedom.
Akehashi, H., and Takewaki, I. (2021). Pseudo-double impulse for simulating critical response of elastic-plastic MDOF model under near-fault earthquake ground motion. Soil Dyn. Earthq. Eng. 150, 106887. doi:10.1016/j.soildyn.2021.106887
Akehashi, H., and Takewaki, I. (2022). Pseudo-multi impulse for simulating critical response of elastic-plastic high-rise buildings under long-duration, long-period ground motion. Struct. Des. Tall Special Build. 31 (14), e1969. doi:10.1002/tal.1969
Akiyama, H. (1985). Earthquake resistant limit-state design for buildings. Tokyo: University of Tokyo Press.
Akiyama, H. (1999). Earthquake-resistant design method for buildings based on energy balance. Tokyo: Gihodo Shuppan.
Benavent-Climent, A. (2011). An energy-based method for seismic retrofit of existing frames using hysteretic dampers. Soil Dyn. Earthq. Eng. 31, 1385–1396. doi:10.1016/j.soildyn.2011.05.015
Benavent-Climent, A., Cahís, X., and Vico, J. M. (2010). Interior wide beam-column connections in existing RC frames subjected to lateral earthquake loading. Bull. Earthq. Eng. 8, 401–420. doi:10.1007/s10518-009-9144-3
Benavent-Climent, A., Cahís, X., and Zahran, R. (2009). Exterior wide beam-column connections in existing RC frames subjected to lateral earthquake loads. Eng. Struct. 31, 1414–1424. doi:10.1016/j.engstruct.2009.02.008
A. Benavent-Climent, and F. Mollaioli (2021). Energy-based seismic engineering, proceedings of IWEBSE 2021 (Cham, Switzerland: Springer Nature).
Benavent-Climent, A., and Mota-Páez, S. (2017). Earthquake retrofitting of R/C frames with soft first story using hysteretic dampers: energy-based design method and evaluation. Eng. Struct. 137, 19–32. doi:10.1016/j.engstruct.2017.01.053
Benavent-Climent, A., Oliver-Saiz, E., and Donaire-Ávila, J. (2024). Seismic retrofitting of RC frames combining metallic dampers and limited strengthening with FRP/SRP applying energy-based methods. Soil Dyn. Earthq. Eng. 177, 108432. doi:10.1016/j.soildyn.2023.108432
Dolšek, M., and Fajfar, P. (2004). “IN2 – a simple alternative for IDA,” in Proceedings of the 13th World Conference on Earthquake Engineering, Vancouver, Canada, August, 2004.
Fajfar, P. (2000). A nonlinear analysis method for performance-based seismic design. Earthq. Spectra 16 (3), 573–592. doi:10.1193/1.1586128
Farrow, K. T., and Kurama, Y. C. (2003). SDOF demand index relationships for performance-based seismic design. Earthq. Spectra 19 (4), 799–838. doi:10.1193/1.1622955
Fujii, K. (2022). Peak and cumulative response of reinforced concrete frames with steel damper columns under seismic sequences. Buildings 12, 275. doi:10.3390/buildings12030275
Fujii, K. (2023). Energy-based response prediction of reinforced concrete buildings with steel damper columns under pulse-like ground motions. Front. Built Environ. 9, 1219740. doi:10.3389/fbuil.2023.1219740
Fujii, K. (2024). Critical pseudo-double impulse analysis evaluating seismic energy input to reinforced concrete buildings with steel damper columns. Front. Built Environ. 10, 1369589. doi:10.3389/fbuil.2024.1369589
Fujii, K., and Kato, M. (2021). Strength balance of steel damper columns and surrounding beams in reinforced concrete frames. Earthquake Resistant Engineering Structures XIII. WIT Trans. Built Environ. 202, PII25–36. doi:10.2495/ERES210031
Fujii, K., and Miyagawa, K. (2018). “Nonlinear seismic response of a seven-story steel reinforced concrete condominium retrofitted with low-yield-strength-steel damper columns,” in Proceedings of the 16th European Conference on Earthquake Engineering (Thessaloniki), Greece, June, 2018.
Fujii, K., and Shioda, M. (2023). Energy-based prediction of the peak and cumulative response of a reinforced concrete building with steel damper columns. Buildings 13, 401. doi:10.3390/buildings13020401
Fujii, K., Sugiyama, H., and Miyagawa, K. (2019). Predicting the peak seismic response of a retrofitted nine-storey steel reinforced concrete building with steel damper columns. Earthquake Resistant Engineering Structures XII. WIT Trans. Built Environ. 185, PII75–85. doi:10.2495/ERES190061
Gentry, T. R., and Wight, J. K. (1994). Wide beam-column connections under earthquake-type loading. Earthq. Spectra 10 (4), 675–703. doi:10.1193/1.1585793
Hori, N., and Inoue, N. (2002). Damaging properties of ground motions and prediction of maximum response of structures based on momentary energy response. Earthq. Eng. Struct. Dyn. 31, 1657–1679. doi:10.1002/eqe.183
Hori, N., Iwasaki, T., and Inoue, N. (2000). “Damaging properties of ground motions and response behavior of structures based on momentary energy response,” in Proceedings of the 12th World Conference on Earthquake Engineering, Auckland, New Zealand, January, 2000.
Hoveidae, N., and Radpour, S. (2021). Performance evaluation of buckling-restrained braced frames under repeated earthquakes. Bull. Earthq. Eng. 19, 241–262. doi:10.1007/s10518-020-00983-0
Inoue, N., Wenliuhan, H., Kanno, H., Hori, N., and Ogawa, J. (2000). “Shaking table tests of reinforced concrete columns subjected to simulated input motions with different time durations,” in Proceedings of the 12th World Conference on Earthquake Engineering, Auckland, New Zealand, 4 February 2000.
Katayama, T., Ito, S., Kamura, H., Ueki, T., and Okamoto, H. (2000). “Experimental study on hysteretic damper with low yield strength steel under dynamic loading,” in Proceedings of the 12th World Conference on Earthquake Engineering, Auckland, New Zealand, January 2000.
Kojima, K., Fujita, K., and Takewaki, I. (2015). Critical double impulse input and bound of earthquake input energy to building structure. Front. Built Environ. 1, 5. doi:10.3389/fbuil.2015.00005
Kojima, K., and Takewaki, I. (2015a). Critical earthquake response of elastic–plastic structures under near-fault ground motions (Part 1: fling-step input). Front. Built Environ. 1, 12. doi:10.3389/fbuil.2015.00012
Kojima, K., and Takewaki, I. (2015b). Critical earthquake response of elastic–plastic structures under near-fault ground motions (Part 2: forward-directivity input). Front. Built Environ. 1, 13. doi:10.3389/fbuil.2015.00013
Kojima, K., and Takewaki, I. (2015c). Critical input and response of elastic–plastic structures under long-duration earthquake ground motions. Front. Built Environ. 1, 15. doi:10.3389/fbuil.2015.00015
Kusuhara, F., Azukawa, K., Shiohara, H., and Otani, S. (2004). “Tests of reinforced concrete Interior beam-column joint subassemblage with eccentric beams,” in Proceedings of the 13th World Conference on Earthquake Engineering, Vancouver, Canada, August 2004.
Kusuhara, F., and Shiohara, H. (2008). “Tests of R/C beam-column joint with variant boundary conditions and irregular details on anchorage of beam bars,” in Proceedings of the 14th World Conference on Earthquake Engineering, Beijing, China, October 2008.
Mota-Páez, S., Escolano-Margarit, D., and Benavent-Climent, A. (2021). Seismic response of RC frames with a soft first story retrofitted with hysteretic dampers under near-fault earthquakes, Appl. Sci., 11, 1290, doi:10.3390/app11031290
Mukoyama, R. K., Fujii, K., Irie, C., Tobari, R., Yoshinaga, M., and Miyagawa, K. (2021). “Displacement-controlled seismic design method of reinforced concrete frame with steel damper column,” in Proceedings of the 17th world conference on earthquake engineering, Sendai, Japan, September, 2021.
Ruiz-García, J. (2012a). Mainshock-aftershock ground motion features and their influence in building's seismic response. J. Earthq. Eng. 16 (5), 719–737. doi:10.1080/13632469.2012.663154
Ruiz-García, J. (2012b). “Issues on the response of existing buildings under mainshock-aftershock seismic sequences,” in Proceedings of the 15th World Conference on Earthquake Engineering, Lisbon, Portugal, 24-28 September 2012.
Ruiz-García, J., and Negrete-Manriquez, J. C. (2011). Evaluation of drift demands in existing steel frames under as-recorded far-field and near-fault mainshock–aftershock seismic sequences. Eng. Struct. 33, 621–634. doi:10.1016/j.engstruct.2010.11.021
Shirai, K., Okano, H., Nakanishi, Y., Takeuchi, T., Sasamoto, K., Sadamoto, M., et al. (2024). Evaluation of response, damage, and repair cost of reinforced concrete super high-rise buildings subjected to large-amplitude earthquakes. Jpn. Archit. Rev. 7, e12418. doi:10.1002/2475-8876.12418
Tesfamariam, S., and Goda, K. (2015). Seismic performance evaluation framework considering maximum and residual inter-story drift ratios: application to non-code conforming reinforced concrete buildings in Victoria, BC, Canada. Front. Built Environ. 1, 18. doi:10.3389/fbuil.2015.00018
Toyoda, S., Kuramoto, H., Katsumata, H., and Fukuyama, H. (2014). Earthquake response analysis of a 20-story RC building under long period seismic ground motion. J. Struct. Constr. Eng. Trans. AIJ. 79 (702), 1167–1174. (in Japanese). doi:10.3130/aijs.79.1167
Vamvatsikos, D., and Cornell, C. A. (2002). Incremental dynamic analysis. Earthq. Eng. Struct. Dyn. 31, 491–514. doi:10.1002/eqe.141
H. Varum, A. Benavent-Climent, and F. Fabrizio Mollaioli (2023). Energy-based seismic engineering, proceedings of IWEBSE 2023 (Cham, Switzerland: Springer Nature).
Keywords: reinforced concrete moment-resisting frame, steel damper column, seismic capacity, pseudo-multi impulse (PMI), incremental critical pseudo-multi impulse analysis (ICPMIA), maximum momentary input energy, peak displacement
Citation: Fujii K (2024) Seismic capacity evaluation of reinforced concrete moment-resisting frames with steel damper columns using incremental critical pseudo-multi impulse analysis. Front. Built Environ. 10:1431000. doi: 10.3389/fbuil.2024.1431000
Received: 11 May 2024; Accepted: 31 May 2024;
Published: 03 July 2024.
Edited by:
Izuru Takewaki, Kyoto Arts and Crafts University, JapanReviewed by:
Raffaele Laguardia, Sapienza University of Rome, ItalyCopyright © 2024 Fujii. This is an open-access article distributed under the terms of the Creative Commons Attribution License (CC BY). The use, distribution or reproduction in other forums is permitted, provided the original author(s) and the copyright owner(s) are credited and that the original publication in this journal is cited, in accordance with accepted academic practice. No use, distribution or reproduction is permitted which does not comply with these terms.
*Correspondence: Kenji Fujii, a2VuamkuZnVqaWlAcC5jaGliYWtvdWRhaS5qcA==
Disclaimer: All claims expressed in this article are solely those of the authors and do not necessarily represent those of their affiliated organizations, or those of the publisher, the editors and the reviewers. Any product that may be evaluated in this article or claim that may be made by its manufacturer is not guaranteed or endorsed by the publisher.
Research integrity at Frontiers
Learn more about the work of our research integrity team to safeguard the quality of each article we publish.