- Northern Tornadoes Project, Faculty of Engineering, Western University, London, ON, Canada
During windstorm events buildings can represent both wind-borne debris source and target elements. Roof cover can fail and be blown away, impacting the surrounding construction, reaching significant distances. Analytical models to calculate debris trajectories generally consider the flight to occur in uniform flow. These models are, therefore, not considering source building aerodynamics, yielding results that can be significantly overestimated. This paper defines Udebris, the equivalent uniform wind speed that leads to the analytical solutions in roof cover flight assessment that matches the available datasets that considers source building aerodynamics. To calculate Udebris, the concept of response time is introduced: t* is a parameter that physically captures the tendency of debris elements to fly with the wind gust. The identification of these times, typical for each roof cover type, leads to a selection of a gust factor, G, to account for the debris response. Roof/wake factors (FR) are also used for Udebris calculation, based on roof cover type, locations on the roof, neighborhood settings. These last factors are estimated based on t*, on the boundary layer that develops on the source building roof slope, and on considerations about turbulence effects. A Monte Carlo simulation-based approach for estimating roof cover element flight trajectories is, therefore, presented and validated against experimental datasets. The results indicate alignment with experimental observations, underscoring the potential utility of this approach for dealing with wind-borne debris issues in disaster preparedness, building technology, and structural design.
1 Introduction
Extreme wind events affect the urban environment, often heavily damaging buildings (Minor et al., 1972). One of the major causes of building damage is due to wind-borne debris impacts (Nishimura et al., 2009), especially on the building envelope (Minor, 1994; Minor, 2005). In extreme storms, roof cover elements, in particular, can be blown away, endangering people and property by impacting surrounding buildings at high speed (Butler and Kareem, 2012; ASCE, 2014). Roof covering elements such as gravel ballast, roof tiles, shingles, and sheathing panels installed on low-rise buildings are frequently observed to fail, transforming them into potentially deadly projectiles that can traverse considerable distances (Kordi and Kopp, 2011). The threat they pose to life and property underscores the urgency of understanding their flight trajectories and speeds.
The first wind-borne debris trajectory analyses (Tachikawa, 1983; Holmes et al., 2006a; Lin et al., 2006) considered debris elements that are free to fly in a uniform flow. Visscher and Kopp (2007) and Kordi and Kopp (2011) studied how the flight of roof components are affected by the source building aerodynamics, the wind field around the building, and turbulence effects. Kordi and Kopp (2011) improved the understanding of the real-world problem by bringing in more accurate boundary and initial conditions. These observations were possible because, instead of simulating the debris flight in a uniform flow from an initial wind angle of attack (Tachikawa, 1983; Holmes et al., 2006a; Lin et al., 2006; Figure 2), these studies included scaled models of buildings using a failure model approach. As such, both the failure from the source building and the debris flight were simulated. The debris elements were located on a gable roof with a slope of 4:12, plan dimensions of 10.38 × 9.14 m, and an eave height of 6.8 m, representative of a typical North American 2-storey house. In the tests, the hold-down forces of these building components were scaled and implemented using magnets. The capacity and the failure mechanism of the objects had to be known prior to testing so they could be modelled (Surry et al., 2005). Through this approach, the gust wind speed causing the failure could be measured. Accordingly, the capacity was deterministic, but the wind loads and the flights were stochastic.
The Visscher and Kopp (2007) and Kordi and Kopp (2011) results highlighted that the distributions and maximum values of the debris flight distances depend on the mode of flight, the initial location of the element on the roof, the wind angle, and the surroundings (neighborhood buildings). For example, roof tiles typically fly at 30%–60% of the 3-s gust failure wind speed, asphalt shingles at 40%–120%, and sheathing panels at 20%–95%. Accordingly, the 3-s gust failure wind speed of the roofing component represents a practical upper-bound wind speed to estimate the upper-bound flight trajectory with a debris flight model, at least for these debris types. However, the 3-s gust speed will overestimate the mean trajectory. Evidently, roofing-element debris can “miss” the wind gust and, consequently, when the failure occurs, they will accelerate and fly in “lower wind speeds environments” (Kordi and Kopp, 2011). Kordi et al. (2010) explained this as the effect of a negative vertical component of the wind velocity, which is not typically considered in the numerical calculations, but which is correlated with peak gust speeds. Additionally, when the source building is in the wake region behind an upstream building, as depicted in Figure 1, there is a tendency to further reduce the trajectory below uniform, smooth flow trajectory results. For these plate-like debris elements (Wills et al., 2002), it has been found (Kordi et al., 2010; Kordi and Kopp, 2011) that the lower bound wind speed to estimate debris trajectories with uniform flow would be the 10-min mean wind speed at the source building roof height (
It is well established that the failure gust speed for a given roof element depends on the strength (capacity), the building shape and size, the location on the roof, the terrain and surroundings, and the wind direction. However, there is little information regarding the flow on the roof and in the wakes of buildings, noting the exceptions of works like Wu et al. (2017), Sengupta and Sarkar (2018), Akon and Kopp (2016); Akon and Kopp (2018). This makes developing models for debris trajectories challenging. For example, Grayson et al. (2012) developed a probabilistic model based on Kordi and Kopp (2011) data. They used a Monte Carlo simulation varying speed over the wide ranges. Use of Computational Fluid Dynamics is also possible (Lyu et al., 2023; Huo et al., 2020; Baker and Sterling, 2017; Hargreaves et al., 2014; Kalimpa et al., 2012); although this is still relatively costly, it has a lot of potential for leading to more general guidance.
Taking inspiration from the use of the simplified uniform model of Peterka et al. (1997) and Cochran et al. (1999), which can work well with probabilistic models (e.g., Grayson et al., 2012), we investigate the use of multiplication factors to capture the local wind field effects above the roofs and in the wakes of source buildings. Additionally, debris elements take time to accelerate from rest to a significant speed. This can be represented as a response time factor, which can capture the difference between heavier and lighter elements when accelerating. The objective of this paper is to develop an equivalent uniform wind speed that will capture the trajectories of debris elements originating on roofs of low-rise buildings considering the factors that affect the flight, viz., the speed of flow near the roof, the wind speed in the wake, the response time of the object. In particular, we examine the possibility of using a model of the form:
where Udebris is the equivalent uniform wind speed that leads to the trajectory,
2 Debris flight equations in uniform flow
2.1 Roof elements
Three different roof covering types are considered: tiles, asphalt shingles, and sheathing panels. The dimensional characteristics used in the current study are provided in Table 1. These three elements were chosen based on available trajectory data that are used to validate the model. They can all be categorized as “plate-like” under the Wills et al. (2002) classification. Failure wind speeds and trajectories are obtained from the experimental studies developed for these three roof components by Visscher and Kopp (2007) and by Kordi and Kopp (2011). For roof gravel, which is loose-laid on the surface, failures occur under different mechanisms and is not examined further here; the reader is referred to Doddipatla and Kopp (2019) for a recent review. For rod-like debris (Wills et al., 2002) such as 2 × 4s, the flight mechanisms would involve, first, the failure of the building structure (e.g., a roof truss) and then, second, disconnecting of individual 2 × 4s from those elements (e.g., a 2 × 4 from the truss). There are no data available for this process from failure to flight.
2.2 Debris trajectory model
2.2.1 Equations of motion
The first wind-borne debris studies to assess flight and trajectory were developed by Twisdale et al. (1979) and Tachikawa (1983); Tachikawa (1988). Tachikawa demonstrated that plate-like debris trajectories in a smooth, uniform flow depend on the initial angle of attack. Considerable variation is caused by the mode of flight, which can be autorotational, translational, or intermediate between the two. Twisdale et al. (1979) developed debris-flight models for tornado wind fields.
Considering Figure 2, the equations of motion for a general debris object are:
with the terms defined in the nomenclature section. Baker (2007) proposed a non-dimensional form for the variables and, accordingly, the non-dimensional form of the equations of motion becomes:
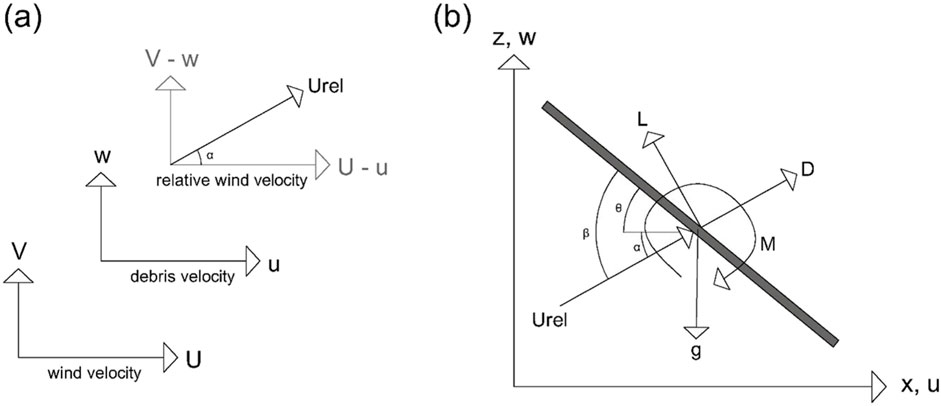
Figure 2. Definition sketch of (A) the wind speed relative to the plate, and (B) the forces acting on the plate.
Tachikawa (1983) offered, as well, non-dimensional versions of the equations of motion and identified the dimensionless parameter that has since been named in his honor (Holmes et al., 2006a): the Tachikawa number, Ta
Tachikawa (1983) suggested a method to account for turbulence effects by varying the initial angle of attack of the wind, with reference to the plate-like debris axis. Therefore, in the current study, six angles of attack are considered as the initial angles of attack for trajectory calculations. This approach, however, does not simulate the true physics of debris trajectories where case-specific source building aerodynamics and turbulence effects alter the trajectories (Visscher and Kopp, 2007). Rather, these initial angles of attack allow for a simple method to enhance variability.
2.2.2 Aerodynamic model
Lin et al. (2006), Holmes et al. (2006a), Holmes (2015), Richards et al. (2008), and Kordi and Kopp (2011) conducted flight analyses for different wind-borne debris typologies in uniform wind flow, using Equations (2)–(4) with a quasi-steady aerodynamic model. Following Tachikawa’s work (1983), Kordi and Kopp (2011) developed the aerodynamic drag, lift, and moment coefficients for both the static (
with:
defined following Kordi and Kopp (2011) and based on Iversen (1979). The non-dimensional moment of inertia of a plate (I*) is
with the other terms defined in the nomenclature.
To define the static components of drag, lift, and moment coefficients, the definition (Kordi and Kopp, 2011; Hoerner, 1965) of the static normal coefficient on the plate (CN) is:
Accordingly:
with:
c = center of pressure, which, for plates with AR = 4, follows:
Based on Kordi et al. (2009), through analytical and experimental simulations, the flight of their case-study debris was analyzed assuming S0 = 0.47 (Skews, 1990).
3 Model development
3.1 Response times and gust factors
Roofing element failures occur because of gust wind speeds. The 3-s gust wind speed is usually adopted since this connects to aerodynamics typically used in design standards such as ASCE, 2022. To perform debris trajectory analysis, it is usually assumed that the wind speed at the initiation of flight remains constant for the duration of the debris flight (e.g., Lin et al., 2006; Grayson et al., 2012). However, the actual duration of failures (e.g., the time for complete nail withdrawal for sheathing panels) is often a fraction of a second for roof covering elements (e.g., Kopp et al., 2012), so gust wind speeds of a shorter duration are of relevance for the failure. Additionally, following the failure, it takes some time for the element to accelerate from an initial speed of zero, during which time the local wind speed near the element changes. The purpose of this section is to examine this issue.
As an example, we use the equations of motion Equations 5–7 together with a typical 3-s gust speed of 40 m/s for three types of debris. Figure 3 presents the results in a non-dimensional form with both the non-dimensional displacement
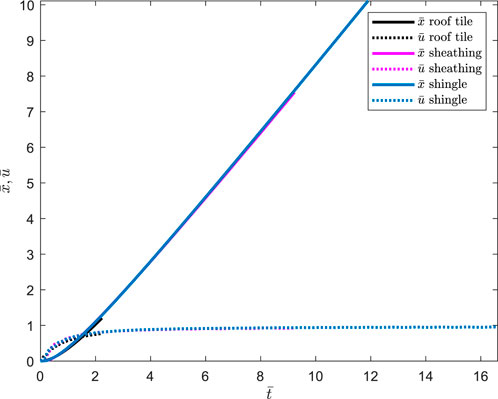
Figure 3. Non-dimensional time
Figure 4 depicts the dimensional trajectories of roof tiles, sheathing panels, and shingles, for a wind speed of 40 m/s. Even in the first moments of flight, e.g., t = 0–0.1 s, there is a significant difference in terms of the overall displacements. For instance, roof tiles move about 0.1 m, whereas shingles move about 10 times further, for about 1 m. After 3 s of flight, the difference in total distance is equal to 35 m, with the roof tiles moving about 65 m and shingles about 100 m, almost two times further (neglecting the presence of the ground plane). Considering the nature of a failure inducing gust, the likelihood of these elements travelling in the same wind environment is minimal, which will alter the overall trajectories significantly. Physically, examining these roof component behaviors in Figure 4, it can be seen that roof shingles and sheathing panels fly larger distances in the along wind than roof tiles, while also elevating vertically in the initial stage of flight.
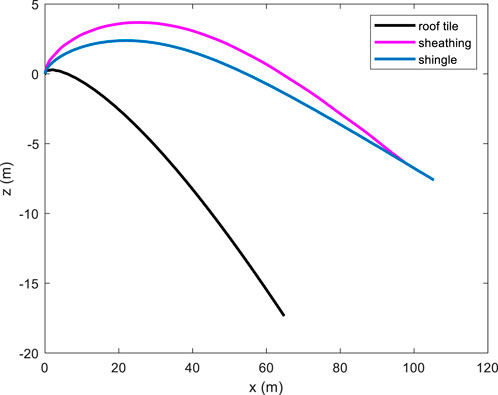
Figure 4. Plots of the trajectories for asphalt shingles, tiles, and sheathing in a wind speed of 40 m/s for t = 3 s. Shingles and sheathing panels experience a significant uplift in the initial stage of the flight, whereas roof tiles start immediately a trajectory towards the ground. In the time interval of 3 s, roof tiles are observed to fly for a maximum of 65 m in the along wind direction, whereas sheathing panels and shingles are respectively reaching 98 m and 105 m respectively. Moreover, roof tiles start immediately to fall (z direction), whereas the other roof elements present a significant uplift at flight initialization.
Considering the non-dimensional
The gust factor G (Equation 18) is the ratio of the expected maximum gust speed within a specified period to the mean wind speed (Holmes et al., 2006b):
where
Figure 5 depicts G values for synoptic winds, for a sample time of 600 s, plotted against the gust duration, for a value of the ratio of turbulence length scale to mean wind speed of 10 s. Lu/
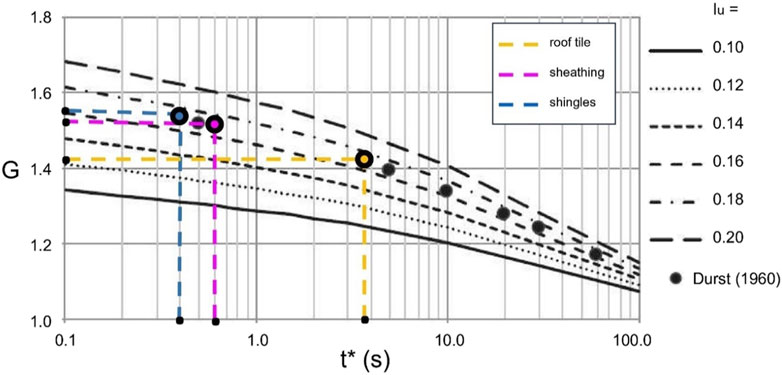
Figure 5. Gust factors as a function of turbulence intensity, for Lu/
Using the t* associated with the plate speed of 80% of the asymptotic limit, G values are reported in Table 2 for turbulence intensity Iu = 0.175, relative to a 10-min mean wind speed. The shingles and sheathing panels have similar G values of 1.57 and 1.56, respectively, while tiles have G = 1.42. These values can be used with Equation 1 to estimate the debris flight trajectory, as discussed further below.

Table 2. Gust factors, G, for t* durations for roof elements for
3.2 Roof boundary layer effects
Wind speeds on roofs of low-rise buildings are generally associated with speed-ups (e.g., Peterka et al., 1997; Cochran et al., 1999). However, this is a simplification, since the flow first decelerates as it approaches the building, leading to positive pressures on windward walls. The flow then accelerates to the roof edge, decreasing the pressure near the top of the wall and on the roof. The flow often separates at the roof edge (unless the slope is high), and then reattaches on the roof, with a boundary layer growing on the surface downstream of reattachment. With all this variation, it is not clear whether a single factor can capture these effects. This point is investigated herein.
To develop factors that account for the wind speed near the roof surface, data are needed in this region for geometries for which debris trajectory data are available. Since Visscher and Kopp (2007) and Kordi and Kopp (2011) data are available from two-story gable roof houses with 4:12 roof slopes, similar roof wind speed data are needed. Such data are limited, although reasonably similar cases are available via data taken from Kopp and Sarathi (2010). However, only one wind direction was measured, orthogonal to the ridge of the roof. A Particle Image Velocimetry (PIV) system was configured to measure the two-dimensional velocity field at the midpoint of the roof, parallel to the flow direction. Kopp and Sarathi (2010) investigated the wind field above a gable roof of a low-rise building roof with a slope of 4:12, plan dimensions of 10.38 × 9.14 m (full-scale), an eave height of 6.8 m. Kopp and Sarathi (2010) measured the boundary layer profiles perpendicular to the roof. The mean wind speeds parallel to the roof surface are depicted in Figure 6 for the 4:12 roof slope, revealing the development of the boundary layer downstream of reattachment point. There is an apparent acceleration in flow speed towards the ridge. It is noteworthy that a distinctive characteristic of converging flow or flow, i.e., with a favorable pressure gradient, due to acceleration of the flow with increasing distance from the eaves. The longitudinal integral length scales were estimated at a position 0.5 m above the roof surface. Using the time correlation of the horizontal component of the velocity and Taylor’s hypothesis these are in the range of 5–15 m, depending on the position on the windward slope of the 4:12 gable roof. These scales indicate that there is a reasonable distance near the windward roof surface that a debris element can accelerate in a reasonably uniform gust. Thus, a single factor may be a practical and reasonable factor for a given roof slope. On the leeward side of the ridge, the large-scale flow separation implies a much lower speed flow in the initial stages of flight, as described by Kordi and Kopp (2011). The leeward roof is affected by turbulence effects, which can be qualitatively visualized in studies such as Sousa and Pereira (2004), who studied a gable roof with a slope equal to 30° (≈7:12). Since the flow in the lee of the ridge is reasonably independent of the slope, a single factor, regardless of roof slope may be appropriate in this part of the roof.
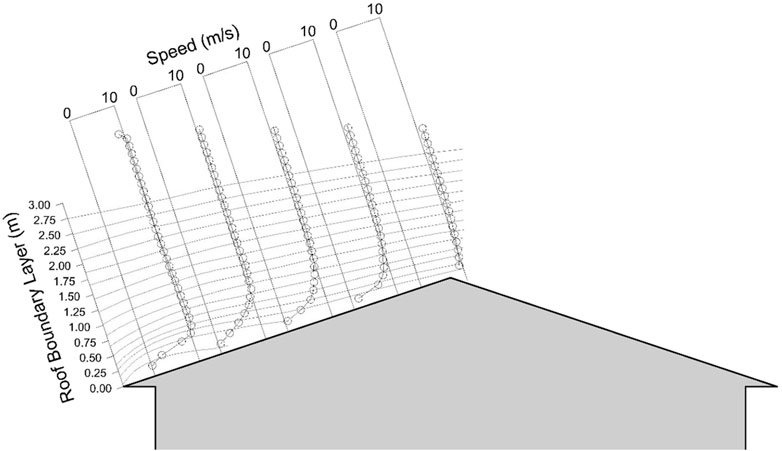
Figure 6. Mean velocity profiles perpendicular to the roof surface (based on Kopp and Sarathi, 2010).
3.3 Wind speeds and determination of FR
Adding further challenge to the problem is the presence of wakes behind all buildings. The length of the trajectory is a key factor in how these flow regions affect the wind acting on the debris element. Figure 1 provides a schematic representation of flow these fields. If one assumes the wake does not grow rapidly such that the bulk of the trajectory is above the wake region, one may assume wake effects can be effectively neglected and the roof flow field governs.
The complexity and variability of the flow above the roof (discussed in the previous section) and both upstream and downstream of the building implies that a single factor to account for these may be a challenge. However, the objective is to find an equivalent uniform wind speed that yields approximately equivalent trajectories. Here, we examine this approach using the data of Visscher and Kopp (2007) and Kordi and Kopp (2011). Hence, it is proposed to use a factor, FR (Table 3), in Equation 1, which is dependent on roof slope, roof position, wind direction, and surrounding building setting.

Table 3. FR values for roof elements as a function of position on the roof, surrounding buildings, and wind direction.
A Monte Carlo simulation is used to estimate flight trajectories from the roof elements using various uniform wind speeds in order to identify FR values. Thus, FR is calculated by trial and error and for each roof element, position, neighborhood configuration, and wind direction. The steps of the Monte Carlo analysis are as follows.
1. Sample the failure wind speed (
2. Identification of G factors (Table 2) for each roof cover element, based on the dimensional response time, t*.
3. Estimate FR and calculate Udebris, using Equation 1.
4. Calculate the analytical flight trajectory by solving Equations 2–4 via a fourth-order Runge-Kutta scheme. The aerodynamic coefficients required for the trajectory calculation, including lift, drag, and moment coefficients, were computed dynamically at each time step using the formulations provided in Equations 8–17.
5. Step 4 is repeated with six different initial angles of attack (θ = 0°, 30°, 60°, 90°, 120°, 150°), to account for local turbulence effects, based on the concept developed by Tachikawa (1983).
6. Repeat steps 1 to 5 for Ntotal times (in the analytical results presented herein Ntotal = 1000).
7. Experimental and analytical flight trajectory probability distributions are created.
8. Best values of FR are identified from the simulation data, for which the analytical trajectory distributions are the best match to the experimental ones (for each roof cover element, roof position, neighborhood configuration, and wind direction).
In step 1, the distribution for the failure wind speeds comes from Visscher and Kopp (2007) and Kordi and Kopp (2011) which form a Gaussian distribution and a coefficient of variation of 25%. FR was varied, between values of 0.29 and 1.18 in steps of 0.01, linearly, for each configuration. Figure 7 depicts the positions on the roof for each isolated building, while Figure 8 depicts the surrounding buildings’ configurations.
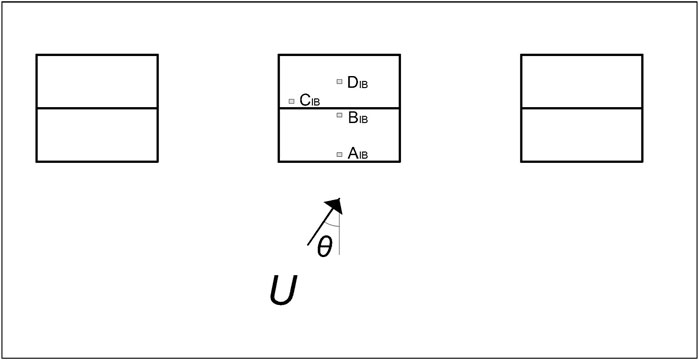
Figure 7. Sketch of the plan configuration and the roof element positions for the isolated buildings configurations.
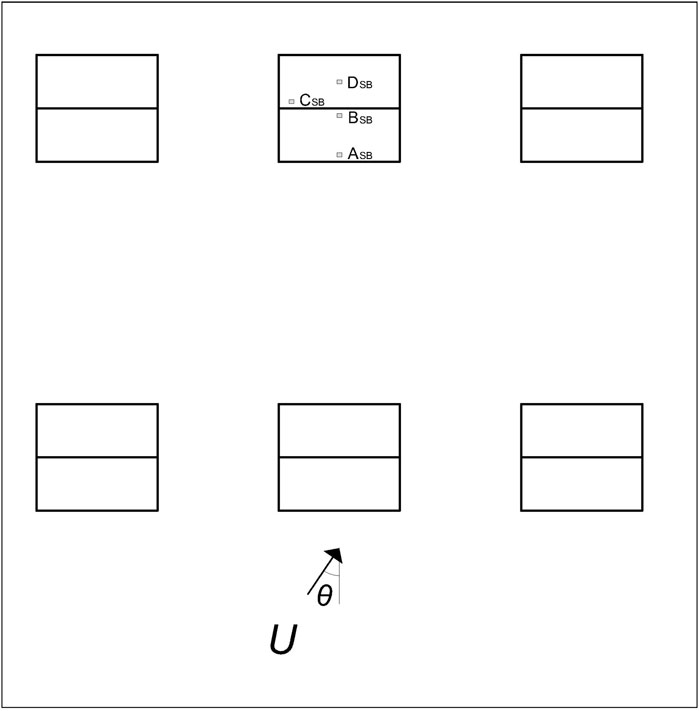
Figure 8. Sketch of the plan configuration and the roof element positions for the surrounding buildings configurations.
4 Results and limitations
Table 4 depicts the results from the nine available configurations (Configs. 1–9), with the results graphically reported in Figures 9–17, for the optimum FR values (Table 3). Included in each figure are “analytical results with
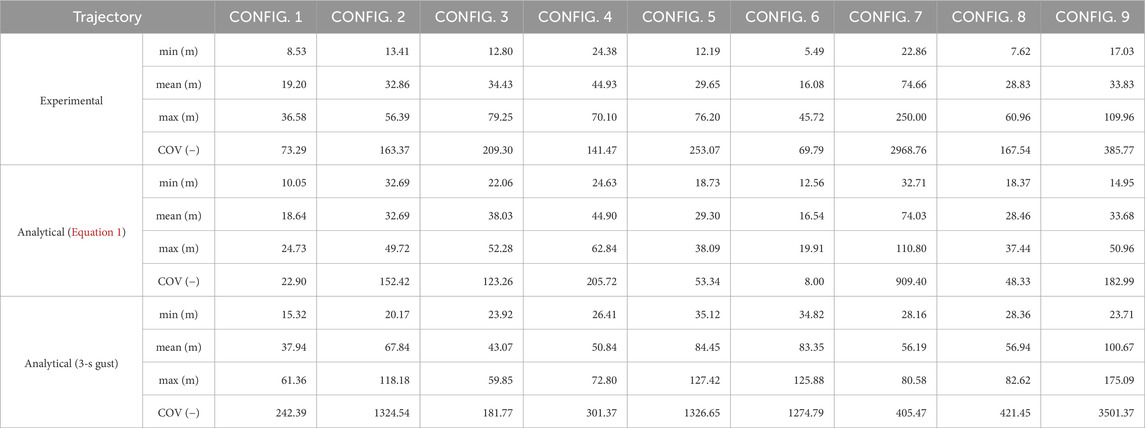
Table 4. Experimental, analytical (Equation 1), and analytical (3-s gust) flight trajectories for various roof element configurations (Config. 1 – Config. 9).
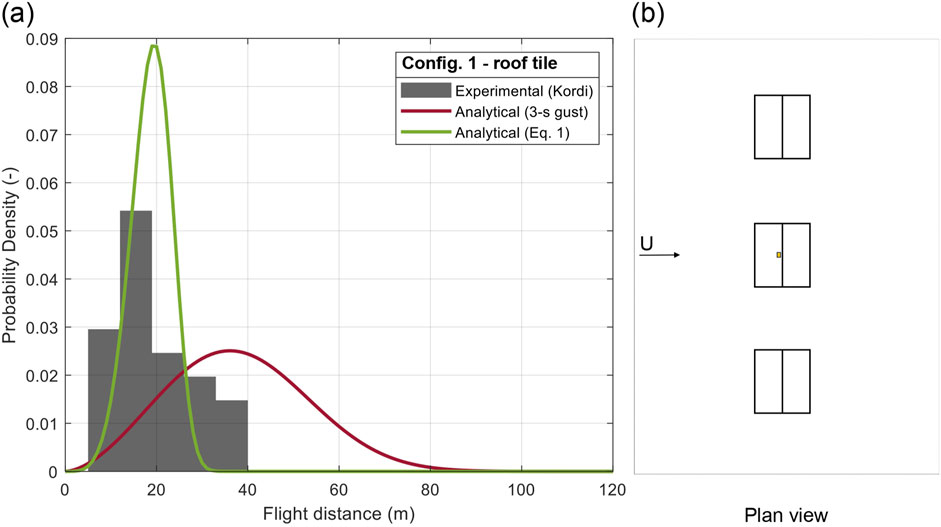
Figure 9. (A) PDF of flight distance of roof tiles and (B) plan configuration 1.
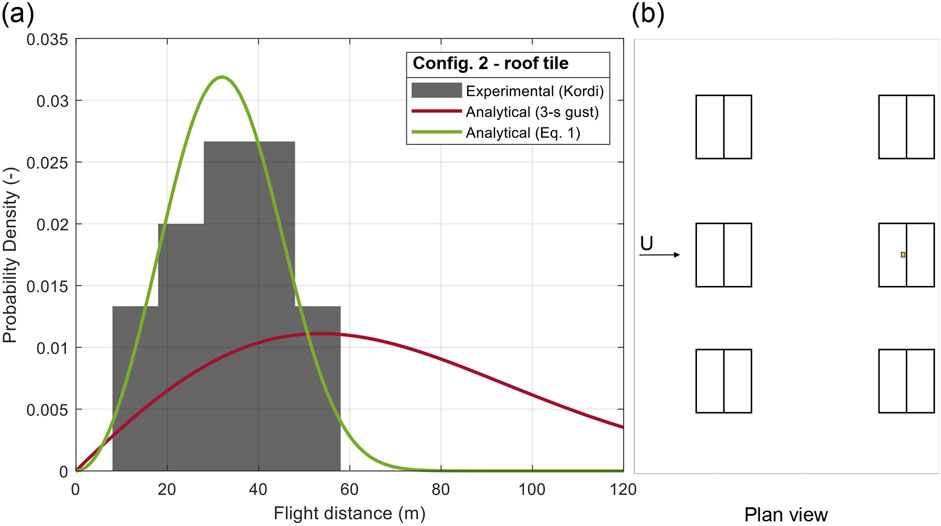
Figure 10. (A) PDF of flight distance of roof tiles and (B) plan configuration 2.
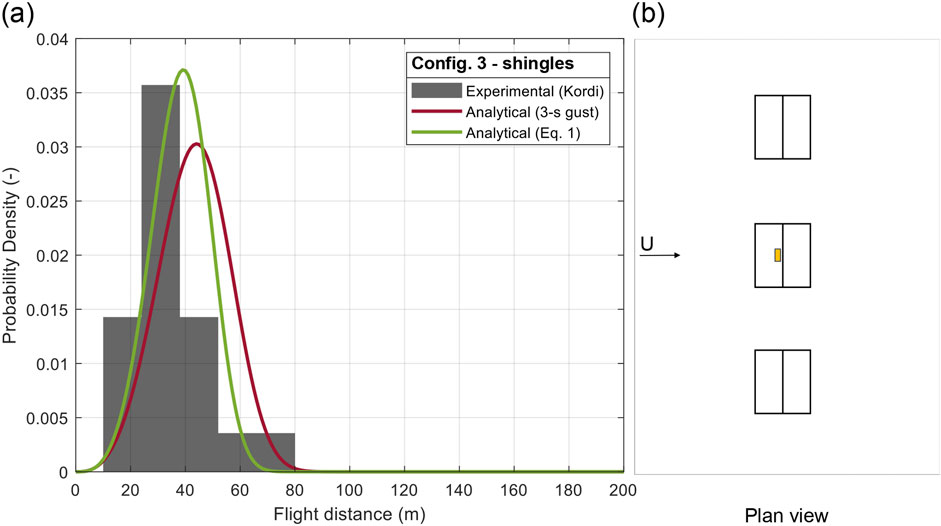
Figure 11. (A) PDF of flight distance of roof shingles and (B) plan configuration 3.
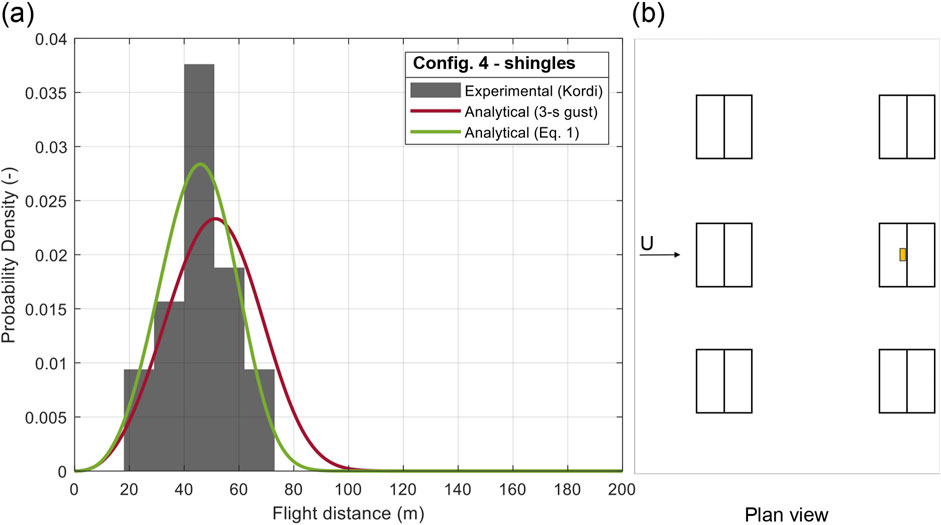
Figure 12. (A) PDF of flight distance of roof shingles and (B) plan configuration 4.
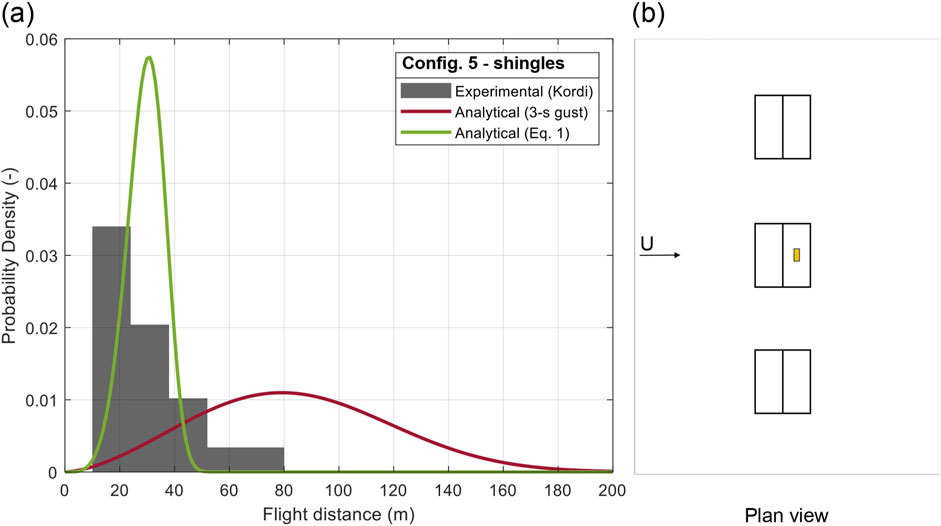
Figure 13. (A) PDF of flight distance of roof shingles and (B) plan configuration 5.
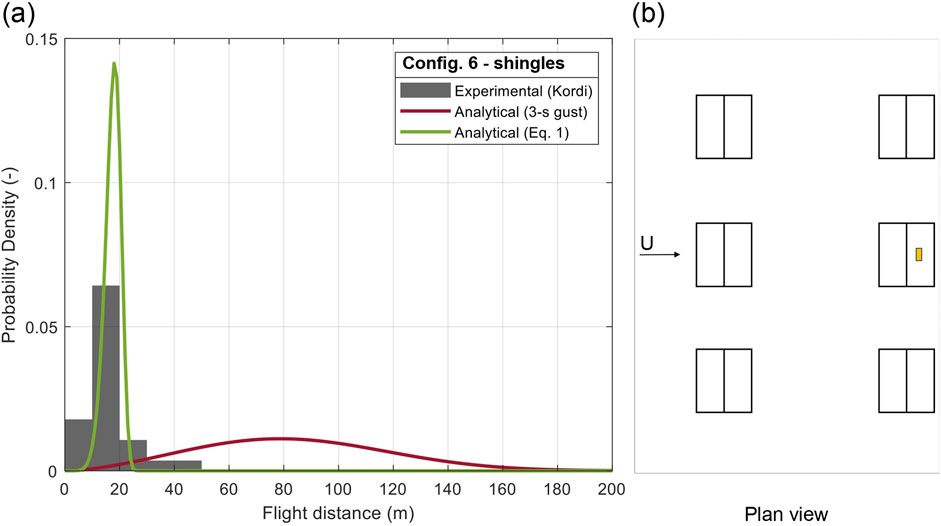
Figure 14. (A) PDF of flight distance of roof shingles and (B) plan configuration 6.
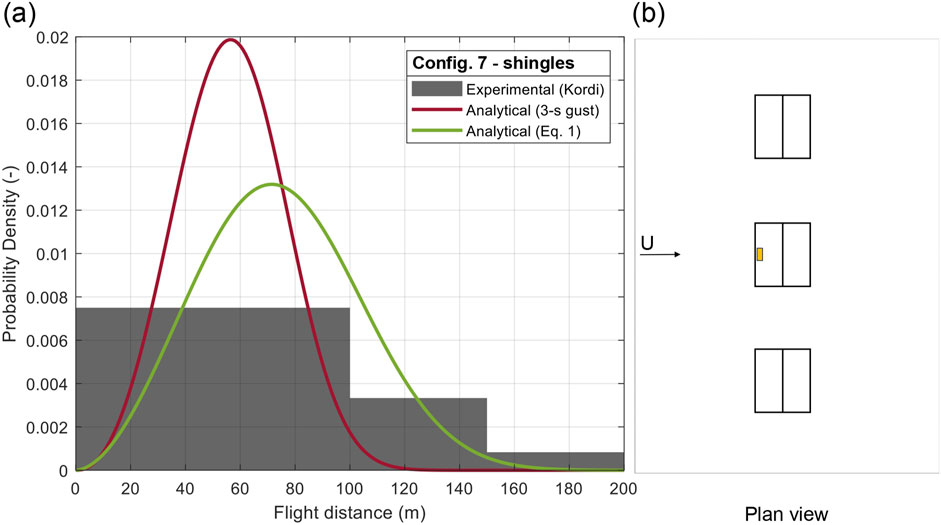
Figure 15. (A) PDF of flight distance of roof shingles and (B) plan configuration 7.
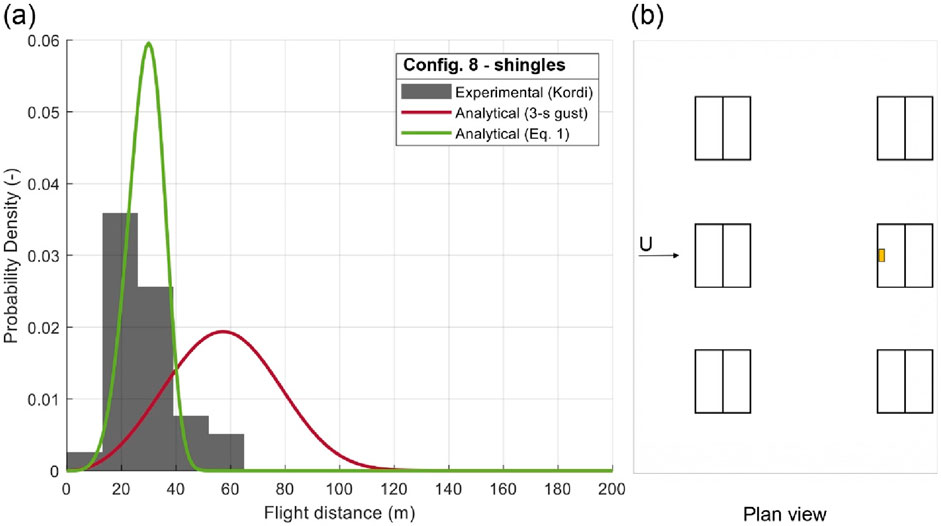
Figure 16. (A) PDF of flight distance of roof shingles and (B) plan configuration 8.
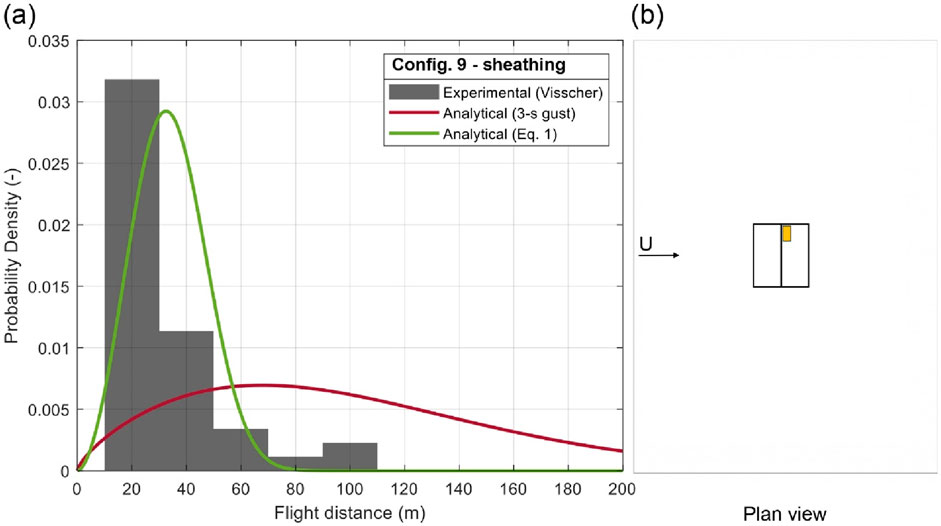
Figure 17. (A) PDF of flight distance of roof sheathing panel and (B) plan configuration 9.
Figures 9, 10 depict the trajectory distributions for roof tiles located on the central windward ridge area of the 4:12 gable roof, in settings with one (BIB, Figure 9) or two rows (BSB, Figure 10) of buildings. Both G and FR factors used in Equation 1 to calculate the trajectories are the same ones (reported in Table 2, 3). Several observations can be made. The experimentally-observed flight distances increase because of the significantly increased failure wind speed when a row of houses is placed upstream. The estimated factors with variation induced by the variation in the failure wind speeds and initial angle of attack allow a reasonable distribution to be obtained, as indicated by Table 4. Using Udebris the minimum, mean, and maximum trajectories are within 17.82%, −2.90%, and −32.40%, respectively of the experimental values for Config. 1. The COV was within −68.75%. Whereas, comparing the experimental data with the analytical results obtained using
Configs. 3–8 (Figures 11–16) report six case-studies for roof shingles in various configurations. Config. 3 and Config. 4 (Figures 11, 12) are examples of the same building configurations and cover element locations discussed for roof tiles (i.e., Config. 1 and Config. 2, in Figures 9, 10). As for the roof tiles, the use of constant factors, G and FR, work for the two surrounding neighborhood configurations. However, because the shingles respond so much faster, FR is 18% larger, which we attribute to it moving away from the roof surface much rapidly.
In Configs. 5 and 6 (Figures 13, 14), the results for shingles positioned on the leeward side of the ridge are presented. Kordi and Kopp (2011) discuss this configuration, where the shingles are on the leeward side of the ridge, in a region of separated flow with the local flow direction opposite to the bulk wind direction. This clearly lends to a higher likelihood of the shingle “missing the gust”, which leads to a significantly reduced factor, FR. A range of FR values between 0.29 and 0.41 appears to work well with this data. The building setting of Config. 5 is less disturbed from the construction positioned in front of the windward side of the building and this drives to higher values of FR for trajectory calculation (FR = 0.41). However, the observed range of values is too low such that maximum trajectories are missed relying on Equation 1 for the Monte Carlo simulation. Thus, to capture the worst case (i.e., longest) flights, a higher value of FR would be required. This also points to limitations in relying on angle-of-attack variations to estimate trajectory variation.
In Config. 7 and Config. 8 (Figures 15, 16), the results for shingles positioned on the windward side of the two case-study settings are presented. These roof elements’ locations are close to the gable roof eave, in which there a speed-up effect is observed. For roof building elements with a short response time t* = 0.4 s such as, in these cases, shingles, the speed-up effect is affecting the flight behavior of these building components (Peterka et al., 1997; Cochran et al., 1999). For Config. 7, a factor FR (AIB) = 1.18 results appropriate to capture the mean experimental trajectory results. Also in this case, maximum trajectories are missed and the error is −55.68%. For shingle Config. 8, the adequate FR factor to capture mean trajectory results, and be used in Equation 1, is smaller than the. In fact, for the windward eave side of the roof, when the setting has two rows of buildings (Figure 16), the roof cover element is highly affected by the presence of the upwind buildings and by the consequent creation of a wake region in between the two building rows. Accordingly, the FR used to calculate the flight distances, is in this case FR (ASB) = 0.57. Also in this case, the analytical results that match the mean values, are missing maximum experimental results (the error is −38.59%).
In Figure 17, Config. 9 is the only one reporting the trajectory for a roof sheathing panel positioned on the leeward roof slope (position CIB) of an isolated source building, due to limited experimental data for this roof cover typology. The panel is, moreover, located towards the ridge of the leeward slope of the gable roof, introducing complexity to the problem for the lack of symmetry in the system. We notice that, also for this case, the roofing component element placed on the leeward side of the roof has flight distances that are overestimated for one order of magnitude if
5 Conclusion
Wind-borne trajectories can be calculated using the second order equations of motions combined with an aerodynamic model. These equations are often used to estimate debris flight with the assumption of uniform flow (Tachikawa, 1983; Holmes et al., 2006a; Lin et al., 2006); however, real scenarios are influenced by the source building aerodynamics and turbulence in the wind. In this paper, the use of adjustment factors to account for the debris element characteristics and the effects of the source building are examined with the uniform flow model. A gust factor (G) is used to account for the response time of a specific roof cover element. This is defined as the time for the debris element to reach 80% of the 3-s gust failure wind speed. Based on t*, typical gust factor for the roof cover types is identified, for each case-study. The second factor (FR) is to account for the local flow above the roof and in the wake. This factor is found to depend on roof position, most importantly whether the source position is in attached flow or in separated flow, and on the surroundings, whether the position is in a wake region or not. The use of these factors with trajectory variation enabled by variations in the failure gust speed and initial angle of attack lead to reasonable estimation of trajectory statistics for mean values. This model, however, has some limitations for the results of maximum trajectories.
It is recommended that further experimental campaigns are necessary to refine and enhance the accuracy of the analytical model and to implement FR datasets. Such campaigns would contribute to a more comprehensive understanding of debris trajectories, based on debris characteristics and source building aerodynamics. Currently, there are FR coefficients for only a few locations on the roof and for only one wind direction. An extensive campaign for various wind directions and roofing component types would be beneficial to enable and/or ensure generality of the method.
Data availability statement
The original contributions presented in the study are included in the article/supplementary material, further inquiries can be directed to the corresponding author.
Author contributions
AM: Writing–original draft, Writing–review and editing. GK: Writing–review and editing.
Funding
The author(s) declare that financial support was received for the research, authorship, and/or publication of this article. The authors are grateful to the Natural Sciences and Engineering Research Council (NSERC) of Canada through the Discovery Grants program and by ImpactWX who provided partial financial support for this work.
Conflict of interest
The authors declare that the research was conducted in the absence of any commercial or financial relationships that could be construed as a potential conflict of interest.
Publisher’s note
All claims expressed in this article are solely those of the authors and do not necessarily represent those of their affiliated organizations, or those of the publisher, the editors and the reviewers. Any product that may be evaluated in this article, or claim that may be made by its manufacturer, is not guaranteed or endorsed by the publisher.
References
Akon, A. F., and Kopp, G. A. (2016). Mean pressure distributions and reattachment lengths for roof-separation bubbles on low-rise buildings. J. Wind Eng. Industrial Aerodynamics 155, 115–125. doi:10.1016/j.jweia.2016.05.008
Akon, A. F., and Kopp, G. A. (2018). Turbulence structure and similarity in the separated flow above a low building in the atmospheric boundary layer. J. Wind Eng. Industrial Aerodynamics 182, 87–100. doi:10.1016/j.jweia.2018.09.016
Baker, C. J. (2007). The debris flight equations. J. Wind Eng. Industrial Aerodynamics 95, 329–353. doi:10.1016/j.jweia.2006.08.001
Baker, C. J., and Sterling, M. (2017). Modelling wind fields and debris flight in tornadoes. J. Wind Eng. Industrial Aerodynamics 168, 312–321. doi:10.1016/j.jweia.2017.06.017
Butler, K., and Kareem, A. (2012). “Anatomy of glass damage in urban areas during hurricanes,” in Advances in hurricane engineering: learning from our past, proceedings of the ATC & SEI conference on advances in hurricane engineering, Miami, FL, October 24–26. Reston, VA: ASCE.
Cochran, L., Peterka, J., and Derickson, R. (1999). Roof surface wind speed distributions on low-rise buildings. Archit. Sci. Rev. 42, 151–160. doi:10.1080/00038628.1999.9696872
Doddipatla, L. S., and Kopp, G. A. (2019). A review of critical scouring velocity of compact roof aggregate. J. Wind Eng. & Industrial Aerodynamics 188, 110–124. doi:10.1016/j.jweia.2019.02.018
Grayson, M., Pang, W. C., and Schiff, S. (2012). Three-dimensional probabilistic wind-borne debris trajectory model for building envelope impact risk assessment. J. Wind Eng. Industrial Aerodynamics 102, 22–35. doi:10.1016/j.jweia.2012.01.002
Hargreaves, D. M., Kakimpa, B., and Owen, J. S. (2014). The computational fluid dynamics modelling of the autorotation of square, flat plates. J. Fluids Struct. 46, 111–133. doi:10.1016/j.jfluidstructs.2013.12.006
Holmes, J. D. (2015). Wind loading of structures. Boca Raton, FL: CRC Press, Taylor & Francis Group.
Holmes, J. D., Baker, C. J., and Tamura, Y. (2006a). Tachikawa number: a proposal. J. Wind Eng. Industrial Aerodynamics 94, 41–47. doi:10.1016/j.jweia.2005.10.004
Holmes, J. D., Letchford, C. W., and Lin, N. (2006b). Investigations of plate-type windborne debris—Part II: computed trajectories. J. Wind Eng. Industrial Aerodynamics 94, 21–39. doi:10.1016/j.jweia.2005.10.002
Huo, S., Hemida, H., and Sterling, M. (2020). Numerical study of debris flight in a tornado-like vortex. J. Fluids Struct. 99, 103134. doi:10.1016/j.jfluidstructs.2020.103134
Iversen, J. D. (1979). Autorotating flat-plate wings: the effect of the moment of inertia, geometry and Reynolds number. J. Fluid Mech. 92, 327–348. doi:10.1017/s0022112079000641
Kalimpa, B., Hargreaves, D. M., and Owen, J. S. (2012). An investigation of plate-type windborne debris flight using coupled CFD–RBD models. Part II: free and constrained flight. J. Wind Eng. Industrial Aerodynamics 111, 105–116.
Kopp, G. A., Khan, M. A. A., Henderson, D. J, and Morrison, M. J. (2012). Analysis of wood-framed roof failures under realistic hurricane wind loads. Proceedings of the 2012 ATC & SEI conference on advances in hurricane engineering, Miami, FL, 1078–1089.
Kopp, G. A., and Sarathi, P. (2010). Simultaneous pressure and velocity measurements on gable roof houses. Boundary layer wind tunnel laboratory report BLWTL-2-2010.
Kordi, B., and Kopp, G. A. (2011). Effects of initial conditions on the flight of windborne plate debris. J. Wind Eng. Industrial Aerodynamics 99, 601–614. doi:10.1016/j.jweia.2011.02.009
Kordi, B., Kopp, G. A., and Baker, J. (2009). “The debris flight equation” by C. J. Wind Eng. Industrial Aerodynamics 97, 151–154.
Kordi, B., Traczuk, G., and Kopp, G. A. (2010). Effects of wind direction on the flight trajectories of roof sheathing panels under high winds. Wind Struct. 13-2, 145–167. doi:10.12989/was.2010.13.2.145
Lin, N., Letchford, C. W., and Holmes, J. D. (2006). Investigation of plate-type windborne debris. Part I. Experiments in wind tunnel and full scale. J. Wind Eng. Industrial Aerodynamics 94, 51–76. doi:10.1016/j.jweia.2005.12.005
Lyu, M. Z., Ai, X. Q., Sun, T. T., and Chen, J. B. (2023). Fragility analysis of curtain walls based on wind-borne debris considering wind environment. Probabilistic Eng. Mech. 71, 103397. doi:10.1016/j.probengmech.2022.103397
Minor, J. E. (1994). Wind-borne debris and the building envelope. J. Wind Eng. Industrial Aerodynamics 53, 207–227. doi:10.1016/0167-6105(94)90027-2
Minor, J. E. (2005). Lessons learned from failures of the building envelope in windstorms. J. Archit. Eng. 11, 10–13. doi:10.1061/(asce)1076-0431(2005)11:1(10)
Minor, J. E., Mehta, K. C., and McDonald, J. R. (1972). Failures of structures due to extreme winds. J. Struct. Div. 98, 2455–2471. doi:10.1061/jsdeag.0003375
Nishimura, T., Taniguchi, T., and Maruyama, T. (2009). Analysis on trajectories of wind-borne debris and impact test of building components. GBRC Tech. Rep. 34, 14–24.
Peterka, J. A., Cermak, J. E., Cochran, L. S., Cochran, B. C., Hosoya, N., Derickson, R. G., et al. (1997). Wind uplift model for asphalt shingles. J. Archit. Eng. 3, 147–155. doi:10.1061/(asce)1076-0431(1997)3:4(147)
Richards, P. J., Williams, N., Laing, B., McCarty, M., and Pond, M. (2008). Numerical calculation of the three-dimensional motion of wind-borne debris. J. Wind Eng. Industrial Aerodynamics 96, 2188–2202. doi:10.1016/j.jweia.2008.02.060
Sengupta, A., and Sarkar, P. P. (2018). Experimental measurement and numerical simulation of an impinging jet with application to thunderstorm microburst winds. J. Wind Eng. Industrial Aerodynamics 96, 345–365. doi:10.1016/j.jweia.2007.09.001
Skews, B. W. (1990). Autorotation of rectangular plates. J. Fluid Mech. 217, 33–40. doi:10.1017/s0022112090000611
Sousa, J. M. M., and Pereira, J. C. F. (2004). DPIV study of the effect of a gable roof on the flow structure around a surface-mounted cubic obstacle. Exp. Fluids 37, 409–418. doi:10.1007/s00348-004-0830-2
Surry, D., Kopp, G. A., and Bartlett, F. M. (2005). Wind load testing of low buildings to failure at model and full scale. ASCE Nat. Hazards Rev. 6, 121–128. doi:10.1061/(asce)1527-6988(2005)6:3(121)
Tachikawa, M. (1983). Trajectories of flat plates in uniform flow with application to wind-generated missiles. J. Wind Eng. Industrial Aerodynamics 14, 443–453. doi:10.1016/0167-6105(83)90045-4
Tachikawa, M. (1988). A method for estimating the distribution range of trajectories of wind-borne missiles. J. Wind Eng. Industrial Aerodynamics 29, 175–184. doi:10.1016/0167-6105(88)90156-0
Twisdale, L. A., Dunn, W. L., and Davis, T. L. (1979). Tornado missile transport analysis. 728 Nucl. Eng. Des. 51 (2), 295–308. doi:10.1016/0029-5493(79)90096-7
Visscher, B. T., and Kopp, G. A. (2007). Trajectories of roof sheathing panels under high winds. J. Wind Eng. Industrial Aerodynamics 95, 697–713. doi:10.1016/j.jweia.2007.01.003
Wills, J. A. B., Lee, B. E., and Wyatt, T. A. (2002). A model of wind-borne debris damage. J. Wind Eng. Industrial Aerodynamics 90, 555–565. doi:10.1016/s0167-6105(01)00197-0
Wu, C.-H., Akon, A. F., and Kopp, G. A. (2017). Effects of turbulence on the mean pressure field in the separated-reattaching flow above a low-rise building. J. Wind Eng. Industrial Aerodynamics 171, 79–92. doi:10.1016/j.jweia.2017.09.013
Nomenclature
CD= D/q A drag coefficient
CL= L/q A lift coefficient
CM= M/q A ch moment coefficient
CN= N/q A static normal coefficient on the plate
q = ½
ch plate chord
A plate area
D = ½
L = ½
M = ½
N = ½
g gravity acceleration
I = m (l2+ h2)/12 moment of inertia of the plate
B B is the maximum overall dimension of the debris in the direction of the flow
l side dimension of the plate
h plate thickness
L lift force
m mass of the debris
S ω l/(2 Urel) = spin parameter of the plate
S0 ω0 l/(2 Urel) = spin parameter of the plate at the point of stable autorotation
u horizontal velocity of the plate
U horizontal wind velocity
w vertical velocity of the plate
x horizontal distance of the debris element
z vertical distance of the debris element
with:
u∞ asinthotic debris speed limit in the wind direction
t time
t * dimensional response time
ω angular velocity of the plate
ω0 angular velocity of the plate at the point of stable autorotation
AR = B/l aspect ratio of the plate
Iu turbulence intensity
Keywords: wind-borne debris, building envelope, building aerodynamics, wind damage, roof elements
Citation: Mejorin A and Kopp GA (2024) Estimation of debris flight trajectories of roof cover from low-rise buildings. Front. Built Environ. 10:1428693. doi: 10.3389/fbuil.2024.1428693
Received: 06 May 2024; Accepted: 11 November 2024;
Published: 02 December 2024.
Edited by:
Izuru Takewaki, Kyoto Arts and Crafts University, JapanCopyright © 2024 Mejorin and Kopp. This is an open-access article distributed under the terms of the Creative Commons Attribution License (CC BY). The use, distribution or reproduction in other forums is permitted, provided the original author(s) and the copyright owner(s) are credited and that the original publication in this journal is cited, in accordance with accepted academic practice. No use, distribution or reproduction is permitted which does not comply with these terms.
*Correspondence: Angela Mejorin, YW1lam9yaW5AdXdvLmNh
 Angela Mejorin
 Gregory A. Kopp
