 Marion Sudvarg1*
 Oren Bell1
 Tyler Martin1
 Benjamin Standaert1Tao Zhang2
 Sun-Beom Kwon2
 Chris Gill1Arun Prakash2
- 1Department of Computer Science and Engineering, James McKelvey School of Engineering, Washington University in St. Louis, St. Louis, MO, United States
- 2Lyles School of Civil and Construction Engineering, Purdue University, West Lafayette, IN, United States
Multi-axial real-time hybrid simulation (maRTHS) uses multiple hydraulic actuators to apply loads and deform experimental substructures, enacting both translational and rotational motion. This allows for an increased level of realism in seismic testing. However, this also demands the implementation of multiple-input, multiple-output control strategies with complex nonlinear behaviors. To realize true real-time hybrid simulation at the necessary sub-millisecond timescales, computational platforms will need to support these complexities at scale, while still providing deadline assurance. This paper presents initial work towards supporting (and is influenced by the need for) envisioned larger-scale future experiments based on the current maRTHS benchmark: it discusses aspects of hardware, operating system kernels, runtime middleware, and scheduling theory that may be leveraged or developed to meet those goals. This work aims to create new concurrency platforms capable of managing task scheduling and adaptive event handling for computationally intensive numerical simulation and control models like those for the maRTHS benchmark problem. These should support real-time behavior at millisecond timescales, even for large complex structures with thousands of degrees of freedom. Temporal guarantees should be maintained across behavioral and computational mode changes, e.g., linear to nonlinear control. Pursuant to this goal, preliminary scalability analysis is conducted towards designing future maRTHS experiments. The results demonstrate that the increased capabilities of modern hardware architectures are able to handle larger finite element models compared to prior work, while imposing the same latency constraints. However, the results also illustrate a subtle challenge: with larger numbers of CPU cores, thread coordination incurs more overhead. These results provide insight into the computational requirements to support envisioned future experiments that will take the maRTHS benchmark problem to nine stories and beyond in scale. In particular, this paper (1) re-evaluates scalability of prior work on current platform hardware, and (2) assesses the resource demands of a basic smaller scale model from which to gauge the projected scalability of the new maRTHS benchmark as ever larger and more complex models are integrated within it.
1 Introduction
Real-Time Hybrid Simulation (RTHS) is a powerful technique for evaluating the behaviors of complex structures under realistic and often adverse conditions (e.g., in the domain of natural hazards engineering). The state of the art in RTHS has evolved significantly over the past decades: although initially even simple models were challenging to run at sufficiently fine-grained (e.g., millisecond) time-scales to be fully physically realistic based on dynamics of the modes that dominate the behavior in mechanical systems (Ferry et al., 2013), subsequent advances in real-time scheduling theory (Li et al., 2014) and concurrency platform design (Ferry et al., 2014a) allowed physically realistic RTHS experiments to be run, at scales corresponding to a nine-story building.
Despite those advances, three primary limitations of the state of the art still must be addressed in order to achieve envisioned next-generation RTHS experiments whose complexity, scale, and dynamics may require further advances in real-time scheduling theory and its application to modern computational platforms: (1) overheads from communication across chip sockets, barrier synchronization mechanisms, and un-optimized task code; (2) execution only on conventional multicore and multiprocessor devices, which leaves the capacity of GPUs and FPGAs that are often available on modern endsystems largely unused; and (3) static assignment of which jobs are released onto which processors and at what periodic rates, which limits the system’s ability to adjust resource utilization.
This article explores the first of those issues in the context of prior work and of a newly developed experimental benchmark control problem for multi-axial real-time hybrid simulation (maRTHS) (Condori et al., 2023). The semantics of the maRTHS benchmark expose new challenges toward achieving realistic millisecond-scale RTHS beyond those in prior work, including increased control complexity associated with multiple actuators that produce both translational and rotational motion, as well as the more demanding numerical models for simulating responses to those motions in the virtual substructure. For both the models used in prior work and a basic version of the maRTHS benchmark, this paper examines to what extent the computational performance of modern multicore hardware may be harnessed to allow significantly larger models to be used, which also motivates leveraging hardware-optimized libraries (e.g., BLAS).
The rest of this paper is structured as follows. Section 2 surveys prior work and provides background information on the models used in the evaluations. Section 3 provides an overview of the experiments that were run, including single-core (Section 4) and multi-core (Section 5) evaluations of models used in prior work, as well as of a basic model of the maRTHS benchmark (Section 6). Finally, Section 7 concludes this paper’s discussion and outlines directions for future work including (1) exploiting new high-performance concurrency platform frameworks (e.g., OpenMP 5.3), (2) re-targeting real-time tasks to run on other devices (e.g., GPUs and FPGAs) at millisecond time-scales, and (3) examining how new elastic and mixed-criticality real-time scheduling techniques may be developed and exploited to reallocate platform resources dynamically at run-time, to optimize performance of maRTHS experiments and to adapt to changing operating conditions while maintaining schedulability at millisecond timescales.
2 Background and related work
The RT-OpenMP concurrency platform for parallel real-time computing was applied to Real-Time Hybrid Simulation (RTHS) a little more than a decade ago (Ferry et al., 2013). Shortly thereafter, the CyberMech concurrency platform exploited a new design and implementation to achieve for the first time millisecond resolution RTHS for thousand-degree-of-freedom finite element models (Ferry et al., 2014a; b) including for the nine-story structural model used as a baseline for comparison in this article. Results obtained on a 16-core machine with eight cores per chip socket revealed scalability limits due to inter-thread communication costs, especially as the number of cores exceeded those in a single chip socket (Ferry et al., 2014a).
The CyberMech platform was further refined to provide adaptive reallocation of resources during on-line operation, based on newly developed elastic scheduling techniques for parallel real-time systems (Orr et al., 2018; Orr et al., 2019; Orr et al., 2020). Elastic scheduling places further demands on the concurrency platform, to be able to adapt tasks’ resource utilizations by changing tasks’ rates, workloads, and/or critical path lengths (a.k.a. spans) rapidly within the timescales at which tasks are scheduled, while still meeting deadlines. Those capabilities were then used to conduct a new generation of virtual RTHS experiments involving control of a nonlinear physical plant with parametric uncertainties (Condori et al., 2020). This in turn places even greater and more dynamic computational demand on the concurrency platform, both to manage resource reallocation and within the nonlinear Bayesian estimator used to implement a nonlinear robust controller.
The next-generation MechWorks concurrency platform, currently under development, targets an even more demanding category of RTHS, of which the multi-axial benchmark problem (Condori et al., 2023) is an example. Although this initial configuration of the multi-axial real-time hybrid simulation (maRTHS) experiments involves only a single model that is modest in scale, it offers an important starting point against which relative demands can be gauged for (1) the structural model as it scales up, (2) nonlinearity, multi-axial actuation, and other complexities of the tracking and control problem, and (3) adaptive resource reallocation to manage those complexities on-line while ensuring schedulability, control stability, non-reachability of adverse states, and other key safety properties.
3 Overview of experiments
To exploit parallelism to achieve millisecond-scale RTHS, Ferry et al. (2014a,b) introduced CyberMech, a run-time platform written in C++ that leverages OpenMP for multithreading and multiprocessor execution. Condori et al. (2023) subsequently developed the experimental benchmark control problem for multi-axial real-time hybrid simulation (maRTHS benchmark), which is implemented in MATLAB/Simulink R2019b. This article seeks to gauge the suitability and assess the limitations of CyberMech as a platform to run the maRTHS benchmark, towards addressing those limitations in the next-generation MechWorks platform that is under development.
In addition to running the maRTHS benchmark itself, this paper presents scalability studies of the nine-story structural model analyzed by Ferry et al. (2014a); Ferry et al. (2014b) which is particularly suitable as a benchmark to test the feasibility and scalability of CyberMech because (1) it includes numerical simulations with representations in a wide range of model degrees of freedom (DoF) to choose from; and (2) the results can be compared directly to the detailed analysis in the prior work of Ferry et al. (2014a); Ferry et al. (2014b) to understand how the computational platform has evolved, both in terms of software support and the capabilities of the underlying hardware.
3.1 Nine-story structural model
Ohtori et al. (2004) proposed a benchmark control problem for nine-story moment-resisting steel frame buildings for the SAC project, which is representative of typical medium-rise buildings in Los Angeles, California. The structural model was then analyzed by Ferry et al. (2014a); Ferry et al. (2014b) to show the assurance of real-time execution by enabling parallel computing. Details of the computation and the structural model were provided by Aguilar (2012) in the open-source RT-Frame2D example. Note that for spatial discretization, they used one Bernoulli-Euler frame element within each column and beam. The lumped mass matrix is used where rotational inertia is ignored. Thus, they assigned a small value of rotational mass.
A series of control tasks including active, passive, and semi-active control strategies have been conducted using this benchmark building model. In the RTHS test conducted by Ferry et al. (2014a); Ferry et al. (2014b), it is fitted (in simulation) with a virtual magneto-rheological damper. The model provides a useful vehicle for analysis because scalability studies (to multiple cores and finer granularity) already have been performed in the prior literature (Ferry et al., 2014a; Ferry et al., 2014b). As a decade has since passed, this provides an opportunity to re-evaluate the analysis using the newer more capable hardware available, and to consider how modern platforms can be used similarly to achieve desired real-time performance of the maRTHS benchmark.
The model is implemented as a standalone virtual RTHS (vRTHS), in which the control loop (transfer of impulse, physical response, and sensor readouts) for the physical specimen under examination is implemented virtually. Typically this is performed on a separate PC running Speedgoat or Simulink Real-Time (aka xPC-Target). In the standalone implementation, all computations (both for the simulated building model and simulated physical target) are performed on the same platform, which enables rapid experimentation over a large number of tunable parameters. Experiments are run over large numbers of processor cores (1–127), with different multithreading implementations (OpenMP and BLAS), and workload granularities (23 model implementations with different numbers of degrees of freedom).
The model is subjected to ground motions from the 1940 Imperial Valley earthquake recorded at El Centro. The simulation is performed in real-time at a 1,024 Hz rate, executing for 61,440 iterations — 1 min total, except when there are overruns.1 The OpenMP-based multithreaded federated scheduling service from Ferry et al. (2014a) is used to launch the simulation in CyberMech, which distributes threads among specified cores, assigns them to the Linux SCHED_FIFO real-time scheduling class, and allows them to be released synchronously at the correct interval.
At each iteration, given a time step
1. Numerical substructure:
This equation is solved by the Newmark-beta method.
Where
In the vRTHS setup, the structural model is decomposed into numerical and virtual physical substructures, with 14 model degrees of freedom specified as part of the physical substructure. Therefore, for
2. Feedback force from magnetorheological damper (Spencer et al., 1997):
where
The structural model in Ferry et al. (2014a) used
3.2 Three-story multi-axial model
The experimental benchmark control problem for multi-axial real-time hybrid simulation (maRTHS) recently proposed in Condori et al. (2023) highlights several new challenges in RTHS toward more realistic large-scale structural experimentation. Among those challenges is the increased computational complexity involved in controlling multiple actuators to produce both translational and rotational motion, as well as higher-order explicit numerical methods. Due to the nonlinear coordinate transformations, utilizing multi-axial actuators increases complexity due to nonlinearities and internal coupling, which can require solving nonlinear problems (Nakata et al., 2010).
Toward addressing this increased complexity, a representative simulation model is implemented for the maRTHS benchmark as a standalone virtual RTHS. As an initial proof-of-concept, all computation is performed on a single machine, similarly to the nine-story structural model. This allows us to analyze all computational costs associated with the simulation uniformly on a single platform, and to identify the speedups gained by the improved parallelism available in a single chip socket.
The model is again subjected to 1 min of recorded ground motion from the Imperial Valley earthquake at a 1,024 Hz rate. The same multi-threaded federated scheduling service is used to launch the simulation in CyberMech. At each iteration, given a time step
1. Numerical substructure:
Where
2. Linear quadratic Gaussian (LQG) control system: The control system is composed of a deterministic LQR and a Kalman filter. From the deterministic LQR, command signals to the actuators
where
Where
3. Control plant model: A transfer function matrix with command signals to the actuators
Then, this system is transformed to the following continuous state-space form with measurement noise
Where
4. Feedback force:
where
Further details of this maRTHS benchmark problem are given in Condori et al. (2023).
3.3 Target computational platform
This paper extends the scalability analysis performed by Ferry et al. (2014a); Ferry et al. (2014b) to a modern multicore CPU: in particular, an AMD EPYC 9754 with 128 cores running at 3.1 GHz with 128 GB of RAM and version 5.14.0 of the Linux kernel using the Rocky 9.3 distribution. CyberMech is written in C++ and compiled using the GNU Compiler Collection’s C++ compiler (g++) version 11.4.1.
All experiments are run using Linux’s SCHED_FIFO real-time scheduling class. To improve temporal regularity of execution, Simultaneous Multithreading and CPU throttling are disabled at the hardware level, and real-time scheduler throttling is disabled at the kernel level via proc pseudo-filesystem interfaces.
Two alternative implementations of each model are evaluated. In the first, OMP, matrix operations are written as nested loops, and the outer loop is explicitly parallelized using OpenMP pragmas. The second implementation, BLAS, uses the OpenBLAS distribution of the Basic Linear Algebra Subprograms (BLAS), which also accelerates operations using the Linear Algebra PACKage (LAPACK). BLAS leverages OpenMP for inter-processor parallelism, but also uses highly-optimized code to improve memory and cache locality, as well as making use of the AVX-512 vector extensions on the EPYC CPU. Note that both the OMP and BLAS implementations use a call to LAPACK’s dgetrs function to solve the linear equation in Expression 2c.
4 Single-core scalability
In the decade since the scalability analysis in Ferry et al. (2014a); Ferry et al. (2014b) was performed, CPU architectures have improved significantly, both in the number of cores on a single chip socket, as well as the performance of each individual core. This section evaluates the nine-story linearized model described in Section 3.1 on a single core of the CPU platform to consider (1) how execution time scales with model size, and (2) for which model sizes it is necessary to exploit multicore parallelism.
The size and complexity of the linearized model are scaled up by increasing the number of degrees of freedom (DoFs) of the numerical simulation. Note that by discretizing each frame and beam with multiple elements, we construct mass, damping, and stiffness matrices with large DoFs. DoFs used are {198, 216, 231, 249, 264, 282, 297, 315, 330, 348, 363, 381, 396, 414, 429, 447, 462, 480, 495, 513, 528, 858, 1,188}, for a total of 23 model sizes.
4.1 OMP
The execution times of each iteration of the purely OpenMP-based implementation for each model size are first measured when pinned to a single CPU core.
4.1.1 Execution time distributions
For each model size, the median and maximum execution times are measured across the 61,440 iterations, along with the

Figure 1. OMP execution times on 1 CPU.
These results indicate that execution times tend to be very consistent: the median and
However, occasional outliers inflate the worst-case execution times. Within the 83 iterations that exceed the
Nonetheless, even the worst-case execution times indicate significant improvements in single-core performance over the last decade. In (Ferry et al., 2014a; Figure 6), the authors were only able to meet a 1 m deadline for models of up to about 400 DoF, even using a very simple finite element model.2 In contrast, the maximum time remains below 1 m for models of up to 428 DoF. Furthermore, the
4.1.2 Execution time complexity
The numerical simulation for the nine-story building model uses several matrix-vector multiplication operations. For a model with
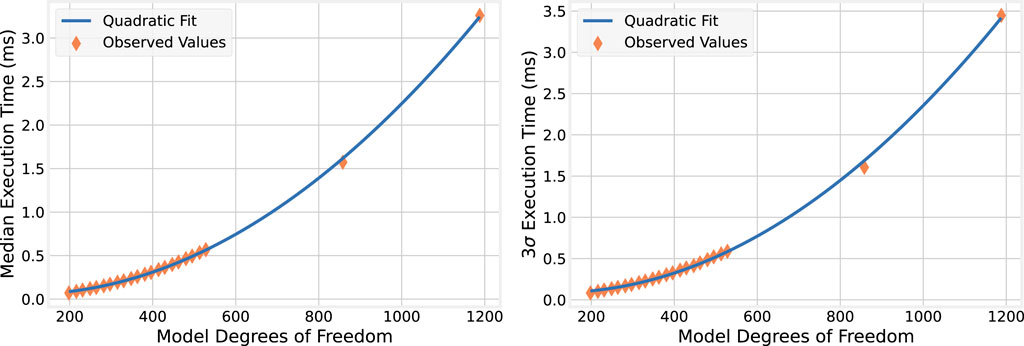
Figure 2. Quadratic relationship between model size and OMP execution time.
4.2 BLAS
The experiments above are now repeated for the BLAS implementation of the numerical simulation.
4.2.1 Execution time distributions
For each model size, the median,
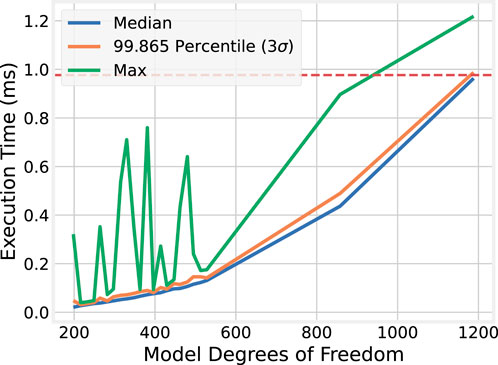
Figure 3. BLAS execution times on 1 CPU.
These experiments indicate that not only is BLAS faster, but task latency with it also may be more stable than the purely OpenMP-based implementations of the equivalent nine-story building models. For BLAS, the
Moreover, BLAS enables timely simulation of even large numerical models on a single core. For model sizes of up to 858 DoF, the execution time does not exceed the
4.2.2 Execution time complexity
For completeness, both the median and
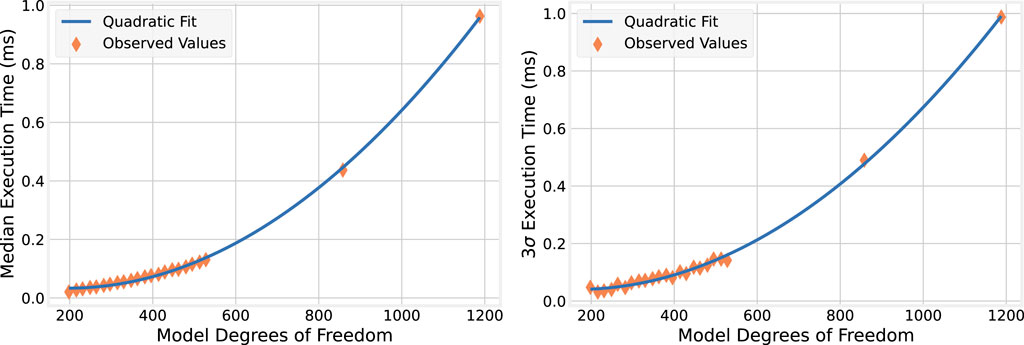
Figure 4. Quadratic relationship between model size and BLAS execution time.
4.2.3 Comparison to OMP
To better illustrate the improvements gained by using BLAS over naïvely implementing matrix operations using nested loops, ratios of the OMP to the BLAS execution time statistics are plotted in Figure 5.
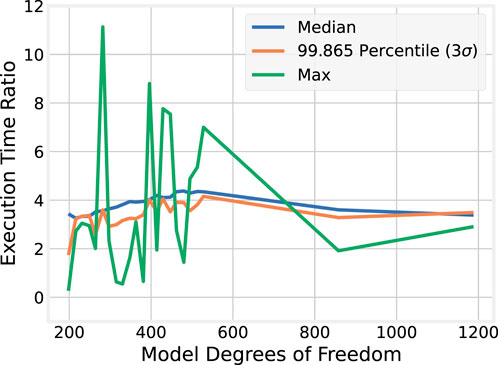
Figure 5. Execution time ratios between OMP and BLAS implementations.
The median and
4.3 Discussion
The results of this section highlight the key point of this paper: RTHS can benefit substantially from the vast improvements in computational platforms realized over the last decade. Compared to the scalability analysis performed by Ferry et al. (2014a), using BLAS in conjunction with the high-end AMD EPYC architecture allows
5 Scaling to multiple cores
The previous section demonstrated that the CyberMech platform, coupled with highly-optimized BLAS-based implementations of matrix operations, enables standalone vRTHS at 1,024 Hz even for large models (858 DoF) on a single CPU core. As mentioned in the introduction, this paper serves as a scalability study toward creating new concurrency platforms to support multi-axial RTHS on multicore and heterogeneous (e.g., GPU and FPGA-based) computational platforms. One might assume, given the results of the previous section, that these advanced platforms are unnecessary since high performance can be extracted from even a single core.
However, several scenarios in RTHS may arise in which a single core is nonetheless insufficient. First, for complex built environments, larger models with more degrees of freedom or faster rates may be necessary for accurate numerical simulations. Second, the nine-story building model uses very simple representations of the structural model, control laws, and nonlinear behavior. The maRTHS benchmark problem (Condori et al., 2023), for which results for initial scalability experiments are presented in the next section, has more complex behavior governed by actuators that apply forces along multiple axes. Third, the experiments presented in this paper are standalone vRTHS: numerical simulations are executed on a single host machine. Recurrent workloads are therefore modeled as implicit-deadline real-time tasks: each iteration needs only to complete prior to invocation of the next iteration, and therefore the relative deadline is equal to the iteration period. In a full RTHS setup where a control signal based on the results of numerical analysis must be applied to the controlled plant (i.e., the tested physical substructure), deadlines may be constrained to be significantly shorter than the period, so that the resulting sensed state of the plant can be used to update the simulation environment prior to application of the next control signal.
These three scenarios suggest that at key points, scaling vRTHS or RTHS to multicore machines may be necessary. This section evaluates the OMP and BLAS implementations of the nine-story structural model by scaling up to all 128 cores of the AMD EPYC 9754 CPU.
5.1 OMP
As before, the execution times for each iteration of the OpenMP implementation are measured for each model size. This time, the model is allowed to take advantage of the parallelism provided by the 128-core CPU, testing with 1–127 cores; core 0 is reserved for operating system tasks and the CyberMech runtime’s management thread, which performs dispatching and synchronization of the recurrent workloads. In all,
5.1.1 Execution times for every run
Median execution times for each combination of model size and number of cores are displayed as a heatmap in Figure 6. Similar heatmaps for the
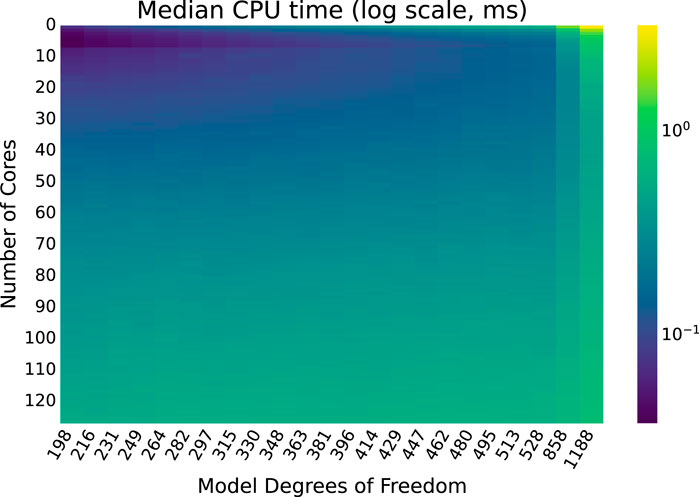
Figure 6. Median OMP execution times for each combination of model size and number of cores.
As expected, execution times continue to increase with model size, even as the number of cores used by the greater number of threads increases. Perhaps surprisingly, as the number of cores used increases execution time decreases to a point but then begins to increase slightly as more cores are used. This trend is examined more closely, and a plausible explanation is provided, backed with empirical evidence.
5.1.2 A closer look
To illustrate more clearly the effect observed above—that increasing the number of cores allocated to the numerical simulation improves execution time at first, but that after a point, adding more cores increases the execution time—selected plots of the execution time dependence on the number of cores for individual model sizes are shown in Figure 7.
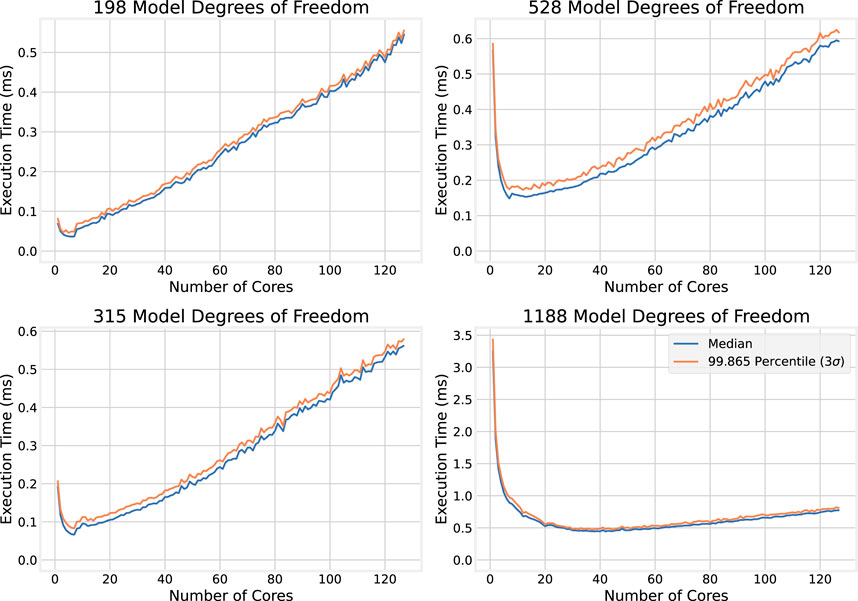
Figure 7. OMP execution times for individual large model sizes.
In the top plots of Figure 7, which show how execution time scales with the number of cores for smaller models (198 and 315 DoF), an initial sharp decrease in execution time is observed as the number of cores increases. This is followed by a roughly linear increase in execution time with the number of cores. The effect is more pronounced in the smaller model, and the larger model appears to continue to benefit from a larger number of cores compared to the smaller model. The bottom plots of Figure 7 show the execution time dependence on the number of cores for larger models (528 and 1,188 DoF). The same trend emerges, where adding cores provides diminishing returns, though the returns are still present for larger numbers of cores compared to the smaller model sizes.
Toward quantifying this effect, it is helpful to compare the number of cores that provide the minimum median execution time across each model size. These results are plotted in Figure 8. The relationship between model size and the optimal core count shows a positive correlation. For the smallest model (198 DoF), six cores provide the best performance. For the largest model (1,188 DoF), the best performance is achieved with 42 cores, and not the full 127 available on the evaluation machine.
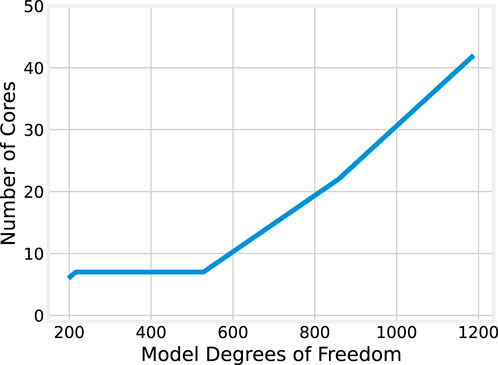
Figure 8. Best core count by model size for OMP.
However, it may be observed that for model sizes from 216 to 528 degrees of freedom, the optimal number of cores remains 7. For larger model sizes, the trend is roughly linear. The significant jump from 7 to 22 cores when scaling from 528 to 858 DoF may be explained, in part, by the underlying processor architecture. The AMD EPYC 9754 CPU used in this evaluation has 128 “Zen 4c” cores, grouped into “core complexes” (CCXs) each with eight cores and an L3 cache they share. Execution on seven cores therefore remains local to a single CCX, but because core 0 is reserved in the experiment for the runtime middleware, scaling to eight cores means execution spans two CCXs and the cores no longer share a single L3 cache. Thus, when scaling to model sizes where seven cores are no longer optimal, the transition to non-CCX-local execution means more cores are needed to recover the overheads associated with inter-CCX communication and cache non-locality.
5.1.3 A possible explanation
A possible explanation for the observed results is now proposed and evaluated. In the smaller models especially, a roughly inverse relationship between execution time and the number of cores is observed up to a point, then a linear relationship as the number of cores continues to grow. To help explain this, terminology from the field of real-time computing is now introduced.
If task execution can be distributed evenly across cores, and it runs on those cores without being preempted, then the following relationship between workload and latency is expected to hold:
However, OpenMP also incurs additional overhead related to management of its threads, e.g., dispatching of work items and barrier synchronization. Assuming that this overhead scales linearly with the number of threads (e.g., each time a thread is added, a constant amount
To test this hypothesis, the median workload
From the quadratic relationship for median execution times in Figure 2, the following expression is obtained3 for
OpenMP’s per-thread overhead
Putting the pieces together gives the following function for latency as a function of model size and number of cores:
5.1.4 Validating the latency model
To test this model, this function is plotted side-by-side with the median execution times for the models with 198, 315, 528, and 1,188 DoF. Results are shown in Figure 9: the latency model very closely matches the observed values.
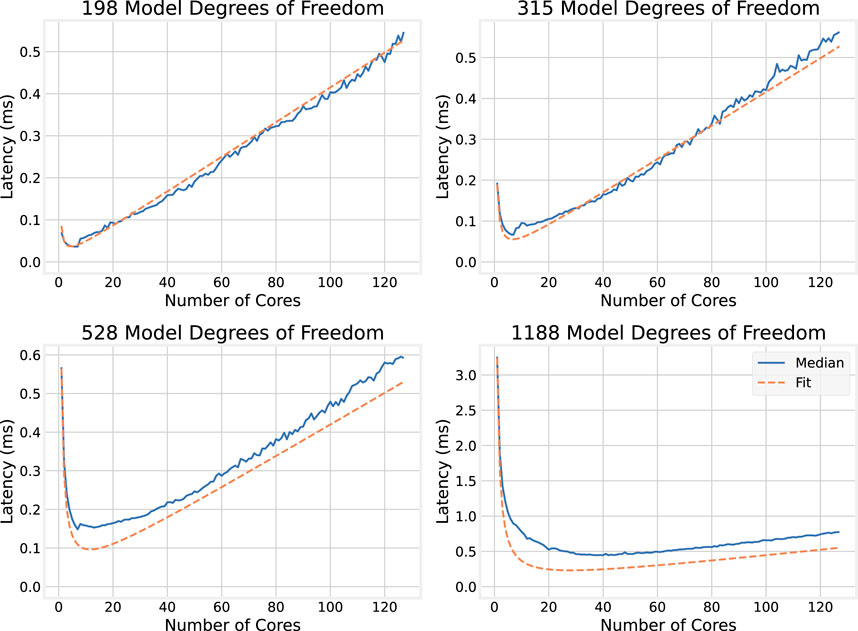
Figure 9. Comparison of median OMP execution times to latency model.
What the latency model says about the optimal number of cores to allocate to the numerical simulation (i.e., for each model size, which core count obtains the minimum execution time) is now considered. The expression for latency in Equation 12 can be used to find the minimum for a given workload:
Setting to 0 and solving for
Since
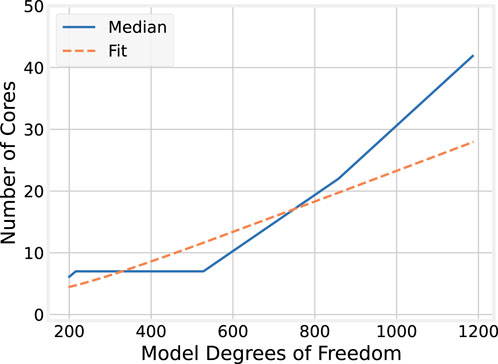
Figure 10. Best core count by number of DoF predicted by latency model for OMP.
5.2 BLAS
The previous section showed that re-implementing the matrix operations in the simulation model using BLAS significantly improved execution times, allowing larger models to be run on just a single CPU core. Whether these improvements remain consistent as the number of threads of execution is increased, and whether the latency model still applies, is now examined by repeating the above experiments for the BLAS implementation of the numerical simulation of the nine-story structural model.
5.2.1 Execution times for every run
Median and maximum execution times for each combination of model size and number of cores are displayed as heatmaps in Figure 11. Supplementary Appendix 1 includes a similar heatmap for the
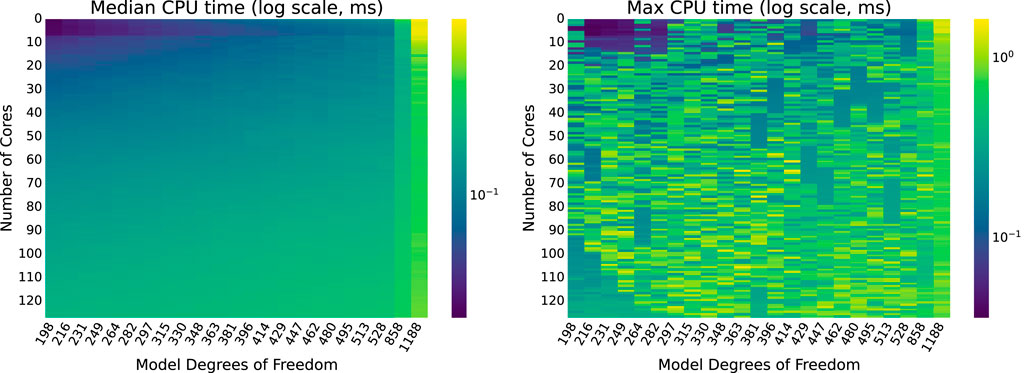
Figure 11. BLAS execution times for each combination of model size and number of cores.
As with the OMP implementation, median execution times tend to increase with model size, even as the number of cores increases. Execution time decreases with the number of cores at first, but then begins to increase slightly as more CPU cores are added. This trend is investigated more closely, to see if it remains consistent with the trends observed for the OMP implementation, in Section 5.2.3.
For the model sizes evaluated, the median execution times for BLAS never exceed
5.2.2 Comparison to OMP
Just by comparing the largest observed median and maximum execution times for the BLAS and OMP implementations across all runs, the BLAS implementation is significantly more efficient. To better illustrate the improvements gained by using BLAS over naïvely implementing matrix operations using nested loops, ratios of the OMP execution times to the BLAS execution times are shown in Figure 12.
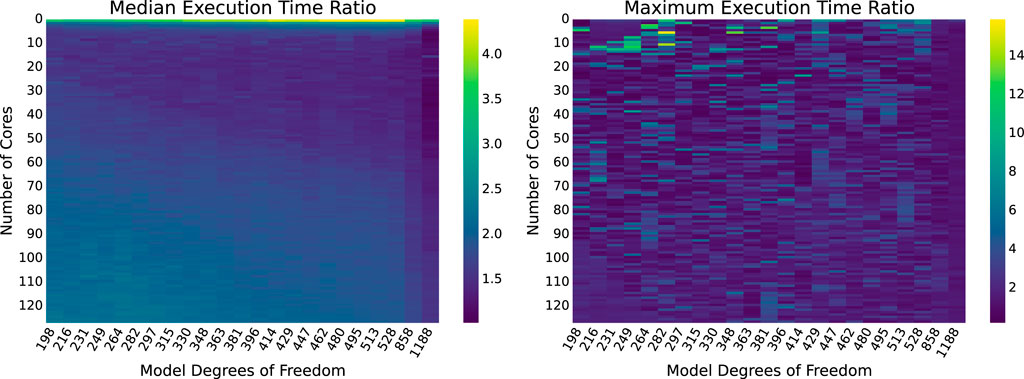
Figure 12. OMP vs. BLAS execution time ratios for combinations of model sizes and numbers of cores. Darker regions indicate closer performance.
On average, the median execution time achieved by BLAS is
5.2.3 Individual model sizes
To investigate whether the trends observed for OpenMP extend to the faster BLAS implementation, Figure 7 is replicated, plotting the BLAS execution times with number of cores for individual model sizes.
The top two plots of Figure 13 show how execution times scale with the number of cores for smaller models (198 and 315 DoF); the bottom two show the same for larger models (528 and 1,188 DoF). As observed for the OMP implementations, execution time tends to decrease at first with the number of CPU cores allocated, but then increases approximately linearly for smaller models. However, for 1,188 DoF, the segment where execution times decrease significantly as cores are added (up to about 20 CPU cores) does not indicate a smooth inverse relationship compared to its OMP counterpart in Figure 7.
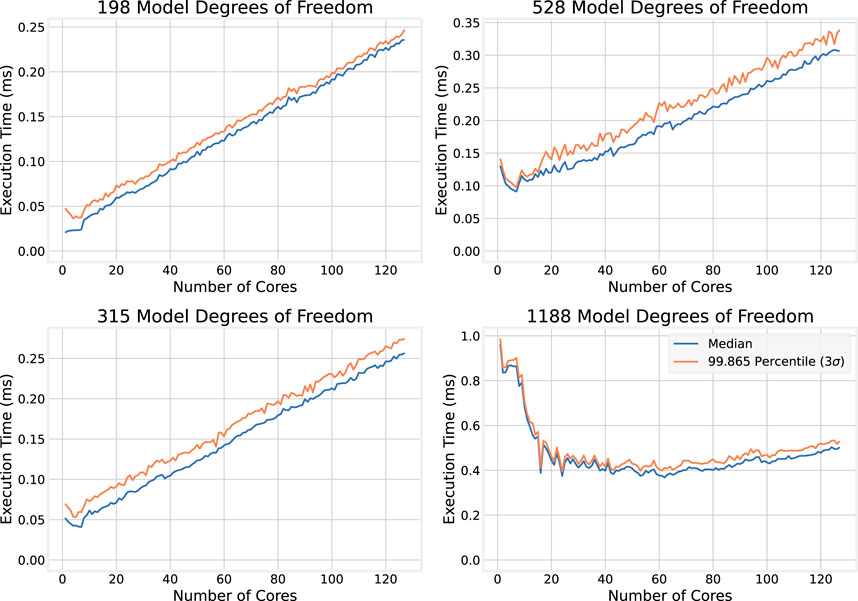
Figure 13. BLAS execution times for individual large model sizes.
Although the BLAS results display some unusual patterns compared to the OMP implementation, the general trends remain similar: execution time tends to decrease at first as more cores are allocated to the problem, then increase after a certain point. Where this increase occurs appears to be dependent on the model size, with larger models typically continuing to benefit from a larger number of CPU cores. This relationship is plotted in Figure 14, which shows the number of cores that minimizes the median execution time for each model size.
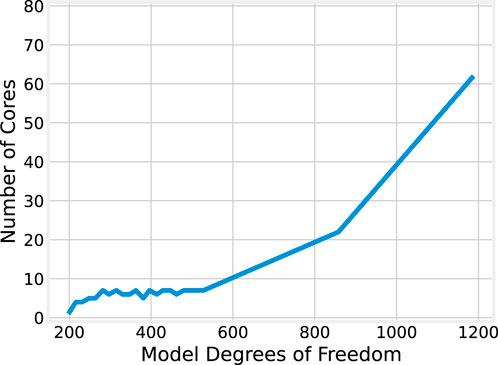
Figure 14. Best core count by model size for BLAS.
Though the relationship between model size and the optimal core count shows a generally positive correlation, it is not strictly monotone non-decreasing as it was for the OMP results illustrated in Figure 8. For model sizes up to 528 DoF, 4-7 CPU cores are optimal; afterward, the optimal core count generally increases, with 62 cores being optimal for 1,188 DoF. The significant jump from 7 to 22 cores when scaling from 528 to 858 DoF may be explained again, in part, by the underlying processor architecture and the grouping of cores into complexes (CCXs).
5.2.4 Applying the OpenMP latency model
While the relationships among numbers of cores, model sizes, and execution times reflect new execution semantics for the BLAS implementation that have not yet been fully characterized, they nonetheless appear to follow the same general trends as for the OMP implementation. To evaluate how well the latency model in Section 5.1.3 describes the BLAS results, the same exercise is repeated: the quadratic relationship for median execution times on a single core is used to quantify execution time, then the per-thread overhead
From the quadratic relationship in Figure 4, the following expression for
where
5.2.5 Validating the latency model for BLAS
To evaluate how well Equation 18 describes the observed execution times for the BLAS implementation, this function (in orange) is plotted side-by-side with the median execution times for the models with 198, 315, 528, and 1,188 DoF. Results are shown in Figure 15.
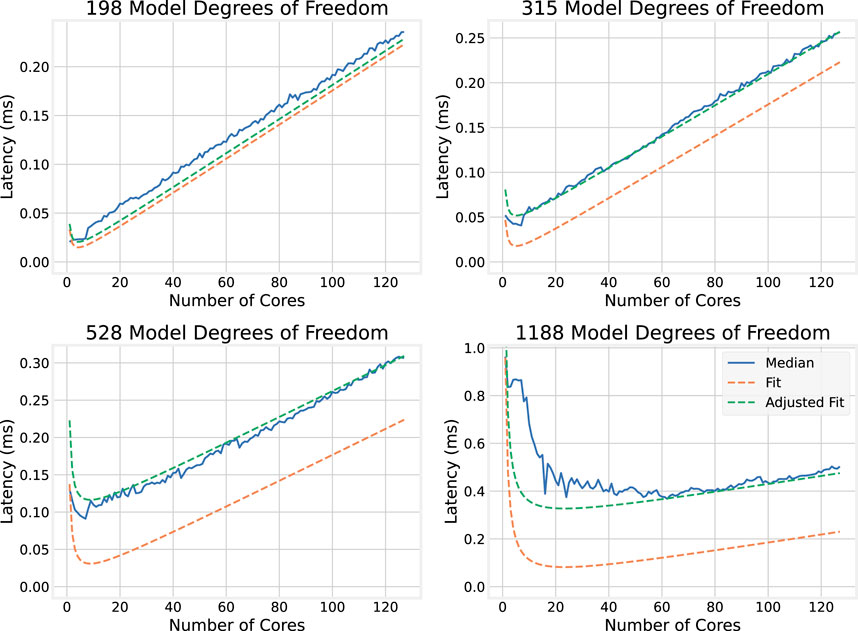
Figure 15. Comparison of median BLAS execution times to latency model.
The latency model does not provide as close a match with the observed data as it did for the OMP results in Figure 9, significantly underestimating the latency for larger models. To achieve a closer fit, Equation 18 is modified with an additional term that is linear in the size of the model, but independent of core count:
This adjustment is illustrated in Figure 15. This phenomenon only occurs in the BLAS implementation; as seen in Section 5.1, all overheads related to OpenMP are dependent on the number of CPU cores used. It is likely due to the BLAS library’s attempts at optimizing its parallel behavior—regions which can be parallelized but may suffer performance penalties from doing so might be run sequentially, resulting in execution times that are dependent of the model size but independent of the number of cores. Efforts to trace the library’s control flow and threading behavior to verify this are ongoing.
It is also worth reexamining how well the observed optimal core counts for each model size, plotted in Figure 14, match those predicted by this latency model. In Figure 16; Equation 17 is plotted against the observed values. The model now tends to underestimate the optimal number of cores for each larger model sizes, indicating that the latency model, despite providing a reasonable explanation for the OMP implementation, does not sufficiently capture the underlying architectural complexities, sequential code, and other factors that become more relevant under the BLAS implementation.
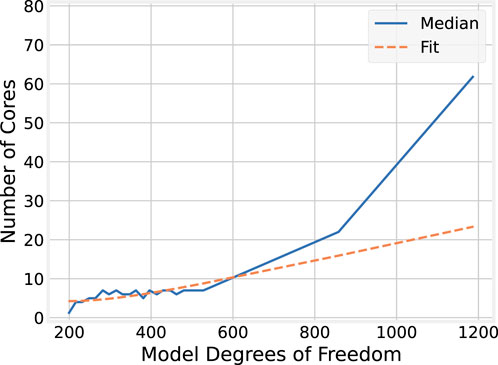
Figure 16. Best core count by number of DoF predicted by latency model for BLAS.
5.3 Discussion
This section evaluated performance of the nine-story structural model analyzed in Ferry et al. (2014a); Ferry et al. (2014b) when simulated on multiple cores. Results indicate that improvements over the last decade to computational hardware and software platforms enable timely vRTHS execution for larger models, even on fewer processor cores.
The benefits provided by modern multicore CPUs, which now may have over a hundred cores in a single chip socket (an AMD EPYC 9754 with 128 cores was used for these evaluations), enable scaling to even larger model sizes. While the overheads associated with dispatching and synchronizing large numbers of threads mean that fewer cores should be used with smaller model sizes, larger models may benefit from execution on all available processor cores. For OpenMP, a latency model that demonstrably captures these effects was proposed and evaluated.
The OMP implementation performs matrix operations in a naïve manner using nested loops, with the outer loop parallelized with OpenMP pragmas. Replacing these with explicit calls to BLAS allowed even faster execution, with typical speedups on the order of 1.8x, and certain cases as large as 4.4x. However, BLAS’s execution semantics are more complex, and the latency model for OpenMP was not as accurate in predicting BLAS’s execution times. Efforts to improve that model by quantifying the effects of vector instructions, measuring communication and cache overheads associated with the CPU architecture and the organization of processor cores on the chip, identifying how BLAS allocates data among threads, and understanding how BLAS’s threading model interacts with the underlying OpenMP runtime, are ongoing.
6 Initial feasibility experiments for the multi-axial benchmark
Thus far, this paper has used the earlier nine-story structural model analyzed by Ferry et al. (2014a); Ferry et al. (2014b) as an experimental vehicle to highlight how advancements in computational platforms over the last decade can be applied in RTHS. This section considers how the improvements demonstrated in the previous two sections may be leveraged to provide millisecond-scale RTHS for the more complex multi-axial benchmark problem at scale.
As described in Section 3.2, the implementations of the multi-axial model perform standalone hybrid simulations using the CyberMech platform. A single model size is tested, with 29 degrees of freedom (DoF), as a proof of concept to demonstrate the problem’s difficulty and gauge its ability to exploit the parallelism available on a multi-core processor.
6.1 Multicore execution times
The execution times of each time step in the simulation are first measured, again testing with 1–127 cores, and for each run reporting the median,
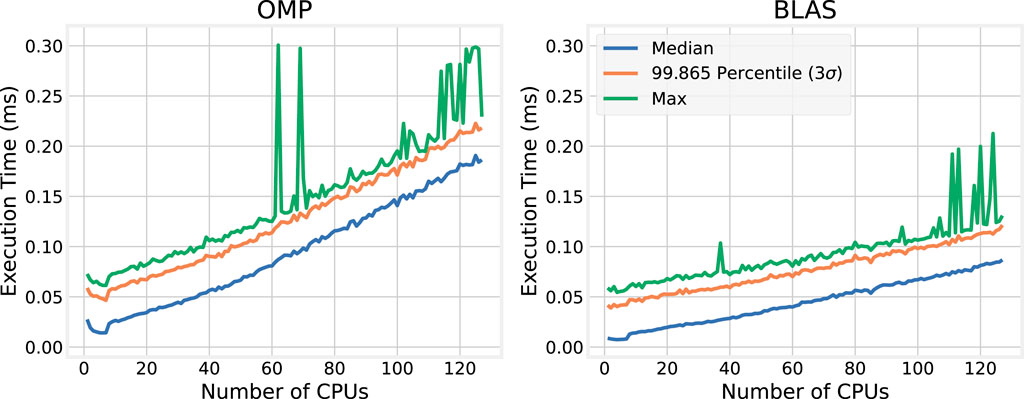
Figure 17. Standalone virtual maRTHS execution time statistics for each core count.
The results tell a similar story to those in Section 5, indicating that the high-end AMD EPYC CPU, coupled with modern kernel, middleware, and compiler support, is more than sufficient to enable millisecond-scale virtual maRTHS. For the model size tested, with only 29 degrees of freedom, each simulation time step completes in well under
However, the plots in Figure 17 demonstrate timing behavioral patterns that are noteworthy, and differ slightly from those observed in Section 5 for the nine-story structural simulation. For example, the
Unsurprisingly, and consistent with the results from the nine-story structural model, the BLAS implementation is more efficient than OMP. Figure 18 plots the ratio of OMP to BLAS execution times. On a single core, the median execution time for BLAS is more than
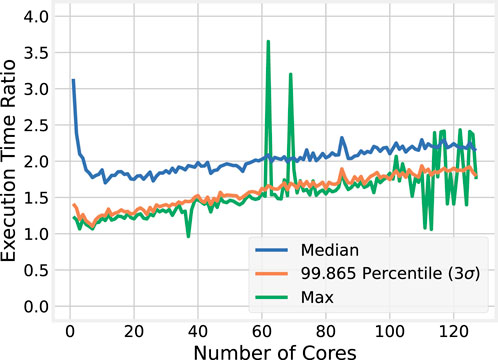
Figure 18. Execution time ratios between OMP and BLAS implementations of standalone virtual maRTHS.
6.2 Discussion
The results of the scalability analysis for the standalone virtual implementation of the maRTHS benchmark problem tell a conclusive story. For the evaluated model, the worst-case execution time remains under
7 Conclusions and future work
The experimental benchmark control problem for multi-axial real-time hybrid simulation (maRTHS), newly released to the community by (Condori et al., 2023), proposes a more realistic, albeit more complex, approach toward seismic testing. This paper has considered the computational requirements towards realizing millisecond-scale maRTHS.
Pursuant to this, it has presented evaluations of the semantically simpler nine-story structural model analyzed by Ferry et al. (2014a,b). The results of those evaluations demonstrate that in the decade since that analysis, improvements in modern computational platforms offer significant speedups, enabling sub-millisecond RTHS even for large models with 1,188 degrees of freedom. The greatest speedups were achieved by taking advantage of the parallelism offered by a modern 128-core AMD EPYC processor, and optimizing matrix operations using BLAS and LAPACK.
Evaluations of a standalone virtual implementation of the maRTHS benchmark in the CyberMech platform (Condori et al., 2020) were also presented. On a smaller model with only 29 DoF, it was possible to simulate each timestep in under
As an initial feasibility and scalability analysis, this paper illuminates several directions of investigation and development toward implementation of the next-generation MechWorks concurrency platform. While a latency model that explains the execution times of the purely OpenMP-based implementation of the nine-story structural model has been proposed and analyzed for different model sizes and on different numbers of cores, that same latency model does not fully capture the semantics of BLAS, for which execution time also has a term that depends on the number of model degrees of freedom but not on the number of cores. Efforts to develop richer execution models that explain the observed data are ongoing.
Furthermore, the maRTHS evaluation thus far has been in a simplified experimental environment. Toward supporting full maRTHS with finer resolution (both in time and in models’ degrees of freedom) on MechWorks, it will be necessary to identify and address additional limitations of the current computational platform. Development of new operating system and middleware thread scheduling platforms, using distributed networked endsystems, and acceleration with heterogeneous computing architectures such as GPUs and FPGAs, are all underway.
Data availability statement
The raw data supporting the conclusions of this article will be made available by the authors, without undue reservation.
Author contributions
MS: Conceptualization, Data curation, Formal Analysis, Investigation, Methodology, Software, Validation, Visualization, Writing–original draft, Writing–review and editing. OB: Data curation, Investigation, Methodology, Software, Validation, Visualization, Writing–review and editing. TM: Investigation, Software, Writing–original draft. BS: Investigation, Software, Writing–review and editing. TZ: Methodology, Software, Writing–review and editing. S-BK: Methodology, Software, Writing–original draft, Writing–review and editing. CG: Conceptualization, Funding acquisition, Project administration, Resources, Supervision, Writing–original draft, Writing–review and editing. AP: Conceptualization, Funding acquisition, Resources, Supervision, Writing–review and editing.
Funding
The author(s) declare that financial support was received for the research, authorship, and/or publication of this article. The research reported in this article is part of a multi-institution project titled “Collaborative Research: CPS: Medium: Co-Designed Control and Scheduling Adaptation for Assured Cyber-Physical System Safety and Performance” that has been supported in part by the NSF Cyber-Physical Systems (CPS) program through grants CNS-2229290 (at Washington University in St. Louis) and CNS-2229136 (at Purdue University).
Acknowledgments
The authors wish to thank our colleagues and collaborators Johnny Condori Uribe, Manuel Salmeron, Edwin Patino, Herta Montoya, Shirley Dyke, Christian Silva, Amin Maghareh, Mehdi Najarian and Arturo Montoya, who developed and published the multi-axial benchmark problem (Condori et al., 2023) that inspires the work presented here.
Conflict of interest
The authors declare that the research was conducted in the absence of any commercial or financial relationships that could be construed as a potential conflict of interest.
Publisher’s note
All claims expressed in this article are solely those of the authors and do not necessarily represent those of their affiliated organizations, or those of the publisher, the editors and the reviewers. Any product that may be evaluated in this article, or claim that may be made by its manufacturer, is not guaranteed or endorsed by the publisher.
Supplementary material
The Supplementary Material for this article can be found online at: https://www.frontiersin.org/articles/10.3389/fbuil.2024.1424721/full#supplementary-material
Footnotes
1For purposes of this scalability study, the simulation is allowed to slow its rate in response to overruns—i.e., when a single iteration of a model with a large number of degrees of freedom exceeds 1/1,024 s due to insufficient processor cores—and record the corresponding execution times.
2An exact value is not reported in the text, but (Ferry et al., 2014a; Figure 6) provides an estimate.
3These coefficients are specific to the tested model on a given computational platform. This characterization process must be repeated when testing different models or different target computers. They should not be affected by changing the simulated ground motions, as these only influence the values used by the computations, but not the computational instructions themselves.
References
Aguilar, N. E. C. (2012). Development and validation of a real-time computational framework for hybrid simulation of dynamically-excited steel frame structures. West Lafayette, IN: Purdue University. Ph.D. thesis.
Blackham, B., Shi, Y., Chattopadhyay, S., Roychoudhury, A., and Heiser, G. (2011). “Timing analysis of a protected operating system kernel,” in 2011 IEEE 32nd real-time systems symposium, 339–348. doi:10.1109/RTSS.2011.38
Condori, J., Maghareh, A., Orr, J., Li, H.-W., Montoya, H., Dyke, S., et al. (2020). Exploiting parallel computing to control uncertain nonlinear systems in real-time. Exp. Tech. 44, 735–749. doi:10.1007/s40799-020-00373-w
Condori, J. W., Salmeron, M., Patino, E., Montoya, H., Dyke, S. J., Silva, C. E., et al. (2023). Experimental benchmark control problem for multi-axial real-time hybrid simulation. Front. Built Environ. 9. doi:10.3389/fbuil.2023.1270996
[Dataset] seL4 (2024). The sel4 microkernel. Available at: https://docs.sel4.systems/projects/sel4/ (Accessed April 8, 2024).
Ferry, D., Bunting, G., Maqhareh, A., Prakash, A., Dyke, S., Aqrawal, K., et al. (2014a). “Real-time system support for hybrid structural simulation,” in 2014 international conference on embedded software (EMSOFT), 1–10. doi:10.1145/2656045.2656067
Ferry, D., Li, J., Mahadevan, M., Agrawal, K., Gill, C., and Lu, C. (2013). “A real-time scheduling service for parallel tasks,” in Proceedings of the 2013 IEEE 19th Real-Time and Embedded Technology and Applications Symposium (RTAS) (Washington, DC, USA: IEEE Computer Society), 13, 261–272. doi:10.1109/RTAS.2013.6531098
Ferry, D., Maghareh, A., Bunting, G., Prakash, A., Agrawal, K., Gill, C., et al. (2014b). “On the performance of a highly parallelizable concurrency platform for real-time hybrid simulation,” in The sixth world conference on structural control and monitoring.
Li, J., Saifullah, A., Agrawal, K., Gill, C., and Lu, C. (2014). “Analysis of federated and global scheduling for parallel real-time tasks,” in Proceedings of the 2012 26th euromicro conference on real-time systems (Madrid (Spain): IEEE Computer Society Press). ECRTS ’14.
Nakata, N., Spencer Jr, B. F., and Elnashai, A. S. (2010). Sensitivity-based external calibration of multiaxial loading system. J. Eng. Mech. 136, 189–198. doi:10.1061/(asce)0733-9399(2010)136:2(189)
Ohtori, Y., Christenson, R. E., Spencer, B. F., and Dyke, S. J. (2004). Benchmark control problems for seismically excited nonlinear buildings. J. Eng. Mech. 130, 366–385. doi:10.1061/(ASCE)0733-9399(2004)130:4(366)
Orr, J., Condori, J., Gill, C., Baruah, S., Agrawal, K., Dyke, S., et al. (2020). “Elastic scheduling of parallel real-time tasks with discrete utilizations,” in Proceedinds of 28th international conference on real-time networks and systems (ACM), 117–127. doi:10.1145/3394810.3394824
Orr, J., Gill, C., Agrawal, K., Baruah, S., Cianfarani, C., Ang, P., et al. (2018). “Elasticity of workloads and periods of parallel real-time tasks,” in Proc. Of 26th international Conference on real-time Networks and systems (ACM), 61–71. doi:10.1145/3273905.3273915
Orr, J., Gill, C., Agrawal, K., Li, J., and Baruah, S. (2019). Elastic scheduling for parallel real-time systems. Leibniz Trans. Embed. Syst. 6, 05–05:14. doi:10.4230/LITES-v006-i001-a005
Keywords: real-time hybrid simulation, multicore platforms, parallel real-time scheduling, scalability, multi-axial benchmark
Citation: Sudvarg M, Bell O, Martin T, Standaert B, Zhang T, Kwon S-B, Gill C and Prakash A (2024) Towards a concurrency platform for scalable multi-axial real-time hybrid simulation. Front. Built Environ. 10:1424721. doi: 10.3389/fbuil.2024.1424721
Received: 28 April 2024; Accepted: 15 July 2024;
Published: 18 September 2024.
Edited by:
Wei Song, University of Alabama, United StatesReviewed by:
Tao Wang, China Earthquake Administration, ChinaLaura Giovanna Guidi, University of Naples Federico II, Italy
Copyright © 2024 Sudvarg, Bell, Martin, Standaert, Zhang, Kwon, Gill and Prakash. This is an open-access article distributed under the terms of the Creative Commons Attribution License (CC BY). The use, distribution or reproduction in other forums is permitted, provided the original author(s) and the copyright owner(s) are credited and that the original publication in this journal is cited, in accordance with accepted academic practice. No use, distribution or reproduction is permitted which does not comply with these terms.
*Correspondence: Marion Sudvarg, bXN1ZHZhcmdAd3VzdGwuZWR1