 Hongfu Liu
 Bo Chen
 Zhonglu Cao3,4*
 Tuo Huang
 Songtao Lv
- 1National Engineering Research Center of Highway Maintenance Technology, Changsha University of Science and Technology, Changsha, Hunan, China
- 2School of Traffic and Transportation Engineering, Changsha University of Science and Technology, Changsha, Hunan, China
- 3Tianjin Port Engineering Institute Co., Ltd. of CCCC First Harbor Engineering Co., Ltd., Tianjin, China
- 4CCCC First Harbor Engineering Company Ltd., Tianjin, China
To study the real internal strain response of asphalt pavement and provide crucial data for optimizing pavement design. By burying the fiber grating sensors on site, the strain tests of four asphalt pavement structures under different working conditions were carried out, and the results showed that the static strain time curve is viscoelastic and conforms well to the Bugers model, and the fitting coefficient of determination is 0.98. The strain response of the asphalt surface courses of the four pavement structures under static load shows a double hump variation with the transverse position, with peaks occurring directly beneath the wheel load center. The transverse strain fluctuated between tension and compression, mirroring changes in the lateral position. While longitudinal strains, always tensile, were symmetrically aligned with the centerline of the longitudinal sensors, this pattern differed notably from that of the transverse sensors. In the base layers, the strain profile typically presented a single peak, located at the wheel gap, underscoring a critical area of stress concentration. Numerically, the peak strain of asphalt surface course is larger than that of base course. The most unfavorable loading position of the base course occurs at the wheel gap of the lower base course. The most adverse loading position of the surface course appears at the wheel load at the bottom of the upper or middle course. The research results can provide data support for improving the design method of asphalt pavement.
1 Introduction
For the study of pavement performance, some researchers mainly use full-scale experimental roads and loop roads to investigate its mechanical response (Liu and Chen, 2013). The mechanical response of various pavements under the practical traffic load is obtained and analyzed. In the late 1950s, experimental roads of American Association of State Highway (AASHTO) were paved, which still had an influence on the development of pavement technology worldwide (Metcalf, 2016; Milad et al., 2022). The MnROAD project in Minnesota, United States, provided a foundational platform for analyzing and comparing the service performance of various pavement structures (Burnham et al., 2020). In the middle 1990s, the WesTrack experimental roads of Western Beltway in America was used to study the design specifications for hot-mix asphalt mixture based on the serviceability, which strongly supported the innovative research of the Superpave design method (Wen, 2003). For a pavement loop of the National Center for Asphalt Technology Research (NCAT) (Brown et al., 2004; Yuan and Zhou, 2005; Timm and Newcomb, 2006; Tai and Wen, 2013), a total of 46 test sections are paved all with flexible base asphalt pavement structure. Based on actual response observation and analysis results, the construction of NCAT loop is facilitated, which provides a necessary role in validating the design theory. The mechanical response of actual pavement has been observed in a loop of the Central Laboratory of Roads and Bridges (LCPC) (Wang et al., 2021), a test loop of Japanese Road Engineering Research Institute (Zhou, 2019), and a full-scale loop of the Spanish Public Facilities Research and Testing Center (Liu et al., 2023), they have carried out the observation of the mechanical response of the actual pavement structure, which have provided the necessary basis for promoting the progress of pavement design methods in various countries. There are many researches on the actual response of pavement structure based on indoor and outdoor accelerated loading tests, including outdoor accelerated loading test of the Australian accelerated loading facility (ALF) (Duan, 2022), outdoor straight-line accelerated loading test of the South African heavy vehicle simulator (HVS) (Saevarsdottir et al., 2016) and mobile load simulator (MLS) (Wu and Ye, 2014), and indoor accelerated pavement test (APT) of British transport research laboratory (TRL), etc. (Raj et al., 2022). With the development of China’s comprehensive national strength, the issue of heavy and overloaded vehicles has become increasingly pronounced. Therefore, research into the structural and mechanical responses of pavements, facilitated by the construction of experimental roads and full-scale loop roads, has emerged as a focal point in China. Based on indoor experimental roads, Kaiwen Zhao and Hongwei Zhang established a model of typical and atypical asphalt pavement structures under moving non-uniform load, and compared the pavement service life under moving non-uniform load and static bicircular uniform load by combining the design indexes of each pavement structure (Kaiwen et al., 2022). He Ziye and He Bin performed the static mechanical analysis of continuously reinforced concrete pavement (CRCP) by using finite elements, and concluded that the critical loading level of CRCP changed with the debonding range, depending on the relative position of debonding range and wheel load (Ziye et al., 2016). Wu Yu and Jiang Xin carried out the static mechanical analysis on the experimental section of the asphalt pavement project of Chengde South Expressway by comparing static bending and settlement experimental values of the Beckman beam road surface. The analysis show that the semi-rigid base asphalt pavement with the same thickness has a strong mechanical advantage, and the inverted asphalt pavement under load is relatively unfavorable (Yu et al., 2017). Lingling Ding constructed a three-dimensional model for static analysis based on the field measurement results, and analyzed the distribution laws of horizontal tensile stress, vertical compressive stress, vertical displacement, and shear stress of the applied structure in the experimental section under the standard load form. It is shown that the most unfavorable location of horizontal tensile stress is at the inner side edge of the load; the maximum value of vertical compressive stress, and the maximum vertical displacement appear at the center of the load; the vertical shear stress increases first, and then decreases gradually to zero at both the center and inner side edge of load (Ding, 2022). Xiao Chuan conducted a comparison experimental on dynamic and static bending and settlement of three pavement structures through a field experimental road. It is found that dynamic bending and settlement values of different asphalt pavements are smaller than static bending and settlement values; as the radial distance increases, dynamic bending and settlement values decrease, while static bending and settlement values increase (Xiao, 2014). Based on the actual project in Fujian Province, Hu Xiaowen found that the shear stress did not show continuous tensile and compressive changes under load by combining field experimental, theoretical analysis, numerical simulation and indoor experimental (Hu, 2016). Based on ANSYS finite element theory and Langcang Expressway construction project, Pan Fuqiang established a model of rubber asphalt pavement structure statics, and proposed its mechanical design indexes through static analysis (Pang, 2013). Based on the experimental roads of Guangzhou- Zhaoqing Highway, Liu Hongfu analyzed the dynamic strain response of four asphalt pavement structures under different coursess, working conditions and vehicle speeds, and revealed the dynamic strain response variation law of asphalt pavement with different base types under traffic load (Hongfu et al., 2021). Zhang Huizhong, relying on the engineering experimental roads on the semi-rigid grass-roots asphalt pavement dynamic strain measurement analysis, the results show that the maximum longitudinal and transverse tensile strains appear in the bottom of the cold regeneration courses (huizhong et al., 2017). Based on RIOHTrack full-scale ring road, Wang Xudong analyzed the variation law of internal mechanical response behavior of asphalt pavement structure under different influencing factors (Xudong et al., 2020).
Due to the need to use strain gauge, displacement meter and other sensor technology to determine the internal force of asphalt pavement structure. However, traditional strain gauges with disadvantages of low accuracy and survivability do not reflect the real deformation of asphalt concrete (Liu et al., 2019; Xin et al., 2020). Fiber Bragg grating optical sensors with outstanding advantages are widely used for response monitoring of pavement structure (Bang et al., 2012; Rodrigues et al., 2012; Yiqiu et al., 2014). In recent years, it is even applied in various fields, such as indoor studies of rutting performance (Xie et al., 2017), health monitoring of airport pavements (Cary et al., 2018; Ma et al., 2019) and thermal curling of concrete pavement slab (Liao et al., 2020). Pan et al. (2017) conducted experiments based on actual projects to illustrate the real mechanical response of pavement structure can be evaluated reasonably and feasibly by using fiber Bragg grating optical sensors for field test. Tian et al. successively constructed a finite element model of the coordinated deformation of fiber Bragg grating optical sensors and asphalt mixture, and designed an indoor evaluation method to assess the effectiveness of fiber Bragg grating optical sensors for the internal strain monitoring of pavement structures through comparative analysis (Tan et al., 2009; Tian et al., 2009).
Indoor model simulation tests simplify the complex environmental conditions of pavement. Yet they often fail to capture the nuanced realities of actual pavement scenarios. Some simulation results are not supported by the data related to the actual pavement, and their accuracy needs further consideration. Some experimental pavement structures with relatively single form lack comparative analysis between different pavements and less analysis of lateral strain, and their analysis conclusions have certain limitations. Therefore, four asphalt pavement structures were designed in this paper, based on the design experience of asphalt pavement at home and abroad, and a experimental roads of the Guangzhou- Zhaoqing Highway was used for actual field measurement. Fiber Bragg grating optical sensors were used to conduct the field experimental under standard vehicle static load, and the strain distribution law of each structural course of four different pavement structures was explored, compared, and analyzed. It is expected that the research results will provide new guidance and reference for pavement structure design.
2 Experimental roads and test equipment
2.1 Experimental roads structure
In this study, four experimental roads with different pavement structures were studied and analyzed. The original scheme includes a semi-rigid base asphalt pavement S1, a combined base asphalt pavement S2, a flexible base asphalt pavement S3, and a graded crushed stone subbase asphalt pavement S4. These structures have the same asphalt surface course, the wearing course is thick medium-grained asphalt concrete AC-16 (SBS modified asphalt), the middle surface is thick medium-grained asphalt concrete AC-20, and the lower surface is thick coarse-grained asphalt concrete AC-25. The main difference is the use of different base materials. Among them are asphalt-treated base (ATB), asphalt concrete (AC), graded aggregate base (GAB), cement-treated base (CTB). In Figure 1, the four typical asphalt pavement structures were illustrated in this study. The construction of the experimental section meets the requirements of “Technical Specification for Highway Asphalt Pavement Construction” (JTG F40-2004). The quality management, inspection and acceptance of the experimental section are carried out in accordance with the “Highway Asphalt Pavement Design Code” (JTG D50-2017). The failure modes and engineering characteristics of pavement structures are shown in Table 1.
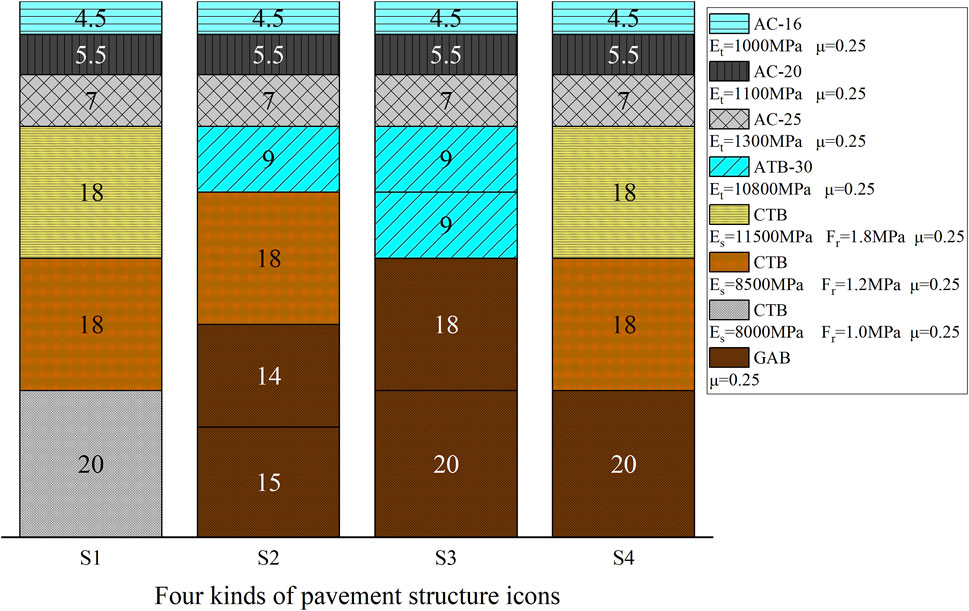
Figure 1. Illustration of four asphalt pavement structures.
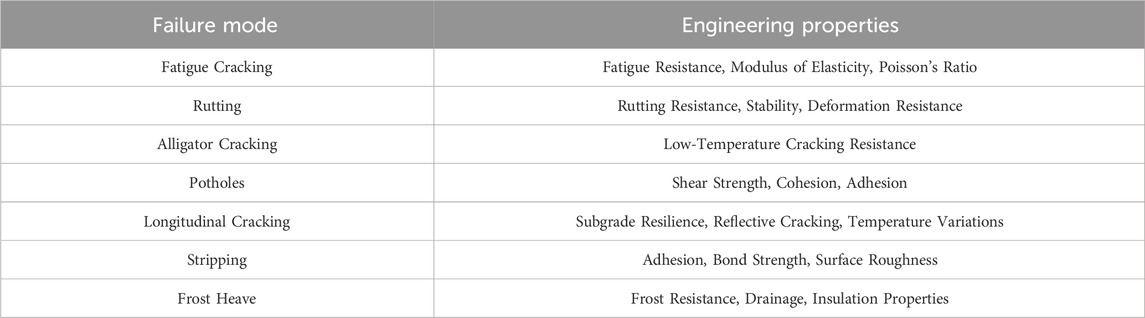
Table 1. Failure mode and engineering characteristics of pavement structure.
2.2 Sensor layout
In this paper, strains at the bottom of structural courses were measured by using an embedded fiber Bragg grating optical sensors encapsulated by glass fiber reinforced plastic (GFRP) (model: CB-FBG-EGE-100; gauge length: 8 cm). The temperature experimental of structural courses and the temperature compensation of strain transducer were carried out by using a sensitized encapsulated fiber optic grating temperature sensor (model: FBG-IT-01). These sensors were pre-buried before the construction. This method can greatly reduce the scope and depth of excavation trench, and cannot cause unsafe construction of the road and affect the continuity of pavement. At the same time, while maintaining the integrity of pavement, the problem of low sensor survival rate is effectively solved. Four sections in the experimental roads of four structures were selected to bury fiber Bragg grating optical sensors. The arrangement of sensors includes sensors for detecting transverse strain, sensors for detecting longitudinal strain and sensors for measuring temperature.
2.3 Loading scheme
The loading method is the standard wheel load BZZ-100, using the direct loading of the left rear wheel. The loading time is 20 min, and the unloading time is 15 min. The pavement deformation and recovery process are very slow, so that the time interval from unloading to the second loading must exceed 24 h, the accuracy of subsequent measurement results is maintained while ensuring the complete recovery of pavement deformation.
When the vehicle is driving on the road, the trajectory of the wheel is always swinging around in a certain range near the center line of the cross section. Figure 2 shows the lateral distribution frequency curve of the wheel track in a lane during one-way driving. Therefore, this experimental includes seven lateral working conditions of different loading position. During the field test, the position of the wheel load and the sensor is corrected by the parallel motion of the wheel load: double wheel gap center and sensor center overlap; single wheel center and sensor center overlap; single wheel outer edge center and sensor center overlap. Single wheel outer edge center is 20 cm away from the sensor center. Compared with the design code for highway asphalt pavement (JTG D50-2017), this study changes seven working conditions to obtain the position corresponding to the maximum strain. The data under different working conditions are obtained by moving the vehicle load, and the working conditions corresponding to the maximum strain are finally obtained. The measuring points a is the wheel gap center. Measuring points d, c, b is left translated from the center, 16.0 cm, 26.6 cm, and 40.0 cm away from a respectively. Similarly, monitoring points e, f, g is right translated from the center, which are also 16.0 cm, 26.6 cm and 40.0 cm away from a respectively.
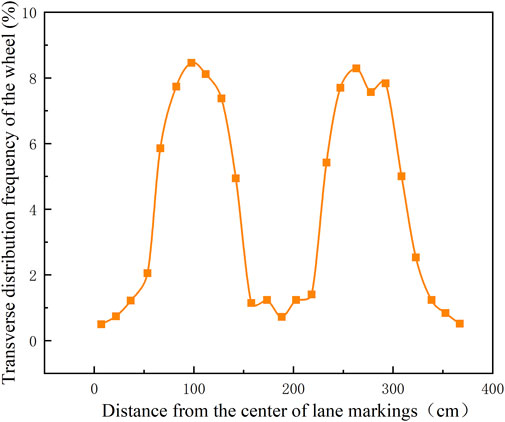
Figure 2. Transverse distribution frequency curve of wheel trace (One-way driving one lane).
The data sampling frequency of the fiber grating demodulator is 1,000 Hz. The strain calculation formula is:
Where T is strain.
The parameters of the calculated strain (uε) configured by the fiber grating demodulator manufacturer are as follows:
C2 = 0.1 uε/nm2; C1 = 1000 uε/nm; C0 = 0 uε; W0 corresponds to the wavelength of 0 uε.
The sensor layout and test process are given in Figure 3. The sensor layout plan of the test section is shown in Figure 4.
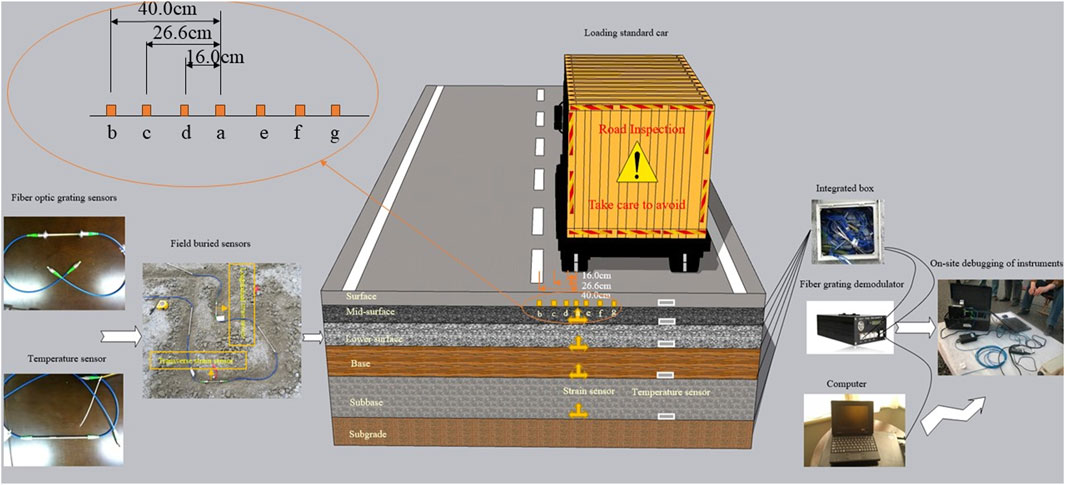
Figure 3. Sensor layout and signal acquisition device schematic diagram.
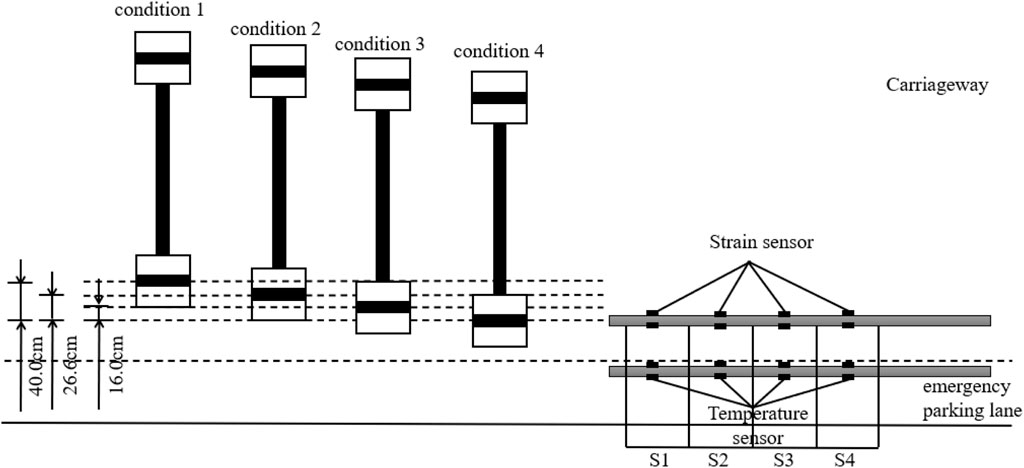
Figure 4. Experimental section sensor layout plan.
3 Strain response test results and analysis under static load
As mentioned in the previous section, the asphalt mixture is a viscoelastic material with significant temperature sensitivity. Therefore, calibration tests were conducted on the road surface and atmospheric temperatures before the field test. According to Eqs 1 and 2, strain values of road surface at 20oC were finally converted.
Taking 100 kN axle load as an example, the time history curve of the wheel load center of the wearing course of the structure S1 is fitted and analyzed according to the existing typical asphalt pavement viscoelastic model, and the fitting results are shown in Table 2.
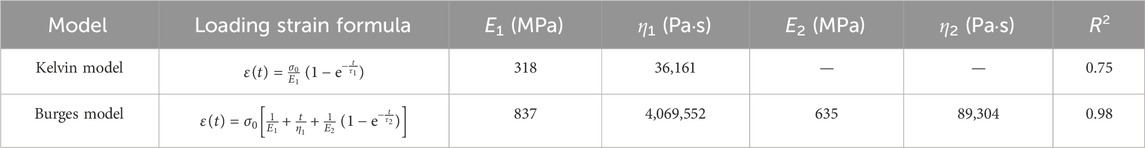
Table 2. Fitting results of measured strain.
It can be seen from Table 2 that as the model parameters increase, the better the fitting data with the field experimental. The parameter values fitted by the Burges model are consistent with those in Zhang (2014), affirming the reliability of the experimental method employed in this study. This consistency not only validates the experimental approach but also underscores the practical applicability of the classic Burgers model in real-world scenarios.
3.1 Waveform analysis of static strain response
The viscoelastic plasticity of the asphalt surface layer embodied in the time-course curve is shown in Figure 5.
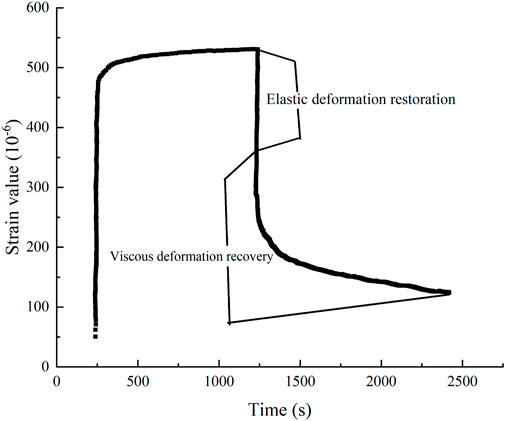
Figure 5. Time course curve of strain in asphalt surface courses.
It can be seen from Figure 5. Asphalt course static load unloading curve, with obvious viscoelasticity, in line with the typical creep curve; through the curve of the local amplification, can clearly distinguish the unloading of the instantaneous elastic deformation, viscous recovery of deformation, and irrecoverable plastic deformation, which the size of the plastic deformation and viscous deformation recovery time required with the reduction of the pavement temperature gradually become smaller.
3.1.1 Time-history curve of longitudinal strain (at the center of wheel gap)
Figure 6 illustrated the time-history curves of longitudinal strain at the wheel gap four schemes. it showed that the process of pavement deformation and recovery is notably slow, suggesting a need to establish specific stabilization times for both loading and unloading phases. As shown in Figure 6, the rising section is generated by loading while the falling section is produced by unloading. Meanwhile, when subjected to a static load, the introduction of axial load at a test point results in tensile strain, which intensifies and eventually stabilizes as the loading duration extends. Conversely, the removal of the axial load leads to an immediate reduction in tensile strain, which continues to decrease slowly over time as the unloading progresses. Moreover, the viscoelastic properties of the asphalt surface course are evident, as the tensile strain diminishes slowly with the continuation of the unloading phase. In contrast, the strain in the cement-stabilized base drops sharply the moment unloading begins and remains stable thereafter, indicating the brittleness of the semi-rigid base.
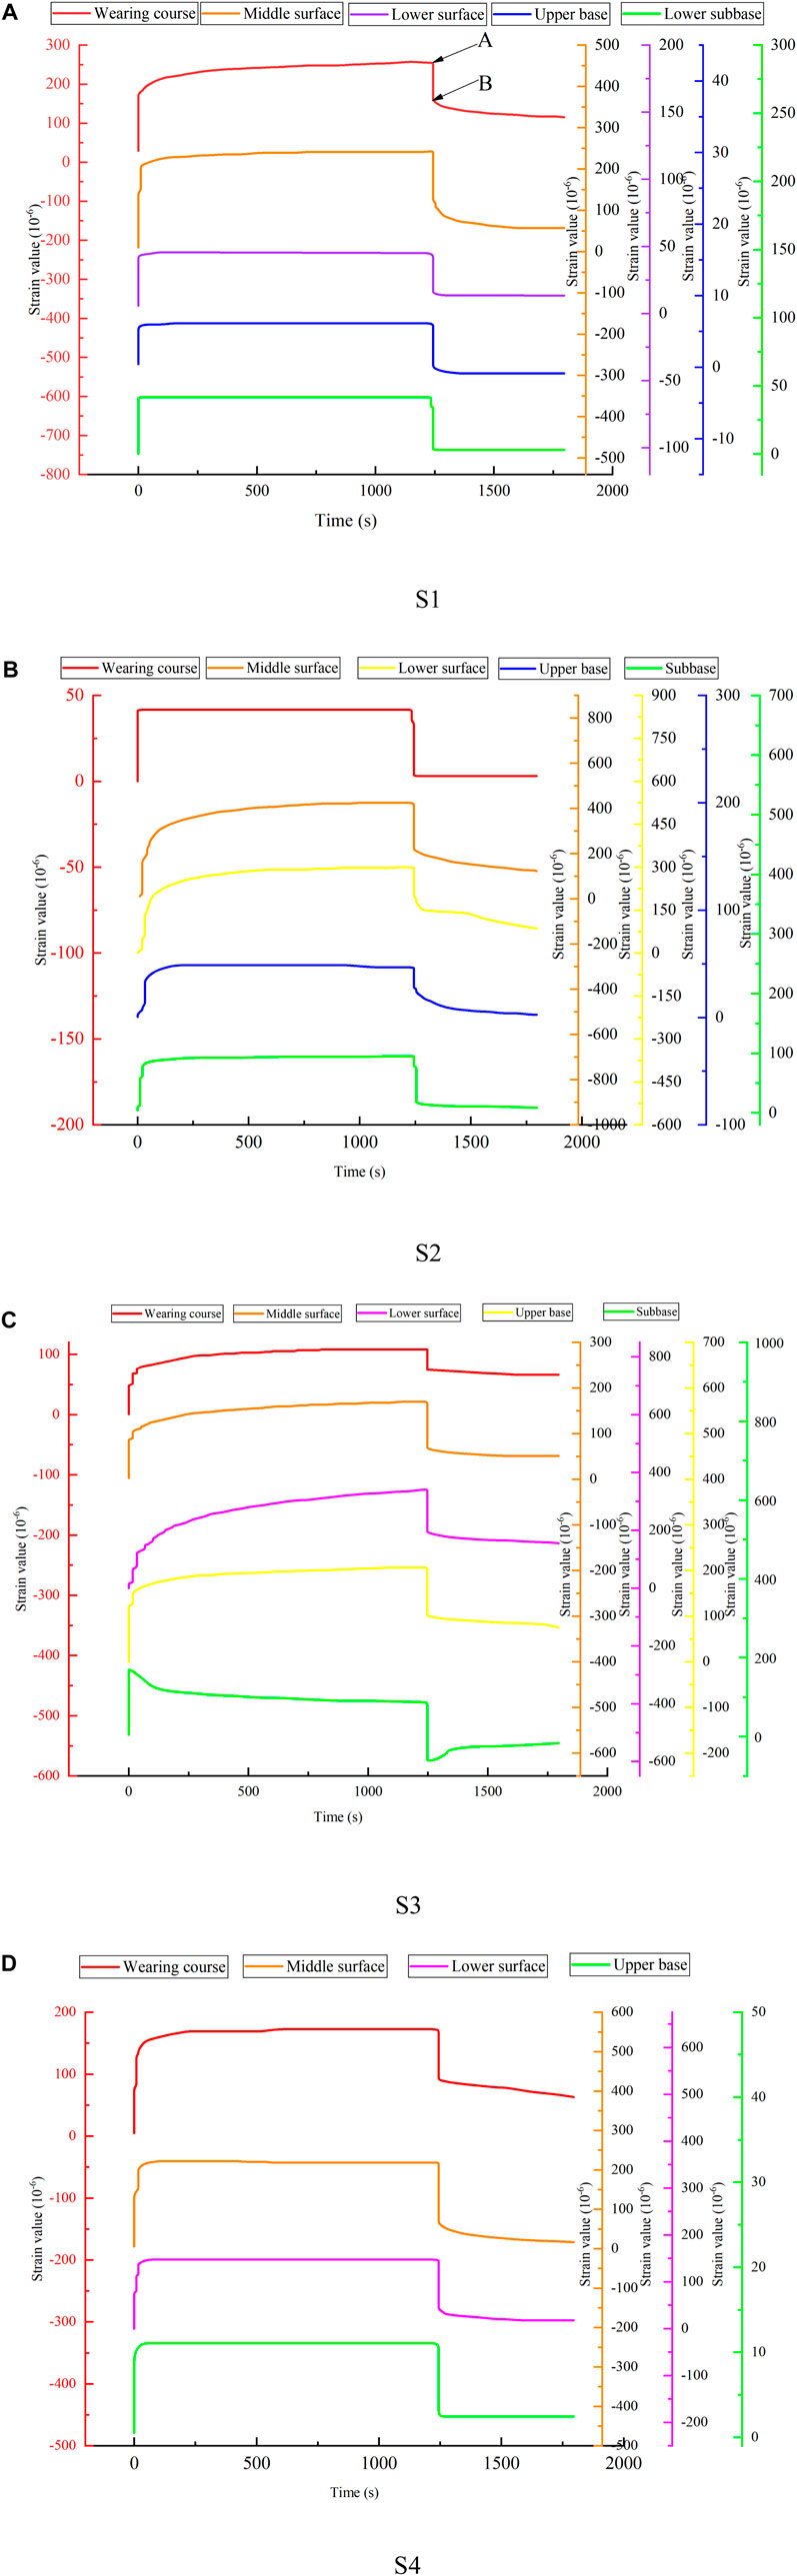
Figure 6. Time-history curves of longitudinal strain at the wheel gap four schemes. (A) S1 (B) S2 (C) S3 (D) S4.
3.1.2 Time-history curve of longitudinal strain (at the center of wheel load)
Figure 7 illustrated the time-history curves of longitudinal strain at the wheel load four schemes. it showed that the longitudinal strain time-history curves for all four asphalt pavement structures exhibit similar patterns at both the wheel load and wheel gap locations under static load. The relationship of strain values of surface course for each structure at the wheel load position is as follows: S4 > S1 > S3 > S2. The semi-rigid base asphalt pavement makes the asphalt surface course bear a larger longitudinal strain. The relationship of strain values of base course for each structure at the wheel load position is as follows: S3 > S2 > S4 > S1. The strain value of the subbase is large than that of the upper base. The strain value of a semi-rigid base is smaller than that of other pavement structures.
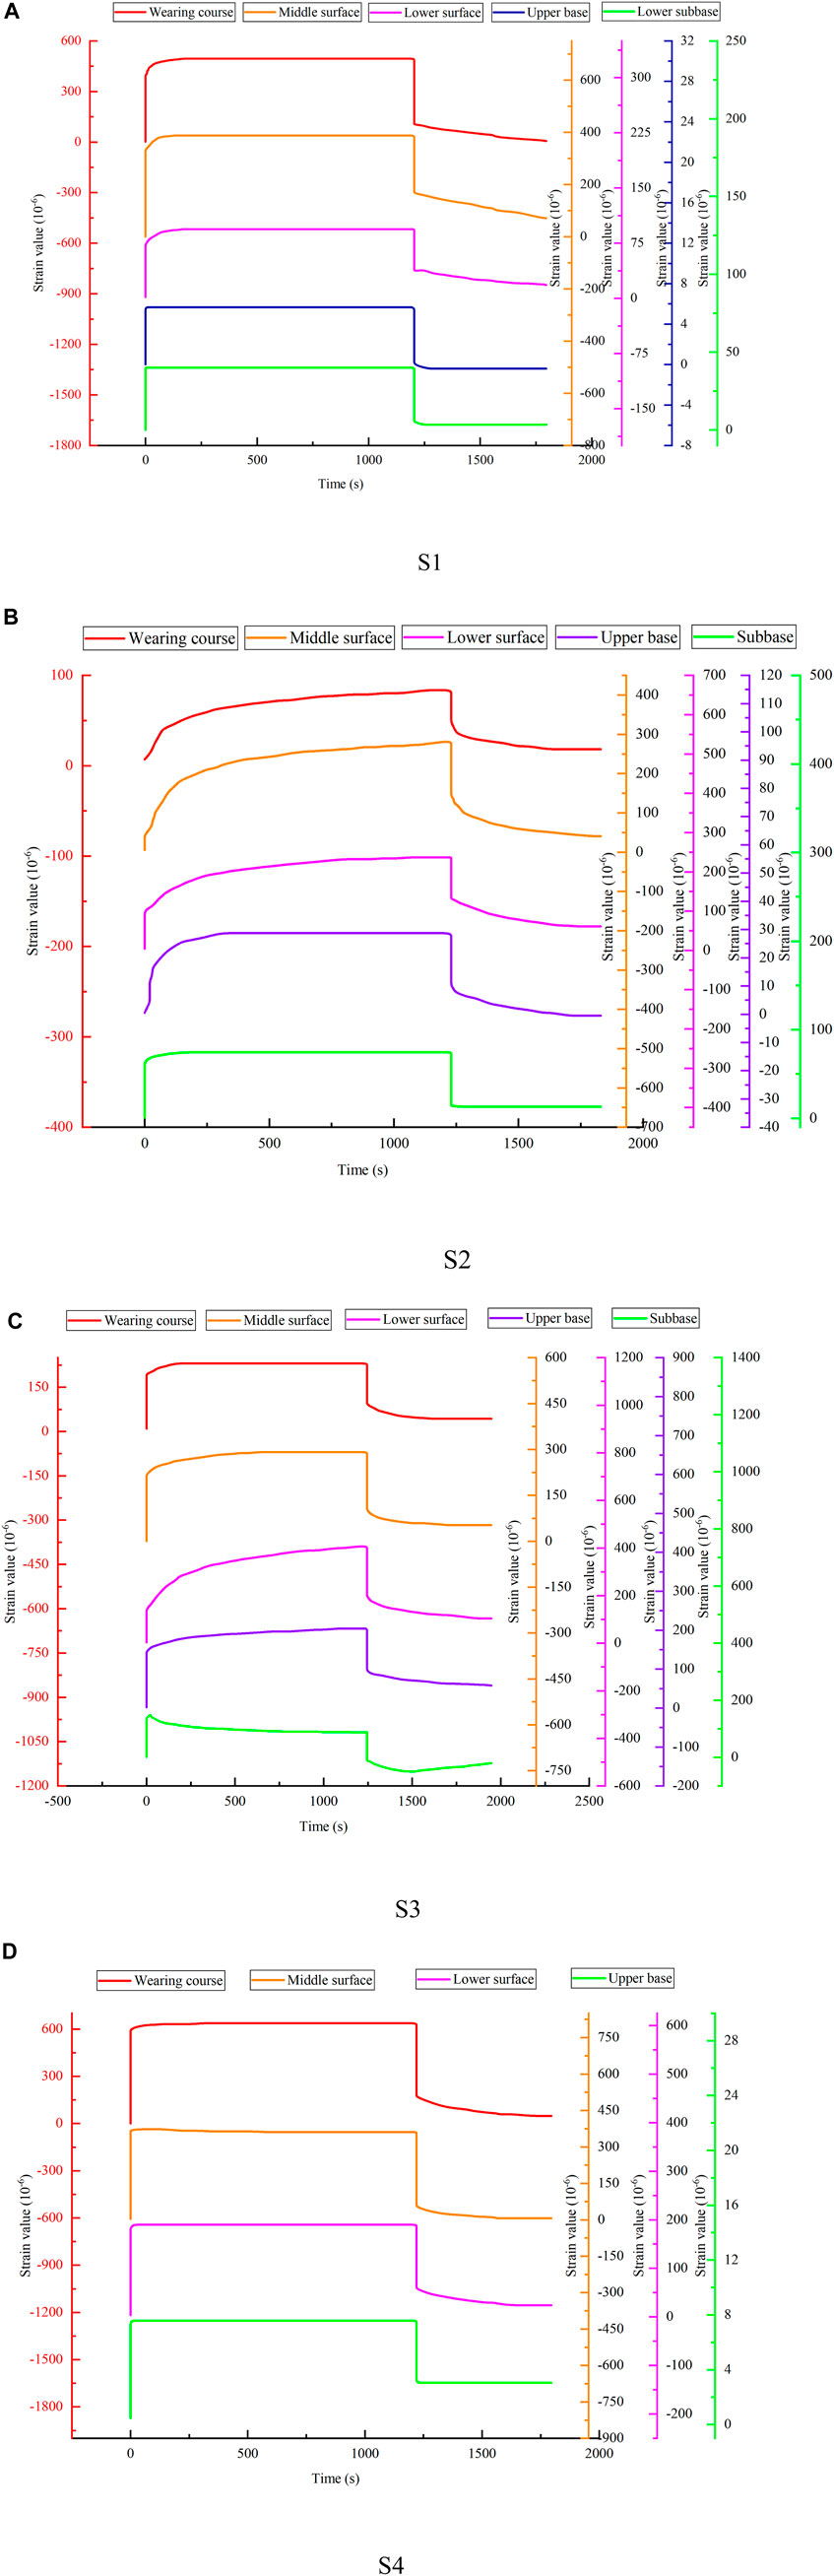
Figure 7. Time-history curves of longitudinal strain at the wheel load four schemes. (A) S1 (B) S2 (C) S3 (D) S4.
3.1.3 Time-history curve of transverse strain (at the center of wheel gap)
It can be seen from Figure 8 that since it had no obvious change at the center of wheel gap, the time-history curve of transverse strain at the wheel load position was analyzed in Section 3.1.4.
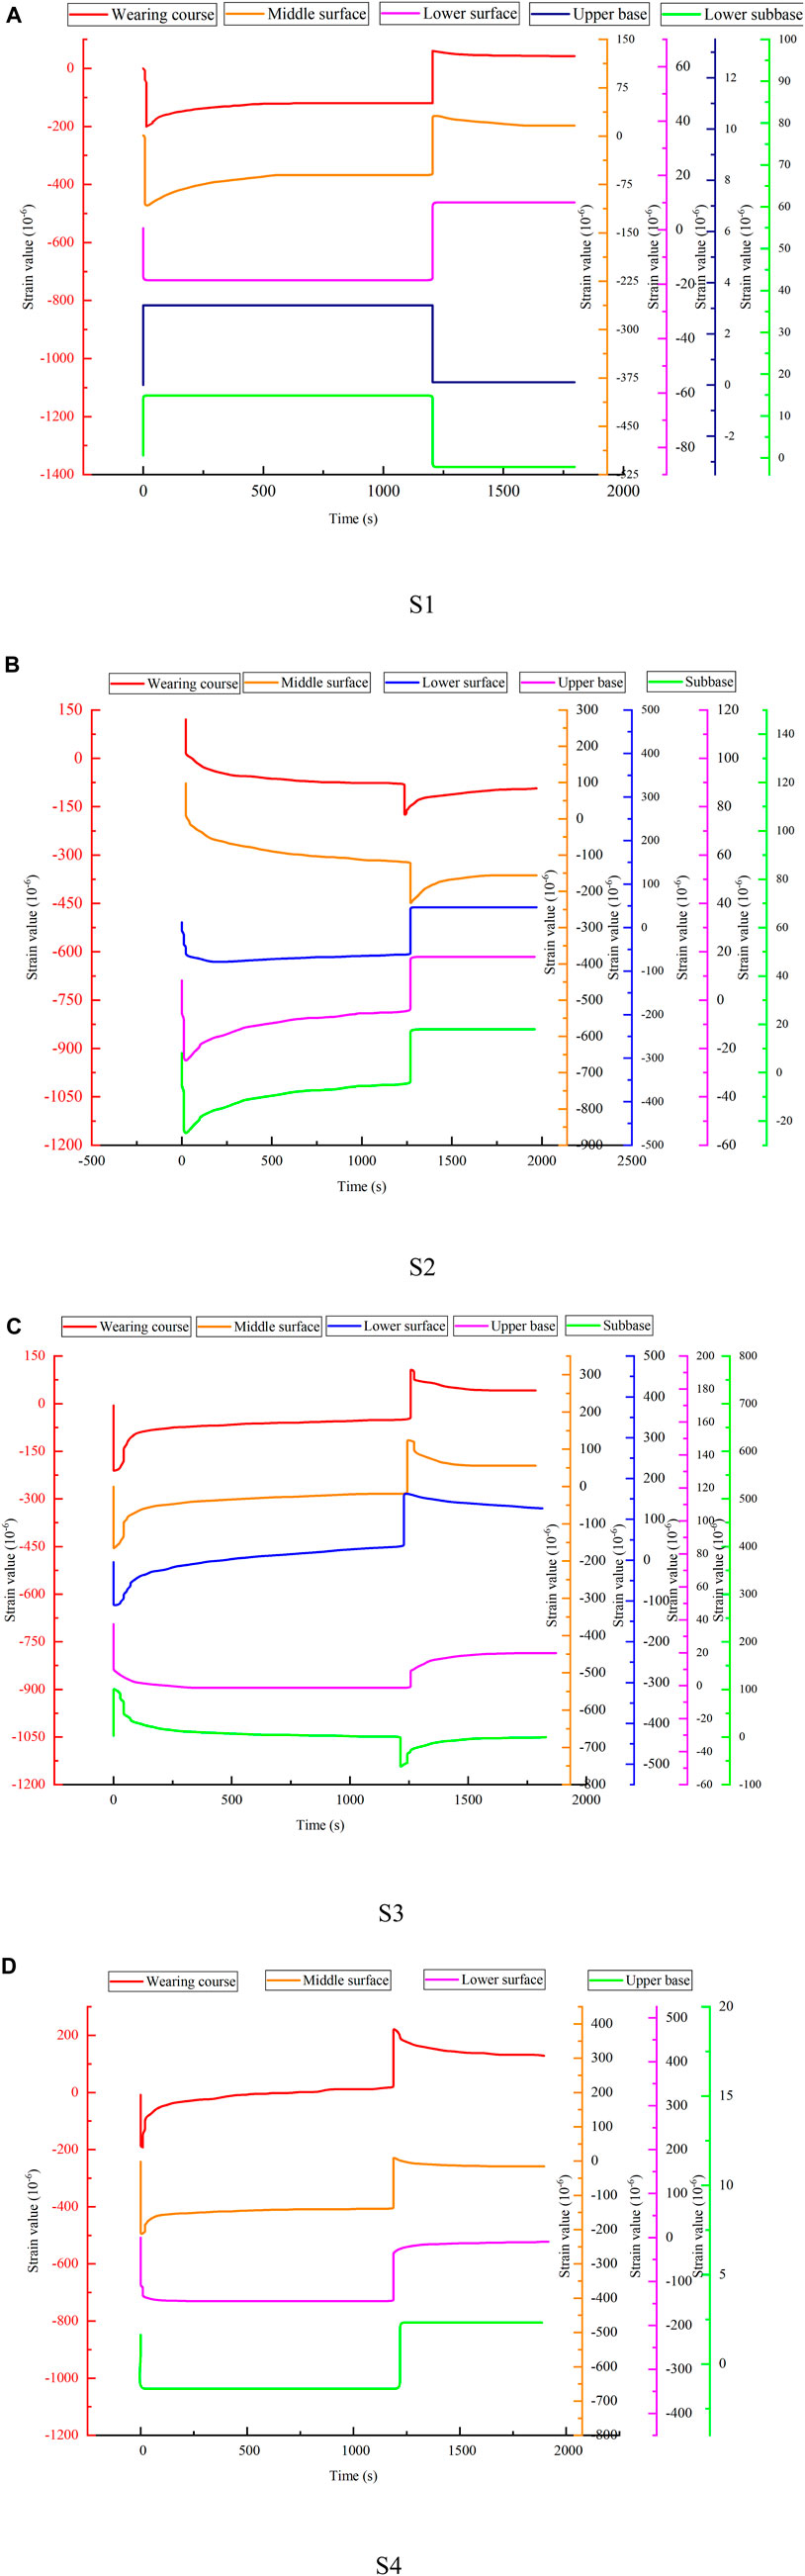
Figure 8. Time-history curves of transverse strain at the wheel gap four schemes. (A) S1 (B) S2 (C) S3 (D) S4.
3.1.4 Time-history curve of transverse strain (at the center of wheel load)
Figure 9 illustrated the time-history curves of transverse strain at the wheel load four schemes. it showed that the trend of transverse strain time-history curves at wheel load positions of four pavement structures is similar. The relationship of strain values of surface course at wheel load position are S4>S1>S3>S2, and the graded aggregate base asphalt pavement causes the asphalt surface courses to undergo a greater tensile strain. In terms of base course, the strain value of the subbase course is larger than that of the upper base course. The strain response of each structural courses of combined and flexible base asphalt pavement has a better continuity.
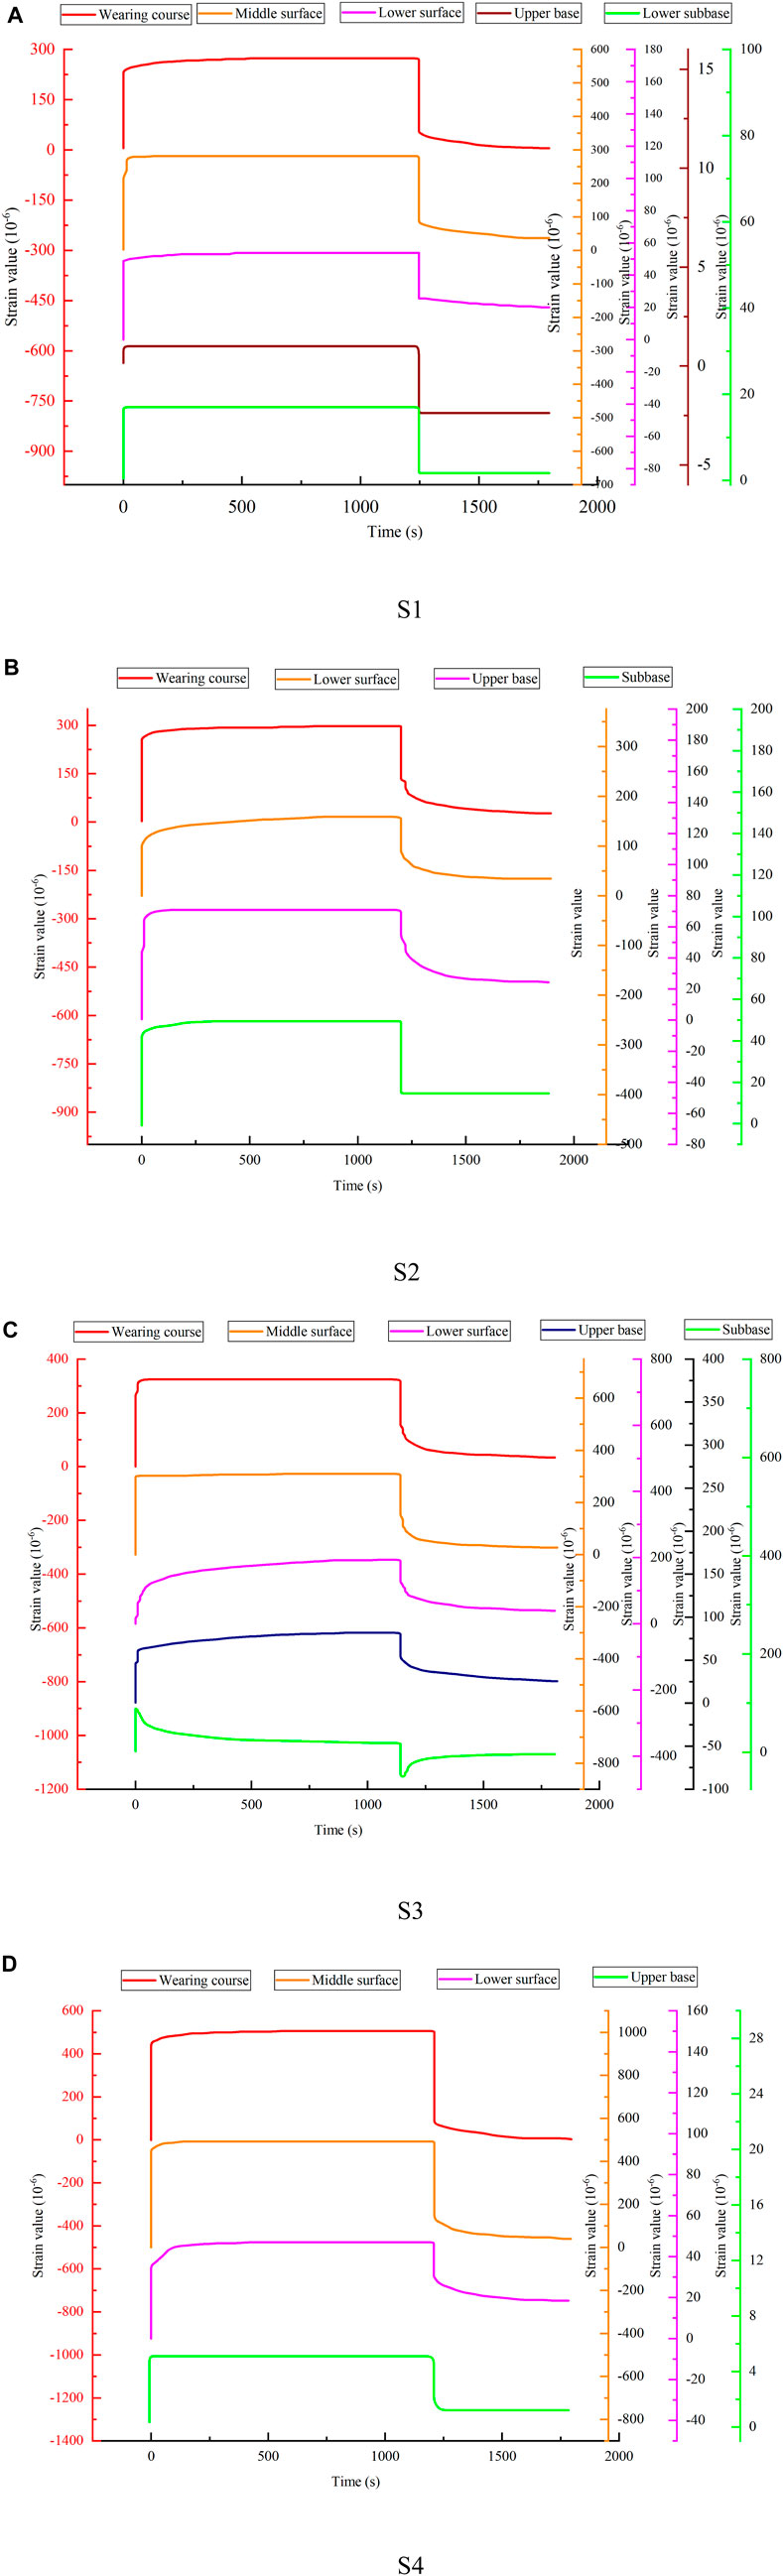
Figure 9. Time-history curves of transverse strain at the wheel load four schemes. (A) S1 (B) S2 (C) S3 (D) S4.
In summary, combined with the dynamic load conclusion (Hongfu et al., 2021), it is found that:
Compared with the dynamic load, the same is that when the axial load is close to the test point, the longitudinal strain at the bottom of each surface courses is compressive strain state, and the longitudinal strain at the bottom of the lower base courses is mainly tensile strain, and the strain peak of the lower base course is greater than that of the upper base course. The dynamic and static strain values at the bottom of the base courses are smaller than the dynamic and static strain values at the bottom of the surface courses. The difference is that under the action of dynamic load, when the axial load acts at the test point, each surface courses turns to tensile strain and reaches the peak. Under the action of static load, when the axle load is loaded at the test point, the longitudinal strain at the bottom of each surface course is transformed into tensile strain, and with the extension of loading time, the tensile strain gradually increases and then tends to be stable. When the axle load leaves each measuring point, the tensile strain instantaneously decreases, and the tensile strain gradually decreases with the increase of unloading time.
3.2 Static load test results under different loading positions
The experimental roads data in the latter figures were selected from section AB (Figure 5, S1) of the time-history curve for each scheme. The calculated data were obtained by BISAR software. In the calculation, it is assumed that the structural courses of the pavement are completely continuous. The road surface contact only considers the vertical contact stress and adopts uniform distribution. The size of the contact surface adopts the calculation result when the radial tire pressure is 690 kPa, and the single wheel load is 25 kN (that is, the axle load of the two-wheel group is 100 kN).
3.2.1 Strain test results and variation law of asphalt surface course
Figures 10, 11 show the strain distribution of asphalt surface under different loading positions of four pavement structures. From Figure 10, The measured transverse strain at the bottom of the asphalt courses in the experimental roads is like the calculated data with the change of different loading positions. The measured strain value is generally greater than the calculated value. And the tensile and compressive strain types of some measuring points are opposite to the calculation results, which is verified by Xie Jun’s conclusion (Xie, 2006; Zhang, 2014). The transverse strain shows a tension-compression-tension fluctuation with the change of position, of which the peak of tensile strain appears at the wheel load. The relationship of strain values at the wheel load is S4>S1>S3>S2, which means that the asphalt surface course is subjected to greater tensile strain due to the graded aggregate base. The loading position has a great influence on the peak value of the static strain response. When the loading position changes only by 16 cm, the peak value of the static strain response of the wearing course of the S1 structure increases by 259%, the peak value of the static strain response of the wearing course of the S2 structure increases by 195%, the peak value of the static strain response of the wearing course of the S3 structure increases by 200%, and the peak value of the static strain response of the wearing course of the S4 structure increases by 115%. The longitudinal strain in Figure 11 is like the transverse strain, and the strain peak of the two occurs at the wheel load. The strain at the wheel gap is tensile strain. The relationship of longitudinal strains is S1>S4>S3>S2, when the loading position changes only 16 cm, the peak value of the static strain response of the wearing course of the S1 structure increases by 122%, the peak value of the static strain response of the wearing course of the S2 structure decreases by 22.3%, the peak value of the static strain response of the wearing course of the S3 structure increases by 13.3%, and the peak value of the static strain response of the wearing course of the S4 structure increases by 21.5%, and the semi-rigid base asphalt pavement makes the asphalt surface courses bear greater longitudinal strain value. It is noteworthy that the longitudinal strain peak in S2 occurs at the center of wheel gap, which is subjected to a smaller tensile strain overall.
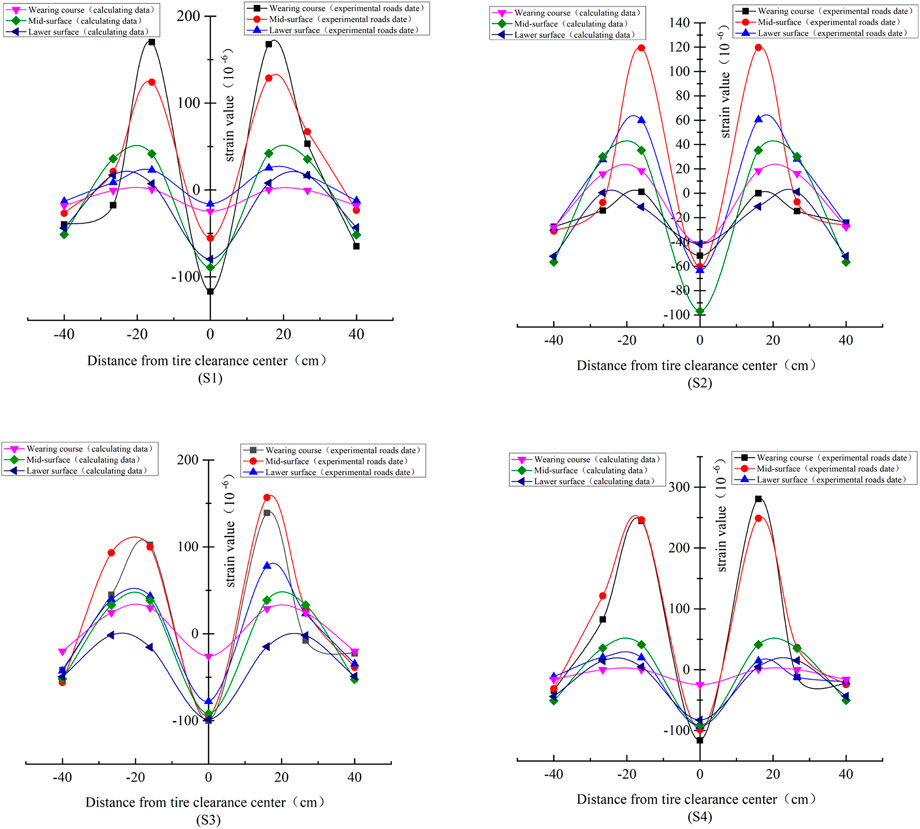
Figure 10. The variation law of transverse strain peak of each surface course with different transverse positions.
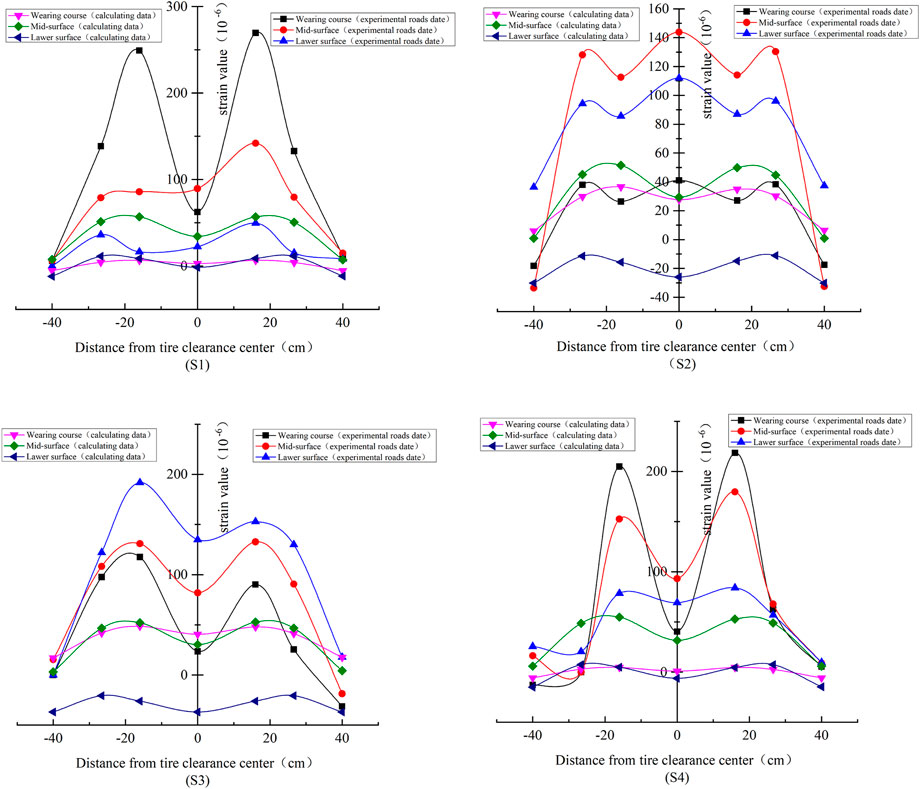
Figure 11. The variation law of longitudinal strain peak of each surface course with different transverse positions.
By combining Figures 10, 11, it is found that the strain response of different pavement structures under static load shows a saddle-type fluctuation with the change of transverse position, and the strain peak appears below the wheel load, which is all tensile strain. The transverse strain at the wheel gap is compressive strain, which is numerically close to the tensile strain at wheel load position, while the longitudinal strain is tensile strain. The strain response of surface course of semi-rigid base asphalt pavement is greater than that of other pavement structures. However, there is uncertainty in the influence of base course thickness on the strain response. Therefore, the base course’s thickness is considered in the pavement structure design. In terms of measured strains, the strain response of asphalt courses changes greatly with the change of transverse position under static load, and the strain peak appears at the wheel load, indicating that the wheel load is the most unfavorable loading location for the pavement. It is also clearly observed that asphalt courses of different pavement structures exhibit more longitudinal strain than transverse strain overall, which is more prone to longitudinal cracking under load.
Combined with the conclusion of dynamic load (Hongfu et al., 2021), it can be concluded that under dynamic and static load, the strain response shows a “saddle-shaped” fluctuation with the change of transverse position. The peak strain of the surface course appears at the center of the wheel load, all of which are tensile strains, indicating that the center of the wheel load is the most unfavorable load point of the road surface. With the change of transverse position, the peak values of dynamic and static strain responses change greatly.
3.2.2 Strain test results and variation law of asphalt base course
Figures 12, 13 demonstrate the strain distribution of each base course of four pavement structures at different loading positions. There is no obvious variation law in the transverse strain values shown in Figure 12, and the strain peak generally appears in the wheel load center or wheel gap center, which is all tensile strain. The strain response of S2 and S3 is significantly greater than that of S1 and S4. The longitudinal strain of the base course of different pavement structures has a relatively consistent law in Figure 12, which shows a similar variation law. A single hump occurs with transverse loading positions, and the peak value appears at the wheel gap, which is also a tensile strain. S3 has the largest tensile strain value, while S4 has the smallest.
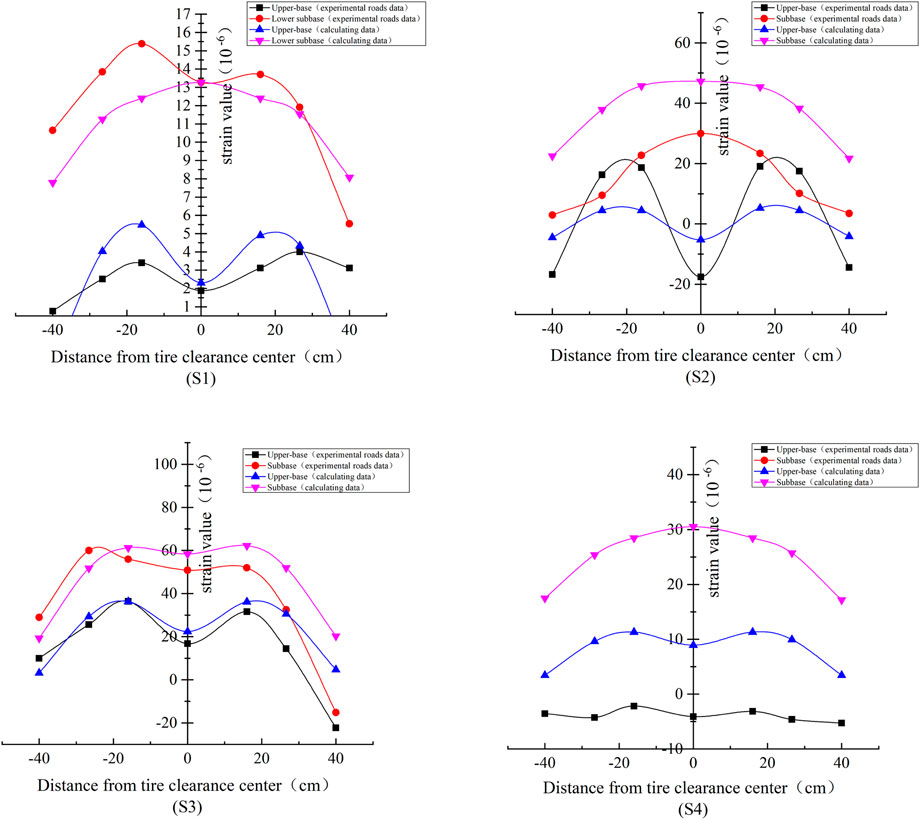
Figure 12. The variation law of transverse strain peak of each base course with different transverse positions.
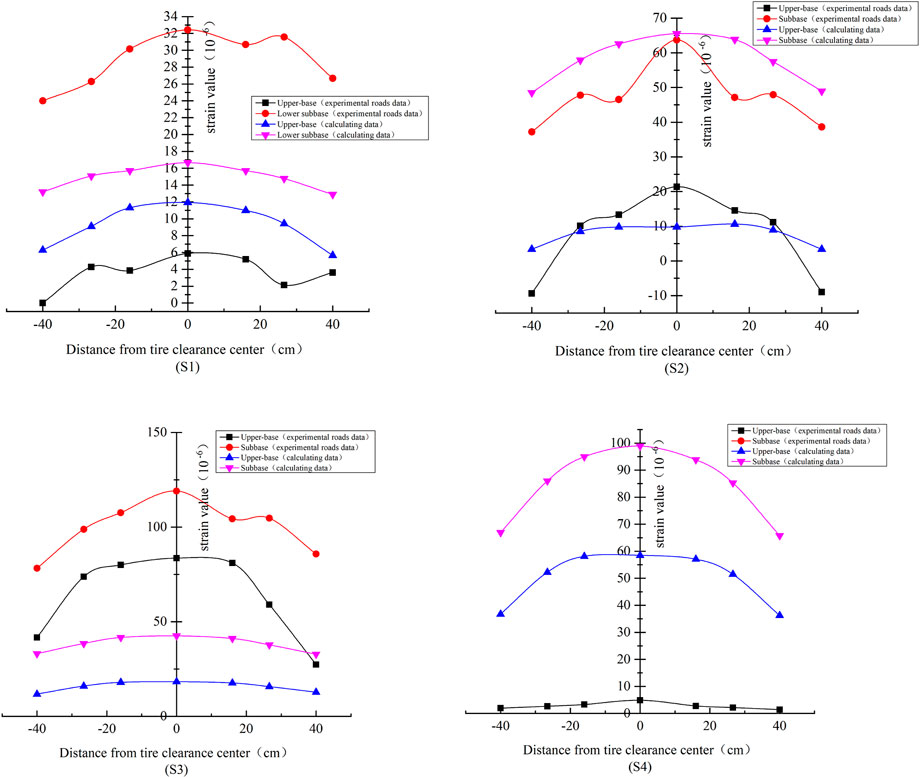
Figure 13. The variation law of longitudinal strain peak of each base course with different transverse positions.
In terms of base course, the strain value of the subbase course is greater than that of the upper base course. All four pavement structures have the same variation law. The transverse strain is smaller than the longitudinal strain, and the peak strain occurs mostly at the wheel gap. It is indicated that the most unfavorable loading position of base course under load occurs at the wheel gap, which is more prone to transverse cracking. The strain response of base course of semi-rigid base asphalt pavement is smaller than that of other pavement structures; however, the strain response of each structural courses of combined and flexible base asphalt pavement has a better continuity.
Combined with the conclusion of dynamic load (Hongfu et al., 2021), it can be concluded that under dynamic and static load, the peak values of dynamic and static strain response of longitudinal strain at the bottom of base courses show a single hump law, and the maximum peak values of dynamic and static strain of base course appear in the center of wheel gap. It is indicated that the most unfavorable loading position of base course under load occurs at the wheel gap. The strain value at the bottom of the lower base is greater than that of the upper base.
3.3 Static load test results at different depths
In the previous discussion, it is concluded that the strain peak of asphalt surface course appears at the wheel load, while the strain peak of asphalt base course occurs at the wheel gap and wheel load. In this section, analyze the relationship between strain response and depth direction at wheel gap and wheel load.
3.3.1 Variation law of transverse strain with the depth
From Figures 14, 15, it is obvious that the transverse strain at the wheel gap shows a variation process from compressive strain to tensile strain with the depth, which increases gradually; the subbase course where the strain peak appears. The asphalt surface course and upper base course are compressive strain, while tensile strain appears at subbase course.
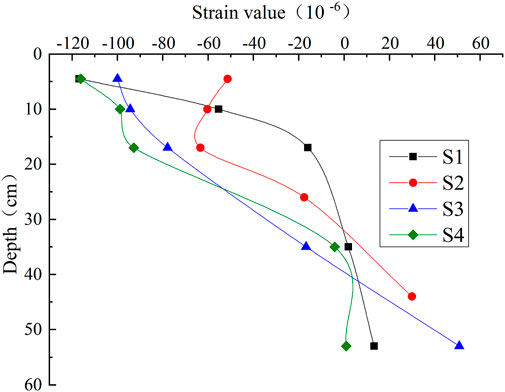
Figure 14. Variation law of transverse strain with the depth at the wheel gap.
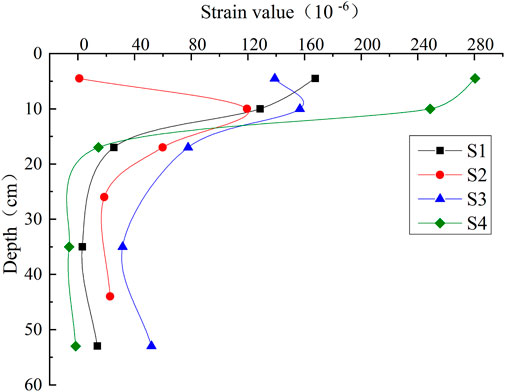
Figure 15. Variation law of transverse strain with the depth at the wheel load.
The transverse strain at the wheel load gradually decreases with the depth increase, this difference may arise because the stress state at the center of the wheel load may be more homogeneous. But its variation law at the wheel gap is almost opposite. However, S2 and S3 show an inflection point of middle surface course. The peak strain of the two appears in middle surface course, while the peak strain of S1 and S4 occurs in upper surface course. It can be also found that the strain value of subbase course is slightly higher than that of upper base course. This shows that the strengthening of the pavement base can make the pavement structural courses strain reduction, especially the strengthening of the roadbed stiffness, is the pavement most of the course’s strain is compressive strain, the pavement individual structural courses deformation of the improvement effect is obvious.
3.3.2 Variation law of longitudinal strain with the depth
As shown in Figure 16, strain values at the wheel gap of four pavement structures show an inverse S-shape along the depth direction, and the strain peak appears mostly of middle surface course, but the peak in S3 appears in the lower surface course. The longitudinal strain of the surface courses under condition 2 (wheel load center) is greater than that under condition 1 (wheel gap center), while the longitudinal strain of the base courses under condition 1 is greater than that under condition 2.
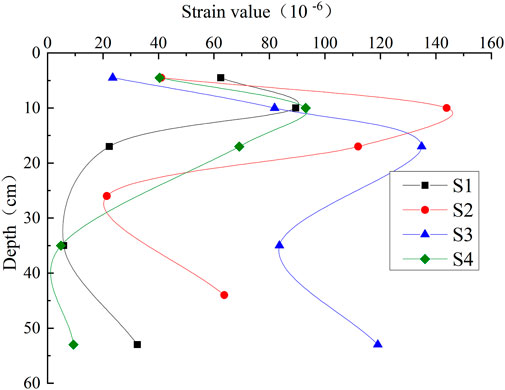
Figure 16. Variation law of longitudinal strain with the depth at the wheel gap.
In Figure 17, it can be observed that the strain variation law of four pavement structures is not the same; the strain of S2 and S3 shows an “inverse S-shape” with the depth, while the strain of S1 and S4 gradually decreases with the increase of depth. In other words, the most unfavorable loading position of semi-rigid base asphalt pavement appears of upper surface course, while other pavement structures occur of middle surface course.
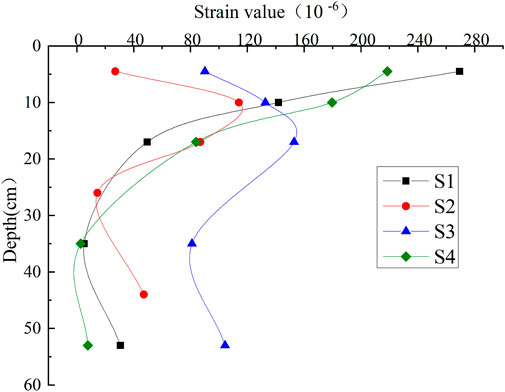
Figure 17. Variation law of longitudinal strain with the depth at the wheel load.
Combined with the conclusion of dynamic load (Hongfu et al., 2021), it can be concluded that with the increase of depth, the strain peak under dynamic load appears in the upper surface at the center of wheel load, while under static load, the strain peak appears in the upper surface (S1, S4) or middle course (S2, S3). S3 is a flexible base asphalt pavement, which transfers more load downward to the subgrade. Therefore, the strain of S3 base is larger than that of the other three pavement structures, so S3 has higher requirements in selecting subgrade fillers.
4 Conclusion
In conclusion, based on the physical engineering experimental roads and using fiber grating sensing technology, this paper explores the static strain response of four asphalt pavements at different courses, working conditions and depths. The main findings of the study are summarized as follows:
1) Under static load, the strain response of each surface course of four asphalt pavement structures shows a double hump with the transverse position. The transverse strain shows a tension-compression-tension fluctuation, while the longitudinal strain is all tensile strain. And the strain peak appears at the wheel load. The strain response of base course shows a single-hump with the transverse position, and its peak occurs at the wheel gap. The static strain time curve is viscoelastic and conforms well to the Burgers model, and the fitting coefficient of determination is 0.98.
2) The distribution and variation law of strain response along the depth direction at different points are not the same under static load. For the longitudinal strain, the longitudinal strain at the center of the wheel load of the surface courses is greater than that at the center of the wheel gap, while the longitudinal strain of the base courses exhibits a greater strain at the center of the wheel gap than at the center of the wheel load. For the transverse strain, the transverse strain at the center of the wheel load decreases gradually with increasing depth, while the center of the wheel gap shows almost the opposite pattern of change. This may be caused by a more uniform stress state at the center of the wheel load.
3) Differences in pavement structure led to different locations of peak strain generation, S2 and S3 strain peaks occur at the bottom of the middle surface courses, and S1 and S4 strain peaks occur at the bottom of the wearing course. Peak strain at the bottom of the base is higher than at the bottom of the upper base.
4) The most critical loading position of the base course occurs at the wheel gap of the lower base course. The most adverse loading position of the surface course appears at the wheel load at the bottom of the upper or middle course, which is mainly due to the differences in pavement structures.
5) The measured data of the test pavement courses are generally larger than the calculated data of the BISAR software. This variation can be attributed to the elastic courses system theory which cannot fully reflect the real mechanical response of the pavement after a series of assumptions and simplified results. The measured data obtained by the sensor is not necessarily the true value.
The mechanical response inside the asphalt pavement structure has temperature and load dependence. Since the test analysis was carried out shortly after the pavement was built, the conditions were limited, and the test was limited by the construction period; It is almost impossible to achieve the same temperature and humidity of each structural courses during each test. Therefore, it is necessary to further carry out long-term performance observation and data collection and analysis on some positions inside the experimental roads structure with the alternating changes of temperature and humidity. Further analysis of other variables (nonlinear stress, vibration, etc.) is needed to serve the design of durable pavement.
Data availability statement
The original contributions presented in the study are included in the article/Supplementary Material, further inquiries can be directed to the corresponding authors.
Author contributions
HL: Writing–original draft, Conceptualization, Data curation, Formal Analysis, Funding acquisition, Investigation, Methodology, Project administration, Resources, Software, Supervision, Validation, Visualization. BC: Writing–original draft, Conceptualization, Formal Analysis, Methodology, Software, Validation. ZC: Writing–review and editing, Conceptualization, Investigation, Project administration. QP: Writing–review and editing, Conceptualization, Investigation, Validation. TH: Writing–review and editing, Conceptualization, Investigation, Validation. SL: Conceptualization, Investigation, Validation, Writing–review and editing. GQ: Writing–review and editing, Conceptualization, Investigation, Validation.
Funding
The author(s) declare that financial support was received for the research, authorship, and/or publication of this article. This research was funded by the National Natural Science Foundation of China (52078064, 51978083, 51908071), Supported by Hunan Provincial Natural Science Foundation of China (2023JJ30029).
Acknowledgments
We wish to thank the reviewers, editors for their advice on this paper.
Conflict of interest
Author ZC was employed by Tianjin Port Engineering Institute Co., Ltd. of CCCC First Harbor Engineering Co., Ltd. Author ZC was employed by CCCC First Harbor Engineering Company Ltd.
The remaining authors declare that the research was conducted in the absence of any commercial or financial relationships that could be construed as a potential conflict of interest.
Publisher’s note
All claims expressed in this article are solely those of the authors and do not necessarily represent those of their affiliated organizations, or those of the publisher, the editors and the reviewers. Any product that may be evaluated in this article, or claim that may be made by its manufacturer, is not guaranteed or endorsed by the publisher.
References
Bang, H.-J., Kim, H.-I., and Lee, K.-S. (2012). Measurement of strain and bending deflection of a wind turbine tower using arrayed FBG sensors. Int. J. Precis. Eng. Manuf. 13 (12), 2121–2126. (Month. doi:10.1007/s12541-012-0281-2
Brown, E. R., Prowell, B., Cooley, A., Zhang, J., and Powell, R. B. (2004). Evaluation of rutting performance on the 2000 NCAT test track. J. Assoc. Asphalt Paving Technol. 73 (0).
Burnham, T., Worel, B., and Izevbekhai, B. (2020). Contribution of MnROAD research to improvements in concrete pavement technology from 1994–2019. Transp. Res. Rec. 2674 (7), 56–66. doi:10.1177/0361198120920874
Cary, C. E., Wang, Z., Yin, H., Garg, N., and Rutter, R. (2018). Effect of pavement structure on the mechanical response and performance of perpetual pavements at the national airport pavement test facility. Transp. Res. Rec. 2672 (23), 31–39. doi:10.1177/0361198118756619
Ding, L. (2022). Analysis of mechanical properties of recycled asphalt pavement based on ABAQUS model. J. Munic. Technol. 40 (09), 85–91+121. doi:10.19922/j.1009-7767.2022.09.085
Duan, S. (2022) Dynamic response study of asphalt pavement based on footprint accelerated loading test. Jinan City: Shandong Jianzhu University.
Hongfu, L., Wenwen, G., Qinxue, P., Rong, H., Songtao, L., and Tuo, H. (2021). Characteristics and analysis of dynamic strain response on typical asphalt pavement using Fiber Bragg Grating sensing technology. Constr. Build. Mater. 310, 125242. doi:10.1016/J.CONBUILDMAT.2021.125242
Hu, X. (2016) Rutting control technology of asphalt overlay on rigid pavement in moist heat areas. Fujian, China: Fuzhou University.
huizhong, Z., guoshuai, Z., and bangwei, W. (2017). Field measurement and numerical simulation of dynamic strain response of asphalt pavement with cracked semi-rigid base. Transp. Sci. Technol. (05), 65–67.
Kaiwen, Z., Hongwei, Z., Weiwen, Q., Xianyong, M., and Zejiao, D. (2022). Optimization of design indicators and exploration of reasonable thickness of asphalt pavement structure. J. Highw. Transp. Res. Dev. 39 (06), 9–16.
Liao, W., Zhuang, Y., Zeng, C., Deng, W., Huang, J., and Ma, H. (2020). Fiber optic sensors enabled monitoring of thermal curling of concrete pavement slab: temperature, strain and inclination. Measurement 165, 108203. doi:10.1016/j.measurement.2020.108203
Liu, W., Liu, X., Wang, Z., and Zhou, Z. (2019). High temperature deformation investigation of asphalt mixture with nanosized volcanic ash fillers using optical fiber sensor. Measurement 140, 171–181. doi:10.1016/j.measurement.2019.03.075
Liu, Z., and Chen, F. (2013). The reference of foreign similar projects to the construction of full-scale pavement test loop in China. J. China and Foreign Highw. 33 (02), 64–68. doi:10.14048/j.issn.1671-2579.2013.02.017
Liu, Z., Li, W., Liu, L., Huang, Y., Fu, S., and G, Z. (2023). Research on cooperative performance of built-in strain sensor and asphalt pavement structure. China J. Highw. Transp. 36 (04), 1–14. doi:10.19721/j.cnki.1001-7372.2023.04.001
Ma, X., Dong, Z., Chen, F., Xiang, H., Cao, C., and Sun, J. (2019). Airport asphalt pavement health monitoring system for mechanical model updating and distress evaluation under realistic random aircraft loads. Constr. Build. Mater. 226 (C), 227–237. doi:10.1016/j.conbuildmat.2019.07.174
Metcalf, J. B. (2016) A brief history of full-scale accelerated pavement testing facilities to 1962, the roles of accelerated pavement testing in pavement sustainability: engineering, environment, and economics. Berlin, Heidelberg: Springer, 3–16.
Milad, M., Pengfei, L., Joshua, S., Markus, O., and Ruxin, J. (2022). Evaluation of design procedure and performance of continuously reinforced concrete pavement according to AASHTO design methods. Materials 15 (6), 2252. doi:10.3390/MA15062252
Pan, Q., Zheng, J., Yang, B., and Liu, H. (2017). Mechanical response of asphalt pavement under driving conditions by fiber bragg grating optical sensing technology. China Civ. Eng. J. 50, 125–132. doi:10.15951/j.tmgcxb.2017.04.015
Pang, F. (2013) Study on structure optimization of the rubber asphalt pavement. Xi'an, China: Chang'an University.
Raj, G., Ramesh, A., Pranavi, R., and Rao, C. N. (2022). Laboratory evaluation of an indigenous developed light weight deflectometer as a quality control tool for pavement construction. Mater. Today Proc. 60 (P1), 431–439. doi:10.1016/J.MATPR.2022.01.314
Rodrigues, C., Cavadas, F., Félix, C., and Figueiras, J. (2012). FBG based strain monitoring in the rehabilitation of a centenary metallic bridge. Eng. Struct. 44, 281–290. doi:10.1016/j.engstruct.2012.05.040
Saevarsdottir, T., Erlingsson, S., and Carlsson, H. (2016). Instrumentation and performance modelling of heavy vehicle simulator tests. Int. J. Pavement Eng. 17 (2), 148–165. doi:10.1080/10298436.2014.972957
Tai, D., and Wen, Z. (2013). Summary of the results of the third stage of NCAT test loop in the United States. J. China and Foreign Highw. 33 (04), 284–287. doi:10.14048/j.issn.1671-2579.2013.04.073
Tan, Y., Dong, Z., Tian, G., and Hu, Q. (2009). Evaluating method of the coordination deformation between asphalt mixture and fiber bragg grating sensor. J. Civ. Environ. Eng. 31, 100–104.
Tian, G., Dong, Z., Hu, Q., and Tan, Y. (2009). Analysis of coordination between asphalt mixture and fiber Bragg grating sensor. J. Harbin Inst. Technol. 41, 73–76.
Timm, D. H., and Newcomb, D. E. (2006). Perpetual pavement design for flexible pavements in the US. Int. J. Pavement Eng. 7 (2), 111–119. doi:10.1080/10298430600619182
Wang, G., Jia, Q., Zhang, P., Guan, Z., Zhang, J., and Yang, F. (2021). Research on experiment equipment of rotary road surface loading. Intern. Combust. Engine and Parts (21), 58–59. doi:10.19475/j.cnki.issn1674-957x.2021.21.027
Wen, H. (2003). Characterization of fatigue performance of WesTrack pavement using work potential theory. Road Mater. Pavement Des. 4 (1), 109–121. doi:10.1080/14680629.2003.9689942
Wu, J., and Ye, F. (2014). Strain behavior of asphalt pavement in accelerated pavement testing with MLS66 under heavy-load and high-frequency. China J. Highw. Transp. 27 (10), 9–16+23. doi:10.19721/j.cnki.1001-7372.2014.10.002
Xiao, C. (2014) Research on dynamic behavior and structure optimization for typical asphalt pavement. Chengdu, China: Southwest Jiaotong University.
Xie, J. (2006) Research on fatigue response and design method of asphalt pavement under heavy load condition. Shanghai, China: TongJi University.
Xie, J., Li, H., Gao, L., and Liu, M. (2017). Laboratory investigation of rutting performance for multilayer pavement with fiber Bragg gratings. Constr. Build. Mater. 154, 331–339. doi:10.1016/j.conbuildmat.2017.07.233
Xin, X., Liang, M., Yao, Z., Su, L., Zhang, J., Li, P., et al. (2020). Self-sensing behavior and mechanical properties of carbon nanotubes/epoxy resin composite for asphalt pavement strain monitoring. Constr. Build. Mater. 257 (C), 119404. doi:10.1016/j.conbuildmat.2020.119404
Xudong, W., Xingye, Z., Wei, G., and Xian, X. (2020). Characteristics and analysis of the mechanical response inside the structure of asphalt pavement. Chin. Sci. Bull. 65 (30), 3298–3307. doi:10.1360/tb-2020-0233
Yiqiu, T., Haipeng, W., Shaojun, M., and Huining, X. (2014). Quality control of asphalt pavement compaction using fibre Bragg grating sensing technology. Constr. Build. Mater. 54, 53–59. doi:10.1016/j.conbuildmat.2013.12.032
Yu, W., Xin, J., Xuejiao, L., and Wenqing, F. (2017). Mechanical behaviours of typical asphalt pavement structures under wheel loads. J. Southwest Jiaot. Univ. 52 (03), 563–570.
Yuan, Y., and Zhou, J. (2005). Summary of the first stage results of NCAT loop test in the United States. J. China and Foreign Highw. (06), 109–112.
Zhang, X. (2014). Study on constitutive relation of asphalt mixtures based on dynamic creep test. J. Funct. Mater. 45 (23), 23020–23024.
Zhou, X. (2019) Structure response and non-linear analysis of asphalt pavement based on full-scale loop test. Harbin, China: Harbin Engineering University.
Keywords: asphalt pavement, static strain response, duration curve, fiber Bragg grating optical sensors, pavement design
Citation: Liu H, Chen B, Cao Z, Pan Q, Huang T, Lv S and Qian G (2024) Characteristics and analysis of static strain response on typical asphalt pavement using fiber Bragg grating sensing technology. Front. Built Environ. 10:1409520. doi: 10.3389/fbuil.2024.1409520
Received: 30 March 2024; Accepted: 07 May 2024;
Published: 24 May 2024.
Edited by:
Kong Fah Tee, King Fahd University of Petroleum and Minerals, Saudi ArabiaReviewed by:
Sakdirat Kaewunruen, University of Birmingham, United KingdomXinglin Zhou, Wuhan University of Science and Technology, China
Copyright © 2024 Liu, Chen, Cao, Pan, Huang, Lv and Qian. This is an open-access article distributed under the terms of the Creative Commons Attribution License (CC BY). The use, distribution or reproduction in other forums is permitted, provided the original author(s) and the copyright owner(s) are credited and that the original publication in this journal is cited, in accordance with accepted academic practice. No use, distribution or reproduction is permitted which does not comply with these terms.
*Correspondence: Hongfu Liu, bGhmMDYyNUBjc3VzdC5lZHUuY24=; Zhonglu Cao, Y2FvemhvbmdsdUAxMjYuY29t