 Daphna Levine
 Shai Sussman2
- 1Cornell Tech, New York, NY, United States
- 2Technion Israel Institute of Technology, Haifa, Israel
This research introduces a pioneering methodology and user-friendly online dashboard for examining population shifts during urban redevelopment in Bat Yam, Israel, part of the Tel Aviv Metropolitan Area. The simulation tool, operated through scripts, predicts how redevelopment scenarios will impact household demographics over time. Its output is a population track-change CSV file detailing demographic changes. The accompanying online dashboard visually presents these changes, making the data accessible to policymakers and planners. The tool’s consideration of environmental factors enhances its applicability in identifying vulnerable populations and resilient communities amidst urban renewal. This user-friendly approach, compatible with existing planning tools, underscores the article’s significance in advancing urban planning practice and addressing societal needs.
1 Introduction
Urbanism mirrors a grand theatrical production, with citizens assuming the roles of actors and buildings as the ever-changing backdrop. This metaphorical stage, where human life intersects with the built environment, forms the essence of urban existence. However, translating this metaphor into actionable insights for urban planning requires a departure from technical jargon and a shift toward accessible frameworks. By conceptualizing citizens as digital agents in a simulated urban domain, we strive to demystify the complexities of urban dynamics and empower a broader audience, including policymakers and urban planners, with actionable knowledge.
Despite the potential of high-resolution simulation models to elucidate urban phenomena, their practical application in planning remains limited. The intricate interplay of simulation rules and assumptions often obscures the clarity of predictions, hindering their utility in decision-making processes. Building upon previous research endeavors, our study pioneers a dashboard framework tailored to present complex temporal-spatial events in an intuitive, interactive, and simplified manner.
We contend that simplifying complex phenomena into visually accessible dashboards represents a significant advancement in urban planning practice (Levine et al., 2022a; Yavo-Ayalon et al., 2024). By harnessing the dynamic capabilities of internet dashboards, we aim to distill intricate urban dynamics into digestible insights. Through features such as maps, charts, and interactive widgets, these dashboards foster engagement and facilitate informed decision-making processes.
In contrast to traditional static media, contemporary dashboards offer a playful yet powerful means of exploring complex urban dynamics (Kitchin and McArdle, 2016). By integrating synthetic data generated through microsimulation, our dashboard serves a dual purpose: to deepen our understanding of population dynamics amidst urban redevelopment and to visualize potential population projections derived from these simulations.
Our framework enables the simulation of socio-economic properties at a neighborhood scale, providing planners with invaluable insights into demographic trends and socio-economic dynamics. By synthesizing existing household information and projected urban development scenarios, we generate detailed population compositions, capturing the nuanced impacts of redevelopment on communities.
Scholars have highlighted that effective urban renewal strategies can drive economic growth, arguing that urban renewal is the only feasible solution to the declining economic sector in developing economies such as Nigeria (Adedeji and Arayela, 2018). In Zimbabwe, a study by Kanyepe (2023) found that residential density affects traffic congestion, with travel behavior playing a significant role in this relationship. The researchers suggest that new strategies and tools are needed to address future challenges in developing countries. Research conducted in Riyadh, Saudi Arabia (Nassar, 2021), demonstrates that significant positive impacts can be achieved through a flexible approach that promotes continuous planning and implementation. To achieve a harmonious balance between districts, each district should have a tailored development strategy that considers its unique urban fabric and sociocultural composition.
Focusing on Bat Yam, Israel, as our case study, we confront the imminent challenges posed by urban redevelopment in a city nearing the limits of its land reserves. With plans for significant housing expansion underway, our research seeks to anticipate and mitigate potential social costs associated with population displacement and demographic shifts.
Employing a microsimulation methodology at the household level, we statistically model future scenarios based on approved redevelopment plans. Through this approach, we identify vulnerable populations and assess the socio-economic impacts of urban renewal projects, offering policymakers actionable insights to inform policy remedies. As we navigate through the subsequent sections of this paper, we delve into the theoretical underpinnings of dashboards in city planning and the intricacies of microsimulation in urban contexts. Through a comprehensive methodology, we illustrate the input, processing, and output phases of our framework, culminating in a discussion of the tool’s benefits and its implications for urban planning practice.
2 Literature review: microsimulations in light of city dashboards
The urban domain involves complex interactions between the built environment and urban society, occurring at various scales, spaces, times, and through various agencies (Batty, 2005). In recent decades, complexity sciences have sought to analyze the city as a complex model, including breaking down the physical and social space into individual units that interact with each other over time and space. This bottom-up approach can provide insight into the city’s interactions and dynamics (Benenson and Torrens, 2004; Batty, 2005).
Microsimulation is a modeling technique that operates at the level of individual units. This method is popular in economics, healthcare, urban planning, and policymaking, typically involving generating a data-driven synthetic population (Benenson and Torrens, 2004; Harland et al., 2012; Crooks et al., 2013; Huang et al., 2014). O’Donoghue refers to this technique as a “computer-based laboratory for running policy experiments” (O’Donoghue, 2014, p. 1). Microsimulations are often used in public policy, urban planning, and social science research. For example, they can be used to analyze the distributional impacts of policies, such as the effects of tax changes on different income groups or the impacts of transportation investment on different neighborhoods (O’Donoghue, 2014; Priem et al., 2020). The technique is based on creating an individual set of the population with an identification attribute at a certain point and then generating a future set from that basis (Ballas et al., 2005; Batty, 2012; Birkin and Wu, 2012). Updating the state of the population to a specific time is also known as dynamic microsimulation. Agents aging, death, and movement over time are examples of dynamic microsimulations (Birkin and Wu, 2012).
The method stems from 1950 s attempts by economists to model economic predictions from the bottom up or microscopic unit instead of macro-models (Orcutt, 1957). With the advancement of computational power as well as increased data storage in the 1970 s, the method has witnessed expanded applications, as well as research in various fields such as tax benefit, population dynamics, traffic flows, healthcare, and socio-economic policies (Huang et al., 2014; Priem et al., 2020). Noteworthy developments relating to microsimulations in social and spatial studies over recent years include the MoSes (Modelling and simulation for e-Social Science) research node, which generated a synthetic population for the entire United Kingdom to predict the population 30 years into the future (Birkin and Wu, 2012). One of the more notable simulations is Paull Waddell UrbanSim, which explores the complexity of the interaction between transportation models and changes in transportation systems, land use, shifts in living expenses and apartment costs, and the effect of all these on population displacement. It is a planning support tool in transportation and land-use context (Waddell, 2002). While we have seen multiple examples of population demographics models and housing choices models (Birkin and Wu, 2012; Jordan et al., 2011; Marois and Bélanger, 2015), none of these models address a specific urban redevelopment scenario that involves a massive change to the existing urban form; despite the exciting potentialities of these and other digital tools, an application gap is apparent–their utilization by urban planners remains limited As with other digital tools, the problem seems to be the accessibility of the new technology to those not trained or invested in its use (Tomintz et al., 2017; Barbosa et al., 2019).
One of the critical benefits of spatial microsimulations is that they can provide a more detailed and nuanced understanding of policy impact on individual-level data, capturing the heterogeneous nature of populations and the complexity of policy effects (Tanton and Edwards, 2013; Tomintz et al., 2017). Moreover, microsimulation can be designed to mitigate Modifiable Area Unit Problem (MAUP) (Openshaw, 1984). Microsimulation has demonstrated its potential to explore fine geographical scales that need to be more adequately studied (Tanton and Edwards, 2013). However, only some published studies, let alone field microsimulation applications, have integrated spatial visualization tools such as web maps and dashboards with microsimulations (Tomintz et al., 2017).
While both microsimulations and dashboards are widely used in the field of urban planning and management, we were not able to find integration in a way that leverages the strengths of both approaches in the literature; the closest topic we found is ‘serious games that explore the usage of gaming throughout the planning experience’ (Raghothama et al., 2022), in this sense we argue that microsimulations and dashboards utilize part of the complexity and experience in games. Batty describes the importance of using simulation and visualization aids such as dashboards to model and simulates approaches in explaining urban processes (Batty, 2013). Mattern adds that dashboard can help translate the messiness of urban reality to rational, detailed, systematic, and ordered forms of knowledge. (Mattern, 2014).
Dashboard describes a physical device or software that can display a visual snapshot overview of a complex system with large amounts of data within a single glance. It enables critical information to be effectively mediated, enabling decision-makers to rapidly act (Kitchin and McArdle, 2016). Digital dashboards operate like a physical dashboard (e.g., a car dashboard or a plane cockpit) by providing critical information in a single view (Gray et al., 2013). Information can be transmitted in interactive graphical media, which include 2D/3D maps, gauges, bars, and graphs. In addition, the dashboard can provide users with a set of interactive tools such as querying, filtering, selecting, zooming, and panning over the data (Kitchin and McArdle, 2016).
Dashboards have advantages over spreadsheets, charts, graphs, and reports. One key advantage is their ability to display a large amount of data in a single visual interface, which allows users to access and interpret the information rapidly and easily. Dashboards also tend to be more interactive and customizable than other options, allowing users to drill down into specific areas of interest and display only the data that is relevant to them. Additionally, dashboards can be accessed and updated in real-time, which makes them a valuable resource for monitoring and tracking performance and trends. Advanced dashboards can have game-like capabilities, such as one indicator serving as an input for another indicator or two-way callbacks. Digital dashboards are now an essential tool used by data scientists to transform raw data into a visual, understandable, and actionable form (Mackenzie, 2015; Kitchin and McArdle, 2016).
The widespread adoption of mobile devices in recent years has contributed to the rapid integration of digital dashboards into urban planning and management. City dashboards can be an essential component of many smart city initiatives. They provide a visual interface for accessing and interpreting data from various sources and have become central tools in understanding and managing complex urban systems (Batty, 2012). Urban planners use dashboards to understand these complex systems and mediate them to policymakers, managers, and other stakeholders such as the public and research groups (Kitchin and McArdle, 2016; Soundararaj et al., 2022). Dashboards have been used for information dissemination, citizen engagement and participation, urban management, public policy and decision-making, and other usages (Jing et al., 2019). Mayors and city management teams use dashboards as evidence-based city management performance indicators (Kitchin and McArdle, 2016). Open data dashboards, in particular, enable greater public participation by providing tools for extracting valuable insights from data and empowering citizens to engage more actively and effectively with their city and its management. (Kitchin, 2014).
While dashboards can be helpful in efficiently accessing and interpreting data, they have limitations and biases. For example, some critics argue that dashboards need to provide an objective representation of the city and may be limited in scope by the decisions of politicians or decision-makers about what data to include and exclude (Kitchin and McArdle, 2016). Others argue that dashboards risk reducing the complexity of urban life to a superficial, mechanical representation, ignoring the non-rational and non-material aspects of human life (Mattern, 2013; Kitchin, 2014).
The recent increase in Map-based and time-based digital dashboard awareness and usage has been attributed to the COVID-19 pandemic (Soundararaj et al., 2022). The dashboards developed during this period emphasized time series and various properties of the tracked socio-geographical parameters pandemic relating to the population.
Dashboard supports time series in various ways; it can display changes within time, or on the other hand, it can be updated as new data becomes available. In this sense, dashboards can help the user identify patterns of change over time for specific phenomena and compare different parts of the city (Kitchin and McArdle, 2016; Young and Kitchin, 2020).
Kitchin and McArdle mention that in most cases, city dashboards are generic data portals, and little thought is given to the function, use case, and user experience or to the aesthetics or interface design (Young and Kitchin, 2020).
Framing reality in digital form is a practice subject to considerable criticism. Mattern criticizes the framing of external reality, such as the city to digital data, as being positive thinking, reductionist, mechanistic, and deterministic, thus collapsing diverse individuals and complex, multidimensional social structures and relationships to the abstract data point and formulas (. (Mattern, 2013). Simulations tend to ignore metaphysical aspects of human life, which are difficult to capture in a digital frame. Furthermore, they generally ignore the role of politics, social structures, and cultures (Kitchin and McArdle, 2016). Finally, Kitchin and McArdle (Kitchin and McArdle, 2016) suggest that dashboards need to be more objective and have several shortcomings that need to be considered. In this work, we are aware that the idea of projecting to the future or predicting is a complex or almost impossible task; however, the process itself of simulation creation and dashboard taught us about some of the urban dynamics and possibly enabled us to reduce some of its complexity to an intuitive understanding of what could be and why. This study intends to fill the gap between redevelopment simulations and dashboard development. In this sense, this article might address this gap.
3 Bat-Yam case study
Bat-Yam is a beachfront city located just south of Tel Aviv. As of 2019, 1,29,000 People live within its 8.16 square km, making Bat-Yam the third dense city in Israel (CBS, 2020). Bat-Yam has already used up almost all of its land reserves in the 1970 s; consequently, its neighborhoods suffer from aging infrastructures and buildings. As a result, Bat-Yam has an incremental deficit and a low average income compared to Israel’s larger cities (CBS, 2020). In addition, its population includes one of the highest percentages of immigrants in the country (33%), as well as an exceptionally high concentration of elderly residents (20%) (CBS, 2020).
The combination of the high demand for real estate socioeconomic weakness of its population has led Bat-Yam to experiment with massive redevelopment over the past decade (Levine and Aharon-Gutman, 2023). As a result, bat-Yam has one of the country’s most prominent high-rise construction plans, with approximately 160 local urban redevelopment plans currently in different planning and implementation stages. The intention is to replace hundreds of old buildings throughout the city with high-rises (up to 30 stories high) and increase the city’s population by 50% without increasing its residential area (Levine and Aharon-Gutman, 2022b). This means a dramatic addition of residential units–an addition of 26,000 residential units to its existing 51,000.
We have chosen to conduct our simulation on three statistical tracts (111, 113, and 115) on the upper west side of Bat Yam. The statistical areas contain 385 buildings and 5,588 households, 62 (approximately 15%) of which are expected to undergo development according to the municipality’s authoritative GIS layers and municipal records. They include 1,111 residential units, with an approximate average of 18 residential units per building (Figure 1).
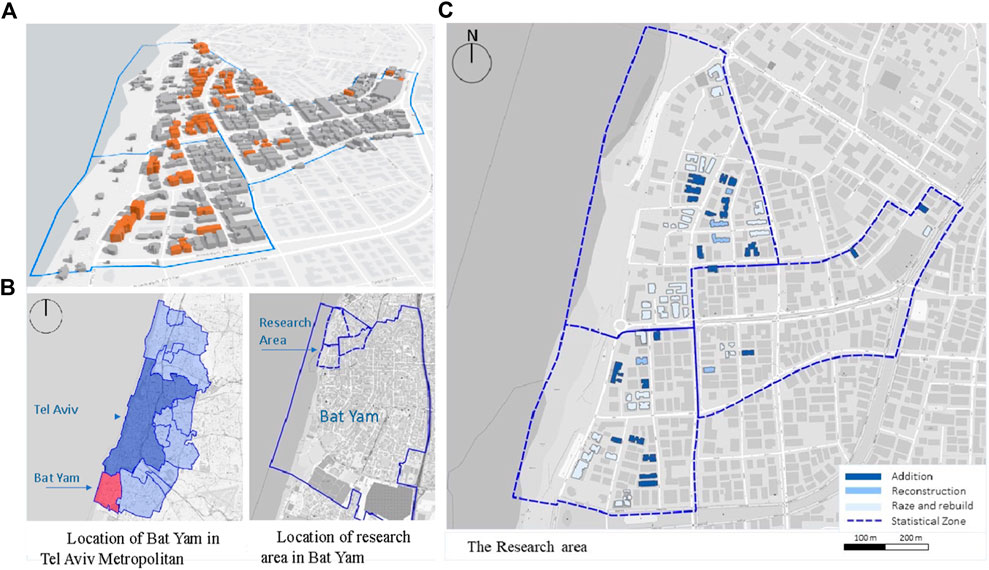
Figure 1. (A) Location of Bat-Yam within Tel Aviv Metropolitan. (B) Location of the research area within Bat-Yam. (C) The Research area.
The Bat-Yam municipality granted us access to their databases, including detailed data on the citywide level regarding the population registry, buildings, property, public property, and building requests. These data were all received in tabular tables and GIS files. These databases contained information that constituted the empirical foundation of our research. Following cleaning, organization, and processing, these data were used as the basis of the simulation.
The scenario presented here involves a complex orchestra where the existing urban fabric changes form. Moreover, the complexity multiplies when considering the different construction typologies, which are unique, and the different planning and implementation stages. Three modules were designed to simulate the dynamics of each urban redevelopment typology.
• Addition - where a floor is added to an existing structure, with the resident population offered the option of remaining throughout the project.
• Reconstruction - where one structure is demolished and replaced by another, with the population temporarily displaced.
• Raze and Rebuild - A much larger scale project where reparcelization takes place, existing structures are replaced by larger scale buildings, and the population is likewise temporarily displaced.
4 Methodology
The methodology for this research comprises three integral parts: input and processing data, a time-based microsimulation, and an online dashboard tool. Each component plays a crucial role in analyzing the socio-economic impacts of urban redevelopment and providing actionable insights for planners and policymakers.
Several assumptions underpin the methodology, influencing its accuracy and applicability. These assumptions include speculative estimations of construction timelines, assumptions about agent behavior, and reliance on authoritative and speculative data sources. However, these assumptions may introduce potential limitations, impacting the reliability and generalizability of the research findings.
The data utilized in this research is sourced from diverse and comprehensive datasets to ensure robust analysis and reliable outcomes. The primary data sources include authoritative GIS layers, municipal records, demographic studies, and synthesized demographic data. These datasets provide detailed information on building footprints, housing unit attributes, synthetic agent populations, and agent reactions to environmental changes.
The first phase of the methodology involves inputting and processing various datasets, including geographic information, population data, simulation interaction rules, and scripts defining physical and economic changes over time. Four essential input modules form the basis of the simulation: GIS of buildings, mapping of housing units, synthetic agent generation, and agent interaction rules.
The second phase employs a time-based microsimulation approach, iterating through successive years to assess the state of the environment, query agents based on changes, generate new agents to occupy vacant apartments, and track population changes over time.
Finally, the output from the microsimulation is fed into an online dashboard tool, facilitating analysis and visualization of population track changes. This tool enables policymakers and planners to gain insights into the socio-economic impacts of urban redevelopment and make informed decisions.
By integrating these three components, our methodology offers a comprehensive framework for analyzing urban redevelopment impacts, addressing potential social costs, and guiding strategic urban development initiatives.
4.1 Input and processing data
The four input modules essential for the operation of the simulation (Figure 2) are.
1. GIS of the buildings, before and after reconstruction, including building locations, properties, number of units, floors, and physical changes.
2. A mapping of the housing units and their attributes, type (Own/Rent), and Size
3. Synthetic agents coupled to housing units, each agent assigned with an ID
4. Reaction: Agent interaction rules define how the agents react to changes in the environment. These are the underlying assumptions.
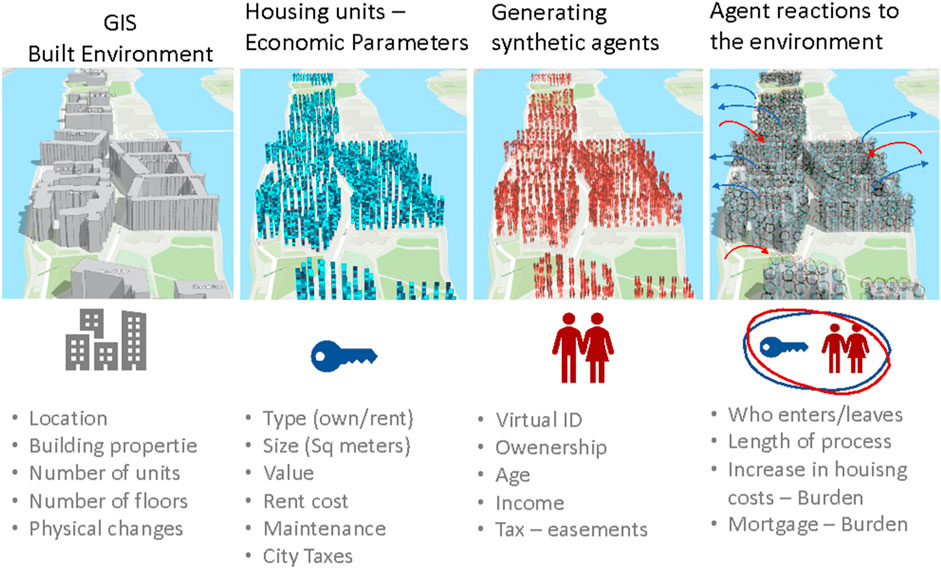
Figure 2. The four main input modules of the Bat-Yam and Roosevelt Island microsimulations.
4.1.1 Input 1. GIS of the Buildings
The first input module is a GIS layer that contains building footprints with their attributes and time stamps. The time stamps include a start and end period and are intended for the simulation and dashboard to perform temporal filtering based on time. One of the three status attributes for each building project area in the layer: is ‘Before construction,’ ‘Construction,’ and’ After construction.’ Each one of those statuses includes the time stamp mentioned before. The dashboard applies the time stamp as a temporal filter to avoid building superposition. General attributes of the buildings (in all statutes and typologies) include the following attributes: Type of construction (typology), number of apartment units per building, apartment size, and number of floors.
Authoritative GIS layers are the basis of the ‘existing buildings’ (before construction) layer. Architectural plans, in most cases, are the basis of the ‘future footprints’ layer. When architectural plans are unavailable, speculative digitization is applied to the footprint based on the site development regulations.
Determining the construction duration, phase length, and rehabilitation time is a speculative decision that can be changed dynamically with GIS software. The original speculative listing was based on previous study calculations (Levine et al., 2022a).
To be distinguished, three types of typologies are tagged to each project polygon (Addition, Reconstruction, and Raze and Rebuild). The construction distinguishment typology is based on the current Israeli planning and building practice (Levine et al., 2022a). This typology construction governs the population movement dynamic, as described next. In short, the construction typologies differ by:
1. The scale of the project, thus the size of the project area, and whether it needs re-parcelization (in case of a big project).
2. Factor increase, how many additional apartments will be added compared to the before state.
3. The project’s duration can span between 1–2 years to beyond 3 years.
Adding floors to an existing building or the need to demolish a building and build a new one instead. Table 1 summarizes the typology characteristics (for further information, see Levine et al., 2022a).
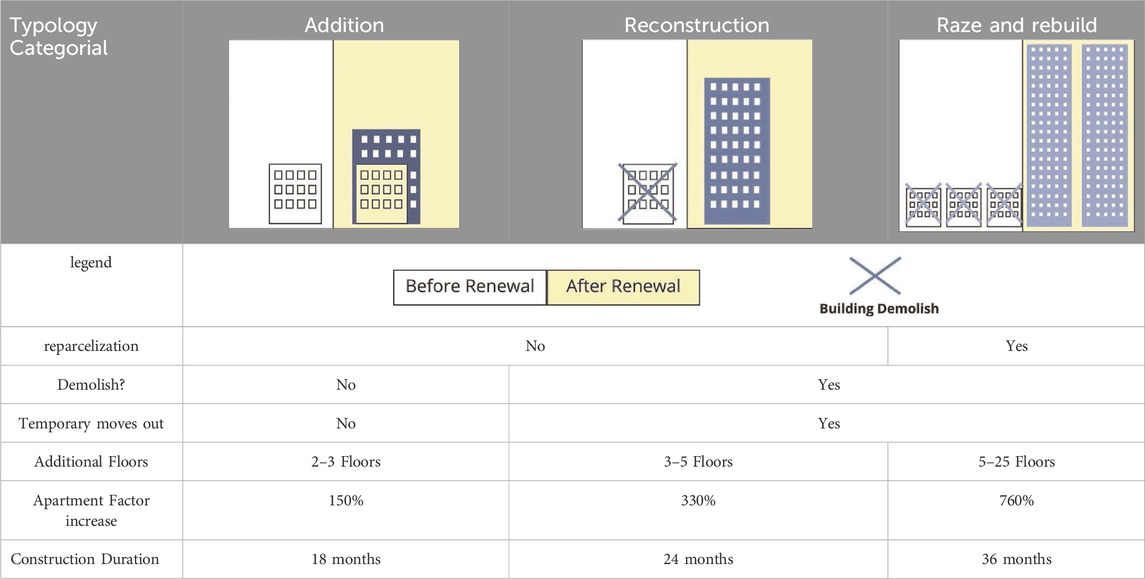
Table 1. Shows the characteristic changes between the different construction typologies (For further information, see Levine et al., 2022a).
Each of the various construction typologies impacts the residents of the buildings in the project differently. For example, in typologies that involve demolition, current residents have no choice but to relocate for the project’s duration–for some, this relocation is permanent. Elderly residents, and those suffering from health issues, are particularly likely not to return, given the lengthiness of the process and their often-precocious economic situation. Likewise, rebuilding will significantly impact both post-project land value and housing, making low-income residents particularly unlikely to return to their designated homes once the project is complete.
4.1.2 Input 2. A mapping of the housing units
For each building project, the existing and future apartments were modeled. If a building is ‘physically’ demolished and afterward rebuilt, the new apartment is linked to the old one by the ‘project number’. The individual owner of the old apartment is transmitted to the new apartment by linking a designated apartment number. The building GIS layer is linked to a tabular dataset that includes information on existing and future apartments. The dataset can be thought of as the vertical dimension of the GIS dataset. The attributes of this dataset include the type of housing (rent/own), door number (running index), size in sq meters, value (lease or house purchase value), Maintenance cost, and City tax cost. Similar to Input 1, we provide the status phase of the apartment (existing or future), which is also based on authoritative and speculative data.
This data was mainly obtained from Bat Yam Municipality - tax listing and analyzed and anonymized. For further information, see (Levine et al., 2022a)
4.1.3 Input 3. Generating synthetic agents
This tabular dataset defines the initial synthetic population in the simulation coupled to each original apartment (Input 2). At this point, we will coin an agent as the owner/renter of the household, and we will describe the synthetic population as the ‘agents’.
Each agent represents a household and is coupled to a housing unit using a key number (house ID and door ID). The attributes of this dataset include Unique identifier (UID number), type of ownership (owner or renter), age (a number between 20–100), income (a number between 2,000–30,000 New Israeli Shekels), Tax easement (defines whether the agent is eligible for tax easement and to what extent) for further information see (The author)
4.1.4 Input 4. Agent reactions to the environment
This module includes mainly if-then statements that define the various combinations of agent interaction with the built environment. More specifically, the agent has multiple characteristics that react differently regarding possible environmental scenarios. The main types of conditions include interaction between the agent’s age and the duration of the building construction, an increased cost of living compared to the income of the agent, and other specific conditions where agents might leave. In addition, this module also includes instructions on how to generate new agents in cases where vacant apartments are available in need to be inhabited. This will be further elaborated in the A time-based microsimulation section.
4.2 Time-based microsimulation
In its simplest form, time-based microsimulation is a set of iterative operations that run on the data throughout a defined time. For each iteration, a dataset of the changes that occur to the household agents is appended and documented.
The duration of the simulation is about 15 years between 2015–2030. The interval that was defined in the simulation is 6 months. For each point in time, the simulation applies an update on the building project line and attempts to answer three main questions: Who will leave? Who will stay? And who will move in? Parameterization based on assumptions and simulation interaction rules mandated the conditions of who would leave or stay (The author). The agents who will leave are those mandated by the if-then simulation interaction rules applied based on their characteristics; in other words, they were not resilient to the change in the buildings. Those who stayed were resilient to the same simulation interaction rules. The agents moving in are newly generated with characteristics matching the new apartment based on physical size and cost of living (The author).
The following list describes the fundamental operations of the simulation at each iteration; the numbering in square brackets refers to the numbers in Figure 3.
1. The simulation loops through a defined time series. For each period, the status of the selected building undergoes modification. In other words, the simulation modifies the built environment for a specific time frame. [1]
2. Built environment modification also involves the modification of the rent and value of apartments based on their new apartment size. [1]
3. To determine whether agents can stay based on their characteristics, they answer “if-then” questions. Based on the modification of the built environment and the economic parameters. [2]
4. If they cannot stay, the simulation will record their identity and departure time [3].
5. The simulation stores the information regarding the current residents of the building(s) (those who stay) that fall under the current project identification number. Then, it appends them to the new building/renovated building.
6. The remaining vacant apartments are stored as a data frame subset and used to generate new agents [4]
7. Generating new synthetic agents to inhabit the vacant apartments based on the economic attributes of the modified environment [4].
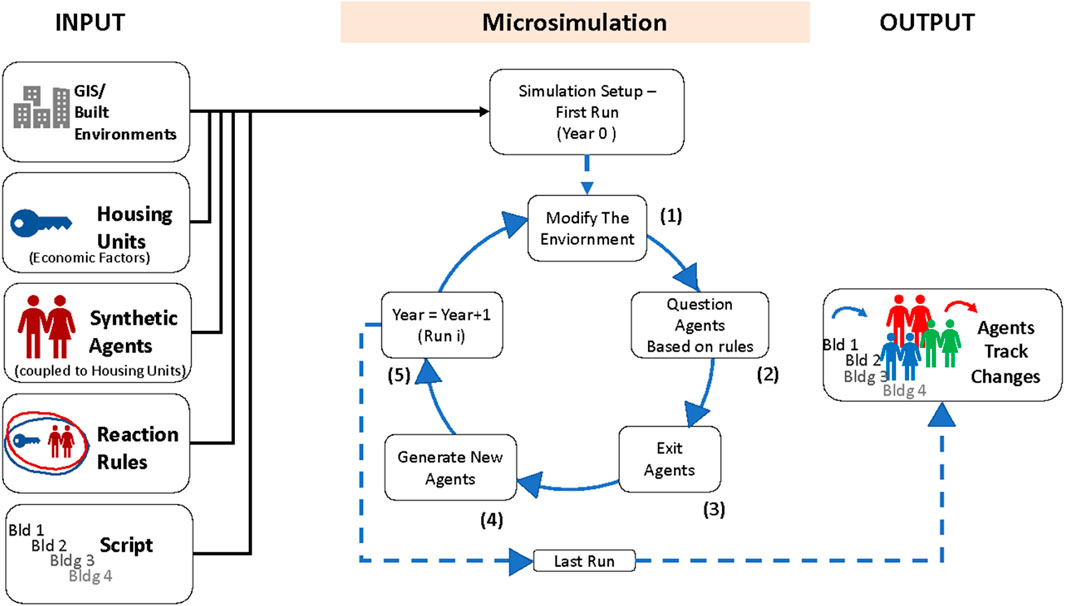
Figure 3. The microsimulation logic for Bat-Yam.
Simulation preparation and other inputs were conducted using QGIS and geopandas python library. The heart of the simulation was mainly written using the pandas library. The data visualization was primarily written with Dash-Plotly, Plotly in the Jupyter Lab environment.
(1) Modification of the built environment
For each of the three building typologies, the simulation mimics the physical behavior of the changing environment over time as well as the population dynamics. Since these operations have differed between the typologies, it is essential to emphasize the difference. Table 2 summarizes the main differences between the population and environmental dynamics.
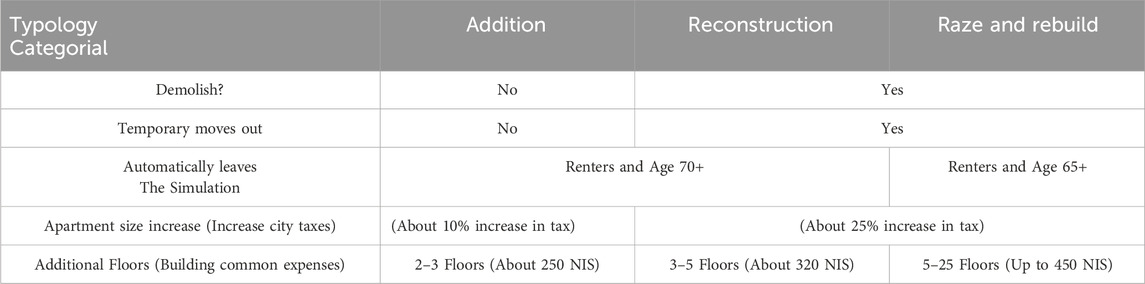
Table 2. Shows the interaction between the building typology and how it might affect different populations.
In the case of Building Addition, the existing building is upgraded; thus, the household can physically stay during the construction phase, even though it is not pleasant. In this case, the simulation mimics the behavior in which some residents stay in their apartments during construction phases and after construction ends. In contrast, others leave, either to return following construction or permanently. The simulation seeks to identify and visualize the risk factors for agent vulnerability to environmental changes this typology brings.
In the other two typologies, the whole physical structure is first demolished; thus, these situations do not permit the household to stay physically in the same apartment. The simulation mimics the process of moving the household to temporary residences (outside the research area), and after construction ends, the households that are resilient to the change will return.
(2-3) Querying household: Which households will remain and which will leave?
In the simulation, three main factors might cause an agent to leave permanently: ownership, age, and income. Ownership defines whether an agent owns an apartment or rents in it. In the simulation interaction rules, it was determined that all renters would move out in any scenario. Age is a factor since the construction phase takes time, and living conditions would be difficult during the building addition construction phase. Thus, it was decided that agents above the age of 70 would move out in all scenarios. However, in lengthier procedures such as in Raze and Rebuild, 65 and older agents will also not return. The last factor is the income level of the agent. Upgrading the built environment involves increasing the cost of living, common maintenance, and taxes. If an Agent owns an apartment and is young enough to withstand the lengthy period, he will have to face the challenge of increased costs. On the other side, New agents will move into the vacant apartments. The built environment defines the cost of living for a specific area, thus determining which agents will move into that area. In the results chapter, further details regarding the simulation assumptions (Levine et al., 2022a)
(4) Generating new populations
After the simulation identifies who will stay and who will leave, the simulation couples resilient households from the old apartment to the new apartment in cases where the agent moves physically, or the agents stay put in cases when the apartment is just upgraded, not demolished. The actual transition from the old building to the new one is done by recoupling the old apartment key index to the new one. The key index is a combination of the building code, its status, and the index of the apartment.
Potential new agents move into the available apartments in the new/upgraded building based on a vacant apartment that previously might have been habited by displaced agents or brand new apartments that were never designated. The vacant apartments are referenced, and new synthetic agents are generated based on their attributes. The characteristics of the new agents are defined mainly by the cost of the new apartments (Agents’ income), and the age ownership of the new agents is determined by national statistics (Levine et al., 2022a)
(5) Agent Track changes
The simulation generates results in a track changes CSV file. For every time frame, an action is performed, and the simulation readjusts itself accordingly. These individual actions are meticulously recorded in a track-change CSV log, which can later be aggregated and analyzed further (Harland et al., 2012). Mathematically, the track-change CSV dataset spans three dimensions: n represents the number of agents at any given time, m represents the agents’ properties, which can vary over time, and t represents the number of time steps. Consequently, the dataset can become quite large as the properties of each agent are duplicated across t time steps.
To manage the dataset’s size, we document only the changes affecting the population. However, for comprehensive analysis and statistical evaluation—such as determining age differences over time—it is crucial to measure changes continuously. In such cases, we use linear interpolation to calculate changes between two time points, ensuring that we can conduct accurate and meaningful analyses while maintaining a manageable dataset size.
4.3 Online dashboard tool
The online dashboard tool acts as the gateway for users to engage with the data churned out by the microsimulation, effectively bridging the divide between theoretical concepts and real-world applications in urban redevelopment. With its division into seven distinct sections, the dashboard offers users a comprehensive panorama of the simulation outcomes. Each segment hosts interactive graph/chart widgets endowed with modern internet dashboard functionalities like layer manipulation, zooming, and data-label snapshotting. What sets this dashboard apart is its emphasis on user-driven exploration and inquiry. Users wield the power to dynamically adjust the analysis timeframe via the time-slider, facilitating time-based inquiries and comparisons across different periods. Furthermore, users can tweak the dashboard’s context by selecting various thematic themes, enabling a nuanced understanding of the socio-economic impacts of urban redevelopment. This emphasis on user interaction significantly bolsters the dashboard’s practicality and usability, empowering stakeholders to extract actionable insights and make informed decisions in urban planning and development endeavors.
As for the microsimulation methodology, it serves as the backbone for generating tabular data, laying the groundwork for analytical insights. This data undergoes a transformation within the dashboard, morphing into visual representations that effectively illustrate the microsimulation process or endeavor to replicate real-world complexities. Serving as the intermediary between raw data and comprehensible visualizations, the dashboard plays a pivotal role in facilitating understanding and decision-making.
Users encounter a structured layout within the dashboard interface, divided into seven distinct sections, as depicted in Figure 4. These sections encompass crucial components such as the 2D/3D Map, Timeline, Physical Change Graphs, Socio-economic Graphs, Time Snapshot Demographic Change, and Graph Controllers. Each segment houses one or more graph/chart widgets equipped with interactive functionalities commonly found in modern internet dashboards. These capabilities, spanning from layer manipulation to zooming and data-label snapshotting, empower users to delve deeper into the data and extract meaningful insights. Notably, the simulation’s adaptability enables users to pose time-based inquiries via the time-slider feature or adjust the contextual framework of the dashboard by selecting different thematic themes, enhancing the user’s ability to explore and understand urban redevelopment dynamics from various angles (Figure 5).
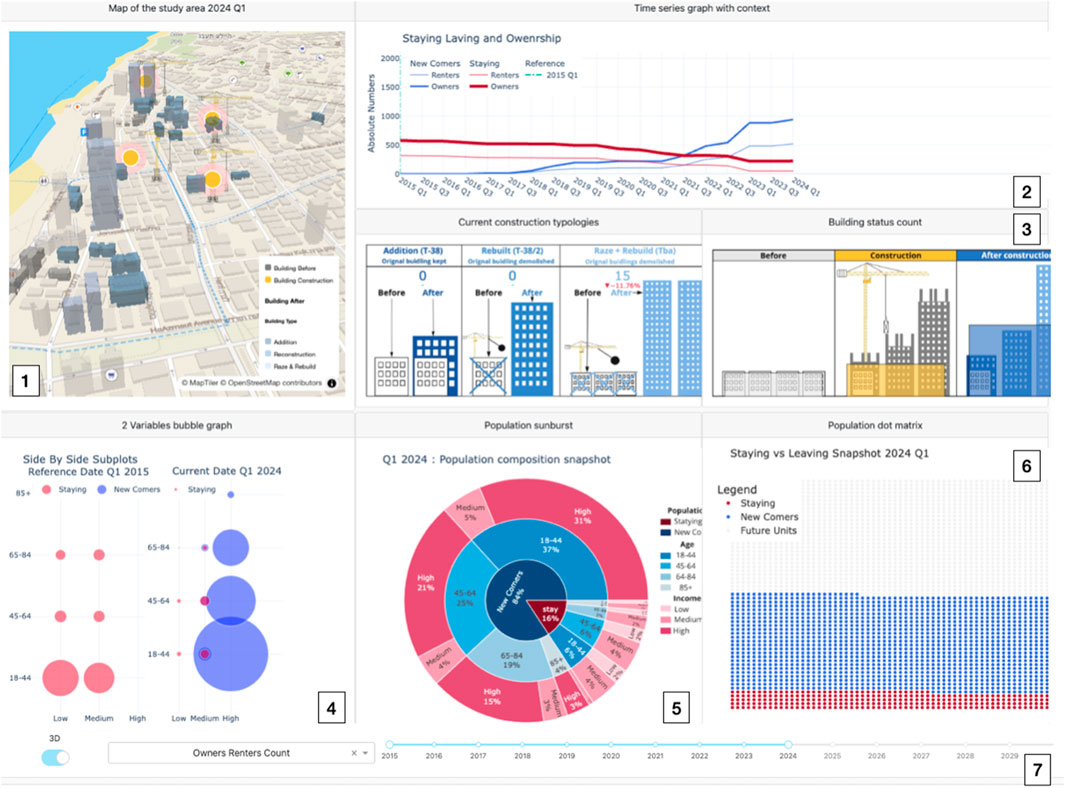
Figure 4. General view of the dashboard divided into different sections.
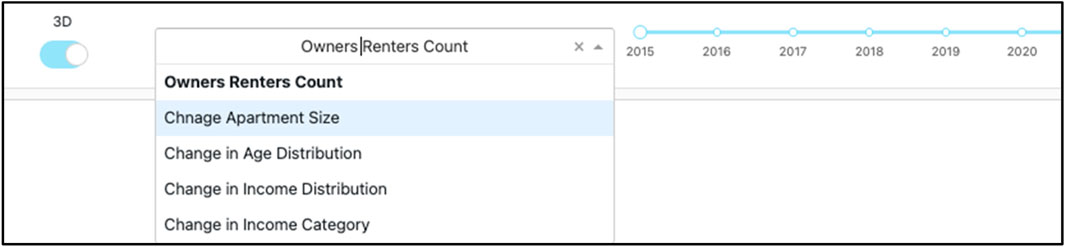
Figure 5. Simulation controller enables change in the context, time frame, and 2d/3d map.
4.3.1 Time series and contextual time graph
The most dominant feature of the dashboard is its ability to change the point of time or even to compare two points in time. Most of the graph’s widgets (5/7 widgets) display a snapshot of a specific time, and only two graphs present change within time or a comparison between two time points. Part 2 in Figure 4 displays the contextual time graph. Moreover, Figure 5 showcases an example of different contextual time-series graphs the dashboard generates.
Figure 6 showcases several contextual time-series graphs generated by the dashboard.
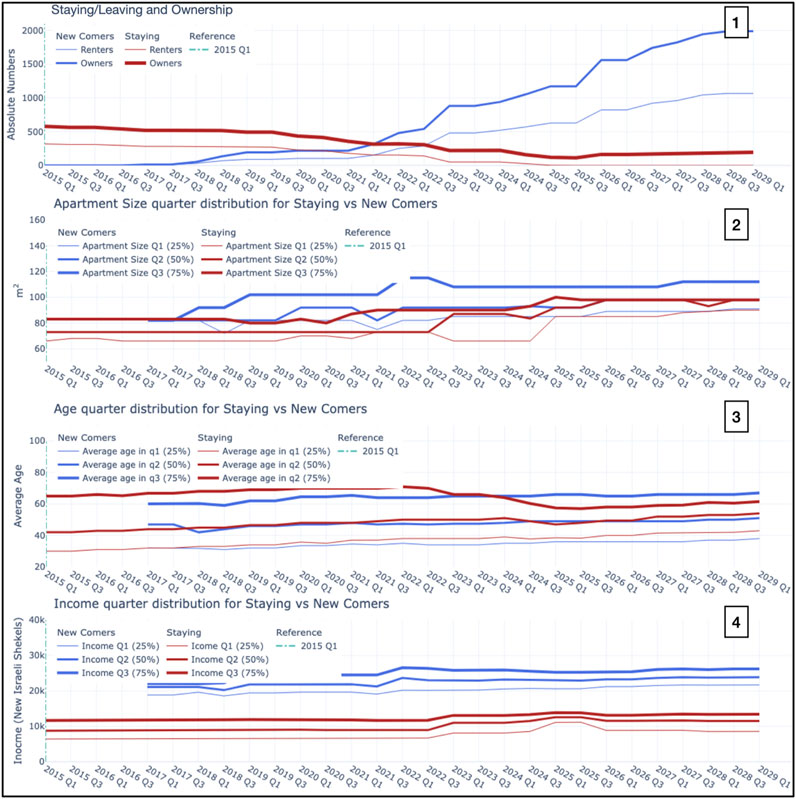
Figure 6. Contextual changes over time.
We can see in Figure 6, part 1, the absolute population change and the ownership composition between 2015 and 2029; this graph demonstrates how the massive redevelopment of the neighborhood increases the population. Part 2 shows the increased size of the physical apartments; the graph is divided by equal interval divisions, Q1 (25%), Q2 (50% Median), and Q3 (75%) of the subgroup population. We can see the increase in apartment size and how the newcomers, on average, live in larger apartments; however, the staying population will also move to larger apartments.
Figure 6 enables us a comparison of pre-urban renewal populations that remain vs. the newcomers, depicting user-defined pivots selected from the context menu (see the contextual menu in Figure 5)
It was found that the relationship between the change in population growth and the income of the newly entering agents was considerably higher (twice as high, on average) than that of the agents residing in the area before the urban renewal that remained. Moreover, as the population that did not return was composed of the more elderly population, the native population that did remain was younger than the more affluent newcomers.
Part 3 Shows the Average Age of the Staying/Newcomers; it can be seen that most of the elderly have left the neighborhood. Thus, this can hint towards the change in the urban environment. Part 4 depicts the significant difference between the staying population income and the new population income. Although it is clear that there is a large gap between the groups, it is essential to note that the current iteration of the simulation only accounts for price differences and does not take into consideration affordable living policies of any sort.
4.3.2 2D/3D Map
The dashboard enables viewing the study area in 2D and 3D, with each view having advantages. The 2D view enables us to see the different stages of development in an accurate geographic map. However, the 3D map enables us to get a visual impression of the change in the environment and enables distinction between the three building typologies. The simulation considers the construction period, which can be lengthy; this is illustrated in 2D and 3D maps Figure 7 and Figure 11. In 3D, it is a glowing dot and an iconic crane; in 2D, it is a yellow-filled polygon.
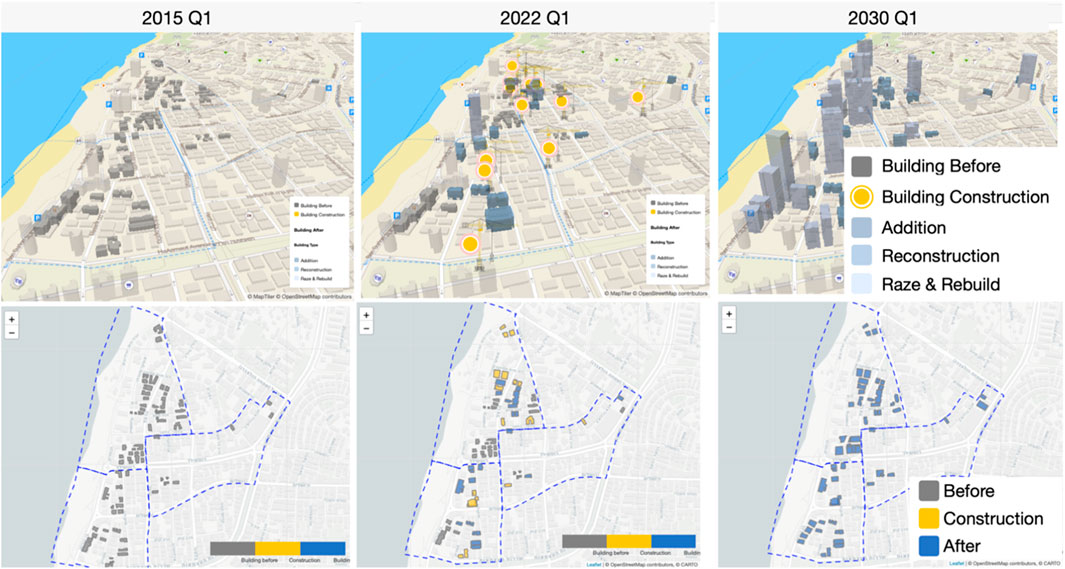
Figure 7. Simulation can display 2D/3D contextual maps and snapshots over time.
4.3.3 Building construction status
The Time Series also enables to display of the status of the building constructions. On the top (Figure 8), we see the number of urban renewal projects of each typology for a specific period. On the bottom, (Figure 8), the overall number of buildings before renewal, during construction, and after completion for each defined neighborhood is displayed during the defined time frame.
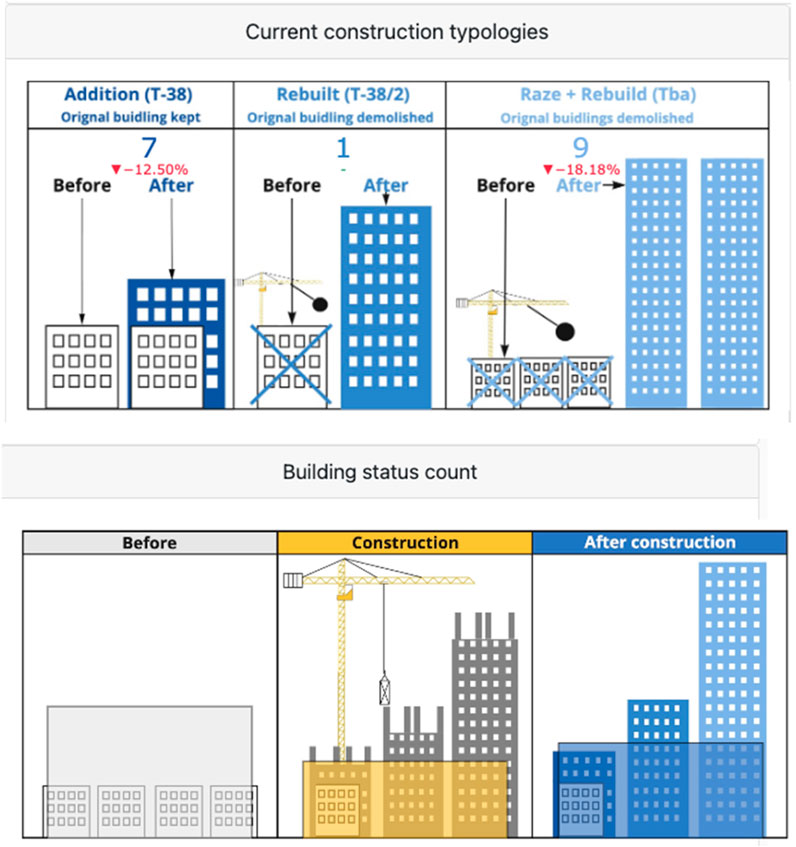
Figure 8. Current building construction typology phase (10a) and building status count over time (10b).
4.3.4 Socio-economic snapshots
For every given time point, the dashboard can display a snapshot of Socioeconomic characteristics in the neighborhood (Figure 9); since the time controller controls the dashboard, these figures can also be animated and illustrate population dynamics that occur in 15 years. For example, Figure 10 displays the change in the population from its pre-renewal composition (red) to the incoming newcomers (blue). By the time the process is complete for this case study, only 10% of the households in the renewed structures are pre-renewal natives.
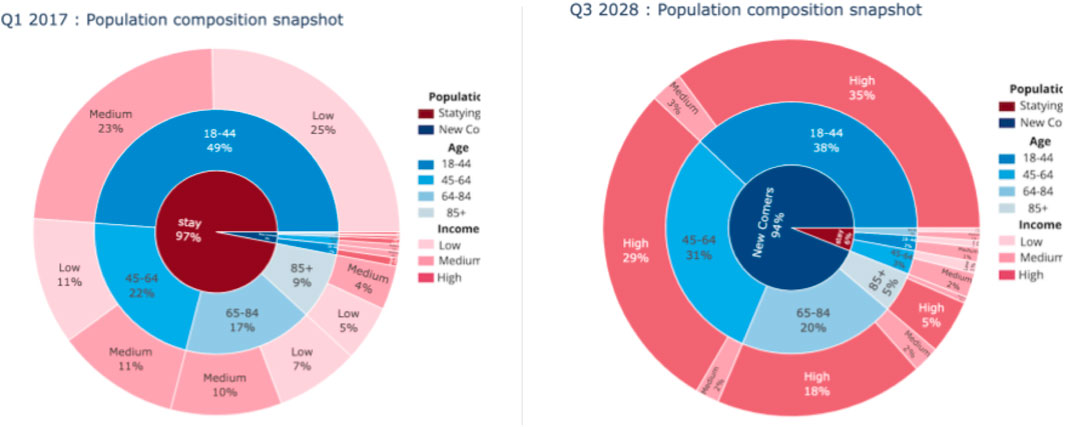
Figure 9. Socioeconomic charts that display Age ownership and income snapshots for a specific time.
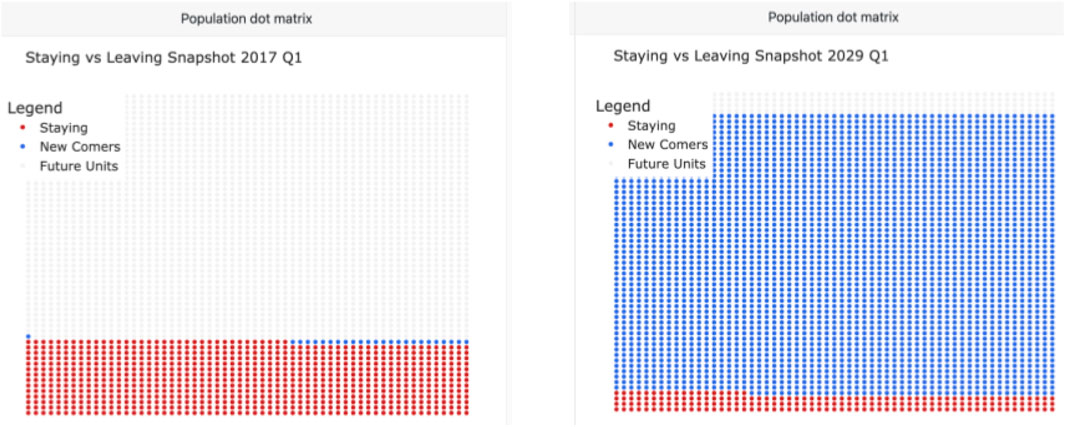
Figure 10. Dot matrix plot of changes to population composition in the study area between two points in time.
4.3.5 Cross view
Figure 12 summarizes four illustrations demonstrating the change in the built environment and the construction phase; in the figure, we can depict two columns, each of which details a specific time frame (2022, 2030). On the vertical side, the figure demonstrates the two maps (2D/3D), the typology, the construction phase, and the total accumulation of buildings built, the construction phase, or before construction.
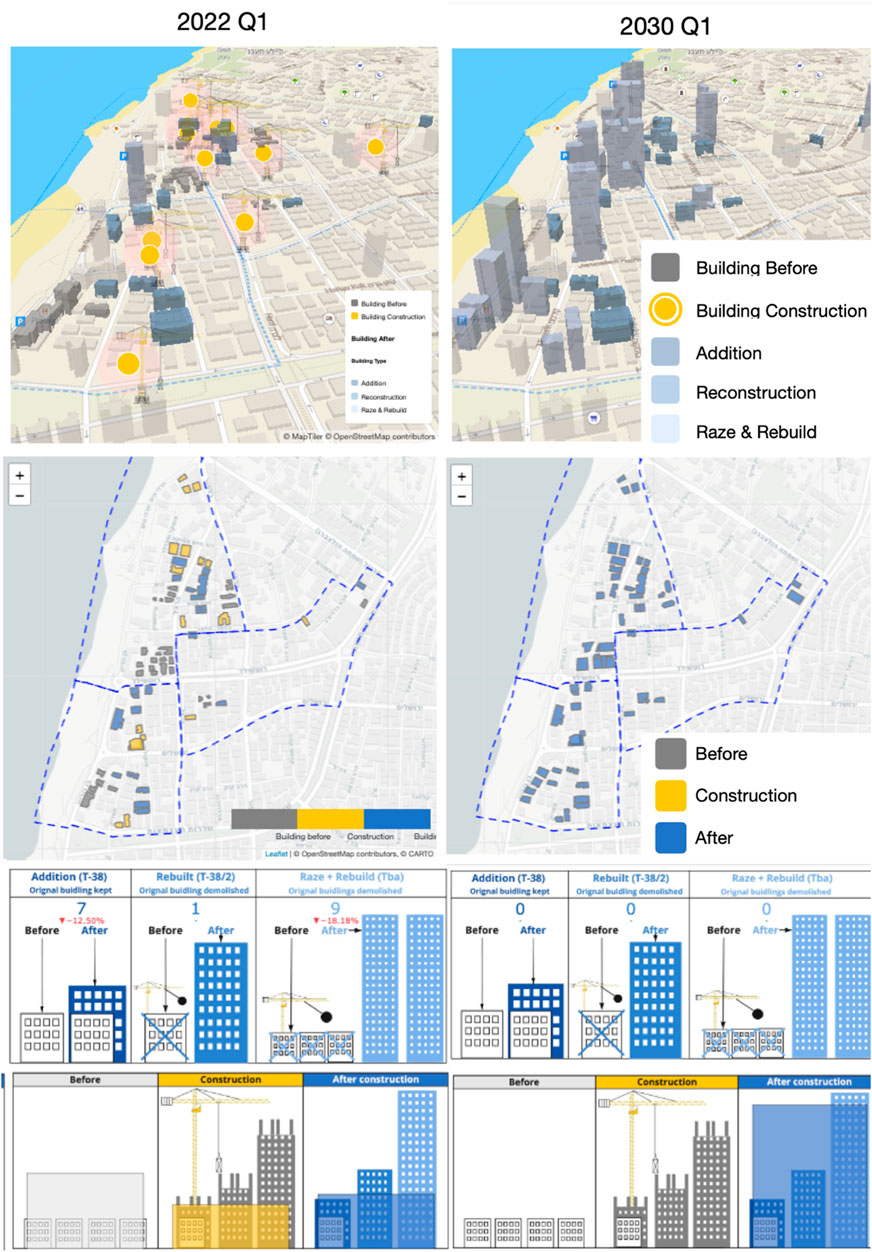
Figure 11. The simulation can show several indicators in parallel for specific times, in this case, 2022, 2030 (predicted).
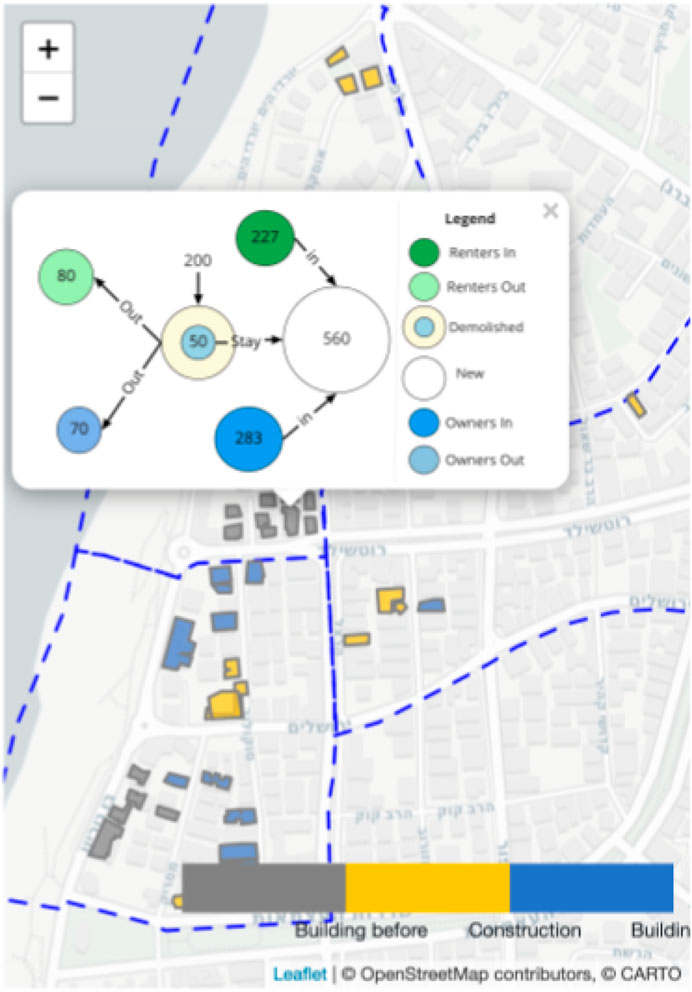
Figure 12. Graph view of population movement at a building scale.
4.3.6 Building scale analysis
One of the significant advantages of the simulation is that it depicts, on the household resolution scale, the resident’s movement in and out of the building in an easily accessible and intuitive network graph format. Thus, in Figure 12 shows the profile of agents moving out during the addition project, the profile of those who remain throughout, those who move out only to return, and the profile of newcomers who move in following the completion of the project.
Figure 13 displays the relationship between the building change and the dynamic population change. The diagram presents a flow of agents who stay or live and the new agents who accommodate the vacant apartments. The circle’s color represents whether the agent is a renter or an owner, and the direction represents whether he lives or enters. The size represents the number of households.

Figure 13. Logical diagram depicting the population behavior based on the change in typology.
5. Discussion
The online dashboard tool developed in this research serves as a crucial interface for users to interact with data generated by microsimulation, bridging the gap between theoretical research and practical urban planning applications. By providing a user-friendly platform for visualizing and analyzing complex urban redevelopment dynamics, the dashboard enhances the understanding of physical, social, and economic indicators in urban renewal.
The dashboard is divided into seven sections, offering a comprehensive overview of the simulation results through interactive graph/chart widgets with capabilities such as layer manipulation, zooming, and data-label snapshotting. This structure enables users to adjust the time frame of analysis, facilitating time-based questions and comparisons and to change the context by selecting different thematic themes. Such interactivity empowers stakeholders to derive actionable insights from the simulation results, informing evidence-based decision-making in urban planning.
Integrating multiple interactive widgets within the dashboard enhances its utility, allowing for dynamic exploration of simulation outcomes. The tight integration between various widgets, such as the 2D/3D maps and building status graphs, offers a holistic view of urban redevelopment projects, facilitating informed decision-making. Additionally, the ability to delve into building-scale information, coupled with features like population exchange charts, adds granularity to the analysis, enabling stakeholders to easily identify patterns and trends.
Calibration is critical in aligning the model’s predictions with real-world observations. In the context of our study, the microsimulation methodology relies initially on synthetic data generated from existing household information and projected urban development scenarios. To improve the accuracy of our predictions, future iterations of our work will incorporate calibration processes using real-time data. This will involve adjusting the simulation parameters based on historical data and observed trends to reflect actual urban dynamics better. By doing so, we can ensure that our model outputs are more representative of real-world conditions.
Validation involves comparing the model’s predictions with actual outcomes to assess its accuracy. Currently, our study is based on a case study of Bat Yam, Israel, and uses approved redevelopment plans to model future scenarios. While this approach provides a foundational understanding, we recognize that validation with empirical data is crucial. We plan to validate our model by comparing its predictions with actual demographic and socio-economic changes observed in similar urban redevelopment projects. This will involve longitudinal studies where the projected outcomes of the simulation are periodically compared with real-world data collected over time.
We acknowledge that simulation models are inherently subject to biases and limitations, particularly concerning the assumptions embedded within them. The current simulation uses predefined scripts for project timelines and population dynamics, which may not fully capture the variability and unpredictability of real-world events. Future work will involve.
1. Incorporating Uncertainty: Developing algorithms to account for delays and other uncertainties in project timelines to better reflect real-life scenarios.
2. Enhancing Data Quality: Continuously updating the model with high-quality, real-time data to improve accuracy and reduce biases.
3. Exploring Alternative Scenarios: Allowing users to configure different scenarios and test various parameters to understand a range of potential outcomes.
Comparing our dashboard framework with existing tools highlights both strengths and areas for improvement. Unlike static tools like Excel spreadsheets or GIS software, our dashboard offers a dynamic, interactive platform that enhances user engagement and understanding. However, advanced urban simulation tools such as UrbanSim and MATSim also offer robust modeling capabilities. Future work will involve a detailed comparative analysis to benchmark our tool against these systems, focusing on user experience, accuracy, scalability, and real-time data integration.
To address existing gaps and enhance the utility of our tool, we propose several future research directions.
1. Integration with Real-Time Data: Linking the dashboard with live data feeds to enable real-time monitoring and adjustment of simulations, thus converting it from a lab experiment to a practical planning tool.
2. Scenario Testing Module: Developing a module for configuring and testing different redevelopment scenarios, allowing planners to explore various outcomes based on different assumptions and parameters.
3. Demand Simulation: Incorporating a demand simulation component to assess how population growth and housing demand influence redevelopment plans.
4. Public Space Analysis: Including an analysis of public spaces to ensure that urban redevelopment meets the needs of the growing population.
Addressing these areas will enhance the robustness, accuracy, and practical applicability of our dashboard tool, ultimately providing a more powerful and insightful resource for urban planners and policymakers.
Despite these areas for improvement, the dashboard and microsimulation tool represent valuable assets for urban redevelopment planning, simplifying complex phenomena and facilitating informed decision-making. By providing insights into speculated future scenarios and their implications for the current population, the tool enables more precise planning and responsive action during construction phases. With continued refinement and application, the tool holds the potential to revolutionize urban redevelopment processes, offering flexibility, insight, and adaptability to meet the evolving needs of urban communities.
Data availability statement
The raw data supporting the conclusion of this article will be made available by the authors, without undue reservation.
Author contributions
DL: Conceptualization, Data curation, Formal Analysis, Investigation, Methodology, Validation, Visualization, Writing–original draft. SS: Formal Analysis, Investigation, Methodology, Software, Writing–original draft. MA-G: Conceptualization, Supervision, Writing–review and editing. SA: Conceptualization, Supervision, Visualization, Writing–review and editing.
Funding
The author(s) declare that no financial support was received for the research, authorship, and/or publication of this article.
Conflict of interest
The authors declare that the research was conducted in the absence of any commercial or financial relationships that could be construed as a potential conflict of interest.
Publisher’s note
All claims expressed in this article are solely those of the authors and do not necessarily represent those of their affiliated organizations, or those of the publisher, the editors and the reviewers. Any product that may be evaluated in this article, or claim that may be made by its manufacturer, is not guaranteed or endorsed by the publisher.
References
Adedeji, J. A., and Arayela, O. (2018). Urban renewal strategies and economic growth in Ondo State, Nigeria: a case study. J. Contemp. Urban Aff. 2 (1), 76–83. doi:10.25034/ijcua.2018.3662
Ballas, D., Clarke, G. P., and Wiemers, E. (2005). Building a dynamic spatial microsimulation model for Ireland. Popul. Space Place, 11(3), 157–172. doi:10.1002/psp.359
Barbosa, A. C., Moraes, T. M., Tesima, D. T., Pontes, R. C., de Sá Motta Lima, A., and Azevedo, B. Z. (2019). Smart planning: tools, concepts, and approaches for a sustainable digital transformation (pp. 221–236). doi:10.1007/978-3-030-12255-3_14
Batty, M. (2005). Agents, cells, and cities: new representational models for simulating multiscale urban dynamics. Environ. Plan. A 37 (8), 1373–1394. doi:10.1068/a3784
Batty, M. (2012). Building a science of cities. Cities 29 (Suppl. 1), S9–S16. doi:10.1016/j.cities.2011.11.008
Batty, M. (2013). The new science of cities. Available at: http://www.dawsonera.com/depp/reader/protected/external/AbstractView/S9780262318235.
Benenson, I., and Torrens, P. M. (2004). Automata-based modeling of urban phenomena. doi:10.1002/0470020997.fmatter
Birkin, M., and Wu, B. (2012). A review of microsimulation and hybrid agent-based approaches. Agent-Based Models Geogr. Syst., 51–68. doi:10.1007/978-90-481-8927-4_3
CBS (2020). Statistical abstract of Israel, 2020 – No. 71. Available at: www.cbs.gov.il/he/publications/Pages/2020/71-.aspx (Accessed February 15, 2021).
Crooks, A. T., Patel, A., and Wise, S. (2013). Multi-agent systems for urban planning. Technol. Urban Spatial Plan. Virtual Cities Territ., 29–56. doi:10.4018/978-1-4666-4349-9.ch003
Gray, S., Milton, R. W., and Hudson-Smith, A. (2013). Visualizing real-time data with an interactive iPad video wall. MethodsNews 7.
Harland, K., Heppenstall, A. J., Smith, D., and Birkin, M. (2012). Creating realistic synthetic populations at varying spatial scales: a comparative critique of population synthesis techniques. J. Artif. Soc. Soc. Simul. 15. doi:10.18564/jasss.1909
Huang, Q., Parker, D. C., Filatova, T., and Sun, S. (2014). A review of urban residential choice models using agent-based modeling. Environ. Plann. B Plann. Des. 41, 661–689. doi:10.1068/b120043p
Jing, C., Du, M., Li, S., and Liu, S. (2019). Geospatial dashboards for monitoring smart city performance. Sustainability 11 (20), 5648. doi:10.3390/su11205648
Kanyepe, J. (2023). The nexus between residential density, travel behavior and traffic congestion in developing metropolitans: a case study of harare, Zimbabwe. J. Contemp. Urban Aff. 7 (1), 103–117. . doi:10.25034/ijcua.2023.v7n1-7
Kitchin, R. (2014). The real-time city? Big data and smart urbanism. GeoJournal 79 (1), 1–14. doi:10.1007/s10708-013-9516-8
Kitchin, R., and McArdle, G. (2016). Urban data and city dashboards: six key issues. Program. City Work.
Levine, D., and Aharon-Gutman, M. (2022b). The social deal: urban regeneration as an opportunity for in-place social mobility. Plan. Theory 22, 154–176. doi:10.1177/14730952221115872
Levine, D., and Aharon-Gutman, M. (2023). There’s no place like real estate: the “Self-gentrification” of homeowners in disadvantaged neighborhoods facing urban regeneration. J. Hous. Built Environ. 38 (2), 775–794. . doi:10.1007/s10901-022-09970-0
Levine, D., Sussman, S., and Aharon-Gutman, M. (2022a). Spatial-temporal patterns of self-organization: a dynamic 4D model for redeveloping the post-zoning city. Environ. Plan. B Urban Anal. City Sci. 49 (3), 1005–1023. . doi:10.1177/23998083211041369
Mackenzie, A. (2015). The production of prediction: what does machine learning want? Eur. J. Cult. Stud. 18 (4–5), 429–445. doi:10.1177/1367549415577384
Marois, G., and Bélanger, A. (2015). Analyzing the impact of urban planning on population distribution in the Montreal metropolitan area using a small-area microsimulation projection model. Popul. Environ. 37 (2), 131–156. doi:10.1007/s11111-015-0234-7
Nassar, U. A. (2021). Urban acupuncture in large cities: filtering framework to select sensitive urban spots in riyadh for effective urban renewal. J. Contemp. Urban Aff. 5 (1), 1–18. . doi:10.25034/ijcua.2021.v5n1-1
O’Donoghue, C. (2014). Introduction. Handb. Microsimulation Model. 293, 1–21. doi:10.1108/S0573-855520140000293001
Orcutt, G. H. (1957). A new type of socio-economic system. Rev. Econ. Statistics 1 (58), 773–779. doi:10.34196/ijm.00002
Priem, F., Stessens, P., and Canters, F. (2020). Microsimulation of residential activity for alternative urban development scenarios: a case study on brussels and flemish brabant. Sustain. Switz. 12, 2370. doi:10.3390/su12062370
Raghothama, J., Baalsrud Hauge, J., and Meijer, S. (2022). Curating player experience through simulations in city games. Urban Plan. 7 (2). doi:10.17645/up.v7i2.5031
Soundararaj, B., Pettit, C., and Lock, O. (2022). Using real-time dashboards to monitor the impact of disruptive events on real estate market. Case of COVID-19 pandemic in Australia. Comput. Urban Sci. 2 (1), 14. doi:10.1007/s43762-022-00044-z
Tanton, R., and Edwards, K. (2013). Spatial microsimulation: a reference guide for users (Netherlands: Springer). doi:10.1007/978-94-007-4623-7
Tomintz, M. N., Kosar, B., and García-Barrios, V. M. (2017). simSALUD: design and implementation of an open-source wizard based spatial microsimulation framework. Int. J. Microsimulation 10, 118–143. doi:10.34196/ijm.00159
Waddell, P. (2002). UrbanSim: modeling urban development for land use, transportation, and environmental planning. J. Am. Plan. Assoc. 68 (3), 297–314. doi:10.1080/01944360208976274
Yavo-Ayalon, S., Levine, D., Sussman, S., and Aharon Gutman, M. (2024). Affordability with an expiration date: a microsimulation for estimating the demographic changes caused by deregulation of assisted housing. Urban Aff. Rev. 60 (2), 448–487. . doi:10.1177/10780874231169213
Keywords: GIS-geographic information system, urban renewal, displacement, simulation, dashboard and visualization tool
Citation: Levine D, Sussman S, Aharon-Gutman M and Yavo Ayalon S (2024) Population demographic tracking and estimation tool: a simulation-dashboard for urban redevelopment’s demographic implications in Israel. Front. Built Environ. 10:1405464. doi: 10.3389/fbuil.2024.1405464
Received: 22 March 2024; Accepted: 10 June 2024;
Published: 04 July 2024.
Edited by:
Qiong Wu, Jilin University, ChinaReviewed by:
Hourakhsh Ahmad Nia, Alanya University, TürkiyeClaudio Martani, Purdue University, United States
Copyright © 2024 Levine, Sussman, Aharon-Gutman and Yavo Ayalon. This is an open-access article distributed under the terms of the Creative Commons Attribution License (CC BY). The use, distribution or reproduction in other forums is permitted, provided the original author(s) and the copyright owner(s) are credited and that the original publication in this journal is cited, in accordance with accepted academic practice. No use, distribution or reproduction is permitted which does not comply with these terms.
*Correspondence: Daphna Levine, ZGFwaG5hQHVyYmFubWl4LnRlY2g=