 Stéphane Morin Pépin
 Adel Francis
- Construction Engineering Department, École de Technologie Supérieure (ÉTS), Montreal, QC, Canada
The new trend in planning building projects involves incorporating space management on the construction site. Failing to consider the management of site operations can lead to either relaxed or congested construction sites. This is because labor, tools, equipment, and materials all require space. It is important to plan for the circulation and temporary storage of materials, including recycling, reuse, and disposal. Temporary installations and finished products also take up space and can impact traffic flow. For example, partitions can impair traffic flow, while finished flooring can restrict it. The occupation of spaces also changes as the work progresses, so it is important to monitor and accommodate these changes. Therefore, space management needs to be coordinated throughout the construction phase. Traditional planning methods do not consider the analysis of critical spaces or their evolution over time. As a result, they produce schedules that do not reflect the reality of the construction site. Dynamic space-time planning means modelling the operational flow in different sectors of the construction site to optimize the construction process. Efficient space occupation allows for more effective utilization of available resources. This paper aims to analyze the spatial requirements of various construction operations and develop standardized artifacts that integrate spatial information into the schedule. To achieve this objective, the methodology aims to: (i) Conduct site surveys to collect data and analyze construction operations and their spatial needs; (ii) Define the necessary parameters for determining the occupancy rate (OR); (iii) Develop the needed artifacts for representing the static models based on the survey results and the developed occupancy parameters to visually depict and compute various types of occupancy and operations; (iv) Conduct workshops with the professionals in the construction industry. The participants were asked to provide feedback on whether the artifacts effectively captured the various aspects of construction work, such as equipment, tools, materials, and safety protocols. The aim is to validate that the artifacts as reliable representations of real-life construction scenarios. The feedback and input provided by the professionals helped to ensure that the artifacts were accurate, informative, and valuable for training purposes in the construction industry.
1 Introduction
The conventional approach to planning building construction projects uses the Gantt/Precedence diagram to produce an execution schedule. This method combines the visual representation of a Gantt chart with the logic of the Precedence Diagram Method (PDM) to calculate the critical path of activities and margins. Resources are then allocated to activities and leveled out in an attempt to smooth out their use. With its four types of relationships PDM permits the overlapping of the activities which have partial start or partial finish dependencies, without an obligation of splitting them. These same dependencies, which makes the method more manoeuvrable, affects its accuracy. Errors can arise, such as the reverse critical path (Wiest, 1981) in which when one diminishes (increases) the duration of a critical activity, the project duration increases or be unchanged (diminishes or be unchanged). This method also lack precision with the use of multiple calendars (Kim and Jesus, 2005), or when using lags to simulate production (Francis and Edmond, 2006). These inaccuracies can compromise the reliability of the schedule and hinder the ability to effectively monitor activity interdependencies.
Moreover, the critical path calculation solely relies on activities and time, compromising its accuracy for planning buildings projects. By neglecting factors such as space use, resource availability, material handling, and storage, leads in an inaccurate and an incomplete schedule. Scheduling simultaneous activities in the same place, or leaving spaces underutilized, may lead to congestion or relaxation at sites, impacting the project’s timeline. Thus, this logic poorly responds to both the needs of general contractors and subcontractors.
General contractor coordinates subcontractors at the construction site to ensure linear production and prevent relaxed or congested construction sites. They also oversee material supply logistics. Therefore, traditional methods do not suit for them. Resource management, while neglecting space management, can be inefficient and result in inaccurate scheduling. It is crucial to ensure that resources are not overused beyond the capacity of the workspace, as this can lead to congestion and hinder the movement of people and materials, ultimately impacting productivity on construction sites. Traditional planning methods often struggle to model spaces effectively on a construction site, focusing more on tasks and constraints.
Subcontractors allocate resources to the site and plan their weekly activities accordingly by assigning activities to resources. This approach contrasts with the Gantt/Precedence modeling logic. While resource allocation is crucial, rather than planning resources and ensuring linear resource utilization, Gantt/Precedence involves scheduling activities first, then assigning resources, and finally try to level resource. Conversely, planning teamwork by assigning activities presents a more coherent approach to ensuring consistent resource utilization.
The growing need to track and locate the different resources on a construction site has led to the development of many space planning methodologies over the years. This research aims to develop a model that accurately captures the progress of construction operations, enabling linear planning and streamlining project site monitoring. The aim is to enhance scheduling methods for planning building construction projects by proposing and categorizing standardized artifacts for dynamic utilization of construction space, thereby improving the optimization of the operations.
2 Background and justification
The management of available space on a construction site directly affects a project duration, costs, and safety (Mawdesley, Al-jibouri, and Yang, 2002). However, this discipline is often underestimated by project managers (Guo, 2002) and remains a rather difficult and unfamiliar exercise for managers. Moreover, spaces are dynamic and evolve over time according to the various phases of the project (Francis and Morin-Pepin, 2017), making each construction project unique. Therefore, it is difficult to establish a universal method for managing spaces (Mawdesley, Al-jibouri, and Yang, 2002).
This is why the management of space on the site is left to the discretion of the project manager and his superintendent (Akinci and Fischer, 2000). The latter is poorly equipped and tries to resolve space use conflicts by direct negotiation on the site in response to specialized contractors’ and suppliers’ space needs. This mode of operation regularly results in unnecessary movement of materials, equipment, and workers, increasing the risk of accidents and injuries and contributing to lost time and productivity as well as conflict. Francis (2015) stressed that what is not modeled cannot be managed properly, and any model must allow to identify the sources of problems and even be able to anticipate them.
To remedy this situation, several researchers have studied space management, better known under as space planning. Based on the type of use (work, storage, circulation), Riley and Sanvido (1995) described the behavior of these spaces according to the nature of the work performed. Whereas, Winch and North (2006) proposed defining spaces based on their state of occupation (free, occupied), Zouein and Tommelein (2001) did so based on their physical changes during the execution of the activity, and Frandson and Tommelein (2014) did so based on the stakeholder needs.
This led Francis and Edmond, (2006) to develop the chronographic modeling, which is centered in part on the concepts of space planning and the need to develop management and planning applications that are better suited to the construction industry. Its main attraction lies in its graphical capacity to present useful information to the construction project manager. From its conceptual framework and graphical protocol (Francis, 2013; 2019; Ardila et Francis, 2015a; 2015b), a series of tabular and graphical models is proposed that generates displays adapted to various types of projects, specialties, and the range of situations that can arise during a construction project.
Graphical representations of spatial planning, oriented towards the linearization of resource management, offer a platform more suited to the detection of spatial conflicts. Indeed, the impact of spatial congestion, or relaxation, on planning is a well-known problem in the construction field. Already in 1989, Sanders et al. (1989) estimated a loss of efficiency of about 65% due to space congestion. Despite the frequency of these conflicts, the industry still does not consider the available space when planning future work (Akinci and Fischer, 2000).
Akinci et al. (2002) sought to formalize the analysis of spatiotemporal conflicts and to develop a procedure for classifying and prioritizing them. These conflicts are analyzed in four (4) steps: i) detection of conflicts in the production model, ii) aggregation of conflicts, iii) categorization of aggregated conflicts, and iv) prioritization of aggregated conflicts. Subsequently, Akinci et al. (2022) described a formal way to automate the determination of schedule impacts of time-space conflicts. Predict the behaviors of interfering activities and schedule those behaviors’ impacts given a spatial conflict.
Guo (2002) combined MS-Project and AutoCAD to develop a process for detecting and resolving space conflicts on the construction site. According to him, the CAD system allows managers to specify prioritization criteria to perform and detect space conflicts from the planning and propose a solution in the project CAD plans. This decision-support system allows managers to solve this complex problem more efficiently and with more precision.
Chua et al. (2010) proposed a methodology that distinguishes between several classes of conflicts. They mainly sought to show the links between space conflicts and congestion on construction sites. To do so, they introduced two (2) indicators that can be used as a complement to 4D-CAD analyses: i) the dynamic space interference, which allows for quantification of the interference when conflict arises between activities, and ii) the congestion penalty indicator, which allows for the evaluation, analysis, and comparison of the feasibility of several timelines.
Mirzaei et al. (2018) developed a new approach that dynamically detects spatiotemporal conflicts. First, the crew workspace is determined by their movements within the various sectors. Subsequently, this information is inserted into a BIM-4D simulation to detect, calculate, and dynamically display the position and size of conflicts between work crews during construction.
3 Goal, objectives and limitations
3.1 Needs and justification
The increased ability to model the available space allows managers to plan workflows more effectively, minimize resource movement, optimize space utilization, and improve safety on construction sites. Researchers have focused on the detection and resolution of space conflicts by mean of mathematical or graphical models, static or dynamic. According to our knowledge of the state of the art, to date, none of them have categorized or standardized visual artifacts to represent the workflow, static or dynamic, of the various occupation types (OT) at the site. Therefore, a standard protocol is necessary to facilitate the modeling and communication of the position and the space required by resources through the schedule. Artifacts that can schematically show a static and dynamic representation of the site occupancy rates of construction operations, allowing construction managers to model, plan, and optimize spaces, thereby avoiding congestion or zone relaxations by promoting linear and uniform production.
3.2 Research goal and objectives
The primary objective of this research project is to enhance scheduling methods for planning building construction projects. This will be achieved by developing a methodology to construct a dynamic spatiotemporal representation of the occupancy rate (OR).
This project is intended to develop a graphical protocol for modeling site occupancy rates based on information that managers can easily obtain when planning a construction project, so an empirical approach based on design-science concepts was developed. The mission of design science is to develop knowledge that the professionals of the discipline in question can use to design solutions for their field problems (Van and Joan, 2005). Based on procedural methodologies and spatiotemporal chronographic modelling (Francis, 2004; 2016; 2020), these models will allow the calculation and anticipation of spatiotemporal occupancy rates of construction sites and use it as a leveling factor to ensure optimal utilization of available indoor and outdoor spaces during the planification phase. The aim is to create and analyze the dynamic model of the occupancy rate schedule and identify over- and underutilized sectors.
The primary strength of the proposed method lies in its capacity to generate a dynamic schedule that not only captures the construction timeline but also models the spatiotemporal changes in the OR of the construction site. This integrated approach aims to introduce an additional layer of information, specifically the occupancy rates, to the construction schedule, all while minimizing the burden on already busy construction project managers.
Thus, the key objective of this paper is to formulate and classify standardized artifacts tailored for dynamic optimization of operations, emphasizing on the improved utilization of construction site space. These artifacts, presented schematically, must effectively and clearly represent both construction operations and the spatial allocation of resources. This clarity enables project managers to make well-informed decisions, optimizing the construction process and enhancing overall productivity.
3.3 Research methodology
To achieve this objective, the design of the artifacts demonstrated in this paper follows the analytical method presented by Hevner et al. (2004). Based on this, the research methodology specifies the following steps: (i) Information gathering and static analysis of the construction operations and their space requirements; (ii) parameters for the Occupation Rate (OR) calculation; (iii) modeling of static artifacts and calculation to graphically represent the different occupancy and operation type (iv) validation of created artifacts through workshops. The following four sections will explain this methodology in detail.
3.4 Research constraint and limits
This study is limited to building construction projects, and the user must have excellent knowledge of construction processes, specifically construction techniques and management used by specialized contractors. Plus, at the time of this writing, no prioritization process has been defined in the event of a conflict between the critical path on a CPM/Gantt and if the occupancies rates are too high.
4 Information gathering and static analysis of the construction operations and their space requirements
In order to define the information and parameters needed for the calculation of occupancy rate, as well as information breakdown structure (IBS), an empirical approach was used. This approach consists in gathering information during the construction of real project. Therefore, three (3) projects were used as reference: the renovation of a luxury hotel in Montreal, which took place in 2016; the construction of a new pavilion; and the renovation of the library of the École de Technologie Supérieure (ÉTS), which took place between 2017 and 2019. On the reference projects, weekly takeoff of the entire construction site, supported by sketches and photos, was done (Morin et al., 2019). The objectives were to understand the links between the available space in each sector1 and the space required by the work teams to execute the operations and the key challenges that construction project managers faced in managing the spaces were also identified.
Given that enhancing the planning quality of construction projects is a key objective of this research project, an empirical methodology was employed. The initial phase involved on-site visits to gather data on the positions and spatial occupancy of everyone and everything participating in the construction process. To achieve this, three specific projects were chosen for takeoffs and analysis.
The first was the renovation of the Fairmont Queen Elizabeth Hotel in downtown Montreal. This project was chosen because for the vast scale of the required demolition while keeping the structure intact. The second project was the reconstruction of the ÉTS’s library. It was chosen because the works had to be done while there were still students around. The final project was the construction of the new pavilion of the ÉTS. A five (5) story building that include office and workshops for the clubs of the students, and classrooms. Those construction projects were a good opportunity to collect a good variety of data on the position and the occupation of everything that can occupy space during a building construction process.
Weekly takeoff, supported by sketches and by photographing the entire project (Morin et al., 2019), were done. Then, the pictures were analyzed (Figure 1 left), and the space occupied on the construction site, during the takeoff, were transcribed on the plan of the project (Figure 1 right). Those transcriptions were then analyzed to determine the qualitative and quantitative parameters discussed in the two (2) next sections.
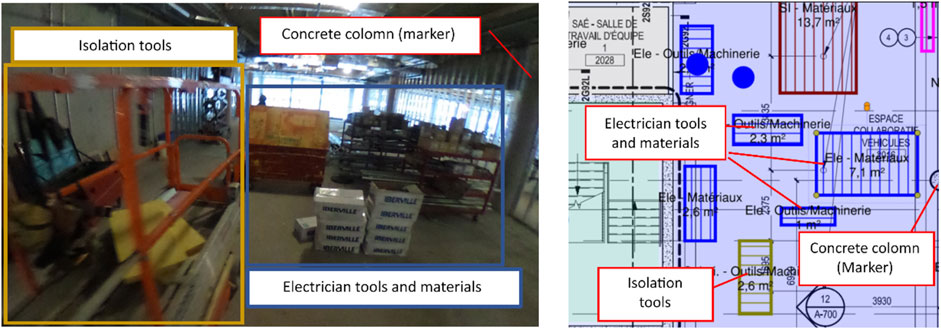
Figure 1. Left: takeoff picture, right: plan representation of the same picture.
4.1 Qualitative analysis
On a construction site, the resources can be of five (5) types; 1) workers 2) materials, 3) tools, 4) machinery, and 5) reverse cycles. So, one of the first objectives of this research is to know how these five (5) resources types are used during daily operations on a construction site.
During the processing and analyses of these takeoffs, the positioning of the resources was linked, if possible, to the task that uses these resources. However, once present on the site, it proved difficult to follow the progress of some of them, specifically the materials used by the work teams, which also occupy space when they carry out work. So, it was noted that it was necessary to classify all the items occupying space on a construction site according to their uses. These “space-occupying” items have therefore been named Occupation Type (OT). Then, the Occupation Type Breakdown Structure (OTBS) was developed to act as a framework to organize all the information and the property of the OT.
From there, it was possible to determine and manage every property that has an influence on the space occupied by an OT. The tree (3) main property that were identify are the owner, the resources type and their inclusivity, which indicates the effect that each of them has on the sector in which they are positioned and is discussed in Section 7.1.
4.2 Quantitative analysis
The next step was to determine and calculate the quantitative portion, i.e., the space occupied by each type of occupancy. Since the many OT contain one or more types of resources, this means that the dimensions of many OTs can be determined directly from their resources.
However, it is different for the work teams, their dimensions cannot obtain and calculated directly, and given the highly mobile nature of the operations, their occupations cannot be determined solely by the size of their resources. Their occupation depends more on the physical size of the sector where the work is done than anything else. So, to determine this, two parameters are needed: i) the internal location and ii) internal displacement. The internal location refers to “where” in a sector the work is done, basically, on the floor, on the walls or on the ceiling. Then the internal displacement specifies the movement the work team will do inside the sector. Will they work on an entire surface (installation of the gypsum board), in a linear way (plumbing and HVAC) or punctual (electrical fixture). The methodology based on those two (2) parameters, presented in Morin and Adel, (2018), and applied in sections 7.1.3, was developed, thus linking the physical propertied of a sector to the work teams, allowing the calculation of the space required by each work team.
5 Parameters for the occupation rate (OR) calculation: definition and parameters
This section defines the required parameters for the calculation of the OR. We examined and studied each takeoff to identify parameters associated with sectors, occupancy types, and operations. Subsequently, we constructed the information breakdown structure (IBS) based on these findings, which serves as a consistent framework throughout this research.
Some data, such as the total length of walls and the maximum available area, can be obtained directly from the plans. Others are static such as sectors. And some others are dynamic, such as accessibilities, and circulations. But all those parameters must be determined by the manager based on the planning.
Four (4) possible accessibility options for a sector were identified: i) open, ii) restricted access, iii) temporary closure and iv) not accessible (Figure 2) Each of them will impact the design and modeling of the artifact differently.
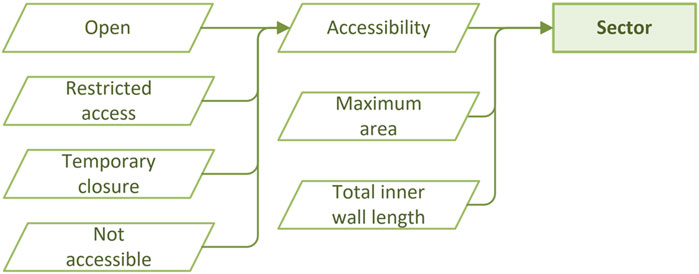
Figure 2. Sector types and parameters.
An “open” sector is the least restrictive accessibility parameter. That means that the sector can be assigned to anyone without additional accessibility constraints, using standard security equipment required to access the whole construction site. In this situation, the entire area and length of the walls are available for the calculation of the OR.
“Restricted access” imposes additional safety constraints on the sector. A good example is areas requiring a safety harness due to the risk of falling or closed areas where a gas sensor must be worn to gain access. In this situation, the entire surface area and length of the walls are available for the calculation of the OR but under certain specific conditions.
A “temporary closure” involves making the area temporarily inaccessible. For example, work could be done in a corridor, blocking the entrance to some sectors, or on the floor, making it is necessary to wait for a certain period before anyone can walk on the floor again. In this situation, although no work crew is present, the area will be fully occupied (OR = 100%) and included in the OR calculations.
Finally, the setting of “not accessible” is used in situations in which a sector is inaccessible. An example would be a large opening in the floor where extensive preparatory work, such as scaffolding, will be required to make the sector accessible. Inaccessible areas are therefore not included in the occupancy calculations.
5.1 Occupation type (OT)
When calculating the occupancy rate, we identify and classify the OTs using the type of construction operations that will occupy the space. This distinction is made because it is necessary to categorize and reserve the required space based on how the task will progress inside the sector or, in the case of material, the occupation of the space. For this purpose, the OT breakdown structure (OTBS) is proposed (Figure 3). The OTBS comprises four (4) categories: 1) general occupation, 2) storage, 3) operations, and 4) permanent occupation.
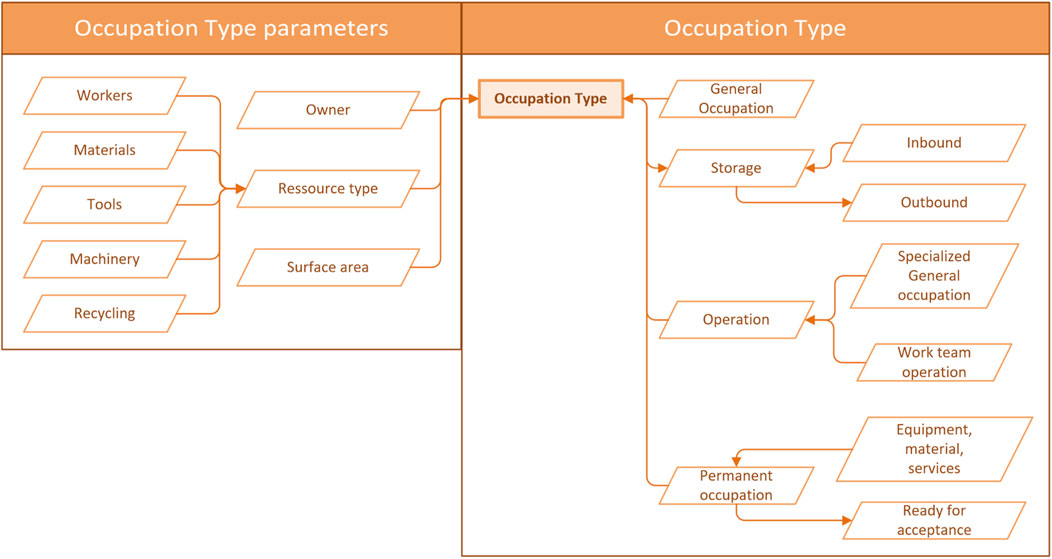
Figure 3. Occupation types and parameters.
5.1.1 General occupation
The first OT category concerns the items and resources required for the management and general operation of the construction site that cannot be assigned directly to a single operation. The general contractor’s site trailer, temporary stairs, lifting and handling equipment, and reception areas are good examples of general occupation.
5.1.2 Storage
In the construction of buildings, tools, machinery, materials, waste, and/or reused and recycled materials must be stored on the job site before they are used (inbound) or taken off the job site (outbound). Therefore, any resources awaiting use or permanent installation are placed in interim storage.
5.1.3 Operations
The management team’s primary task is the coordination of the construction operations, usually subcontracted for a building project. The quality of this coordination will directly affect the project quality, deadlines, and costs. In the planning of the work, any lack of space to perform operations will impact the progress of the work and the overall schedule. Therefore, the operations, which include work crews, tools, machinery, and materials, are characterized by the three (3) parameters, shown in Figure 4. The first is the Work Breakdown Structure (WBS), which identifies each of the tasks to be executed. The next two (2) parameters, internal displacement, and internal location, will be used to determine the space that has to be reserved in each sector where the operations are performed, as identified by the WBS. The combination of these two (2) parameters results in nine (9) internal OTs that can be reserved for each operation (Morin and Adel, 2018).
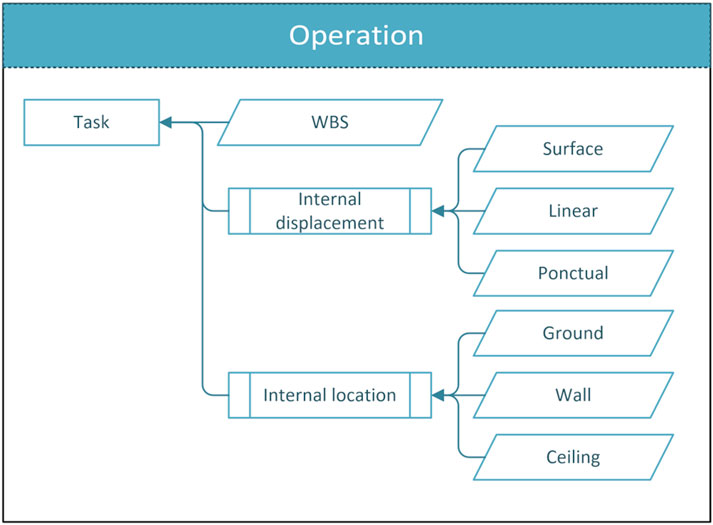
Figure 4. Parameters of the operations.
5.1.4 Permanent occupation
As the operations progress, the installation of the various components in their final location will result in a permanent decrease in the available space on the site. This is referred to as permanent occupation. There are two (2) situations that can cause this decrease in available space: i) installation of equipment, materials, and services and ii) partial acceptance of the building sectors. In the context of the installation of equipment, materials, and services, even if work in the concerned area is not complete, the space occupies by this OT will no longer be available for the remainder of the construction phase. A link to the product breakdown structure (PBS) and the service breakdown structure (SBS) can help construction managers determine which OT will be using this space. Since construction is not complete, those areas are still included in the OR calculation.
As the construction of the building progresses, mainly toward the end of the construction period, the work will eventually be completed in certain sectors. It is important to mark these sectors as no longer accessible, primarily to avoid damage to the finished sectors. These areas will be indicated as ready for acceptance. This OT occupies all the available space in the areas for the remainder of the construction period. Therefore, when this type of occupancy occurs, the sectors are no longer included in the calculation of the OR.
5.2 Occupation type parameters
Following the identification of the OTs, each of them must be characterized by the parameters shown in Figure 3. Therefore, for each OT, it will be necessary to indicate the owner and the type of resources. The surface area will be calculated using the two (2) methods described in the next section.
6 Modeling of static artifacts and calculation to graphically represent the types of occupancy and operation
The first step in calculating OR is to determine the occupied space in each floor or zone. Two (2) methods for calculating the OR for an OT are proposed. The detailed method offers the ability to calculate a more accurate occupancy rate. For this, artifacts were specifically designed to visualize, interpret, and analyze the information and parameters that all the resources will use on the site and, most importantly, the space they will occupy. However, it requires a great analytic effort from the manager. To counter this problem, a simplified and more practical method is proposed, which relies partly on the manager’s experience.
6.1 Simplified method
With the simplified method, rather than conducting a detailed analysis based on artifacts, the project manager directly determines the space the OT occupies. The calculation of the occupation of each sector by OT is based on the inclusivity parameter identified in Figure 5. The purpose of this parameter is to indicate whether other OTs may be present in the same area at the same time. Therefore, in the simple method, the area an OT occupies will depend directly on its inclusivity parameter.
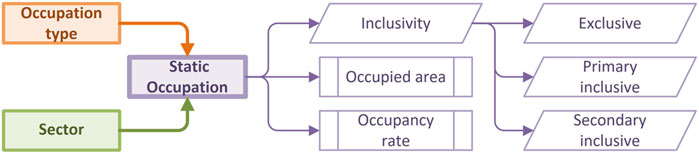
Figure 5. Properties of static occupations.
When an OT is exclusive, no other OT can be present in the area at the same time, so it will occupy all the available space (%ot = 100%). In the case of a primary inclusive OT, the OT has priority in the area, and it will be assigned the most of the available space. Finally, when an OT is secondary inclusive, it is not a priority in the sector and will be assigned less space. The primary and secondary inclusive values are determined by the project manager when planning the project, with the primary inclusive taking most of the available space and the secondary inclusive taking the rest. For example, a project manager could specify for a primary inclusive OT an OR representing two-thirds of the available space in a sector (%ot = 67%). The secondary inclusive OT will then occupy a third of the available space in a sector (%ot = 33%). So, a sector with one primary and one secondary inclusive OT would be fully occupied, and a sector with two (2) primary inclusive OTs would be over-encumbered, with a total OR of 134%.
6.2 Detailed method
Generally, in construction, overlapping works are not allowed. Thus, the space occupied by any work on a site can be measured in occupied floor area, i.e., in m2. So, in the detailed version, the area an OT occupies will be calculated in m2 using a more detailed analysis of the OT. Specific artifacts and matching equations were developed to represent some of the situations that could arose. It should be noted that the main purpose of this paper is the presentation of the artifacts. Because once the artifact has been determined for a task, the manager will then have to design the equations that will calculate the OT for that artifact. Figure 6 shows how the available and occupied space will be represented on the following artifacts.
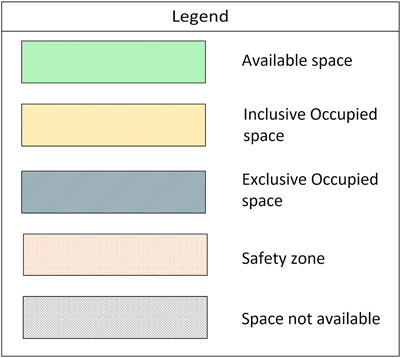
Figure 6. Legend for the artifacts.
6.3 Exterior work, excavation, and superstructure
Excavation and superstructure works are among the first important works of the project, and they alone occupy a large part of the available area on the construction site. Usually, the space occupied for this work is larger than the footprint of the building alone, to which must be added the safety zone because of the great risk these types of work generally cause. Therefore, in the artifact shown in Figure 7, the area the OT occupies can be determined by adding the extra length (Lot) and width (Wot) of the safety zone (Wsec = safety width and Lsec = safety length) to the dimensions of the future building to be constructed (Wb = width and Lb = length). Equation 1 allows us to calculate the area that the excavation and the superstructure teams will occupy.
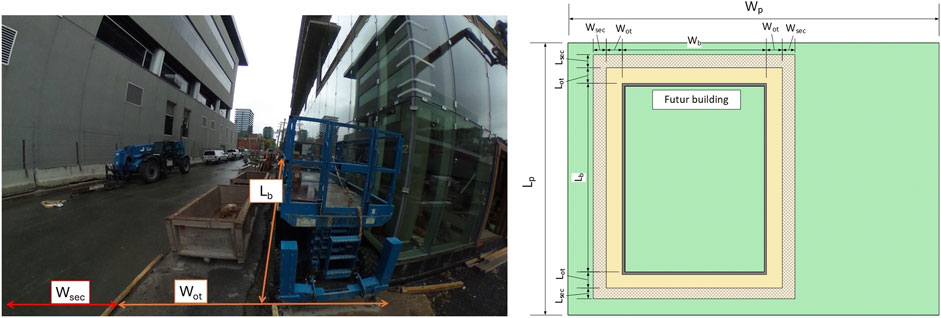
Figure 7. Left: Picture of work on building façade, right: Corresponding artifact for exterior work, excavation, superstructure and building façade.
Equation 1. Area for excavation and superstructure.
6.4 Exterior work, building facade
Once the superstructure work is completed, the next step for the exterior work is usually to install the exterior cladding (Figure 7-left). As Figure 7-right shows, the area this OT occupies will start from the exterior facade of the building and extend outward by the required length and width (Lot and Wot). With the surrounding safety zone (Lsec and Wsec) added, equation 2 can be used to calculate the occupied area at the perimeter of the building.
Equation 2. Area for building facade.
6.5 Linear work on the floor or ceiling
For linear work on the floor or ceiling (the artifacts for linear work on the walls are presented in Sections 7.6 and 7.7), such as the installation of ventilation ducts (Figure 8) and plumbing, the objective is to determine the length of the item to be installed (Loti), which will be multiplied by the width required for the work teams (Wot), to which a safety width (Wsec) is added on each side. Equation 3 will allow us to calculate the area this type of occupation will occupy.
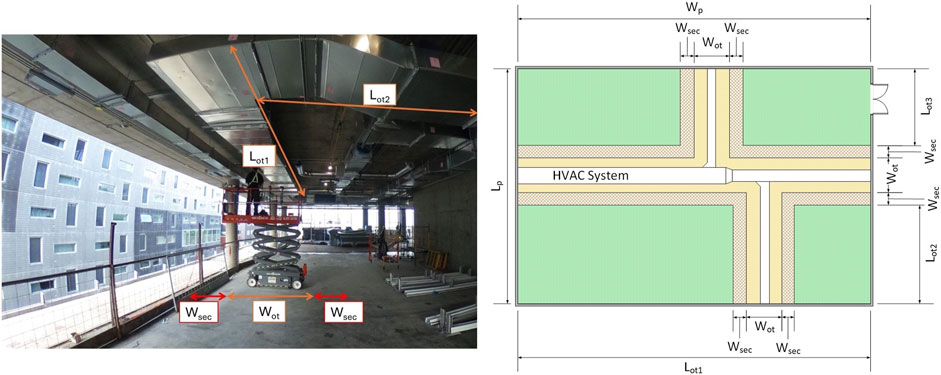
Figure 8. Left: Picture of HVAC work, right: corresponding artifact.
Equation 3. Area for linear works.
6.6 Interior work, maximum area, and perimeter
In some situations, the OT will use all the available floor space in the area, whether it is on the floor, ceiling, or walls. In this case, the area the OT occupies (Figure 9) will be equal to the available floor area (Sm) in the space (equation 4). However, when the OT involves work on the walls (Figure 10), it will be necessary to assign all the walls’ distance (Loot) to the OT (equation 5).
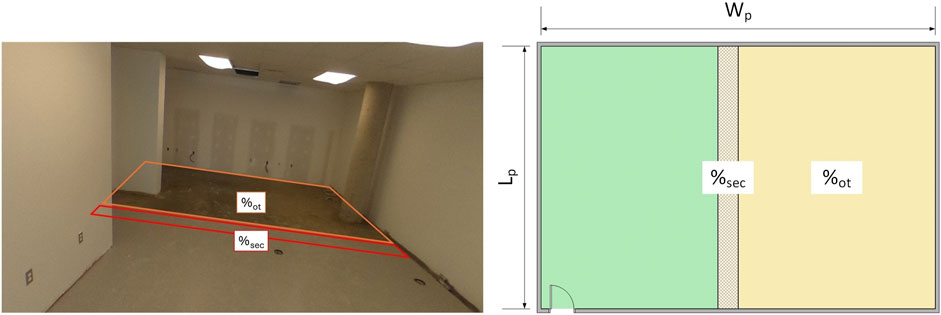
Figure 9. Left: Picture of work on the floor, right: corresponding artifact.
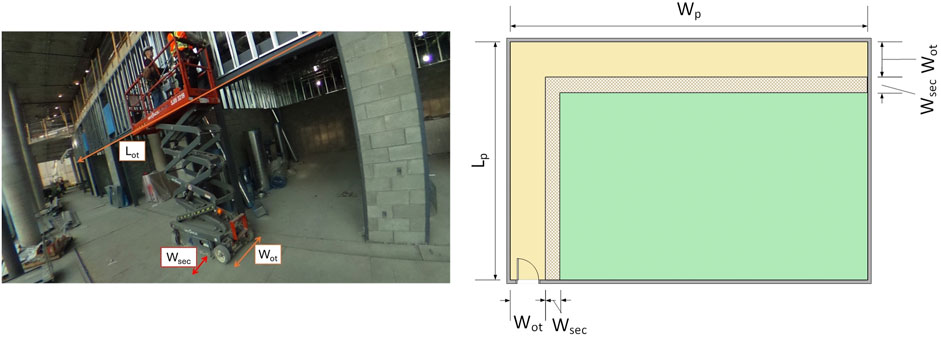
Figure 10. Left: Picture of work on the wall, right: corresponding artifact.
Equation 4. Utilization of the maximum available area
Equation 5. Use of the maximum available wall.
6.7 Interior work, part of the area or perimeter
Although some OT is similar to the artifacts presented in the previous section, it will require only a portion of the floor area, ceiling area (Figure 9), or walls (Figure 10) available in the sector. For the floor and ceiling, it will be necessary to estimate in advance the portion of the area (%ot) that will be required for the occupation type. By adding a safety zone (%sec), equation 6 can be used to calculate the required occupation.
Equation 6. Use of a portion of the available area.
When only a part of the walls is required, it will be necessary to determine which walls the OT will affect. This wall length is then the multiplied by the reserved length for the OT (Loot), plus the safety zone (Losec). Equation 7 therefore can be used to calculate the area an OT occupies on a portion of the available walls in a sector.
Equation 7. Use of a part of the available walls.
6.8 Interior work, use of the dimensions of the occupation type
Finally, the last possibility to determine the OR of an OT is to use the latter’s dimensions (Lot and Wot) directly (Figure 11), to which we add the safety zone (Lsec and Wséc) around it (equation 8).
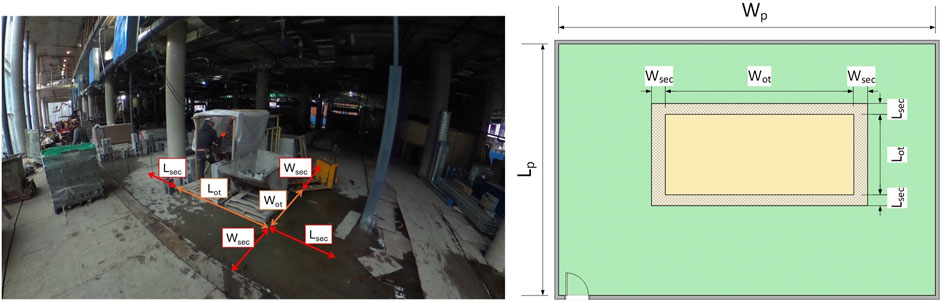
Figure 11. Left: picture of work on the ground with his dimensions, right: corresponding artifact.
Equation 8. Occupancy using the dimensions.
7 Validation of the created artifacts and graphical protocol through workshops
This study was intended to simulate the OTs that may occur during the construction process through artifacts. To validate these artifacts and understand how construction workers and professionals can visualize and interpret the space the work teams and resources occupy, semi-supervised workshops were carried out with the help of an online questionnaire (https://forms.gle/rEagBmgLJUGZDfgm6). Participants were shown pictures of specific operations taken during real construction projects and were asked to evaluate the representativeness of artifacts that could represent the task and/or resources shown in the picture.
A total of 24 participants for this workshop, who came from various domains of the construction industry in Quebec, were interviewed. An online (via Zoom or Team) or live meeting was planned with each participant to help them carry out the workshop.
Before starting the workshop, participants were shown three (3) videos. The first explained the objectives of the research and this workshop. The second explained in detail the legend used for the conception of the artifacts (Figure 6) and how the artifacts worked. Finally, the third video presented an example question. These videos were followed by a question period to confirm that participants had a good understanding of how the workshop worked. Once the workshop was explained, they were left alone to do the workshop. But we were still available in case they had some questions during the workshop.
The participants were shown 20 photos and descriptions of various operations taken from real construction sites, some standard and some more ambiguous. For each of these photos, the participants had to evaluate the representativeness of three (3) proposed artifacts that could represent these operations. Like it was said in section 7.2, the main goal of this paper is the conception of the artefacts. So, it was decided to not include the corresponding equation for the proposed artifacts, so that the participants could focus only on the artifacts while doing the workshop. The representativeness was evaluated with the help of a Likert scale from one (1) to four (4): 1) unrepresentative, 2) rather unrepresentative, 3) rather representative, and 4) representative. Participants could also express appreciation and suggest improvements.
Figure 12 Shows that most of the participants (91%) work or have worked for a general or a specialized contractor and therefore have directly worked on a construction sites, and 9% came from architecture and engineering firms. Of the 24 workshop participants, eleven (11) worked for a general contractor and a specialized contractor. Regarding the educational level, Figure 13 shows that 63% (15) had a bachelor’s or master’s degree, 13% (3) a college degree, and 17% (4) a vocational diploma.
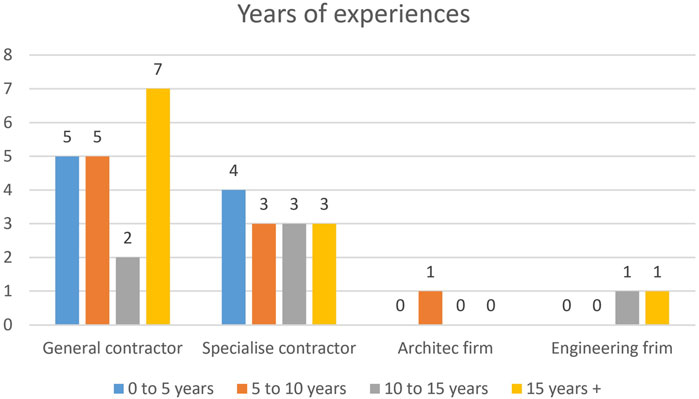
Figure 12. Years of experience of the participants in each domain.
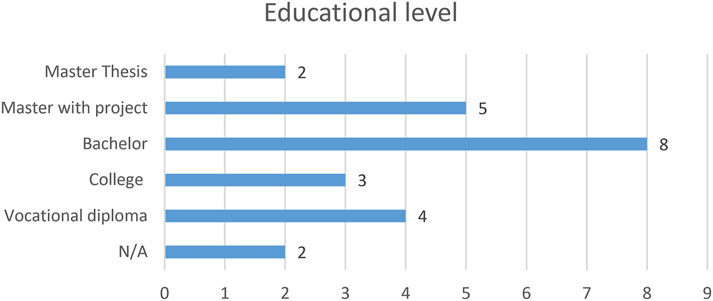
Figure 13. The participants’ educational level.
Figure 14 shows four (4) operation and storage situations. The first one represents The installation of the windows support for the mechanical room on the roof. Three (3) artifacts could be considered: i) assign the outside of entire perimeter of the room (artifact 1), just one wall (artifact 2), and just the window on which they are working on (artifact 3). The participants considered the first artifact the most representative (88% indicated this artifact is “rather representative” or “representative”).
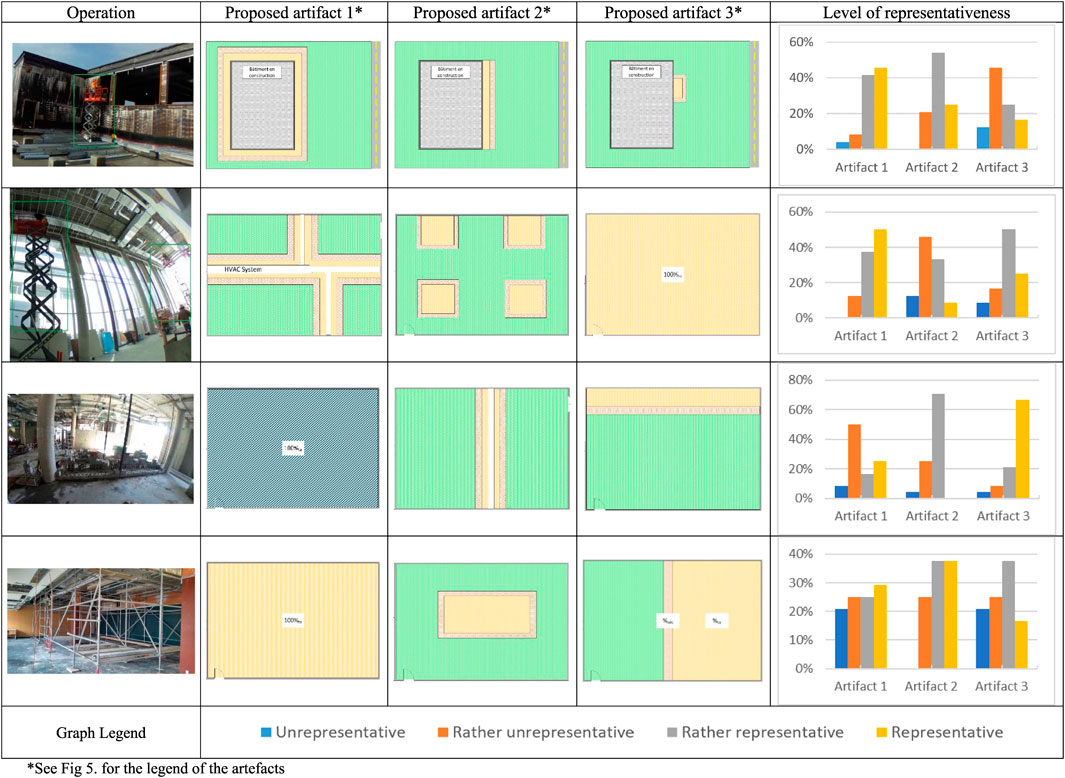
Figure 14. Partial workshop results.
The second situation represented two workers on their own nacelle installing the HVAC ducting system. Because of the risk of falling objects, the three artifacts considered were linear work (artifact 1), separate teams (artifact 2), or fully inclusive (artifact 3). The participants considered the first artifact the most representative (50% representative and 38% rather representative), followed closely by the third artifact (25% representative and 50% rather representative). Data concerning the second artifact is inconclusive, with 59% considering the artifact “rather unrepresentative” or less and 41% “rather representative” or more.
The third situation represents the installation of a cinder block wall. It should be noted that the concrete saw and mixer were not in the same sector as the work team. Because of the concrete work, the considered artifacts were the area fully exclusive (artifact 1), both sides of the wall set as occupied (artifact 2), and considering only one side of the wall occupied (artifact 3). Artifact three (3) was the most representative; 67% of the participants considered it “representative.” 71% of the participants considered the second artifact “rather representative.” Finally, the first artifact is not representative because 58% of the participants said it was “rather representative” or less and 42% “rather representative” or more.
Finally, the fourth example situation represented the presence of scaffolding. Technically, work could be done under and around it. Artifact two is considered the most representative of the three; 76% of the participants considered it “representative” or “rather representative.” The data regarding artifacts one and two were inconclusive, with 46% considering them “rather unrepresentative” or less and 54% “rather representative” or more.
The purpose of this workshop was to validate the main artifacts’ parameters to represent the site occupancy: i) the OT positioning, ii) the inclusiveness, and iii) the legend. This workshop information was taken from a real construction project. For each situation, three (3) artifacts were created using a variation of those parameters. Since this research project is mainly intended for professionals, obtaining their opinions, priorities, and vision was important to validate the artifacts’ parameters.
The schematization of the presented situations allowed the participants to evaluate the importance of the parameters discussed during the workshop. All the artifacts presented in chapter 7 were used in at least one of the 20 presented situations, and each of them was considered the most representative in at least one situation. These validation results confirm that the parameters used for the creation of the artifact are representative of how the space is occupied by the work teams and all the resources that can be present during the construction phase.
However, the suggestions made during this validation allowed us to make some adjustments, especially in the work carried out inside the walls, such as installing plumbing pipes, installing insulation, and installing a curtain wall. Initially for these situations, it was planned to reserve the workspace on both sides of the wall where the work is carried out. However, following the workshop, it turned out to be more representative to reserve workspace only on one side of the wall where the work is done.
8 Conclusion
The proper management of the available and occupied space in a construction site is essential to ensure an effective workflow during a building project’s construction phase. However, construction project managers lack the proper tools to manage this space upstream of the construction phase, possibly leading to a relaxed or an over-encumbered site, increasing the risk of accidents and creating sub-optimal schedules.
Space management therefore contributes to producing more realistic and better-optimized deadlines. It facilitates the identification and calculation of the spaces occupied by all the OTs that will be present during construction at a given time. To do this, this document includes the parameters that will be necessary to characterize the sectors of a given construction stage. Then, two (2) methods for calculating the space occupied by the OT are proposed. A simplified method that draws on the experience of the project manager to prioritize OTs and determine their priorities, and a second, more detailed method. The latter method uses a series of artifacts to accurately calculate the occupancy of each OT. Although it requires more time and calculations, this second method offers better space optimization results.
Note that it is almost impossible to create artifacts for every situation that may arise on a construction site. To remedy this situation, artifacts are created to allow design flexibility. Thus, the manager can use the same concepts to create artifacts adapted to particular situations. The semi-supervised workshops organized, with the construction professionals, helped also to identify the best artifacts to represent certain ambiguous situations.
Despite their advantages, the proposed methods have their limitations. One of the main challenges arises from the additional effort needed to identify all the OTs and determine the space each of them will need. However, since they use information that should already be available to the project managers, it should help mitigate the gap and even facilitate the management of the OT.
Data availability statement
The raw data supporting the conclusion of this article will be made available by the authors, without undue reservation.
Author contributions
SM: Conceptualization, Data curation, Formal Analysis, Methodology, Validation, Visualization, Writing–original draft, Writing–review and editing. AF: Methodology, Supervision, Validation, Writing–original draft, Writing–review and editing.
Funding
The author(s) declare that no financial support was received for the research, authorship, and/or publication of this article.
Conflict of interest
The authors declare that the research was conducted in the absence of any commercial or financial relationships that could be construed as a potential conflict of interest.
Publisher’s note
All claims expressed in this article are solely those of the authors and do not necessarily represent those of their affiliated organizations, or those of the publisher, the editors and the reviewers. Any product that may be evaluated in this article, or claim that may be made by its manufacturer, is not guaranteed or endorsed by the publisher.
Abbreviations
Lb, length of the building; Lp, Length of the sector; Losec, Safety length to be added to the OT; Loot Length of the OT; Sot, Area the OT occupies; Wb, Width of the building under construction; Wot, Width of the OT; Wp, Width of the sector; Wsec, Safety width to be added to the OT; %sec, Security zone occupancy rate; %ot, Occupancy rate of an OT in a sector.
Footnotes
1In this article, a sector is an area on the construction site where work is performed, such as a floor, a room, or part of a room.
References
Akinci, B., and Fischer, M. (2000). “An automated approach for accounting for spaces required by construction activities,” in Construction Congress VI, Orlando, Florida, United States, June, 2000.
Akinci, B., Fischer, M., and Kunz, J. (2002). « automated generation of work spaces required by construction activities. J. Constr. Eng. Manag. 128 (4), 306–315. doi:10.1061/(asce)0733-9364(2002)128:4(306)
Akinci, B., Fischer, M., and Zabelle, T. (2022). “Proactive approach for reducing non-value adding activities due to time-space conflicts,” in Proceedings IGLC ’98.
Ardila, F. A., and Francis, A. (2015a). “Design and validation of the first phase of the new chronographical standard protocol for construction project scheduling,” in 5th International/11thConstruction Specialty Conference, Vancouver, Canada, June, 2015, 1–9.
Ardila, F. A., and Francis, A. (2015b). The chronographic protocol: validation of textures and colors. Int. J. Innovative Technol. Explor. Engireering 5 (7), 8.
Chua, D. K. H., Yeoh, K. W., and Song, Y., (2010). Quantification of spatial temporal congestion in four-dimensional computer-aided design. J. Constr. Eng. Manag. 136 (6), 641–649. doi:10.1061/(ASCE)CO.1943-7862.0000166
Francis, A. (2004). La modélisation chronographique de la planification des projets de construction. Available at: http://espace.etsmtl.ca/692/.
Francis, A. (2013). The chronographical approach for construction project modelling. Proc. Institution Civ. Eng. - Manag. Procure. Law 166 (4), 188–204. doi:10.1680/mpal.12.00009
Francis, A. (2015). “Applying the chronographical approach for modelling to different types of projects,” in Proceedings of the 5th International/11th Construction Specialty Conference, Vancouver, Canada, June, 2015, 1–9.
Francis, A. (2016). “The chronographical modeling for construction project planning,” in Canadian Society for Civil Engineering Annual Conference 2016: Resilient Infrastructure, London, Canada, June, 2016, 231–232.
Francis, A. (2019). Chronographical spatiotemporal scheduling optimization for building projects. Front. Built Environ. 5, 1–14. doi:10.3389/fbuil.2019.00036
Francis, A. (2020). Chronographical site-spatial-temporal modeling of construction operations. Front. Built Environ. 6, 67. doi:10.3389/fbuil.2020.00067
Francis, A., and Edmond, M. (2006). “Toward a new generation of construction management software,” in Joint International Conference on Computing and Decision Making in Civil and Building Engineering, Montréal, Canada TOWARD, June 14-16, 2006, 3559–3567.
Francis, A., and Morin-Pepin, S. (2017). The concept of float calculation based on the site occupation using the chronographical logic. Procedia Eng. 196, 690–697. doi:10.1016/j.proeng.2017.07.235
Frandson, A., and Tommelein, I. D. (2014). “Development of a takt-time plan: a case study,” in Construction Research Congress 2014: Construction in a Global Network - Proceedings of the 2014 Construction Research Congress, Atlanta, Georgia, May, 2014, 1646–1655.
Guo, S.-J. (2002). « identification and resolution of work space conflicts in building construction. J. Constr. Eng. Manag. 128 (4), 287–295. doi:10.1061/(asce)0733-9364(2002)128:4(287)
Hevner, A. R., March, S. T., Park, J., and Ram, S. (2004). Design science in information systems research. MIS Q. Manag. Inf. Syst. 28 (1), 75–105. doi:10.2307/25148625
Kim, K., and Jesús, M. de la G. (2005). « critical path method with multiple calendars. J. Constr. Eng. Manag. 131 (3), 330–342. doi:10.1061/(asce)0733-9364(2005)131:3(330)
Mawdesley, M. J., Al-jibouri, S. H., and Yang, et H. (2002). Genetic algorithms for construction site layout in project planning. J. Constr. Eng. Manag. 128 (5), 418–426. doi:10.1061/(asce)0733-9364(2002)128:5(418)
Mirzaei, A., Nasirzadeh, F., Jalal, M. P., and et, Y. Z. (2018). 4D-BIM dynamic time–space conflict detection and quantification system for building construction projects. J. Constr. Eng. Manag. 144 (7), 04018056. doi:10.1061/(ASCE)CO.1943-7862.0001504
Morin, P. S., and Adel, F., (2019). “Technologies currently available to obtain the occupancy rate of resources on a construction sites,” in 7th CSCE Annual Conference, Laval, QC, June, 2019.
Morin, P. S., and Adel, F. (2018). “Calculation of the construction sites’ occupancy rate using chonographic modeling,” in CSCE General Conference 2018, Held as Part of the Canadian Society for Civil Engineering Annual Conference 2018, Fredericton, Canada, June, 2018, 653–659.
Riley, D. R., and Sanvido, V. E. (1995). Patterns of construction-space use in multistory buildings. J. Constr. Eng. Manag. 121 (4), 464–473. doi:10.1061/(asce)0733-9364(1995)121:4(464)
Sanders, S. R., Randolph Thomas, H., Smith, G. R., and Mannering, F. L., (1989) An analysis of factors affecting labor productivity in masonry construction. State College, PA, United States: Pennsylvania State University.
Van, A., and Joan, E. (2005). Management research as a design science: articulating the research products of mode 2 knowledge production in management. Br. J. Manag. 16 (1), 19–36. doi:10.1111/j.1467-8551.2005.00437.x
Wiest, J. D. (1981). « Precedence diagramming method: some unusual characteristics and their implications for project managers. J. Operations Manag. 1 (3), 121–130. doi:10.1016/0272-6963(81)90015-2
Winch, G. M., and North, S. (2006). Critical space analysis. J. Constr. Eng. Manag. 132 (5), 473–481. doi:10.1061/(asce)0733-9364(2006)132:5(473)
Keywords: construction management, planning, scheduling, space-planning, chronographic modeling, occupied space, occupancy rate
Citation: Morin Pépin S and Francis A (2024) Modeling and categorizing standardized artifacts for scheduling occupancy on building construction sites. Front. Built Environ. 10:1380106. doi: 10.3389/fbuil.2024.1380106
Received: 01 February 2024; Accepted: 02 May 2024;
Published: 30 May 2024.
Edited by:
Zhen Chen, University of Strathclyde, United KingdomCopyright © 2024 Morin Pépin and Francis. This is an open-access article distributed under the terms of the Creative Commons Attribution License (CC BY). The use, distribution or reproduction in other forums is permitted, provided the original author(s) and the copyright owner(s) are credited and that the original publication in this journal is cited, in accordance with accepted academic practice. No use, distribution or reproduction is permitted which does not comply with these terms.
*Correspondence: Stéphane Morin Pépin, c3RlcGhhbmUubW9yaW4tcGVwaW4uMUBlbnMuZXRzbXRsLmNh