 Ashrafullah Shafi Mohammad1
 Alfrendo Satyanaga1*Zheniskan Abilev1Nura Bello1Kozyukova Nadezhda2Qian Zhai3
 Sung-Woo Moon1Jong Kim1
- 1Department of Civil and Environmental Engineering, Nazarbayev University, Astana, Kazakhstan
- 2Department of Civil Engineering and Building Materials, Institute of Architecture and Civil Engineering Named After T.K. Bassenov, Satbayev University, Almaty, Kazakhstan
- 3Key Laboratory of Concrete and Prestressed Concrete Structures of Ministry of Education, School of Civil Engineering, Southeast University, Nanjing, China
The persistent trend of rising temperatures and shifting weather patterns caused by climate change has prompted significant concern around the world. This research aims to evaluate the instability of slopes in Almaty, Kazakhstan, under various rainfall patterns, groundwater tables, and slope geometries by incorporating the principles of unsaturated soil mechanics. However, there have been a limited number of studies incorporating the principle of unsaturated soil mechanics with constant rainfall patterns in Central Asia, particularly in Kazakhstan, on the impact of rainfall-causing landslides. Hence, in this research, GeoStudio software (SEEP/W and SLOPE/W) was used to simulate the factor of safety (FoS) and pore water pressure for the investigated slopes under different rainfall patterns. Results from Hyprop and statistical method show that the saturated volumetric water content is 0.502, whereas the residual one is 0.147 and for the permeability function the conductivity coefficient started to sharply decrease at the suction value of 2 kPa when the air-entry value was 24 kPa. Findings from numerical analysis show the change in FoS for the slope of 10 m height and 27-degree slope angle was 6%, 7%, 7%, and 8% for cyclic, delayed, advanced, and normal distributions, respectively. For the slope with 20 m height and the same 27-degree angle, the change in FoS was 8%, 10%, 8%, and 11% for the cyclic, delayed, advanced, and normal distributions, respectively. These same patterns were shown in slopes with 35-degree and 45-degree angles, having the same 10 m and 20 m heights. Comparatively, this shows that slopes under cyclic rainfall patterns (240 mm of rain within 12 days) are less prone to failure compared to slopes under continuous, delayed, or regularly distributed rainfall patterns. Moreover, an increase in slope height and angle also affect the FoS negatively. It should be noted that the results obtained are only applicable to clayey-loam soil.
1 Introduction
The trend of worldwide temperatures and shifting weather patterns has been a source of serious concern for the last few decades. (Gofar et al. (2022) defined climate change as temperature and weather pattern shifts that persist over time. However, due to the population of the world and human activities such as construction industries, production companies, and the general use of fossil fuels, temperatures have been steadily rising. Therefore, weather conditions are the primary consequence of rising temperatures (Rahardjo et al., 2019a). For example, the rising of high temperatures can cause the melting of ice sheets, and as a result, it can increase the level of seawater and rainfall patterns (Kaddo, 2016; Rahardjo et al., 2007).
This paper aims to study the instability of slopes in Kazakhstan against several rainfall patterns, groundwater tables, and slope geometry. Jiang et al. (2020) reported a slight increase in the annual intensity of rainfall in the Central Asia region from 1920 to 2010. However, results from numerical analysis show that precipitation attempts to increase quickly from 2010 to 2,100. It demonstrates that it can cause floods, droughts, and landslides around the country (Chepelianskaia and Sarkar-Swaisgood, 2022). The southeastern regions of Kazakhstan are more vulnerable to landslide events due to prolonged precipitation intensity, mountain regions, and soil movement on slopes (Chepelianskaia and Sarkar-Swaisgood, 2022). Furthermore, Almaty is one of the main cities in Kazakhstan that has had many occurrences of landslides in the past few decades (Thurman, 2011). Previous studies on climate change and rainfall intensity and duration from the Ministry of Energy in Kazakhstan (Sharipov et al., 2023) provide statistical data in connection with the climate situation in Kazakhstan. However, some notable trends can be detected, such as that the northern regions are experiencing a rise in temperature at a faster rate than the southern regions and that a clear increase in precipitation can be observed in the northern regions, while such effects occurs in the rest of the country would be only partially true.
Additionally, fine-grained or clayey loam slopes are very common in the central Asian region (southeastern part of Kazakhstan). Moreover, clayey loam unsaturated soil has very small particles (0.02 mm), high permeability (1.5 × 10⁻⁶ m/s), and a large rainfall infiltration rate compared to coarse-grained soil. Therefore, rainfall-induced landslides are mainly controlled by permeability and rainwater infiltration. The influence of rainfall patterns on infiltration into soil infrastructure has been studied by Ng and Shi. (1998a), Ng and Shi (1998a), and Wang et al. (2023a). Effects of rainfall on slope infrastructures, especially slopes, have received attention in the past 30 years Ng C and Shi. (1998b) and Ng and Shi (1998a). Recently, an experimental investigation on the effects of rainfall temporal patterns (Wang et al. 2023a) has demonstrated that rainfall patterns and roots play a critical role in affecting the hydrological response of unsaturated soils. Secondly, a study by Hu et al. (2014) illustrated that the ecological environment in the Central Asian region is very susceptible to climate change, which can result in soil erosion and landslides. However, there has been no research on different rainfall infiltration into clayey loam soil slopes in central Asia. Therefore, this study aims to examine how rainfall distribution affects the stability of slopes by using the principles of unsaturated soil mechanics. However, in this study, the soil-water characteristic curves (SWCCs), permeability functions, groundwater tables, and high rainfall circumstances were obtained from laboratory tests and metrological sources, and consequently, all were taken into account in numerical simulations using GeoStudio software.
2 Literature review
Generally, the water table is the boundary between the saturated soil zone and the unsaturated soil zone (Rahardjo et al., 2014). The first zone is at or above ground level, while the second zone is at or below ground level. According to Fredlund et al. (2012), it is often situated at great depth. It seems logical that rain water, being heavier than air, will sink into unsaturated soil. Therefore, it’s essential for geotechnical engineering design to know how unsaturated soils behave mechanically. Because of the intensity and duration of rainfall, there has been a lot of study on the mechanics of unsaturated soil (Mercer et al., 2019). Unsaturated soil is a four-phase soil consisting of solids, water, air, and contractile layer, the interface and shear strength in four-phase soil is enhanced by the presence of a negative pore-water pressure zone above the groundwater table as indicated by Zhai et al. (2019) and Satyanaga and Rahardjo, (2020). When precipitation soaks into the ground, the soil’s water content rises, causing its shear strength to drop from higher to lower and the soil to lose its resistance. For seepage analysis, the SWCC and permeability function indicate the unsaturated soil’s hydraulic properties, whereas shear strength and other mechanical parameters are required for seep/w analysis (Rahardjo et al., 2019b).
In the southeastern part of Kazakhstan, structures and houses are often destroyed when landslides occur. A hydrological anomaly, defined as unusually heavy rainfall, is considered to be a contributing factor (Thurman, 2011; Ip et al., 2021). Furthermore, Thurman also pointed out that Almaty is prone to rainfall-induced landslides.
According to several studies, climate change has also occurred in Kazakhstan during the last century. According to a study by Kattsov et al. (2021), the average temperature in Kazakhstan has been steadily rising by about 0.09°С per decade. Notably, the temperature rise was more repeated in the spring and winter months at about 0.2–0.23°С per decade. Moreover, the authors note the increased drought or decrease in precipitation over the main part of the country. Another study made specifically in Almaty came to the same conclusion regarding air temperature (Duskayev et al., 2018). However, they have concluded that the precipitation, on the other hand, has increased in contrast to the results from Kattsov et al. (2021), who documented an overall decrease in average precipitation in Kazakhstan. Hence, the impact of climate change will vary depending on the region.
Bardin et al. (2015) from the Russian Hydro Meteorological Center have collected hydro meteorological data, including precipitation and temperature, from 455 weather stations across countries of the CIS and Baltic region. The acquired data contains information dating back to 1976. The data was used to gain information about the changes in precipitation and average temperature that have already taken place in different regions of Kazakhstan. The data indicate that Kazakhstan has experienced significant warming during the last 3 decades (Bardin et al., 2015). Meanwhile, precipitation changes vary by region and season. The fall precipitation has decreased substantially, while winter, spring, and summer precipitation have increased, effectively resulting in an increase in overall precipitation in the eastern half of the country and a decrease in Kyzylorda, Aktobe, and Mangystau regions (Bardin et al., 2015).
According to Trenberth (2011), there is a direct relationship between the average global atmospheric temperature and the precipitation patterns around the world. This is due to the increased moisture-carrying capacity of air as the temperature of the air rises. More specifically, an increase in air temperature by 1°С will also increase the moisture-holding capacity of air by 7% (Trenberth, 2011). By analyzing numerous existing models has put together a multi-model mean, or an average of those prediction models (Trenberth, 2011). Moreover, the regions where the sign of the precipitation change is consistent throughout most of the investigated models were indicated with dots. Orlovsky et al. (2019) have performed a prediction model for precipitation for two climate change scenarios: RCP4.5 (referred to as the “mild” scenario in the paper) and RCP8.5 (referred to as the “least favorable” scenario). Due to the shortcomings of precipitation models, considerable uncertainties exist in the predictions presented. For instance, the average annual precipitation might rise by around 30% or drop by approximately 10%. Remarkably, in the RCP8.5 scenarios, i.e., the continuous increase of atmospheric CO2 concentrations throughout the century, the rise in precipitation is lower than that in RCP4.5.
3 Research methodology
This research contains different rainfall and climate change data from the Ministry of Energy of the Republic of Kazakhstan (2018) and laboratory experiments to characterize the saturated and unsaturated properties of a sand-kaolin mixture as representing a clayey silt soil. Secondly, finite element seepage and slope stability analyses were calculated for the investigated slopes. Additionally, soil properties obtained from experimental work were inserted into numerical analyses. The results are used to present factor of safety FoS variation along with pore-water pressure (PWP) profiles of different geometries under typical rainfall patterns.
3.1 Data collection
Precipitation variations are less consistent and have occurred differently in all regions of Kazakhstan due to large territory and geographical conditions. There have been minor seasonal increases in precipitation in certain parts of Kazakhstan, overall decreases in others the seasonal breakdown of the precipitation changes in each region is illustrated in Table 1. It shows that the winter precipitation has increased by 2.34%. Only two regions, Kyzylorda and Atyrau, have decreased winter precipitation. At the same time, the precipitation during the rest of the year has decreased, with summer exhibiting the biggest drop of around 1% (Table 1). The changes during spring can be collected into geographical regions: South Kazakhstan has a relatively significant drop in precipitation, and North and East Kazakhstan see an increase The summer precipitation has dropped in many regions of the country since the 1940s, except Turkistan, Almaty, Pavlodar, and Akmola (with practically no change). Ministry of Energy of the Republic of Kazakhstan (2018).
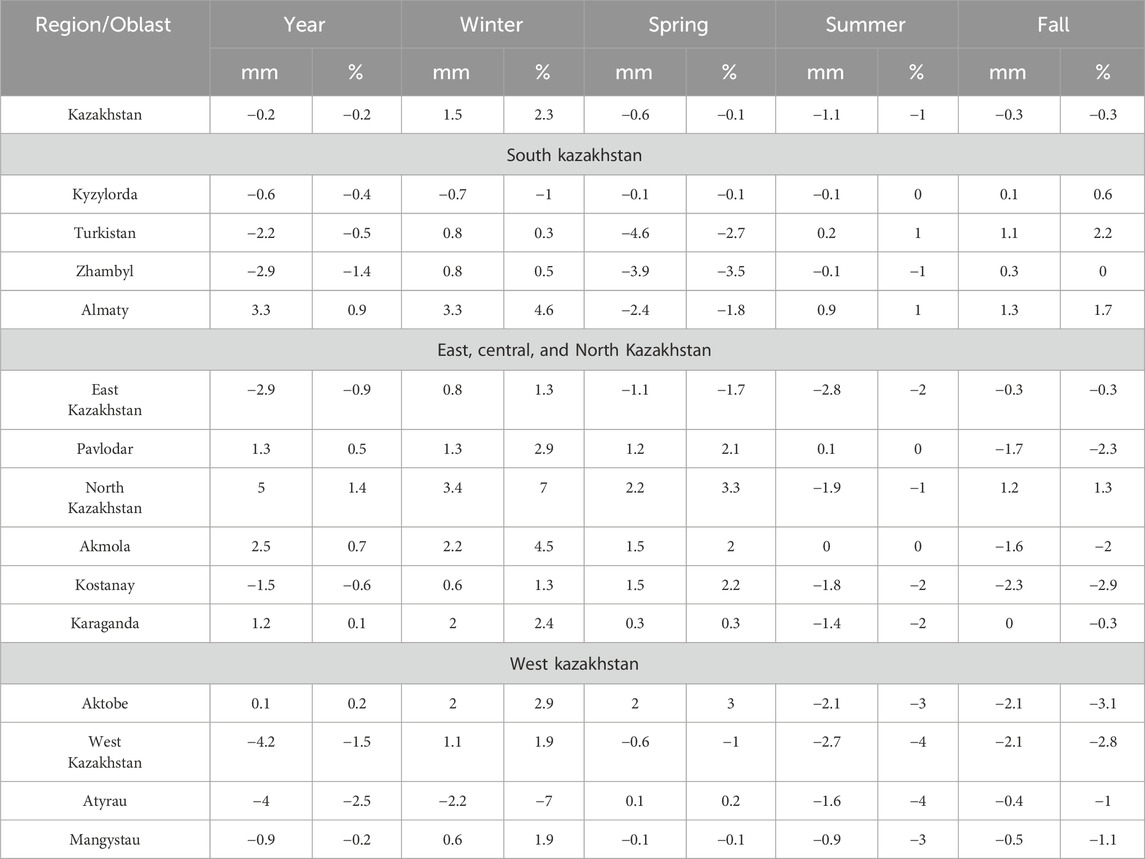
Table 1. Changes in annual and seasonal precipitation in administrative regions of kazakhstan (Ministry of Energy of the Republic of Kazakhstan, 2018).
Four research papers were considered for the prediction of changes in precipitation: Ministry of Energy of the Republic of Kazakhstan (2018), (Jiang et al., 2020; Orlovsky et al., 2019; Trenberth, 2011). Despite the general trend observed around the globe, described by Trenberth as “rich get richer and the poor get poorer,” i.e., the regions with high average precipitation rates will observe a rise and those with low rates will observe a drop in precipitation, precipitation rates in Kazakhstan are largely predicted to grow (Trenberth, 2011). However, the expected changes in precipitation are less definitive due to substantial variations in the predictions in both the positive and negative directions of the change, even reaching an uncertainty of 21.69% (see Table 2). The increase is expected to be most noticeable during the winter and spring. On the contrary, summer months may experience a decrease depending on the severity of climate change, with the “mild” RCP4.5 case projecting a 7.99% increase by the end of the century and the more “severe” RCP8.5 case projecting a 2.07% drop. Nevertheless, the overall trend, according to the prediction models of Orlovsky et al. (2019) is still positive. By 2080–2099, the mean precipitation in Kazakhstan may increase by 11.77–13.21 mm compared to the baseline period 1986–2005 (Orlovsky et al., 2019).
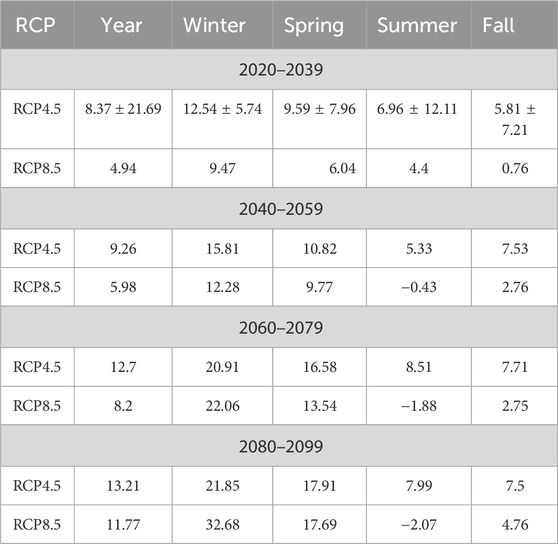
Table 2. Predicted changes in annual and seasonal mean precipitation (in mm) in 2020–2039, 2040–2059, 2060–2079, and 2080–2099 with RCP4.5 and RCP8.5 scenarios compared to the baseline period of 1986–2005 (Orlovsky et al., 2019).
The results of Orlovsky et al. (2019) also match those of the UNFCC report of the Ministry of Energy of the Republic of Kazakhstan (2018). According to their models, with RCP4.5 cases by 2080–2099, annual precipitation in all regions of Kazakhstan will increase, with the outermost parts of the Atyrau and West Kazakhstan regions or almost the entirety of the Mangystau region having a smaller than average increase (the average being the rise of around 10–20 mm). The RCP8.5 case produces a bit more diverse predictions, with the lower half of the Mangystau region showing negative signs of precipitation change (up to −10 mm), the southern regions having a moderate increase of up to 10 mm, and the rest of the country seeing an increase in annual precipitation of 10–20 mm by 2080–2099.
The results of the models presented in the UNFCC report (Ministry of Energy of the Republic of Kazakhstan (2018) are further confirmed by Jiang et al. (2020). They have conducted numerous prediction models for the SSP2-4.5 scenario (which corresponds to RCP-4.5) and calculated the mean result of the prediction models. Similar to the findings reported in the UNFCC report (Ministry of Energy of the Republic of Kazakhstan, 2018), the precipitation rises in Mangystau, Atyrau, West Kazakhstan, and Aktobe regions are expected to be lower than the average in Kazakhstan. Also confirming the existing trend, the northern regions of Kazakhstan will be higher than the average in Kazakhstan.
There are several types of rainfall patterns. The common pattern is continuous precipitation throughout the period of rainfall (Chepelianskaia and Sarkar-Swaisgood, 2022). Also, the authors mentioned a cyclic rainfall pattern, which is when the subsequent day is without any precipitation. Then the cycle is repeated for the whole period of rainfall. The graphical representation is presented in Figure 1. Rahimi et al. (2011) propose another three typical rainfall patterns, which are observed in different locations in the world (See Figure 2).
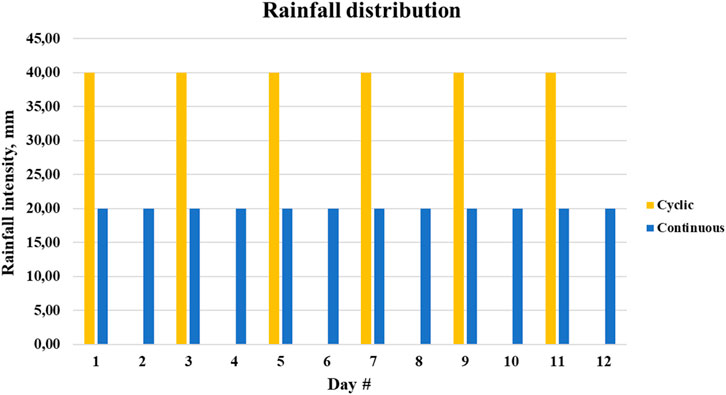
Figure 1. Continuous and cyclic rainfall distributions.
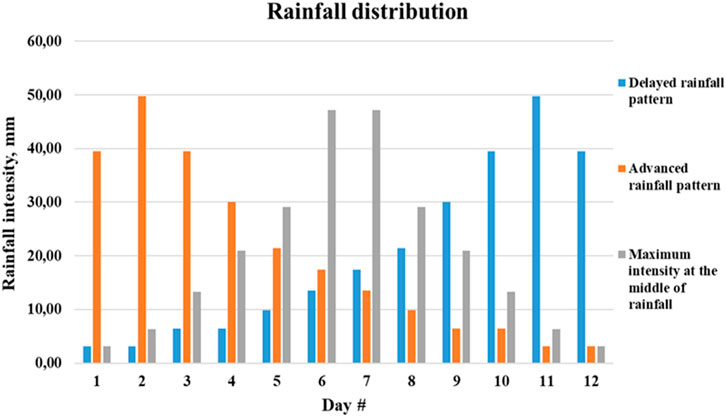
Figure 2. Delayed and advance rainfall patterns.
A delayed rainfall pattern (Figure 2) means that rainfall starts at low intensity and has a gradual rise to the end of the rainfall period. On the other hand, advanced rainfall intensity shows a vice versa distribution to the delayed rainfall. The third type of rainfall also starts at low intensity but increases only towards the middle of the rainfall period. After that, the intensity gradually decreases until the end of the precipitation period.
3.2 Experimental work
This research contains laboratory experiments to characterize the saturated and unsaturated properties of a sand-kaolin mixture as representative of clayey loam. The results from laboratory tests were used in numerical analyses; the procedure and determination of soil physical and hydrological properties are based on the ASTM standard ASTM D6836-92, ASTM, D4318-10, ASTM D7928-21e1 and ASTM D6913-04 shown in Table 3.
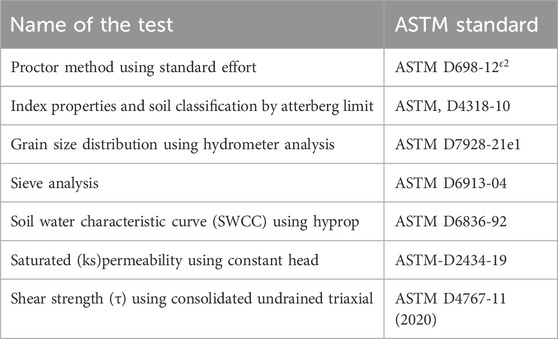
Table 3. Laboratory tests based on ASTM standard.
There are several ways to measure SWCC, including the Tempe Cell, Pressure Plate, and HYPROP equipment. Among these techniques, the HYPROP equipment is more accurate and, importantly, a faster approach for obtaining SWCC. This method is an evaporation-based approach developed by Wind (1968). After that, Schindler (1980) simplified the model (METER Group AG, 2018; Satyanaga and Rahardjo, 2019). The environmental temperature affects the SWCC measurement, especially the simplified evaporation method since evaporation might cool the soil. Hence (Wang et al., 2023b) conducted SWCC tests with several temperatures (25, 45, and 60°C) using a simplified evaporation method, and it was discovered that rising temperatures decreased the amount of water that could be retained because of root shrinking, fluid-phase expansion due to heat, and a decrease in capillary and adsorption forces.
The correlation between volumetric water content and negative water pressure in the soil is defined by the specific soil-water characteristic curve (SWCC). The Hyprop method is used for soil hydraulic properties, especially for soil water characteristic curve SWCC and unsaturated permeability (Satyanaga et al., 2023). The test can be done within a few steps, such as (a) Preparation of the soil specimen; (b) Saturation of the Hyprop equipment (Hyprop device, tension-meters); (c) Hyprop device setup and installation of Hyprop device tension-meters; (d) Evaporation process and data logging through Hyprop view software; (e) collection of the data; (f) Plotting of the laboratory data using best fitting equations. In this work, SWCC was measured operating with HYPROP equipment at room temperature of 23°C–25°C with an evaporation rate of 14 mm/d. The HYPROP test results were best fitted with the Satyanaga et al. (2017) unimodal fitting equation to get the complete relationship between volumetric water content and soil suction.
3.3 Numerical analysis
GeoStudio software 2012 version 8.14.3.13430 was used for the seepage and slope stability analysis to determine pore-water pressure variations with soil depth across a range of slope angles and elevations. The Almaty region’s clayey loam soil was selected for the preliminary testing phase, and the result was key to the numerical models for simulating pore water pressure and factor of safety with slopes of 27, 35, and 45° and with slope heights of 10, and 20 m. An example of the model for the slope with those values is shown in Figure 3.
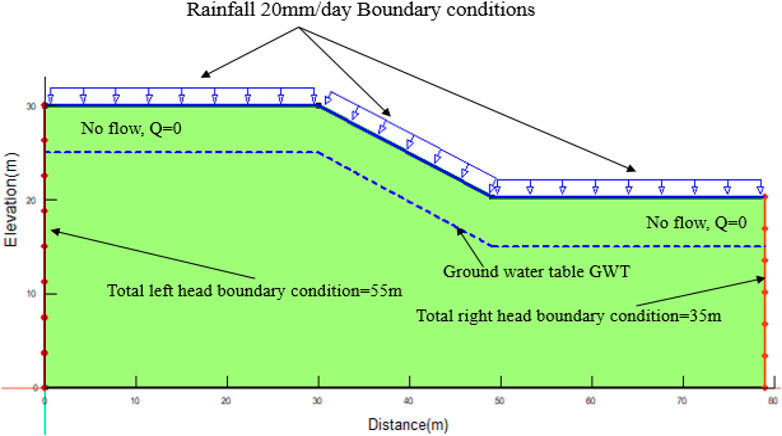
Figure 3. Numerical model for seepage analyses or seep/w with a slope height of 20 m and slope degree of 27-degree.
The groundwater table was used to establish the initial pore-water pressure and head parameters for the chosen transient SEEP/W analysis. In Almaty, Kazakhstan, the depth of the water table ranges from a minimum of 10 m to a maximum of 3 m. The investigated clayey soil is obtained from the study of Khomyakov et al. (2013). In accordance to the study Satyanaga et al. (2017) the clayey loam parameters were obtained to determine the investigated soil hydraulic properties, namely, permeability function and SWCC. Additionally, permeability function and SWCC parameters were used in numerical simulations.
To increase the convergence rate in the Seep/w iterative calculation, the beginning rate was decreased from 1 to 0.65 (Satyanaga et al., 2022a). Given the possibility of nonlinearity in materials, an under-relaxation technique is required to enhance convergence. The under-relaxation requirements are ignored when the starting rate is set to 1. Multiplying by this rate-reduction factor of 0.65 brings down the under-relaxation rate. This rate helps to reduce the nonlinearity of materials and improve the subsequent iteration.
The model includes boundary conditions such as total, elevation, and pressure head at the head site on the left and right sides of the slope. According to Chepelianskaia and Sarkar-Swaisgood (2022), the typical amount of rainfall that occurs each day in Kazakhstan is approximately 20 mm. However, four different rainfall patterns were applied to the surface of the constructed model. Meanwhile, all models’ simulation processes had their default mesh size reduced from 4.5 m to 0.25 m. Since the elements of FEM were inverted, the decreased mesh size delivers more precise results.
4 Results
4.1 Results from laboratory tests
The summary of index properties of the 25% sand and 75% kaolin mixture is tabulated in Table 4. In particular, it consists of sand 25%, silt 50%, and clay 25%, and the soil classification is clayey loam according to USCS. Secondly, particle size distribution (PSD) represents the curve of fine- and coarse-grained soils that was obtained from sieve analysis. Exactly 75% of particles pass through sieve #200 (0.075 mm), which means kaolin (fine-grained soil). The other 25% of the particles are sand.

Table 4. Summary of index properties of 25% Sand–75% Kaolin.
According to HYPROP test results, the following curve (Figure 4) is constructed with best-fitted parameters using (Satyanaga et al., 2017) to get the complete relationship between volumetric water content and soil suction. According to HYPROP test results, the following curve (Figure 4) is constructed with best-fitted parameters using the Satyanaga et al. (2017) to get the complete relationship between volumetric water content and soil suction. The finding from Zhan et al. (2014) shows that the soil suction and permeability function depends on dry density and the amount of moisture content.
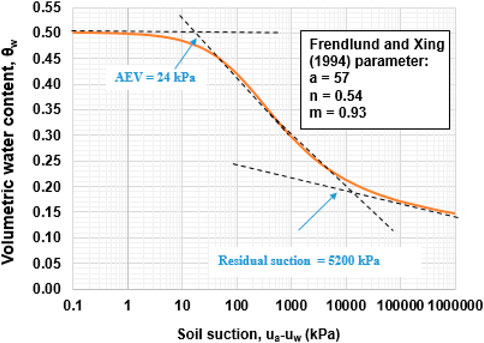
Figure 4. Determination of SWCC variables for Sand (25%)-kaolin (75%) mixture using (Zhai, and Rahardjo, 2012).
A study by Chen et al. (2020) shows that the Degree of compaction (DOC) had a significant impact on Completely Decomposed Granite (CDG) SWCCs and Unsaturated Permeability Function (UPFs) within a suction range of 100 kPa, but became less significant as the suction increased. The DOC mostly affected pores with radii bigger than 0.14 μm, with minimal effect on those with lower radii. Moreover (Ng et al., 2020) found that overall, the two biopolymers did not significantly vary in their capacity to reduce gas permeability. The statistical study found no significant differences between employing the two biopolymers at a particular moisture content and DOC (p > 0.75). Both gellan and xanthan gum prevent gas permeability through the reduction of bigger soil pores as well as pore blockage.
For this study, the soil sample was prepared with a dry density of 1.53 (Mg/m3) and a moisture content of 24.5%. Results from SWCC illustrate that the saturated volumetric content is 0.502, whereas the residual one is 0.147. Also, the best fitting parameters are a = 57, n = 0.54 and m = 0.93. These SWCC parameters were used in the numerical simulations.
For the permeability function, statistical method was used. The sand-kaolin combination specimen’s saturated permeability, ks, was assessed using a statistical model. The coefficient of permeability started to sharply decrease at the suction value of 2 kPa when the air-entry value was 24 kPa. The air-entry value shows the beginning of the suction. Also it can be seen in Figure 5 that the desaturation process starts in the capillary zone at a 2 kPa suction value.
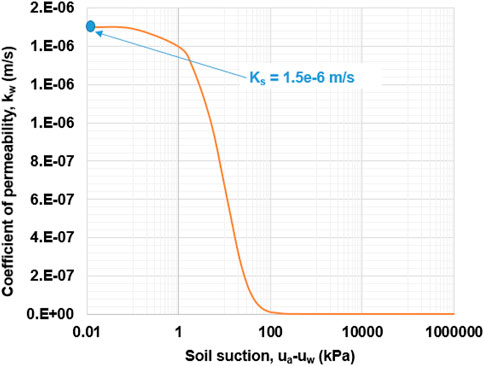
Figure 5. Determination of the permeability function for (25%) sand and (75%) kaolin mixture using (Zhai and Rahardjo, 2015).
4.2 Results from numerical analysis
The Almaty area’s clayey soil was selected in this study. For the simulation, two distinct slope heights (10 and 20 m) and three different slope angles (27, 35, and 45°) were used (Table 5).
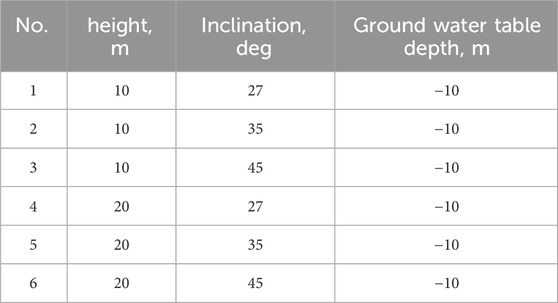
Table 5. Parametric studies.
In this stage of analysis, another four different typical rainfall patterns were included in the simulation. Table 6 demonstrates the rainfall distribution of each rainfall pattern for 12°days. The pore-water pressure fluctuations during rainfall were represented by seepage analysis, which depicts the changes in the pore-water pressure profile for a cyclic rainfall pattern after 12°days of continuous rainfall. The model is the same in all scenarios.

Table 6. The distribution of precipitation for different types of rainfall.
Pore-water pressure (PWP) profiles are shown in Figures 6A, B, 7A, B beginning from the mid-slope surface, for various types of rainfall on days 0, 4, 12, 16, and 24. Prior to precipitation initiation, the PWP at the surface was at its lowest value (−100 kPa). However, it begins to rise around 10 m below ground towards the position of the groundwater table. On the 16th day, except for the advanced rainfall instance, the PWP is the maximum at the slope’s surface. The most advanced sort of rainfall has a PWP that is the maximum on the fourth day. However, on the fourth, twelfth, sixteenth, and twenty-fourth days, the general trend versus depth is roughly the same. Moreover, the groundwater table was 16 m beneath ground level prior to the onset of the rains, as seen in Figures 6A, B. The groundwater table increased to 17 m as the rains started. It demonstrates that, during the rainy cycle, the depth to which water percolates into the ground changes by half a meter to a meter based on where the groundwater table is at any one moment.
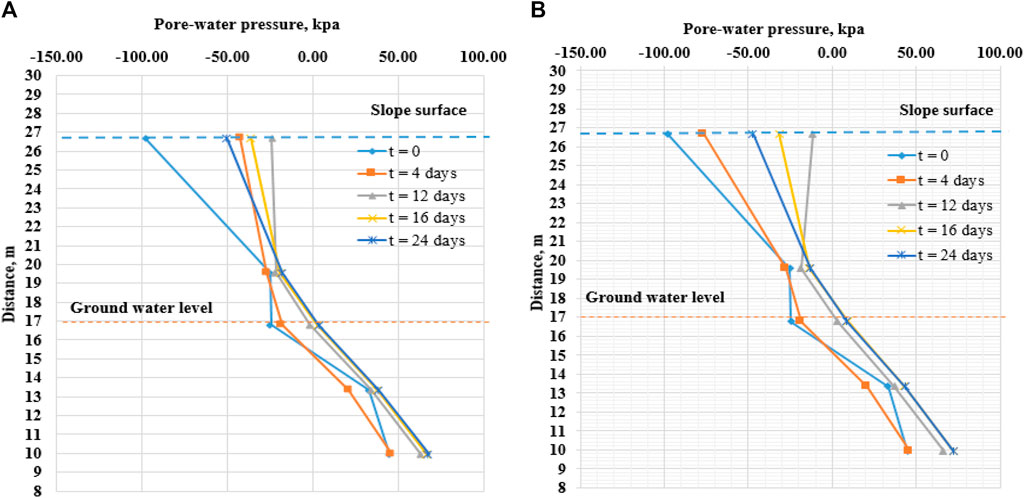
Figure 6. (A) Pore-water pressure profile for cyclic rainfall pattern at 10 m height slope and 45° of slope angle. (B) Pore-water pressure profile for delayed rainfall pattern at 10 m height slope and 45° of slope angle.
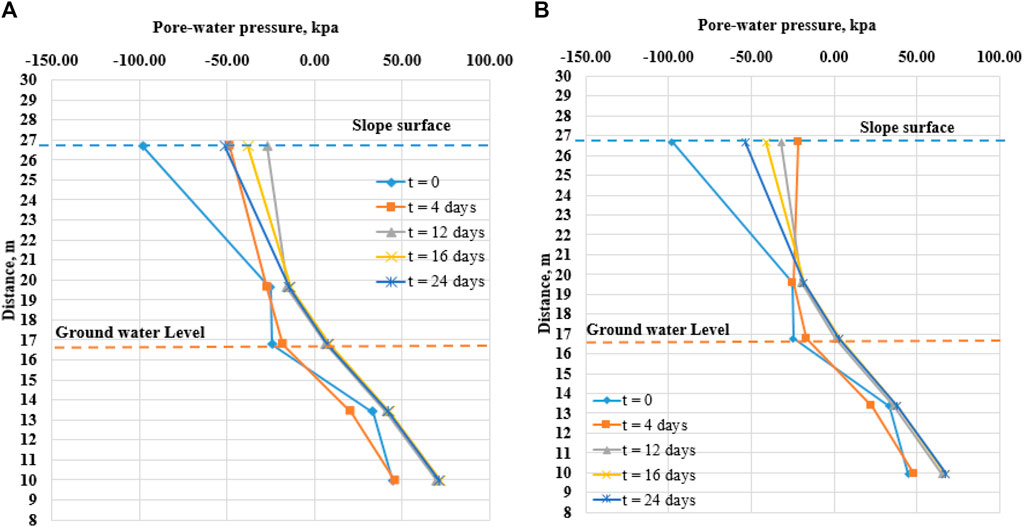
Figure 7. (A) Uw variations for normal distributed rainfall pattern at 10 m height slope and 45° of slope angle. (B) Uw variations for advanced rainfall pattern at 10 m height slope and 45° of slope angle.
Slopes of any height and angle would experience a sudden decrease in strength due to an increase in PWP during the intense rainfall of 240 mm per 12°days in the Almaty region, which can be seen in a corresponding decrease in the factor of safety in slope stability analysis. Inputs from SEEP/W analysis are used to create the slope model for stability analysis. The initial factor of safety at t = 0°days is indicated as 3.013 before rainfall began at the grid site above the hill.
As was previously noted, the first 12°days are wet. The first thing to notice is that the FoS decreases over the whole rainy period for all examples, which is indicative of the soil losing shear strength. FoS is still marginally diminished after 12 days. One possible explanation is that the soil contains water even at its deepest levels. On the other hand, for a slope height of 10 m, FoS begins to marginally increase around the 24th day into the dry period. It illustrates how groundwater levels are maintained due to evaporation and the cessation of infiltration. Due to this circumstances the power is also beginning to decrease.
Figure 8 represents that the Factor of safety (FoS) is higher in the lower slopes in all instances. Furthermore, at sufficiently steep slopes, landslides are common. The lowest FoS is shown at a 45-degree angle in all situations. Additionally, FoS is more than 1 in all simulated instances.
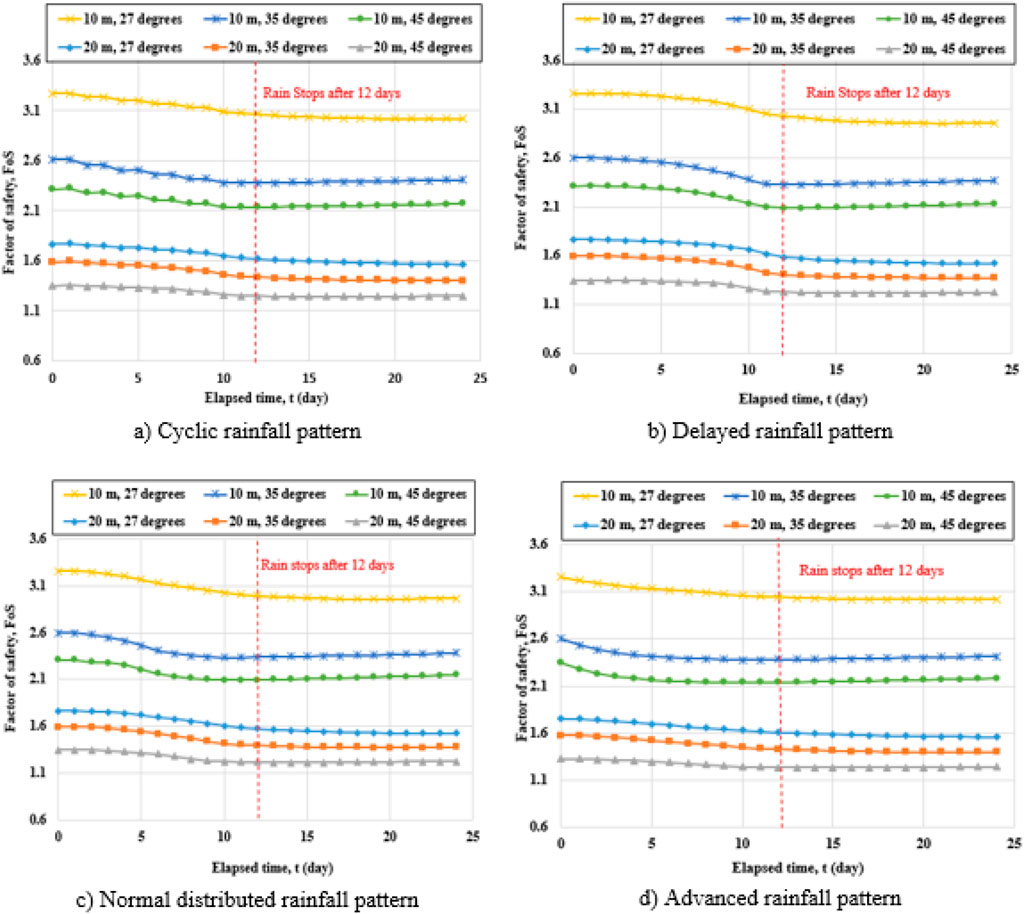
Figure 8. Results from slope stability analyses under four rainfall patterns for 12 days. (A) Cyclic rainfall pattern (B) Delayed rainfall pattern (C) Normal distributed rainfall pattern (D) Advanced rainfall patterns for 12 days.
Figure 9 represents that for the competitive slope (27°), the change in FoS is the smallest at 10 m (about 6.5% change in FoS) and 20 m (nearly 8.2% drop in FoS) under the advanced and cyclic rainfall loadings. However, the decrease in FoS that results from altering pore-water pressure at the end of the rainy season is depicted in Figure 10. For each of these types of precipitation, the initial value for a slope of 27° is reduced between 65 and 75 percent PWP. Figure 10 also provides an overview of trends in post-rainfall PWP changes in comparison to pre-rainfall baseline values. If there is a shift, it would indicate that rain is having a detrimental effect on PWP and has caused an elevation of the groundwater table. The PWP variance is minimal at the steepest decline (27°).
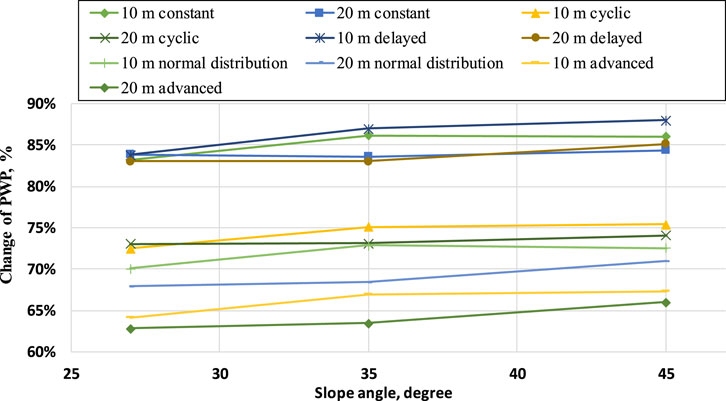
Figure 9. A pore-water pressure changes at the end of the rainfall against slope angles under different rainfall loadings.
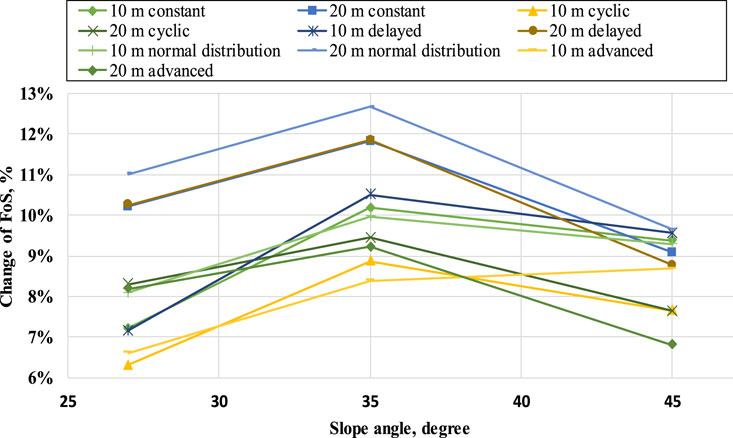
Figure 10. Results from slope stability analyses at t = 12 days.
Obtaining all the results from experimental work, the simulation for the steepest angle and the highest slope was conducted for sand-kaolin soil mixture under five different rainfall loadings to compare with clayey loam soil from Almaty. Figures 11A, B represents the tendency of FoS during rainfall period for 20-m slope height and 45-degree angle. From the first side, the overall pattern is the same for both soils since the residual FoS is almost the same at an average value of 1.25. On the other hand, the initial FoS is around 1.4 for sand-kaolin, while the average FoS of clayey loam soil is 1.34. The difference in values is insignificant since, in both cases, the reduction of soil shear strength due to infiltrated raindrops is valid. Additionally, the recovery due to the suction occurred in both soil sample simulations. Moreover, it confirms the results from the second stage that the FoS of soil under cyclic and advanced rainfall loadings is the highest after 12 days of rainfall.
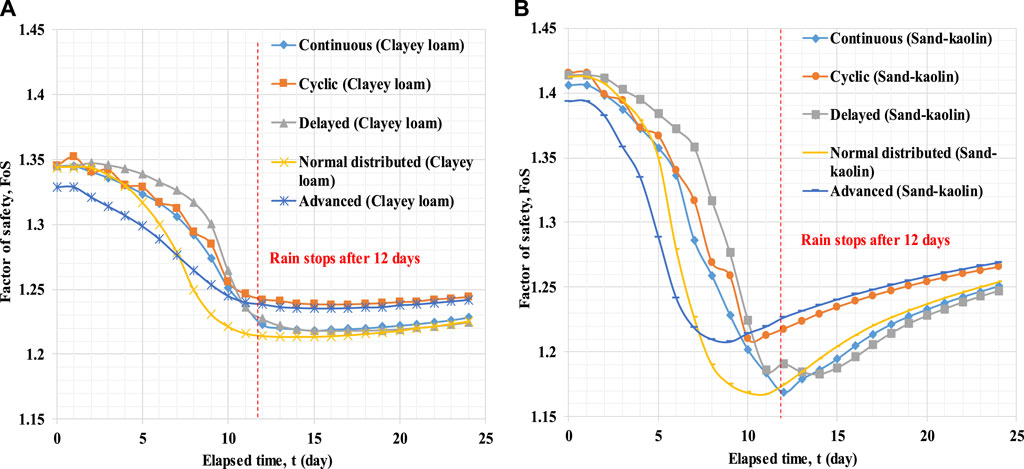
Figure 11. (A) FoS variation clayey loam soil’s slope with 20 m height and 45° under different rainfall loadings for two different soils. (B) FoS variation sand kaolin soil’s slope with 20 m height and 45° under different rainfall loadings for two different soils.
5 Discussions
The advanced and cyclic rainfall patterns have less influence on the FoS and PWP change in comparison to the delayed and normally distributed rainfall loading. The reason is that most precipitation occurs at the beginning of the rainfall in the advanced rainfall pattern, which allows suction to take place earlier along with the evaporation process. Hence, the strength of the soil is recovered earlier. The same is true for soil under cyclic rainfall patterns due to the absence of precipitation on each second day of the rainfall period. It allows for the maintenance of the suction part. In terms of the delayed and normally distributed rainfall types, the change in PWP and FoS is higher in comparison to other rainfall loadings since the intensive precipitation takes place near the end of the rainfall period. This phenomenon delays the recovery period of soil strength and suction. In comparison to Zhan et al. (2014), Chen et al. (2020), and Ng et al. (2020), they found that dry density and low moisture content can significantly decrease the soil suction and permeability functions. They also discovered that rainfall reduces matric suction in the soil while increasing water content and soil permeability in unsaturated soil zones. As a result, the groundwater table rises and accumulates above the normal water table. (Wang et al., 2023a) discovered that precipitation, temporal patterns, and grassroots significantly impact the spatiotemporal circulation of water in unsaturated soils.
Furthermore, movement of runoff and infiltrated droplets into the ground causes a disparity between the PWP decrease at the mid-slope and the steepest slopes. Water moves and falls more quickly down steeper slopes than it does down flatter ones. Concurrently, precipitation infiltrating from higher altitudes on the slope flows downslope to attenuate the dramatic difference in PWP between the mid-slope and the base of the slope. Additionally, Study by (Ng C and Shi, 1998b; Ng and Shi, 1998a); results show that the breakdown of the shear surface is mostly determined by differential creep produced by rock mass Geological structure and rainwater penetration into to the surface.
The first FoS value before a downpour begins is inversely related to slope heights, suggesting that the lowest slopes have high FoS as they are less likely to fail or slide due to severe rainfalls. In all cases, the numerical values of FoS at t = 0 (rain initiation) and t = 12°days (rain cessation) are graphically represented in Figures 12, 13.
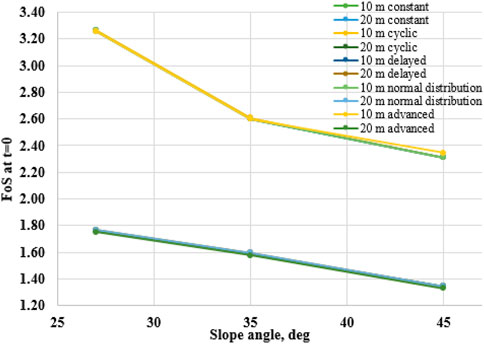
Figure 12. Results from slope stability analyses at t = 0 days for clayey loam soil.
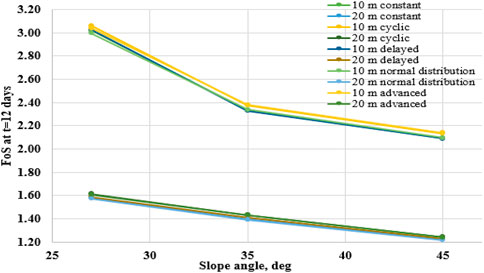
Figure 13. Results from slope stability analyses at t = 12 days for clayey loam soil.
On the other hand, SEEP/W analyses provided additional results for the infiltration rate for both soils, which can be viewed in Figures 14, 15. Figure 14 Demonstrates the cumulative precipitation and infiltration of rainwater into the soil surface of the slope. After the 12th day of rainfall, the infiltration of raindrops into the soil stopped due to the end of the rainfall period. However, both soils’ infiltration rates are equal and the value is that 25% of rainfall infiltrates into the soil at the surface of the slope. Also it can be taken into account that change in PWR is a function of soil texture. The equalization of that rate verifies that both soils perform the same under different rainfall loadings because of same particle sizes and permeability functions. The other 75% of rainfall is recognized as run-off on the slope surface. Additionally, to verify the tendency of rainfall infiltration rate into slope surface two composition of sand-kaolin mixture were examined as a fine and coarse grained soil under 200 mm cumulative precipitation for 10°days shown in Figure 15 It illustrates different infiltration rate for fine and coarse grained soil due to different particle size, permeability functions and slope geometry.
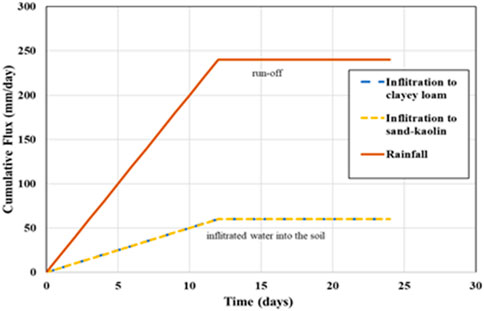
Figure 14. Infiltration of clayey loam and sand kaolin soil into slope (10 m, with 27).
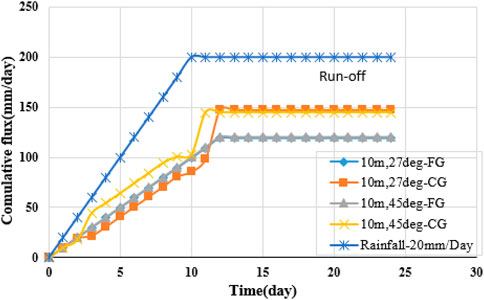
Figure 15. Infiltration of fine (FG) and coarse grained (CG) soil (20 m, with 27 and 45°).
6 Conclusion
In conclusion, GeoStudio software was used to simulate two distinct soil types in order to examine water flow, pore-water pressure fluctuations, and slope instability under varying precipitation conditions.
Findings from numerical analyses showed that the soil under a cyclic and advanced rainfall pattern for 240 mm of rainfall in the period of 12°days was less prone to failure than the other three types of rainfall (continuous, delayed, and normal distribution). The FoS for the slope of 10 m height and 27–degree slope angle was 6%, 7%, 7%, and 8% for cyclic, delayed, advanced, and normal distributions respectively. For the slope with 20 m height and same 27–degree angle the change in FoS were 8%, 10%, 8%, and 11% for cyclic, delayed, advanced, and normal distribution respectively. These same pattern were shown in slopes with 35° and 45° angles, having the same 10°m and 20 m heights. It should be noted that the results obtained from laboratory tests and numerical simulations are only applicable to clayey loam.
The sand-kaolin mixture from experimental work was used to compare the results with clayey loam. Since the tendency of decreasing FoS during the wet and dry periods of the entire simulation was approximately the same FoS = 1.25, the results of the numerical analysis of the slope stability show that both soils are equally reacted to various rainfall patterns. This is because the air-entry value and residual suction from the SWCC graph are roughly the same for both soils, which influence pore water pressure PWP equally.
Findings from numerical simulations shows that the rainfall infiltration rate depends on geological structure, permeability function and slope geometry. Findings show that the infiltration rate for coarse grained soil is higher than fine grained soil due to the highest permeability and big particles of the soil. Moreover, slope geometry can also affect the infiltration rate and intensity into to the slope surface, it was found that steeper slopes has high infiltration rate than it does down flatter ones.
Finally, it can be concluded that to reduce the landslide probability of slopes with 10–30 m of height and 27–80° of slope angle, slope protection techniques must be considered.
Data availability statement
The original contributions presented in the study are included in the article/supplementary material, further inquiries can be directed to the corresponding author.
Author contributions
AM: Conceptualization, Formal Analysis, Investigation, Methodology, Validation, Writing–original draft. AS: Conceptualization, Formal Analysis, Funding acquisition, Investigation, Project administration, Supervision, Validation, Writing–original draft, Writing–review and editing. ZA: Data curation, Formal Analysis, Investigation, Methodology, Writing–original draft. NB: Data curation, Software, Writing–original draft, Writing–review and editing. KN: Resources, Software, Supervision, Writing–original draft. QZ: Resources, Validation, Writing–review and editing. S-WM: Data curation, Formal Analysis, Writing–review and editing. JK: Project administration, Resources, Supervision, Writing–review and editing.
Funding
The author(s) declare that financial support was received for the research, authorship, and/or publication of this article. This research was supported by the Nazarbayev University Research Fund under Collaborative Research Program (CRP) Grant No. 11022021CRP1512. The authors are grateful for this support. Any opinions, findings, and conclusions or recommendations expressed in this material are those of the author(s) and do not necessarily reflect the views of the Nazarbayev University.
Acknowledgments
The Authors also would like to thank Directorate of Research and Development, Universitas Indonesia for the grant under Hibah PUTI 2023 (Grant No. NKB-544/UN2.RST/HKP.05.00/2023). The Authors would like to express sincere gratitude for the tremendous assistance from Assylanbek Sharipov during the collection of data for the study.
Conflict of interest
The authors declare that the research was conducted in the absence of any commercial or financial relationships that could be construed as a potential conflict of interest.
Publisher’s note
All claims expressed in this article are solely those of the authors and do not necessarily represent those of their affiliated organizations, or those of the publisher, the editors and the reviewers. Any product that may be evaluated in this article, or claim that may be made by its manufacturer, is not guaranteed or endorsed by the publisher.
References
Bardin, M. Y., Platova, T. V., and Omikhova, O. F. (2015). “Peculiarities of observed climate changes in the territory of northern eurasia according to regular monitoring data and their possible factors,” in Proceedings of the hydrometeorological center of Russia. (New York: Allerton Press), 13. Available at: http://method.meteorf.ru/publ/tr/tr358/bardin.pdf.
Chen, R., Tan, R., Chen, Z., Ping, Y., and Mei, Z. (2020). Influence of degree of compaction on unsaturated hydraulic properties of a compacted completely decomposed granite. Geofluids 2020, 1–9. doi:10.1155/2020/7615361
Chepelianskaia, O., and Sarkar-Swaisgood, M. (2022). Kazakhstan climate change and disaster risk profiel. Econ. Soc. Comm. Asia Pac. March. Available at: https://www.unescap.org/kp/2022/lmatytan-climate-change-and-disaster-risk-profile.
Duskayev, K. K., et al. (2018). Dynamics of changes in air temperature and precipitation in the city of Almaty. Hydrometeorol. Ecol. a Q. Sci. Tech. J., 52–63. Available at: https://www.elibrary.ru/item.asp?id=3673615.
Fredlund, D. G., Rahardjo, H., and Fredlund, M. D. (2012). Unsaturated Soil Mechanics in Engineering Practice Hoboken, New Jersey, July: John Wiley and Sons, Inc. doi:10.1002/9781118280492
Gofar, N., Satyanaga, A., Tallar, R. Y., and Rahardjo, H. (2022). Role of actual evaporation on the stability of residual soil slope. Geotechnical Geol. Eng. 40, 4585–4594. doi:10.1007/s10706-022-02172-z
Hu, Z., Zhang, C., Hu, Q., and Tian, H., (2014). Temperature changes in central Asia from 1979 to 2011 based on multiple datasets. J. Clim. 27 (3), 1143–1167. doi:10.1175/jcli-d-13-00064.1
Ip, C. Y., Rahardjo, H., and Satyanaga, A. (2021). Three-dimensional slope stability analysis incorporating unsaturated soil properties in Singapore. Georisk, Assess. Manag. Risk Eng. Syst. Geohazards 15 (No.2), 98–112. doi:10.1080/17499518.2020.1737880
Jiang, J., Zhou, T., Chen, X., and Zhang, L. (2020). Future changes in precipitation over Central Asia based on CMIP6 projections. Environ. Res. Lett. 15, 054009. doi:10.1088/1748-9326/ab7d03
Kaddo, J. R. (2016). Climate change: causes, effects, and solutions. A Honors Proj. 164. Available at: http://spark.parkland.edu/ah/164.
Kattsov, V., Govorkova, V., Meleshko, V., Pavlova, T., and Shkolnik, I. (2021). Climate change projections for Russia and central Asia states. Meteoinfo. Ru. Available at: http://neacc.meteoinfo.ru/research/climate-change-projections.
Khomyakov, V. A., Iskakov, E. E., and Serdaliev, E. T. (2013). Investigation of gravelly soil during underground construction in almaty. Soil Mech. Found. Eng. 50 (4), 171–177. doi:10.1007/s11204-013-9230-z
Mercer, K., Rahardjo, H., and Satyanaga, A. (2019). Unsaturated soils guidelines – volume 1. Aust. Centre Geomechanics, Univ. West. Aust.
METER Group AG (2018). Operation manual HYPROP 2; Ministry of Energy of the republic of Kazakhstan. Available at: https://unfccc.int/sites/default/files/resource/20963851_Kazakhstan-NC7-BR3-1-ENG_Saulet_Report_12-2017_ENG.pdf.
Ng, C. W. W., and Shi, Q. (1998a). A numerical investigation of the stability of unsaturated soil slopes subjected to transient seepage. Comput. Geotechnics 22 (1), 1–28. doi:10.1016/s0266-352x(97)00036-0
Ng, C. W. W., and Shi, Q. (1998b). Influence of rainfall intensity and duration on slope stability in unsaturated soils. Q. J. Eng. Geol. 31 (2), 105–113. doi:10.1144/gsl.qjeg.1998.031.p2.04
Ng, C. W. W., So, P., Lau, S., Zhou, C., Coo, J., and Ni, J. (2020). Influence of biopolymer on gas permeability in compacted clay at different densities and water contents. Eng. Geol. 272, 105631. doi:10.1016/j.enggeo.2020.105631
Orlovsky, N. S., et al. (2019). Climate change and water resources in Central Asia. EcoGosFond. Available at: http://ecogosfond.kz/wp-content/uploads/2019/09/CA.D.255-Izmenenie-klimata-i-vodnye-resursy-Centralnoj-Azii.pdf.
Rahardjo, H., Gofar, N., Satyanaga, A., Leong, E. C., Wang, C. L., and Wong, J. L. H. (2019a). Effect of rainfall infiltration on deformation of geobarrier wall. J. Geotechnical Geol. Eng. 37, 1383–1399. doi:10.1007/s10706-018-0693-6
Rahardjo, H., Kim, Y., and Satyanaga, A. (2019b). Role of unsaturated soil mechanics in geotechnical engineering. Int. J. Geo-Engineering 10 (1), 8. doi:10.1186/s40703-019-0104-8
Rahardjo, H., Satyanaga, A., Leong, E. C., Ng, Y. S., Foo, M. D., and Wang, C. L. (2007). “Slope failures in Singapore due to rainfall.” proceedings of 10th Australia New Zealand conference on geomechanics “common ground”. Brisbane, Australia, 21-24 october, Vol.2, pp. 704–709.
Rahardjo, H., Satyanaga, A., Leong, E. C., and Wang, J.-Y. (2014). Comprehensive instrumentation for real time monitoring of flux boundary conditions in slope. Procedia Earth Planet. Sci. 9, 23–43. doi:10.1016/j.proeps.2014.06.015
Rahimi, A., Rahardjo, H., and Leong, E.-C. (2011). Effect of antecedent rainfall patterns on rainfall-induced slope failure. Am. Soc. Civ. Eng. 137 (5), 483–491. doi:10.1061/(ASCE)GT.1943-5606.0000451
Satyanaga, A., Bairakhmetov, N., Kim, J. R., and Moon, S.-W. (2022a). Role of bimodal water retention curve on the unsaturated shear strength. Appl. Sci. 12, 1266. doi:10.3390/app12031266
Satyanaga, A., and Rahardjo, H. (2019). Unsaturated shear strength of soil with bimodal soil-water characteristic curve. Geotechnique 69, 828–832. September 2019. Vol. 69, No. 9, pp. 828-832;. doi:10.1680/jgeot.17.p.108
Satyanaga, A., and Rahardjo, H. (2020). Role of unsaturated soil properties in the development of slope susceptibility map. Proc. Institution Civ. Eng. – Geotechnical Eng. 175, 276–288. doi:10.1680/jgeen.20.00085
Satyanaga, A., Rahardjo, H., and Zhai, Q. (2017). Estimation of unimodal water characteristic curve for gap-graded soil. Soils Found. 57 (5), 789–801. doi:10.1016/j.sandf.2017.08.009
Satyanaga, A., Rahardjo, H., Zhai, Q., Moon, S.-W., and Kim, J. (2023). Modelling particle-size distribution and estimation of soil–water characteristic curve utilizing modified lognormal distribution function. Geotech. Geol. Eng. doi:10.1007/s10706-023-02638-8
Schindler, U. (1980). Ein schnellverfahren zur messung der wasserleitfähigkeit im teilgesättigten boden an stechzylinderproben. Arch. Acker-u. Pflanzenbau u. Bodenkd. Berlin 24, 1–7.
Sharipov, A., Satyanaga, A., Abishev, R., Moon, S., Taib, A. M., and Kim, J. (2023). Influence of slope geometry on stability of clayey soil slopes. Geotech. Geol. Eng. doi:10.1007/s10706-023-02438-0
Thurman, M. (2011). Natural disaster risks in central Asia: a synthesis. Bureau Crisis Prev. Recovery – UNDP. Available at: https://www.preventionweb.net/publication/natural-disaster-risks-central-asia-synthesis.
Trenberth, K. (2011). Changes in precipitation with climate change. Clim. Res. 47 (1), 123–138. doi:10.3354/cr00953
Wang, H., Chen, R., Leung, A. K., and Garg, A. (2023a). Hydrological responses to early-peak rainfall in unsaturated rooted soils. Heliyon 9 (5), e16042. doi:10.1016/j.heliyon.2023.e16042
Wang, H., Chen, R., Leung, A. K., and Huang, J. (2023b). Temperature effects on the hydraulic properties of unsaturated rooted soils. Can. Geotechnical J. 60 (6), 936–945. doi:10.1139/cgj-2022-0475
Wind, G. P. (1968). “Capillary conductivity data estimated by a simple method,” in V Water in the Unsaturated Zone. Proceedings of the Wageningen Symposium. Editors P. E. Rijtema, and H. Wassink (Gentbrugge, The Netherlands and UNESCO, Paris: Int. Assoc. Sci. Hydrol. Publ. (IASH)), 1, 19–23.
Zhai, Q., and Rahardjo, H. (2012). Determination of soil–water characteristic curve variables. Comput. Geotechnics 42, 37–43. doi:10.1016/j.compgeo.2011.11.010
Zhai, Q., and Rahardjo, H. (2015). Estimation of permeability function from the soil–water characteristic curve. Eng. Geol. 199, 148–156. doi:10.1016/j.enggeo.2015.11.001
Zhai, Q., Rahardjo, H., and Satyanaga, A. (2019). Estimation of air permeability function from soil-water characteristic curve. Can. Geotechnical J. 56 (4), 505–513. doi:10.1139/cgj-2017-0579
Keywords: rainfall, soil suction, unsaturated soil, slope stability, soil-water characteristic curve (SWCC), permeability function and climate change
Citation: Mohammad AS, Satyanaga A, Abilev Z, Bello N, Nadezhda K, Zhai Q, Moon S-W and Kim J (2024) The influence of rainfall patterns on factor of safety for clayey soil slopes. Front. Built Environ. 10:1376585. doi: 10.3389/fbuil.2024.1376585
Received: 25 January 2024; Accepted: 19 August 2024;
Published: 25 September 2024.
Edited by:
Sudhakar Babu Thanikanti, Chaitanya Bharathi Institute of Technology, IndiaReviewed by:
Rui Chen, Harbin Institute of Technology, Shenzhen, ChinaArun Prasad, Indian Institute of Technology (BHU), India
Copyright © 2024 Mohammad, Satyanaga, Abilev, Bello, Nadezhda, Zhai, Moon and Kim. This is an open-access article distributed under the terms of the Creative Commons Attribution License (CC BY). The use, distribution or reproduction in other forums is permitted, provided the original author(s) and the copyright owner(s) are credited and that the original publication in this journal is cited, in accordance with accepted academic practice. No use, distribution or reproduction is permitted which does not comply with these terms.
*Correspondence: Alfrendo Satyanaga, YWxmcmVuZG8uc2F0eWFuYWdhQG51LmVkdS5reg==