 Yohann Schatz
 Bernd Domer
- Institute inPACT, HEPIA, HES-SO University of Applied Sciences and Arts Western Switzerland, Geneva, Switzerland
Bridge maintenance activities benefit from digital models, provided in the interoperable IFC format. Such a model, enriched with up-to-date information, is an enabler for a wide range of applications. It opens new perspectives in asset information management. However, the manual creation of a digital replica, representing the actual state of the asset from point cloud data, is time-consuming. Consequently, process automation is of particular interest. This paper proposes a systematic, semi-automatic approach for creating IFC bridge models from point clouds. It introduces new methods for semantic segmentation and 3D shape modeling. A case study demonstrates the feasibility of the process in practice. Compared to other solutions, proposed methods are robust when dealing with incomplete point clouds.
1 Introduction
Ensuring the structural health of bridges is crucial for an operational infrastructure. However, the considerable quantity of assets to oversee is a non-negligible challenge for operators. In Switzerland, the national road network counts approximately 4,000 bridges, while the railway system includes around 8,000 bridges (ASTRA, 2016).
The mission of responsible entities (operators) is to guarantee user safety and uphold consistent service standards under all circumstances. In the context of bridge monitoring, inspection campaigns are carried out regularly to characterize asset conditions. These span from visual inspections, including photographs and illustrations, to detailed checks, such as deformation measurements in real-time (Roy et al., 2012; Bertola and Smith, 2019), dynamic auscultations, load tests, and gamma logging (Andrey et al., 1985). Therefore, the data collected on bridges, serving as the foundation for estimating repair needs and planning maintenance operations, may be extensive and diverse in terms of type and source.
Collecting such a substantial amount of data for each bridge involves the risk that some of the data might not be stored in a meaningful structure for analysis. However, well-organized information and convenient access to it is a prerequisite for optimizing maintenance planning and activities.
In this context, a digital twin (DT) consolidating all asset-related data would be highly valuable. A digital twin is a virtual representation of a physical object that can be remotely controlled, enabling advanced management for various purposes (Tekinerdogan, 2022).
Essentially, a digital twin refers to a Building Information Modeling (BIM) model that accurately represents the physical asset and includes up-to-date information.
Creating DT from archived construction documentation is labor-intensive, as not only the as-built situation but also information about modifications applied during the lifecycle of a bridge as well as inspection reports must be considered. In addition, available documents might be incomplete or incorrect and should be validated with the asset on site.
It is obvious that a DT should be established based on the current state of the structure. Point Cloud Data (PCD), generated through laser scanning and photogrammetry, are good candidates. Point clouds accurately reflect the actual geometrical and topological conditions of an asset (Vilgertshofer et al., 2023). Consequently, generating a DT from PCD ensures it has a true geometry (Tang et al., 2010; Vilgertshofer et al., 2023).
Additionally, PCD can be used to highlight movements and deformations by comparing point clouds created at different times. Furthermore, when combined with images, PCD enable automated detection and analysis of defects (Chan et al., 2015; Rezaie et al., 2020; Chen and Lin, 2021; Çelik et al., 2024). Such applications offer the potential to enrich the DT.
The process of generating a BIM model from PCD, also referred to as “Point cloud-to-BIM” (or “Scan-to-BIM” when laser scans are used), has gained significant attention (Son et al., 2015). Current practice consists mainly of manually modeling objects over PCD using dedicated applications (Tang et al., 2010). However, modeling existing bridges without intelligent computational support is considered to be inefficient (Rocha and Mateus, 2021).
Operators could benefit from a more automated generation of an accurate model in a neutral data format, enabling interoperability and allowing data generated to be used for a variety of applications. In the AEC industry, the recently released Industry Foundation Classes standard (IFC 4.3) (buildingSMART, 2024b) is a promising candidate for modeling infrastructure assets (Domer and Bernardello, 2023).
Sacks et al., 2018 introduced SeeBridge, a pioneering, comprehensive integrated workflow to create digital twins of bridges. The suggested method includes processes for acquiring point clouds and reconstructing semantically rich models. However, standards used like mvdXML and IFC four are now considered to be outdated (buildingSMART, 2024a).
A recent example is TwinGen (Vilgertshofer et al., 2023), spanning the entire process from point cloud acquisition to IFC bridge model creation. High-end solutions, based on advanced techniques such as deep learning and knowledge graphs, are proposed. TwinGen establishes the basis for automated Scan-to-BIM processes but does not provide a process map, detailing the sequence of operations and their corresponding requirements. Additionally, the document lacks a discussion on the real-world applicability of the proposed solutions (i.e., assessment of implementation effort and adaptability to different use cases).
The BridgeTwin project (HEPIA, 2022) intended to develop a systematic process for creating semi-automatically an IFC bridge model from point clouds to support maintenance activities.
The proposed process employs innovative solutions for the processing and transformation of point clouds into digital models. One important objective was that solutions can be easily reproduced in practical contexts, enabling stakeholders to rapidly create a BIM model of an existing bridge, structured in the interoperable format IFC. Authors propose to employ such models as data integrators to serve maintenance use cases.
BridgeTwin enhances the state-of-the-art in the area of point cloud-to-BIM by introducing:
1. Clear and structured workflows, expressed in Business Process Model Notation (ISO, 2013), for point cloud acquisition, preparation, and semi-automated point cloud-to-BIM.
2. New methods for semantic segmentation and 3D shape modeling of bridge elements.
This paper focuses on the description of the semi-automated semantic segmentation process and the creation of IFC bridge elements within the BridgeTwin framework. Proposed methods are evaluated regarding their performance as well as practical applicability and compared to traditional approaches. Integration of workflows and methods in two bridge maintenance test use cases (defect tracking and structural analysis) will be briefly presented.
2 Related work
Prior studies (Sacks et al., 2018; Wang et al., 2020; Vilgertshofer et al., 2023) outlined the following steps for the automated point cloud-to-BIM process:
1. Matching and extraction of bridge elements in point clouds (semantic segmentation).
2. 3D shape modeling of the elements.
3. Integration of inspection-related data into the model.
These have been addressed in various publications (Ma and Liu, 2018; Rashdi et al., 2022).
2.1 Point cloud semantic segmentation
Unlike BIM models, raw point clouds do not have a coherent structure (Hackel et al., 2016). This means that the points are not associated with specific objects, as all elements in the scene are merged. Semantic segmentation aims to allocate points to predetermined object classes.
Methods proposed for semantic segmentation of bridge point clouds can be classified as either rule-based or learning-based (Schatz and Domer, 2023).
2.1.1 Rule-based segmentation
The term “rule-based system” in this context denotes a decision-making framework that relies on expert knowledge and uses a fixed set of rules to replicate human decision processes.
Lu et al., 2019 utilized a top-down methodology for identifying bridge elements within point clouds of concrete bridges. The proposed approach involves an initial separation of deck and pier assemblies based on bounding boxes, followed by the detection and segmentation of pier caps and girders, using density histograms.
Qin et al., 2021 employed a density-based algorithm. Initially, the point cloud undergoes preprocessing which includes registration, noise reduction, and sampling. Next, the mean density of point clouds and the interval value are computed. Finally, segmentation is performed based on interval density and point cloud projection filtering.
Rule-based solutions generally demonstrate high accuracy for tested bridges, as algorithms are tailored to deal with specific scenarios. A limitation of this approach is that it can necessitate numerous input parameters and substantial expert knowledge (specific to the analyzed bridge type) to perform correctly. Generalization for other bridge types beyond those described by the initial rules may be difficult.
2.1.2 Learning-based segmentation
Alternatively to expert systems, machine learning or deep learning algorithms can be used to segment point clouds. The most promising solutions are supervised, meaning that they require labeled data for training. Proposals differ mainly on the type of input (e.g., points, volumes, images) as well as the features used (Guo et al., 2019).
A pioneering work is PointNet (Qi et al., 2016). PointNet is a point-wise multilayer perceptron (MLP) neural network that directly processes raw PCD without needing manual preprocessing. PointNet and PointNet++ (Qi et al., 2017) provided the basis for further improvements, and suggestions have been made to increase accuracy, in particular when applied to bridges (Lee et al., 2021). Another point-based segmentation architecture is RandLA-Net (Hu et al., 2019), which demonstrated satisfactory results on bridge structures (Mafipour et al., 2023).
Given the significant amount of training data needed, point-based segmentation is not straightforward. A possible alternative is to use images instead of PCD, considering their abundant availability or the ease with which they can be produced (Vilgertshofer et al., 2023).
Martens et al., 2023 introduced a novel approach combining image segmentation and geometric reasoning. First, images are segmented using a convolutional neural network. Next, the point cloud is segmented by projecting the labeled area of the images onto it. Finally, geometric knowledge is employed to improve the accuracy of the detected regions. As a result, training only requires around a hundred images. However, the boundaries of detected regions are imprecise and may overlap.
Regardless of the input type, neural network models are considered to be more flexible and less limited than most heuristic approaches, which are based on assumptions (Mafipour et al., 2023). However, the high computational costs, especially when processing large point clouds, and the lack of available training data, are significant barriers against broader adoption (Truong-Hong and Lindenbergh, 2022; Xia et al., 2022; Yang et al., 2022).
2.2 3D shape modeling
In theory, point clouds could be directly exported to IFC format, as demonstrated by the “Point” and “PointCloud” types available for the class IfcShapeRepresentation (buildingSMART, 2024b). However, this would lead to extensive lists of IfcCartesianPoint, and consequently, huge file sizes. Furthermore, no Model View Definition (MVD) enabling the import or export of point clouds in IFC exists at present (buildingSMART, 2024d).
A practical and convenient solution is to convert PCD into polygon meshes, surface models, or solid models.
BIM authoring tools generally operate with surface or solid models (Fougerolle et al., 2005; Lafarge et al., 2010; Pătrăucean et al., 2015; Eastman et al., 2018; Rausch et al., 2020), which are suitable options for designing new elements or assemblies with an “idealized” geometry (e.g., truly parallel or perpendicular edges, smooth surfaces, etc.). On the other hand, polygon meshes are considered to be more appropriate for accurately capturing as-built, irregular geometries (Tang et al., 2010; Rausch et al., 2020). In addition, both point clouds and meshes are non-parametric, allowing for a seamless transition between the two (Rausch et al., 2020).
Polygon meshes, surface models and solid models are all exportable in IFC, which supports various representation types such as Constructive Solid Geometry (IfcCSGSolid), Boundary Representation (IfcFacetedBrep), Non-Uniformal Rational B-Splines (IfcAdvancedBrep) and Tessellation (IfcTriangulatedFaceSet, IfcPolygonalFaceSet) (buildingSMART, 2024b).
Two prevalent approaches for creating three-dimensional shapes of bridge elements from PCD are examined:
1. Applying a surface reconstruction algorithm.
2. Fitting geometrical primitives.
2.2.1 Surface reconstruction
Surface reconstruction algorithms, such as alpha shape (Edelsbrunner et al., 1983), ball pivoting (Bernardini et al., 1999), and Poisson surface reconstruction (Kazhdan et al., 2006), can be used to create a triangle mesh from a set of unorganized cartesian points.
The alpha shape algorithm is a generalization of the convex hull algorithm, allowing to capture concave features of the boundary. The principle is to perform a Delaunay triangulation (Delaunay, 1934; Berg, 2008) on all points and retain the outer edges of the triangulation. Then, edges whose lengths are greater than a threshold value (α) are trimmed (Fischer, 2000).
The shape obtained, known as the “alpha shape,” is highly variable, depending on the chosen α-value. When increasing α, the alpha shape is getting similar to a convex hull. If α is too low, the alpha shape overfits the points, resulting in inconsistencies. Thus, the difficulty of this method lies in determining the appropriate α-value, especially if the point cloud is not uniformly sampled (Akdim et al., 2022).
The ball pivoting algorithm is related to alpha shapes (Open3D, 2018). A virtual sphere (ball) initially moves through the various points contained within the point cloud. A first triangle is formed when the ball intersects with three points without passing through them. Next, the ball is pivoted from the triangle edges to form a new triangle. The process is repeated until no further triangles can be created.
Since the Delaunay conditions are satisfied, the resulting mesh is accurate to the original point cloud (Akdim et al., 2022). However, an inadequate ball radius value can lead to inaccuracies such as surface voids (when the radius is too small) or approximations (when the radius is too large) (Akdim et al., 2022).
The Poisson surface reconstruction algorithm is based on Poisson’s equation (Kazhdan et al., 2006). This algorithm establishes a continuous vector field in three dimensions and identifies a scalar function that best matches the gradients of the vector field. Then, an isosurface is extracted by solving Poisson’s equation. Poisson surface reconstruction is good at handling noisy or sparse point clouds but is computationally expensive (Akdim et al., 2022). Kazhdan and Hoppe (Kazhdan and Hoppe, 2013) developed a variant known as “screened Poisson surface reconstruction,” which enables faster and higher-quality surface reconstructions.
2.2.2 Geometrical primitives fitting
Geometrical primitives fitting aims to decompose a point cloud into a set of basic geometrical shapes such as a sphere, cube, cylinder, cone, or pyramid.
The most widely known methods for model fitting are RANSAC-based (Marchand, 2018). RANSAC (Random sample consensus) is an iterative algorithm that fits geometric primitives to a randomly selected set of points until a specified number of iterations is reached.
In the end, the shape that best approximates the points is extracted and the process continues with the remaining points (Bolles and Fischler, 1981; Schnabel et al., 2007). This approach is robust in the presence of noise and outliers, however, computational costs are high, and 3D primitives are considered unsuitable for accurately modeling bridge elements with intricate geometry (Schnabel et al., 2007; Li et al., 2018; Mafipour et al., 2023).
Mafipour et al., 2023 proposed a new approach to handle complex elements such as decks and abutments. First, a “dummy” profile (profile defined by a set of parameters that determine the location of vertices on a 2-D plane) is defined. The dummy profile is then fitted to the cloud by minimizing the distance between points, edges, and vertices of the profile. The main advantage of this method is that modeled elements are parametric, meaning they can be adjusted dynamically by changing parameter values (Qin et al., 2021). However, extensive work is necessary to create the dummy profiles, making this approach viable only if there is a need for dynamic model modification. The relevance of parametrically modeling as-built assets in the context of Scan-to-BIM is still an open question (Rausch et al., 2020).
2.3 Integration of inspection-related data
The IFC schema provides multiple mechanisms for integrating semantics related to the current condition of a bridge, such as linking property sets to bridge elements (through the objectified relationship IfcRelDefinesByProperties) or linking external documents/files to elements (with IfcRelAssociatesDocument) (buildingSMART, 2024b).
Defects observed on the surface of an element can be instantiated using the IfcSurfaceFeature or IfcVoidingFeature class. In that case, they are linked to the element by using the objectified relationship IfcRelAdheresToElement or IfcRelVoidsElement, respectively (buildingSMART, 2024b).
SeeBridge (Sacks et al., 2018) and TwinGen (Vilgertshofer et al., 2023) include a methodology for the automated detection and integration of surface defects into the model. However, no details are provided on how defects are geometrically modeled.
Artus et al., 2022 have focused primarily on the modeling of defects in IFC. They proposed to start by creating a dense point cloud of the defect from inspection images. Then, the point cloud is triangulated and the obtained surface is extruded to create a volume. Finally, a boolean difference operation (Glaeser and Stachel, 1999) is applied between the hosting building element and the volume to obtain the defect’s three-dimensional shape. After defects have been modeled, they are enriched with required semantics (identifier, name, etc.) and mapped to IfcSurfaceFeature or IfcVoidingFeature.
Isailović et al., 2020 provided a similar approach, employing a surface reconstruction algorithm. Modeled defects are mapped to IfcSurfaceFeature and include damage-specific semantics inspired by the bridge management system “KUBA 5” (ASTRA, 2021).
3 Proposed method
BridgeTwin proposes a structured process (Figure 1) from PCD to maintenance use cases, subdivided into stages for acquiring and preparing PCD, converting PCD to IFC models, and performing maintenance-related use cases.
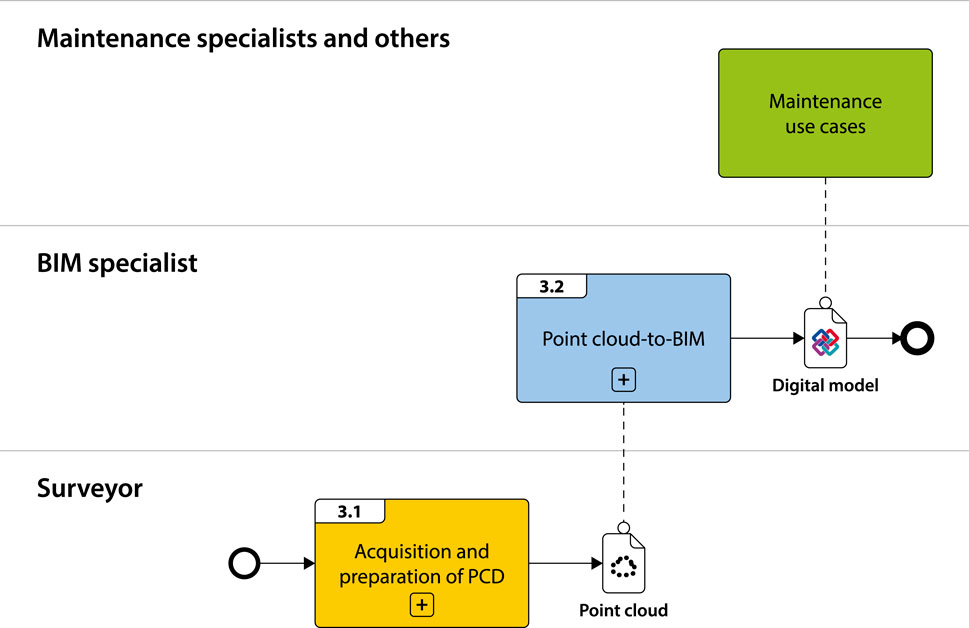
Figure 1. General process (task numbers relate to paper sections).
3.1 Acquisition and preparation of PCD
Figure 2 illustrates the procedure for acquiring and preparing PCD, managed by surveyors or geomatic engineers. It comprises three stages: preliminary work, data acquisition, and post-processing.
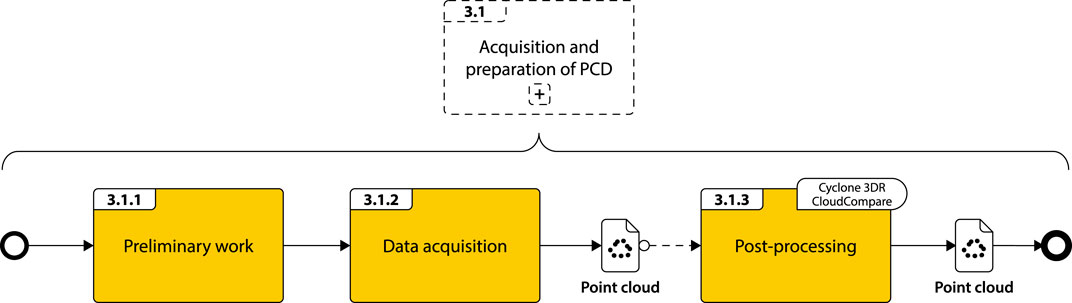
Figure 2. Process for acquiring and preparing point clouds (task numbers relate to paper sections).
3.1.1 Preliminary work
Preliminary work involves defining the data acquisition method(s) to be used and initial on-site investigations. Methods are selected according to different criteria (Ahmed et al., 2011):
• On-site constraints (e.g., accessibility).
• Accuracy and level of detail required.
• Labor hours required for data collection and data processing.
• Cost of equipment.
• Portability.
• Training expertise.
Then, all necessary authorizations such as access to private property and drone flights are requested.
3.1.2 Data acquisition
The two primary methods for acquiring PCD are 3D laser scanning and photogrammetry (Wang et al., 2020; Pu et al., 2022).
3D laser scanning, also known as Light Detection And Ranging (LiDAR), involves measuring the distance to a target by emitting laser beams and detecting the signals from the target. 3D laser scanners can be classified into three categories based on their working platforms, namely, terrestrial laser scanner (TLS), airborne laser scanner (ALS), and mobile laser scanner (MLS) (Wang et al., 2020).
Photogrammetry is a technique that consists of taking measurements in a scene, using the parallax obtained between images acquired from different viewpoints (Schenk, 2005).
The main advantage of using photogrammetry over 3D scanning is the price and ability to capture the surface texture (Wyatt-Spratt, 2018). However, 3D scanning has higher measurement accuracy and maximum measurement range (Wang et al., 2020), which is ideal for large-scale structures.
If needed, the different methods (TLS, ALS, MLS, and photogrammetry) can be employed complementarily (Morel and Schatz, 2023).
3.1.3 Post-processing
Post-processing involves performing a series of operations on PCD to facilitate their use in subsequent stages (in particular, point cloud-to-BIM). For example:
• Calibrate measurements (if an initial measurement exists).
• Filter and clean data (i.e., remove outliers).
• Subsample the point cloud.
• Convert data into required format(s) (e.g., PLY, XZY, or E57).
These operations can be carried out manually or automatically, using specialized tools such as Leica Cyclone 3DR (Leica Geosystems, 2024) and CloudCompare (Girardeu-Monteau, 2021) (Figure 2).
3.2 Point cloud-to-BIM
The Point cloud-to-BIM process (Figure 3) has three stages: semantic segmentation, 3D shape modeling, and model construction Figure 4.
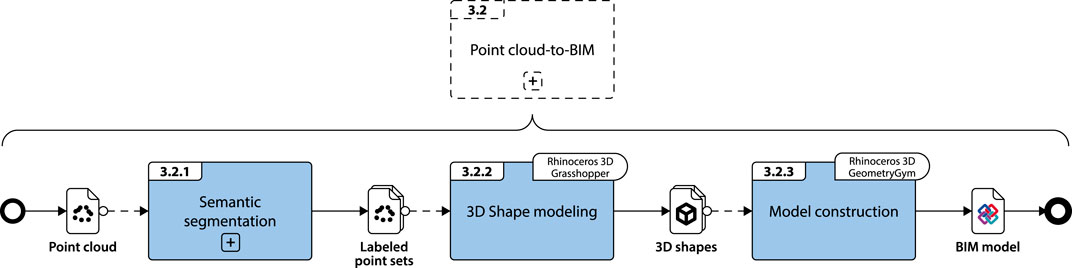
Figure 3. Point cloud-to-BIM process (task numbers relate to paper sections).
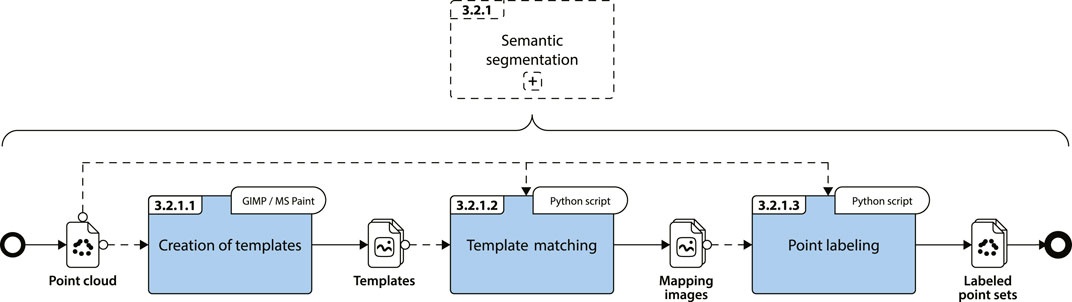
Figure 4. Semantic segmentation process (task numbers relate to paper sections).
The BridgeTwin project aimed to propose a methodology applicable in an industrial context. Therefore, the technical solutions implemented for semantic segmentation, 3D shape modeling, and model construction had to meet the following specifications:
• Minimal implementation effort.
• Scalability and transparency (avoid “black boxes”).
• Robustness under realistic scenarios, in particular partial point clouds.
• When processing data, allow (request) necessary user intervention.
As existing solutions do not satisfy all the above-mentioned requirements, specific methods for semantic segmentation and 3D shape modeling have been developed. These are described in the following sections.
3.2.1 Semantic segmentation
The proposed segmentation method (Schatz and Domer, 2023) is a hybrid approach designed to overcome the limitations of rule-based approaches, which are difficult to implement and adapt to other structures, and those of learning-based approaches, which are computationally expensive and require large amounts of data to operate.
The underlying idea is to use a template matching algorithm to match elements within cross-sections of a bridge. The benefit of this approach is that it simplifies a 3D problem to a 2D one and does not require users to provide large datasets for segmentation.
Template matching is a high-level machine vision technique used to find occurrences of a specific pattern (called template) in an image (called source image) (OpenCV, 2024b). In the present case, templates are defined manually by the user and represent elements to be matched. Source images are cross-sections of the bridge, generated from point cloud longitudinal slices. When a template matches a region of a cross-section image, points are extracted from the related slice and labeled. The process continues until all cross-sections have been analyzed.
3.2.1.1 Creation of templates
A template is a bitmap image (in a format like.jpg or.png) that represents the expected profile of the element in the bridge cross-section (Figure 5). It can be created from scratch or derived from orthophotos or existing plans, provided that the scale is respected.
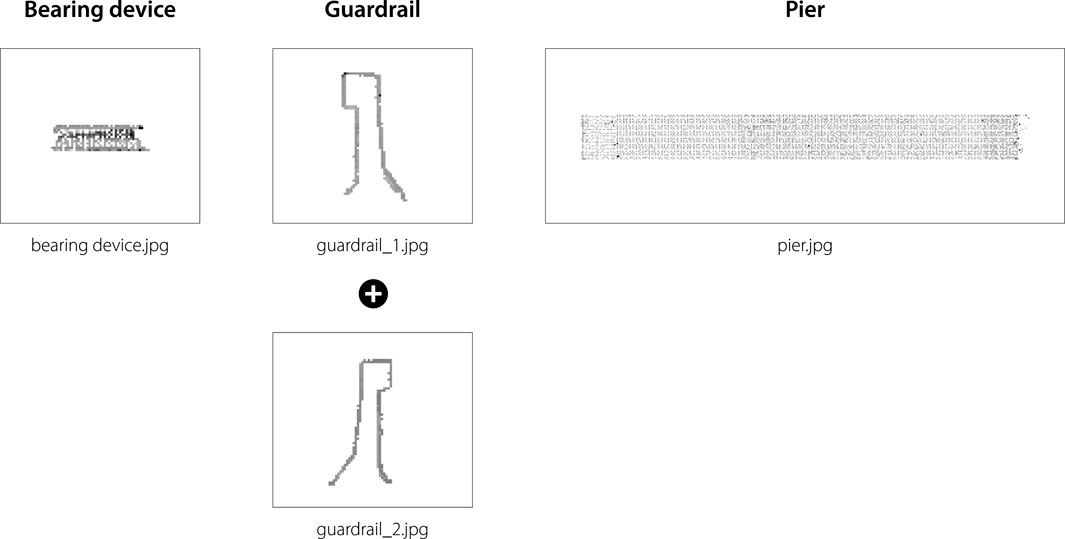
Figure 5. Templates.
If an element has different profiles (depending on where it is located on the bridge), then one template for each profile must be prepared. Certain large elements such as piers can be matched with a typical pattern that recurs several times in the profile.
3.2.1.2 Template matching
To create source images, the bridge point cloud is sliced longitudinally as if using a “virtual knife.” Then, each slice is voxelized and voxels are “flattened” to obtain an image (pixels) representing the cross-section of the corresponding bridge slice. The number of cross-section images to create varies: if the bridge is curved or if its cross-section changes from one end to the other, then more images (i.e., more slices) are required.
Obtained cross-section images are then analyzed using a template matching algorithm to locate elements. Two main types of algorithms can be used: feature-based and area-based (Swaroop and Sharma, 2016). Feature-based algorithms aim to match local features of images such as edges, corners, and endpoints, while area-based algorithms only compare grey values (Hong and Zhang, 2007).
The main advantage of the feature-based approach over the area-based is that it is not sensitive to scale changes, rotations, translations, and intensity variations (Swaroop and Sharma, 2016). However, it is not applicable when images have fewer features or when different objects share the same features.
Regardless of the chosen approach, when a match is detected, the expected result is an image called “mapping image”, in which matched elements are colored in red (Figure 6).
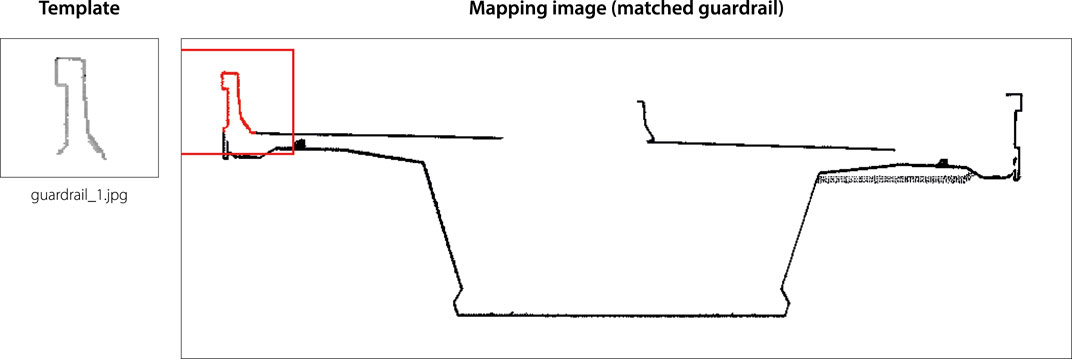
Figure 6. Mapping image (template matching result).
3.2.1.3 Point labeling
The red pixels of mapping pictures are matched with voxels of corresponding slices by associating the

Figure 7. Point labeling.
3.2.2 3D shape modeling
Existing surface reconstruction and geometric primitive fitting methods were tested on several point clouds, representing elements with more or less complex shapes such as piers, supports, or railings. Point clouds were produced in different quality levels: low (noise, missing faces and parts), medium (presence of voids), and high (little noise, few voids).
No method has given complete satisfaction:
• Alpha shape, ball pivoting and screened poisson allow faithful reconstruction of all geometric shapes, but produce odd results when one or many faces of the element are missing.
• RANSAC-based geometric primitive fitting performed better on low and medium-quality point clouds, but is not suitable for the most complex shapes (poor results and too high computational cost).
The fitting of pre-defined parametric shapes, as proposed for TwinGen (Vilgertshofer et al., 2023) was not considered an appropriate solution. It requires too much preparation, and the geometry of created shapes is not intended to be dynamically modified.
Therefore, a new, simple surface reconstruction algorithm is proposed, inspired by the principle of Riemann sums (Oberbroeckling, 2021). First, the point cloud is partitioned along
To prevent surface irregularities, the subsets overlap so that they share common points. The number of partitions along
3.2.3 Model construction
At this stage, elements are modeled but remain unstructured.
The expected structure and content of the output model are defined in an ontology, which describes how the elements are organized in space, the relationships between them, what information they should contain, and to which IFC class they should be exported. Existing data models such as KUBA 5 (ASTRA, 2021) can be used as a basis to build the ontology.
The ontology is formalized in a text file using standardized—OWL2 (W3C, 2012)—or non-standardized syntax and is consumed by a routine that gathers created elements, organizes them and adds required semantics according to the ontology’s specifications.
Finally, the model is exported in IFC 4.3 format.
4 Case study
The proposed methodology has been applied to create digital models of two reinforced concrete (RC) curved box girder bridges, located in Switzerland (Figure 8). Tested bridges measure 350 and 380 m in length, 15 and 20 m in width, and 40 and 30 m in height, respectively.

Figure 8. Tested bridges.
4.1 Acquisition and preparation of PCD
Point clouds were acquired by terrestrial laser scanning, using RIEGLVZ-2000i (RIEGL, 2023) scanner. Measurements have been made during summer, at a maximum distance of 300 m. Due to distance, road traffic and the presence of vegetation (typical for summer conditions), many elements (road dividers, pavement, bearing devices, abutments) could not be captured entirely, resulting in incomplete, noisy point clouds.
Noise and voids were reduced in the post-processing stage, but missing parts could not be recovered. Point clouds have been subsampled (1 point every 5 cm) to reduce file size (.E57) by over 80% and conserve computing resources.
4.2 Point cloud-to-BIM
4.2.1 Semantic segmentation
GIMP (GIMP, 2023) was used to create templates from point cloud screenshots (Figure 4). Only one template has been created for each element type (box girder, drainpipe, pier, road divider, and road pavement), except for guardrails, which required two templates (one per deck side).
A comparative analysis between several template matching algorithms (feature-based and area-based) has been conducted. Results obtained with feature-based algorithms were unsatisfactory, regardless of the technique used for feature detection and extraction (SIFT (Lowe, 1999), SURF (Bay et al., 2008), or ORB (Rublee et al., 2011)) due to the absence of strong features in the cross-section images. On the other hand, good matching results were obtained with area-based algorithms. This approach is therefore preferred, despite its sensitivity to rotation and scale variations.
A major weakness of basic area-based matching algorithms is the increased risk of confusion (wrong matches) when templates become smaller, as they are less likely to have particular and distinctive characteristics. To solve this issue, a new variant called “contextual area-based matching algorithm” was developed (Schatz and Domer, 2023), which involves automatically adding contextual information (surroundings) to the template to eliminate wrong candidates.
OpenCV (OpenCV, 2024a) and Open3D (Open3D, 2023) Python libraries were used for implementation (Figure 4).
The normalized cross-correlation function is used for measuring similarity (OpenCV, 2024b), as it is not sensitive to changes in brightness and contrast (Stachniss, 2021). This function returns a score between 0 (no match) and one (perfect match) for each candidate match. In advance of template matching, the user defines two threshold values
• If score >
• If
• If score <
Inviting the user to verify results considered “uncertain” (i.e., when
4.2.2 3D shape modeling
This step employed Rhinoceros 3D v7 (Robert McNeel and Associates, 2024) and scripts based on the CGAL library (CGAL, 2024) (via Grasshopper) (Figure 3). Rhino’s built-in tool “ReduceMesh” was used to optimize the resulting meshes (i.e., reduce the number of vertices and edges). Invisible hollow parts of elements were modeled manually.
4.2.3 Model construction
The IFC model is constructed in Rhinoceros 3D using Grasshopper and GeometryGym (ggRhinoIFC) (Mirtschin, 2024) (Figure 3).
The expected spatial structure for each IFC 4.3 (IfcBridge) model is as follows:
• Site (IfcSite).
• Bridge (IfcBridge) in Site.
• Substructure (IfcBridgePart.SUBSTRUCTURE) in Bridge.
• Superstructure (IfcBridgePart.SUPERSTRUCTURE) in Bridge.
• Deck (IfcBridgePart.DECK) in Bridge.
• Abutments (IfcElementAssembly.ABUTMENT), bearing devices (IfcBearing), and piers (IfcColumn) in Substructure.
• Box girder (IfcElementAssembly.BOXGIRDER) in Superstructure.
• Drainpipes (IfcPipeSegment), guardrails (IfcRailing), road dividers (IfcWall.ROADDIVIDER), and road pavements (IfcPavement) in Deck.
Names of spatial/functional assemblies and physical elements are based on KUBA 5 (ASTRA, 2021). Depending on the use case, additional information such as materials and properties can be directly added within Rhinoceros 3D.
4.3 Use cases
4.3.1 Use case 1: defect tracking
The purpose of this use case is to integrate observed defects (e.g., concrete efflorescence, rust stains, concrete spalling, cracks, etc.) into the model and enable users to retrieve quickly all related data (inspection reports, photos, etc.). The benefit is to guarantee structured access to relevant information for maintenance work planning purposes.
The developed workflow is shown in Figure 9. It requires the participation of several actors with different roles and responsibilities:
• Planners are specialists in structural repairs and are responsible for planning maintenance operations.
• Inspectors are specialists in the pathology and diagnosis of structures. They assess the condition of the structure and make the results available to planners via the digital model.
• The database manager is responsible for developing and maintaining the databases in which inspection data is stored.
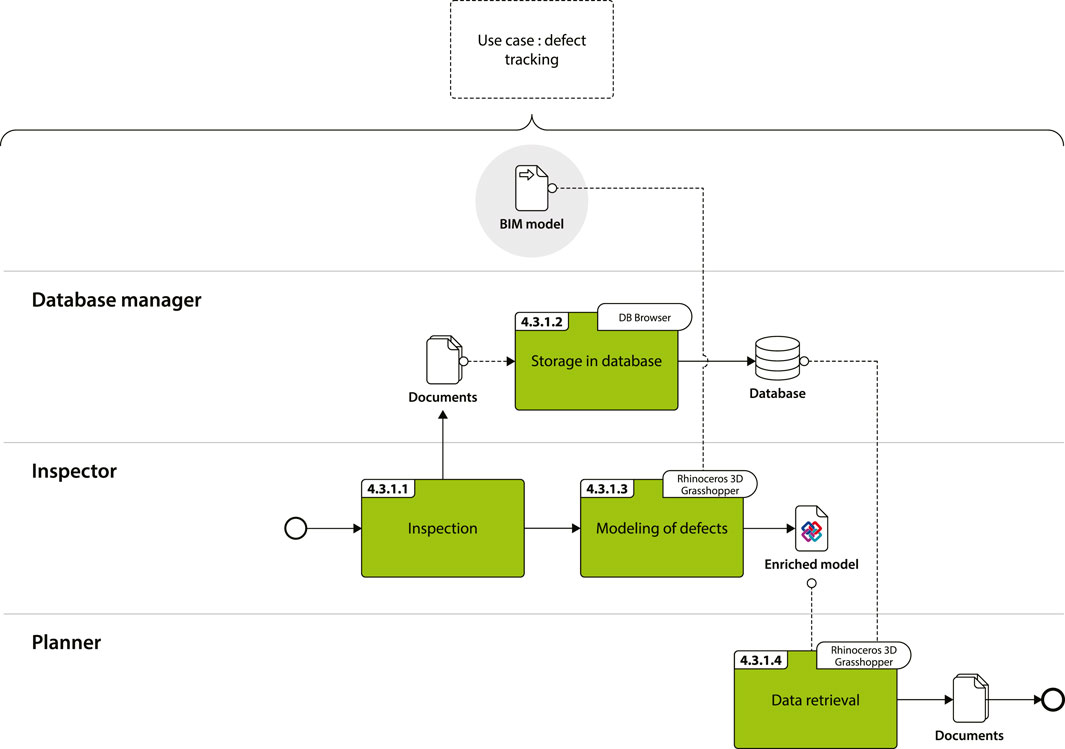
Figure 9. Workflow for defect tracking (task numbers relate to paper sections).
4.3.1.1 Inspection
During inspection, defects are identified and analyzed, and data (photos, reports) are generated.
4.3.1.2 Storage in database
Each defect is referenced in a database with a globally unique identifier (GUID) and linked to documents produced.
4.3.1.3 Modeling of defects
Defects are modeled in Rhinoceros 3D, and mapped to the adequate IFC class (IfcSurfaceFeature or IfcVoidingFeature) using a tool developed with Grasshopper (Figure 9). Additionally, “database GUIDs” of defects are specified as properties (IfcPropertySingleValue). Since the objective is merely to get the position of defects, a high level of geometric detail is judged unnecessary. For this reason, they are represented by circles with radii corresponding to their areas of influence and color-coded to indicate severity (green for low, yellow-orange for medium, red for high).
The model is then exported in the IFC 4.3 format.
4.3.1.4 Data retrieval
IFC models are opened in Rhinoceros 3D, and all defect-related data (photos, inspection reports) stored in a database can be retrieved using a dedicated tool developed with Grasshopper (Figure 9).
When a defect is selected in the model, a request is sent to the database, which returns all documents linked to the defect based on its GUID. Each document can be filtered according to type, creation date, modification date, or version number.
4.3.2 Use case 2: structural analysis
The goal of this use case is to use an IFC model as a basis for generating an analytical model for structural analysis. The principle is to directly import the IFC model into the analysis software and derive the analytical model from the physical model. The main advantage is to save engineering time by eliminating the need to create the full analytical model from scratch.
The workflow developed for this use case is shown in Figure 10.
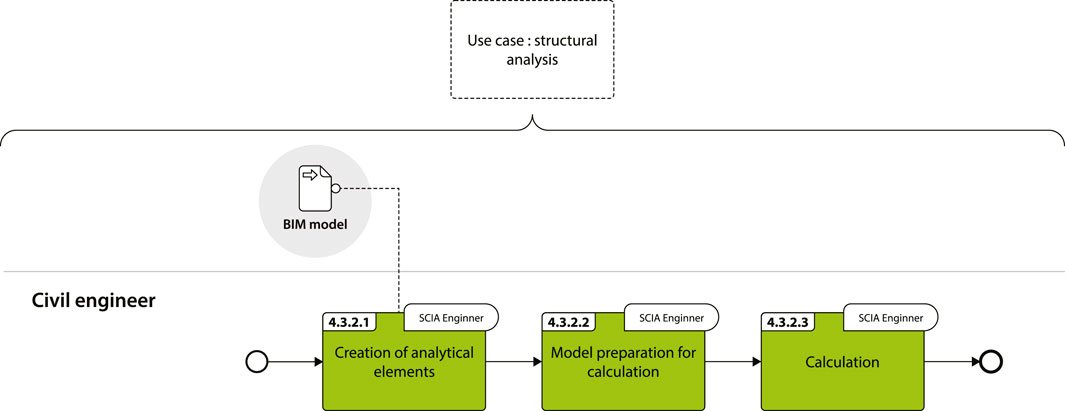
Figure 10. Workflow for structural analysis (task numbers relate to paper sections) (Franciosi et al., 2024).
The structural analysis software used is SCIA Engineer v22 (Nemetschek, 2024a) (Figure 10), which accepts IFC 2 × 3 and IFC four formats, despite not supporting the MVD “structural analysis view” (buildingSMART, 2024d).
4.3.2.1 Creation of analytical elements
The IFC 4.3 model is first automatically converted to IFC four using GeometryGym, resulting in semantic changes (e.g., IfcBridge changed to IfcBuilding, and IfcBridgePart to IfcBuildingStorey).
During import, based on the IFC class of the element and its geometry type, SCIA converts it into a 1D member, 2D member, or “general volume” (Nemetschek, 2024b). The “general volume” elements are manually transformed into 1D/2D members using the built-in functions in SCIA’s BIM toolbox.
4.3.2.2 Model preparation for calculation
Boundary conditions and load cases are defined.
4.3.2.3 Calculation
The calculation is executed.
5 Results
5.1 Performance of template matching-based segmentation
Template matching-based segmentation enabled the classification of points in all classes expected. The segmentation result for Bridge 1 (the most incomplete point cloud) is illustrated in Figure 11.
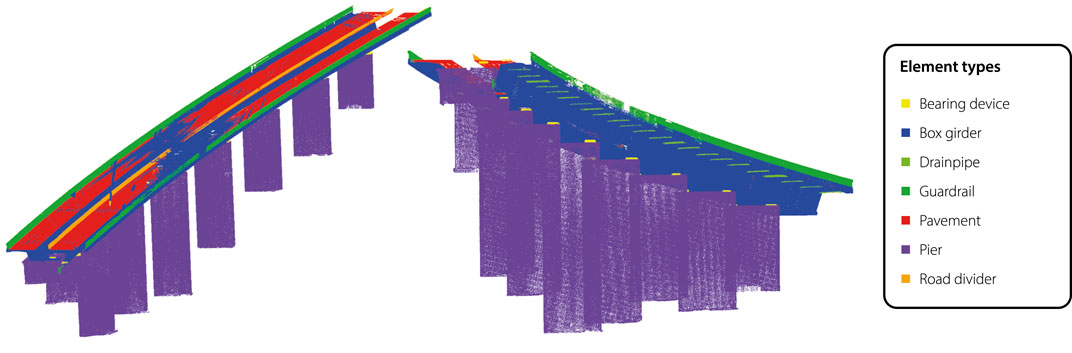
Figure 11. Segmentation result for Bridge 1.
Table 1 shows detailed results. The following matching scenarios are considered:
• True positive: the right element has been matched.
• True negative: no element has been matched, as expected.
• False positive: the wrong element has been matched.
• False negative: no element has been matched, which was not expected.

Table 1. Detailed results for semantic segmentation.
The obtained results are promising, with 99% and 98.5% success rates for the RC bridges tested (excluding the three matches manually checked by the user). The area-based template matching algorithm proved to be effective in matching elements that had not been completely acquired (Figure 12).
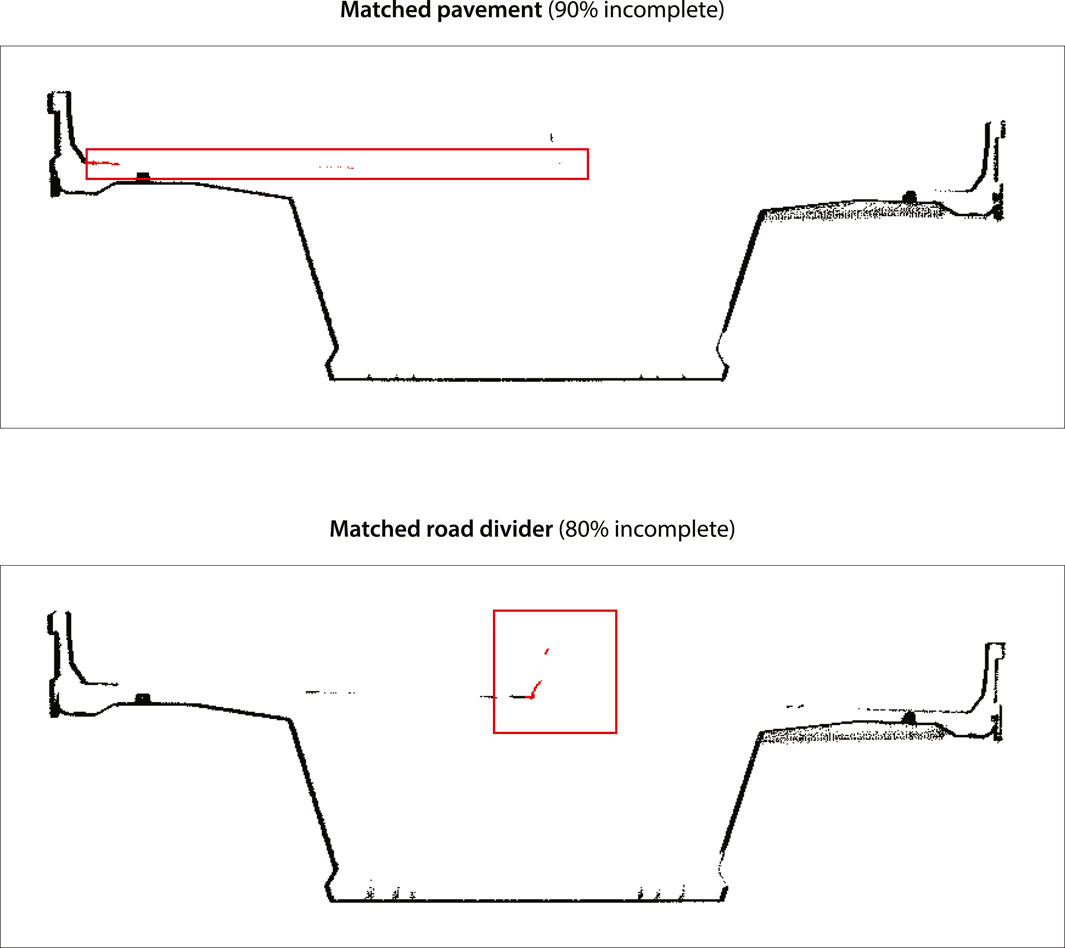
Figure 12. Incomplete elements matched.
Only a few elements could not be matched due to an insufficient number of points, hence the 1% and 1.5% failure. A further study demonstrated that matching remains reliable when the incompletion rate does not exceed 60%. Above 60% of incompletion, the failure rate increases significantly.
5.2 Performance of partitioning-based 3D shape modeling
The proposed approach facilitated modeling the 3D shape of all elements, including those with concave and curved parts. For some elements with complex geometry (e.g., guardrails) or located in areas with sparse point data, manual refinements were necessary. Resulting meshes are smooth, closed, and watertight.
To assess the accuracy of 3D shape modeling, original point clouds have been compared with generated meshes using Cyclone 3DR. The 3D deviation is calculated by projecting all points of the point cloud onto the mesh. For the bridges tested, an average deviation of 7.5 cm has been calculated. This level of accuracy is judged to be adequate for the considered use cases.
Modeling issues mainly affect curved elements, in particular box girders with corbelled decks and gussets. Elements having only planar faces (piers, road dividers, bearing devices) are more accurate (deviation < 1 cm).
5.3 Time required for tasks from PCD acquisition to the IFC model
Table 2 summarizes the average time observed for each process step outlined in Figures 2–4. Results are based on data collected for both tested bridges.
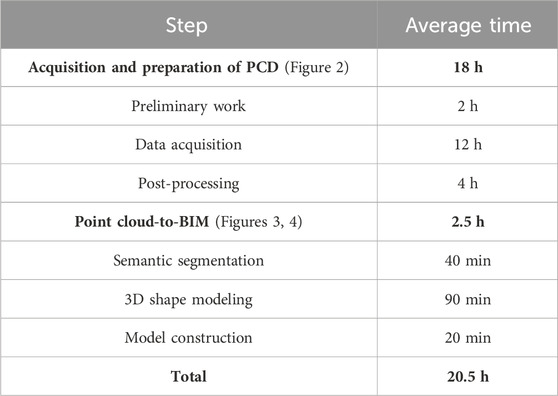
Table 2. Average time of tasks from PCD acquisition to IFC model.
Around 90% of the total time was dedicated to PCD acquisition and preparation, and 10% to semi-automated Point cloud-to-BIM (Table 2). Within the total time spent on PCD acquisition and preparation, the majority (around 70%) was attributed to on-site data acquisition, while around 20% was dedicated to post-processing. Post-processing primarily focused on measurement calibration and the removal of undesirable points (e.g., bridge surroundings).
However, these durations may vary significantly depending on factors such as the size and location of the bridge, accessibility conditions, the method and equipment used, weather conditions, etc.
Semi-automated point cloud-to-BIM takes an average of 2.5 h to complete (Table 2) on a workstation equipped with an 8-core CPU (3.0 GHz clock rate) and 256 GB of RAM. Semantic segmentation, which involves preparing templates and running template matching, has taken an average of 40 min, constituting around 30% of the total duration of the point cloud-to-BIM process.
The execution speed of the template matching and point labeling algorithm mainly depends on the point density and the length of the bridge (thus, the number of cross-sections to be processed). Since the bridges have relatively similar lengths (350 and 380 m) and the point clouds of both bridges have the same density (1 point every 5 cm), the time required for template matching and point labeling did not vary significantly between them. However, the preparation of templates took more time for the first bridge (25 min) than for the second (15 min), as some templates created for the first bridge could be reused for the second.
The 3D shape modeling represents the most time-consuming step in the point cloud-to-BIM process (60% of the total duration), as manual work is required to refine the created geometries. Creating all meshes with the partition-based modeling algorithm took an average of 20 min. However, more than an hour is required to refine the created meshes (i.e., correcting certain shapes, removing overlaps, and modeling non-visible parts).
The time spent on model construction (20 min, around 15%) is limited. The entire time is dedicated to developing the ontology used by Grasshopper to instantly structure the model.
6 Discussion
6.1 Strengths and weaknesses of proposed techniques for point cloud-to-BIM
6.1.1 Template matching-based segmentation
Template matching-based segmentation outperforms methods suggested in the literature (in particular Lu et al., 2019) when applied to RC bridges. Furthermore, it was demonstrated that template matching is robust even when point clouds are incomplete.
Another benefit of template matching-based segmentation is its versatility. Unlike rule-based methods, the procedure is not based on static rule sets tailored to a specific bridge type, but on templates that can be dynamically adapted to fit the particularities of the bridge being treated. Creating templates does not require advanced skills, beyond the use of image-editing software. It is therefore possible to deal with a wide range of structures as with learning-based methods but without the need to provide very large training data sets beforehand.
However, further tests on cantilever and truss bridges show that this approach performs poorly when the bridge contains elements that are neither oriented parallelly nor orthogonally to the bridge axis, or whose cross-section varies. This is a limitation of area-based algorithms, which are unable to handle differences in scale and rotation. In this context, manual checks by the user are useful, as they help to limit wrong matches.
6.1.2 Partitioning-based 3D shape modeling
Partitioning-based 3D shape modeling, in contrast to other surface reconstruction methods such as Alpha shape, is effective for creating a closed, watertight mesh in the case where one or many faces of the element are missing in PCD.
Its weaknesses are:
• Sensitivity to noise and outliers, leading to the emergence of strange, undesired results during the calculation of convex hulls.
• High dependency on user parameters (number of discretizations and overlap distance).
• Need for substantial manual work to adjust certain shapes and complete missing parts.
6.1.3 Practical applicability
In terms of practical applicability, the two proposed methods (template matching-based segmentation and partitioning-based 3D shape reconstruction) were evaluated against specific requirements, established with the assistance of research partners and experienced users.
Requirements were:
• Implemented using open-source tools/libraries.
• Minimal preprocessing of inputs and outputs.
• Support of noisy and incomplete point clouds.
• Adaptable to various RC bridges.
• User-friendly.
The proposed template matching-based segmentation algorithm effectively meets all these requirements. It has been fully developed as open source (using Python), proving to be robust enough to require minimal preprocessing of inputs. It has demonstrated its effectiveness on noisy/sparse data and can be easily adapted to different reinforced concrete (RC) bridge structures by modifying the templates. Moreover, the output data can be directly used for geometric reconstruction. Improvements such as the utilization of a feature-based template matching algorithm could enhance detection quality (scale and rotation invariant), thus enabling the application of this methodology to other bridge types, e.g., truss and cantilever bridges.
In the case of RC bridges, the template matching-based method offers an appealing alternative to other solutions proposed in the literature.
However, partitioning-based 3D shape reconstruction does not fully meet all criteria. The presence of outliers affects the quality of results, necessitating pre-processing of point cloud data to remove them, which can be time-consuming. Additionally, its implementation is not straightforward, as users must define discretization and overlap values based solely on intuition during configuration. One approach is to arbitrarily choose initial values and iteratively adjust them based on the obtained results.
Enhancements could involve the automatic calculation of discretization and overlap parameters, tailored to the object’s geometry and the density of the point cloud.
At present, partitioning-based template matching remains highly valuable, especially in cases where element faces are missing in the point cloud data.
6.2 Benefits of semi-automated point cloud-to-BIM over manual modeling
To evaluate the efficiency of the proposed method for bridge modeling, Bridge 1 has been modeled applying two different methods:
1. Manually, using point clouds.
2. Manually, without using point clouds.
Methods have then been compared to the proposed semi-automatic approach, based on PCD. The hypothesis of this test is, that all necessary documents for modeling the structure (plans, etc.) are available and up-to-date. Additionally, it is assumed that the modeler has already analyzed these documents.
The software employed is Revit 2024, a widely used BIM authoring tool suitable for modeling bridges and capable of exporting data in IFC 4.3 format.
The targeted model accuracy corresponds to that achieved with the semi-automated. Given that the time required to create the IFC model using the semi-automated method is 2.5 h (Table 2), manual approaches are evaluated based on the results obtained within the same time.
For manual modeling using point clouds, PCD were imported into Revit, and elements were redrawn on top using custom parametric families. After 2.5 h, all piers and bearing devices have been modeled. Modeling of the superstructure and deck had only just started. The estimated time to complete the modeling is a minimum of 3 h, resulting in a total modeling time of 5.5 h (+120% compared to semi-automatic modeling).
For manual modeling without using point clouds, plans are imported into Revit to facilitate the positioning of elements, and photos are used to verify whether the model corresponds to reality. After 2.5 h, only 80% of the piers have been modeled. The bearing devices are missing, as well as the superstructure and the deck. The estimated time to complete the modeling is a minimum of 6 h, resulting in a total modeling time of 8.5 h (+240% compared to semi-automatic modeling).
Results confirm that semi-automated point cloud-to-BIM significantly saves time compared to manual modeling, whether it is based on point clouds or not. Therefore, considering the large number of existing bridges, for which no digital model exists, the choice of an efficient modeling method is a significant support for maintenance activities.
It has been observed, that PCD facilitates a clearer understanding of the geometry and positioning of an element in space, thereby enhancing efficiency. However, plans and photos play a crucial role in completing specific details and modeling invisible parts. Hence, semi-automated point cloud-to-BIM should not be contrasted with manual modeling from plans and photos; rather, both approaches complement each other.
The time spent on acquiring and preparing PCD (average of 18 h—see Table 2) is not an issue if the PCD are also used for other use cases, such as automatic defect detection, which completes the DT. Fully integrated workflows, integrating this aspect, have been suggested (Vilgertshofer et al., 2023).
6.3 Impact of digital models on maintenance activities
Two experimental use cases simulated the integration of created models in maintenance and structural analysis activities. The primary focus was on establishing a continuous digital workflow from PCD toward the objectives of the two use cases.
The first use case (defects tracking) aimed to enable an operator to localize structural defects (by visualizing the 3D model) and access all related available information.
Practice showed that the integration of defects into the model, using a simple color code to identify their severity (Figure 13), led to a better appreciation of the overall bridge condition. Furthermore, operators are relieved from the manual task of retrieving and filtering information regarding the defects or bridge part of interest.
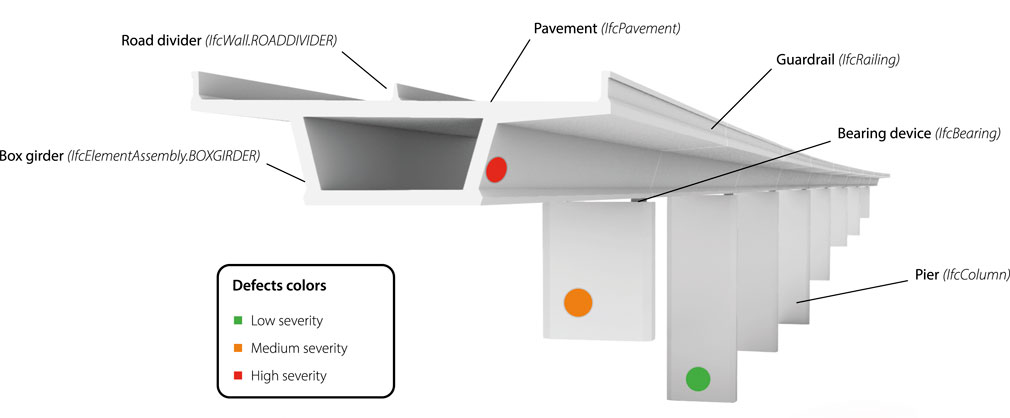
Figure 13. Created model for Bridge 1, integrating defects.
The second use case (structural analysis) aimed to import the IFC model into structural analysis software and perform calculations based on the analytical model generated from the IFC model.
The time required to implement the analytical model from the IFC model (using the “BIM toolbox” of SCIA) was compared to the scenario where the model is created from scratch.
The use of the IFC model reduced the implementation time of the analytical model by approximately 20%. Generating analytical elements from IFC objects is instantaneous, but substantial work is needed to adjust them and complete the analytical model, as the IFC model lacks detail, particularly regarding structural elements like rebars. This nullifies the time benefits.
Time savings can be primarily attributed to the automatic definition of model data (self-weight, materials, etc.), as this is automatically done during IFC model import. The outcome could be improved if the created models were more detailed, and if the MVD designed for exchanging structural analysis models would be supported by software vendors.
Implementing the “Structural Analysis View” MVD (buildingSMART, 2024c) would reduce information losses when importing an IFC model into a structural analysis software, and thus minimize correction and completion efforts required before calculation. Unfortunately, the authors are not aware of software that is certified for the import and/or export of this MVD.
7 Conclusion and future work
The objective of BridgeTwin was to define a systematic process for creating semi-automatically an IFC bridge model from point clouds. The expected outcome was a clear, structured process map, specifying the actors involved, the tasks to be performed, and the deliverables. Implementing this workflow should enable stakeholders to create and exploit IFC bridge models to support maintenance activities.
The resulting process map details the procedures for acquiring and preparing PCD, creating IFC models from PCD (point cloud-to-BIM), and implementing the use case “database querying based on IFC models for maintenance planning”.
Automated point cloud-to-BIM is a critical part of the process, as it involves performing complex tasks using advanced solutions that are still largely unproven in practice. Novel methods have been proposed for semantic segmentation (template matching-based segmentation) and 3D shape modeling (partitioning-based modeling), allowing partial point clouds to be processed.
A case study demonstrated that the proposed solutions performed well for the tested RC bridges. Template matching-based segmentation success rate reached 98.5%–99.0%, and elements were efficiently detected even with a small number of points. In terms of accuracy, this approach surpasses those suggested in the literature for similar RC bridges, however, it performs poorly on more complex bridges such as cantilever and truss bridges. It is planned to improve this method in future work, using a more efficient template matching algorithm.
Partitioning-based modeling enabled the creation of smooth, closed, and watertight meshes from incomplete point sets. An average deviation of 7.5 cm between the obtained models and the original point clouds was calculated. This deviation is judged acceptable for visualization, but unsatisfactory for more complex applications such as strain analysis. In cases where high accuracy is required, and provided the point clouds are complete, other modeling methods should be considered.
A comparative analysis between semi-automated and manual modeling revealed time savings ranging from 120% to 240%. The use of PCD streamlines the modeling process and ensures geometric accuracy to the existing asset. However, manual modeling from plans is still necessary to complete the model (i.e., modeling non-visible or partially visible elements like foundations, abutments, etc.) and to detail the model according to specific use case needs, like rebars for structural analysis.
Integrating automatic modeling of non-visible elements from 2D documents into the workflow, as discussed by Zhang et al., 2021, could be a valuable enhancement.
The two tested use cases (defect tracking and structural analysis), although very simple, have demonstrated that IFC bridge models could facilitate the work of operators in the context of bridge operation and maintenance.
This marks an initial step toward fully integrated asset management, based on digital twins.
Data availability statement
The original contributions presented in the study are publicly available. This data can be found here: https://doi.org/10/gtzbkx.
Author contributions
YS: Writing–original draft, Writing–review and editing. BD: Writing–review and editing.
Funding
The author(s) declare that financial support was received for the research, authorship, and/or publication of this article. This research was supported by the University of Applied Sciences and Arts Western Switzerland in the framework of the project BridgeTwin, co-directed by Haute École du Paysage, d’Ingénierie et d’Architecture de Genève (HEPIA) and Haute École d’Ingénierie et de Gestion du canton de Vaud (HEIG-VD).
Acknowledgments
The authors would like to thank Fabian Boujon for his contribution to the segmentation algorithm and the development of the general workflow, Prof. Bertrand Cannelle and Kilian Morel for their work on PCD acquisition and processing, Marco Viviani, Mattia Franciosi, and Vincenzo Savino for their work on the “structural analysis” use case, and the Swiss Federal Roads Office (ASTRA/OFROU) for the constructive discussions regarding the “defect tracking” use case.
Conflict of interest
The authors declare that the research was conducted in the absence of any commercial or financial relationships that could be construed as a potential conflict of interest.
The author(s) declared that they were an editorial board member of Frontiers, at the time of submission. This had no impact on the peer review process and the final decision.
Publisher’s note
All claims expressed in this article are solely those of the authors and do not necessarily represent those of their affiliated organizations, or those of the publisher, the editors and the reviewers. Any product that may be evaluated in this article, or claim that may be made by its manufacturer, is not guaranteed or endorsed by the publisher.
References
Ahmed, M., Guillemet, A., Shahi, A., Haas, C., West, J., and Haas, R. (2011). “Comparison of point-cloud acquisition from laser-scanning and photogrammetry based on field experimentation,” in Proceedings of the Canadian society of civil engineering annual conference 2011.
Akdim, A., Mahdaoui, A., Roukhe, H., Hseini, A. M., and Bouazi, A. (2022). A study and comparison of different 3D reconstruction methods following quality criteria. ijasca 14, 125–137. doi:10.15849/IJASCA.221128.09
Andrey, D., Suter, R., and Favre, R. (1985). Surveillance des ouvrages d’art. doi:10.5169/SEALS-75621
Artus, M., Alabassy, M. S. H., and Koch, C. (2022). A BIM based framework for damage segmentation, modeling, and visualization using IFC. Appl. Sci. 12, 2772. doi:10.3390/app12062772
Bay, H., Ess, A., Tuytelaars, T., and Van Gool, L. (2008). Speeded-up robust features (SURF). Comput. Vis. Image Underst. 110, 346–359. doi:10.1016/j.cviu.2007.09.014
Bernardini, F., Mittleman, J., Rushmeier, H., Silva, C., and Taubin, G. (1999). The ball-pivoting algorithm for surface reconstruction. IEEE Trans. Vis. Comput. Graph. 5, 349–359. doi:10.1109/2945.817351
Bertola, N. J., and Smith, I. F. C. (2019). A methodology for measurement-system design combining information from static and dynamic excitations for bridge load testing. J. Sound Vib. 463, 114953. doi:10.1016/j.jsv.2019.114953
Bolles, R. C., and Fischler, M. A. (1981) “A RANSAC-based approach to model fitting and its application to finding cylinders in range data,” in Proceedings of the 7th international joint conference on Artificial intelligence - volume 2 (IJCAI’81), 637–643.
buildingSMART (2024a). buildingSMART Technical. Available at: https://technical.buildingsmart.org/(Accessed January 17, 2024).
buildingSMART (2024b). IFC 4.3.2 documentation. Available at: https://ifc43-docs.standards.buildingsmart.org/(Accessed January 12, 2024).
buildingSMART (2024c). IFC certified software - buildingSMART international. Available at: https://www.buildingsmart.org/compliance/software-certification/certified-software/(Accessed March 26, 2024).
buildingSMART (2024d). MVD database. Available at: https://technical.buildingsmart.org/standards/ifc/mvd/mvd-database/(Accessed January 17, 2024).
Çelik, F., Herbers, P., and König, M. (2024). “Image segmentation on concrete damage for augmented reality supported inspection tasks,” in Advances in information technology in civil and building engineering. Editors S. Skatulla, and H. Beushausen (Cham: Springer International Publishing), 237–252. doi:10.1007/978-3-031-35399-4_19
CGAL (2024). The computational geometry algorithms library. Available at: https://www.cgal.org/(Accessed January 17, 2024).
Chan, B., Guan, H., Jo, J., and Blumenstein, M. (2015). Towards UAV-based bridge inspection systems: a review and an application perspective. Struct. Monit. Maintenance 2, 283–300. doi:10.12989/SMM.2015.2.3.283
Chen, H., and Lin, H. (2021). An effective hybrid atrous convolutional network for pixel-level crack detection. IEEE Trans. Instrum. Meas. 70, 1–12. doi:10.1109/TIM.2021.3075022
Domer, B., and Bernardello, R. (2023). Interoperability - an introduction to IFC and buildingSmart standards integrating infrastructure modeling. Lausanne, Switzerland: EPFL Press.
Eastman, C. M., Teicholz, P. M., Sacks, R., and Lee, G. (2018) BIM handbook: a guide to building information modeling for owners, managers, designers, engineers and contractors. Hoboken, New Jersey: Wiley.
Edelsbrunner, H., Kirkpatrick, D., and Seidel, R. (1983). On the shape of a set of points in the plane. IEEE Trans. Inf. Theory 29, 551–559. doi:10.1109/TIT.1983.1056714
Fischer, K. (2000). Introduction to alpha shapes. Available at: https://graphics.stanford.edu/courses/cs268-11-spring/handouts/AlphaShapes/as_fisher.pdf.
Fougerolle, Y. D., Gribok, A., Foufou, S., Truchetet, F., and Abidi, M. A. (2005). Boolean operations with implicit and parametric representation of primitives using R-functions. IEEE Trans. Vis. Comput. Graph. 11, 529–539. doi:10.1109/TVCG.2005.72
Franciosi, M., Kasser, M., and Viviani, M. (2024). Digital twins in bridge engineering: streamlining maintenance and enhancing sustainability. HEIG-VD, University of Applied Sciences and Arts Western Switzerland.
GIMP (2023). GIMP - GNU image manipulation program. Available at: https://www.gimp.org/(Accessed January 17, 2024).
Girardeu-Monteau, D. (2021). CloudCompare - open source project. Available at: https://www.danielgm.net/cc/(Accessed January 17, 2024).
Guo, Y., Wang, H., Hu, Q., Liu, H., Liu, L., and Bennamoun, M. (2019) Deep learning for 3D point clouds: a survey. doi:10.48550/ARXIV.1912.12033
Hackel, T., Wegner, J. D., and Schindler, K. (2016). Fast semantic segmentation of 3d point clouds with strongly varying density. ISPRS Ann. Photogramm. Remote Sens. Spat. Inf. Sci. III (3), 177–184. doi:10.5194/isprsannals-III-3-177-2016
HEPIA (2022). BridgeTwin. Available at: https://www.hesge.ch/hepia/recherche-developpement/projets-recherche/bridgetwin (Accessed January 17, 2024).
Hong, G., and Zhang, Y. (2007). “Combination of feature-based and area-based image registration technique for high resolution remote sensing image,” in 2007 IEEE international geoscience and remote sensing symposium (Barcelona, Spain: IEEE), 377–380. doi:10.1109/IGARSS.2007.4422809
Hu, Q., Yang, B., Xie, L., Rosa, S., Guo, Y., Wang, Z., et al. (2019). RandLA-net: efficient semantic segmentation of large-scale point clouds. doi:10.48550/ARXIV.1911.11236
Isailović, D., Stojanovic, V., Trapp, M., Richter, R., Hajdin, R., and Döllner, J. (2020). Bridge damage: detection, IFC-based semantic enrichment and visualization. Automation Constr. 112, 103088. doi:10.1016/j.autcon.2020.103088
ISO (2013) ISO/IEC 19510:2013 - information technology — object management group business process model and notation. Available at: https://www.iso.org/standard/62652.html.
Kazhdan, M., Bolitho, M., and Hoppe, H. (2006). “Poisson surface reconstruction,” in Symposium on geometry processing, 10. doi:10.2312/SGP/SGP06/061-070
Kazhdan, M., and Hoppe, H. (2013). Screened Poisson surface reconstruction. ACM Trans. Graph. 32, 1–13. doi:10.1145/2487228.2487237
Lafarge, F., Keriven, R., and Brédif, M. (2010). Insertion of 3-D-primitives in mesh-based representations: towards compact models preserving the details. IEEE Trans. Image Process 19, 1683–1694. doi:10.1109/TIP.2010.2045695
Lee, J. S., Park, J., and Ryu, Y.-M. (2021). Semantic segmentation of bridge components based on hierarchical point cloud model. Automation Constr. 130, 103847. doi:10.1016/j.autcon.2021.103847
Leica Geosystems (2024). Leica Geosystems - home. Available at: https://leica-geosystems.com/en-us/(Accessed January 17, 2024).
Li, L., Sung, M., Dubrovina, A., Yi, L., and Guibas, L. (2018). Supervised fitting of geometric primitives to 3D point clouds. doi:10.48550/ARXIV.1811.08988
Lowe, D. G. (1999). “Object recognition from local scale-invariant features,” in Proceedings of the seventh IEEE international Conference on computer vision, (kerkyra, Greece: ieee), 2, 1150–1157. doi:10.1109/ICCV.1999.790410
Lu, R., Brilakis, I., and Middleton, C. R. (2019). Detection of structural components in point clouds of existing RC bridges. Comput. aided Civ. Eng. 34, 191–212. doi:10.1111/mice.12407
Ma, Z., and Liu, S. (2018). A review of 3D reconstruction techniques in civil engineering and their applications. Adv. Eng. Inf. 37, 163–174. doi:10.1016/j.aei.2018.05.005
Mafipour, M. S., Vilgertshofer, S., and Borrmann, A. (2023). “Digital twinning of bridges from point cloud data by deep learning and parametric models,” in Ecppm 2022 - eWork and eBusiness in architecture, engineering and construction 2022 (London: CRC Press), 543–550. doi:10.1201/9781003354222-69
Marchand, M. (2018). Optimisation du traitement de nuage de points pour la production de plan de façade au sein d’un cabinet de géomètre-expert. Sci. l’ingénieur [physics]. Available at: https://dumas.ccsd.cnrs.fr/dumas-02093629.
Martens, J., Blut, T., and Blankenbach, J. (2023). Cross domain matching for semantic point cloud segmentation based on image segmentation and geometric reasoning. Adv. Eng. Inf. 57, 102076. doi:10.1016/j.aei.2023.102076
Mirtschin, J. (2024). ggRhinoIFC - geometry gym. Available at: https://technical.geometrygym.com/rhino-grasshopper/ifc (Accessed January 17, 2024).
Morel, K., and Schatz, Y. (2023). BridgeTwin - Des relevés 3D aux jumeaux numériques des ponts. Available at: https://georomandie.com/storage/app/media/presentations/parrallele_E/JRG2023_Session-E_Morel-Schatz.pdf.
Nemetschek (2024a). SCIA engineer. Available at: https://www.scia.net/fr/scia-engineer (Accessed March 22, 2024).
Nemetschek (2024b). SCIA Engineer documentation. Available at: https://help.scia.net/22.0/en/data_transfer/ifc/ifc_manual.htm?tocpath=Data%20exchange%7CIFC%7C_____1 (Accessed March 22, 2024).
Oberbroeckling, L. A. (2021). Programming mathematics using MATLAB. London ; San Diego, CA: Academic Press, imprint of Elsevier.
Open3D (2018). Surface reconstruction — open3D 0.12.0 documentation. Available at: https://www.open3d.org/docs/0.12.0/tutorial/geometry/surface_reconstruction.html (Accessed January 17, 2024).
Open3D (2023). Open3D 0.18.0 documentation. Available at: https://www.open3d.org/docs/release/(Accessed January 17, 2024).
OpenCV (2024a). OpenCV - open computer vision library. Available at: https://opencv.org/(Accessed January 17, 2024).
OpenCV (2024b). OpenCV - template matching. Available at: https://docs.opencv.org/3.4/d4/dc6/tutorial_py_template_matching.html (Accessed January 17, 2024).
Pătrăucean, V., Armeni, I., Nahangi, M., Yeung, J., Brilakis, I., and Haas, C. (2015). State of research in automatic as-built modelling. Adv. Eng. Inf. 29, 162–171. doi:10.1016/j.aei.2015.01.001
Pu, X., Gan, S., Yuan, X., and Li, R. (2022). Feature analysis of scanning point cloud of structure and research on hole repair technology considering space-ground multi-source 3D data acquisition. Sensors 22, 9627. doi:10.3390/s22249627
Qi, C. R., Su, H., Mo, K., and Guibas, L. J. (2016). PointNet: deep learning on point sets for 3D classification and segmentation. doi:10.48550/ARXIV.1612.00593
Qi, C. R., Yi, L., Su, H., and Guibas, L. J. (2017). PointNet++: deep hierarchical feature learning on point sets in a metric space. doi:10.48550/ARXIV.1706.02413
Qin, G., Zhou, Y., Hu, K., Han, D., and Ying, C. (2021). Automated reconstruction of parametric BIM for bridge based on terrestrial laser scanning data. Adv. Civ. Eng. 2021, 1–17. doi:10.1155/2021/8899323
Rashdi, R., Martínez-Sánchez, J., Arias, P., and Qiu, Z. (2022). Scanning technologies to building information modelling: a review. Infrastructures 7, 49. doi:10.3390/infrastructures7040049
Rausch, C., Zhao, Y., and Haas, C. (2020). Parametric or non-parametric? Understanding the inherent trade-offs between forms of object representation. Japan: Kitakyushu. doi:10.22260/ISARC2020/0036
Rezaie, A., Achanta, R., Godio, M., and Beyer, K. (2020). Comparison of crack segmentation using digital image correlation measurements and deep learning. Constr. Build. Mater. 261, 120474. doi:10.1016/j.conbuildmat.2020.120474
RIEGL (2023). RIEGL VZ-2000i documentation. Available at: http://www.riegl.com/uploads/tx_pxpriegldownloads/RIEGL_VZ-2000i_Infosheet_2019-09-02.pdf (Accessed January 17, 2024).
Robert McNeel and Associates (2024). Rhino - Rhinoceros 3D. Available at: https://www.rhino3d.com/(Accessed January 17, 2024).
Rocha, G., and Mateus, L. (2021). A survey of scan-to-BIM practices in the AEC industry—a quantitative analysis. IJGI 10, 564. doi:10.3390/ijgi10080564
Roy, K., Ogai, H., Bhattacharya, B., Ray-Chaudhuri, S., and Qin, J. (2012). Damage detection of bridge using wireless sensors. IFAC Proc. Vol. 45, 107–111. doi:10.3182/20120910-3-JP-4023.00042
Rublee, E., Rabaud, V., Konolige, K., and Bradski, G. (2011). “ORB: an efficient alternative to SIFT or SURF,” in 2011 international conference on computer vision (Barcelona, Spain: IEEE), 2564–2571. doi:10.1109/ICCV.2011.6126544
Sacks, R., Kedar, A., Borrmann, A., Ma, L., Brilakis, I., Hüthwohl, P., et al. (2018). SeeBridge as next generation bridge inspection: overview, information delivery manual and model view definition. Automation Constr. 90, 134–145. doi:10.1016/j.autcon.2018.02.033
Schatz, Y., and Domer, B. (2023). “Template matching-based method to detect bridge components in point clouds,” in Proceedings of the 30th EG-ICE: international conference on intelligent computing in engineering.
Schenk, T. (2005). Introduction to photogrammetry. Available at: https://www.mat.uc.pt/∼gil/downloads/IntroPhoto.pdf.
Schnabel, R., Wahl, R., and Klein, R. (2007). Efficient RANSAC for point-cloud shape detection. Comput. Graph. Forum 26, 214–226. doi:10.1111/j.1467-8659.2007.01016.x
Son, H., Kim, C., and Turkan, Y. (2015). Scan-to-BIM - an overview of the current state of the art and a look ahead. (Oulu, Finland). doi:10.22260/ISARC2015/0050
Stachniss, C. (2021). Image template matching using cross correlation. Available at: https://www.ipb.uni-bonn.de/html/teaching/photo12-2021/2021-pho1-09-matching-cc.pptx.pdf.
Swaroop, P., and Sharma, N. (2016). An overview of various template matching methodologies in image processing. IJCA 153, 8–14. doi:10.5120/ijca2016912165
Tang, P., Huber, D., Akinci, B., Lipman, R., and Lytle, A. (2010). Automatic reconstruction of as-built building information models from laser-scanned point clouds: a review of related techniques. Automation Constr. 19, 829–843. doi:10.1016/j.autcon.2010.06.007
Tekinerdogan, B. (2022). On the notion of digital twins: a modeling perspective. Systems 11, 15. doi:10.3390/systems11010015
Truong-Hong, L., and Lindenbergh, R. (2022). Automatically extracting surfaces of reinforced concrete bridges from terrestrial laser scanning point clouds. Automation Constr. 135, 104127. doi:10.1016/j.autcon.2021.104127
Vilgertshofer, S., Mafipour, M. S., Borrmann, A., Martens, J., Blut, T., Becker, R., et al. (2023). “TwinGen: advanced technologies to automatically generate digital twins for operation and maintenance of existing bridges,” in Ecppm 2022 - eWork and eBusiness in architecture, engineering and construction 2022 (London: CRC Press), 213–220. doi:10.1201/9781003354222-27
W3C (2012). OWL 2 web ontology language primer. Second Edition. Available at: https://www.w3.org/TR/2012/REC-owl2-primer-20121211/(Accessed October 6, 2021).
Wang, Q., Tan, Y., and Mei, Z. (2020). Computational methods of acquisition and processing of 3D point cloud data for construction applications. Arch. Comput. Methods Eng. 27, 479–499. doi:10.1007/s11831-019-09320-4
Wyatt-Spratt, S. (2018). Scanning vs Photogrammetry: the pros and cons of different 3D modelling techniques. doi:10.13140/RG.2.2.28510.87366
Xia, T., Yang, J., and Chen, L. (2022). Automated semantic segmentation of bridge point cloud based on local descriptor and machine learning. Automation Constr. 133, 103992. doi:10.1016/j.autcon.2021.103992
Yang, X., Del Rey Castillo, E., Zou, Y., Wotherspoon, L., and Tan, Y. (2022). Automated semantic segmentation of bridge components from large-scale point clouds using a weighted superpoint graph. Automation Constr. 142, 104519. doi:10.1016/j.autcon.2022.104519
Keywords: BIM, IFC, point clouds, scan-to-BIM, bridges, maintenance, asset management, interoperability
Citation: Schatz Y and Domer B (2024) Semi-automated creation of IFC bridge models from point clouds for maintenance applications. Front. Built Environ. 10:1375873. doi: 10.3389/fbuil.2024.1375873
Received: 24 January 2024; Accepted: 30 May 2024;
Published: 24 June 2024.
Edited by:
Yves Reuland, ETH Zürich, SwitzerlandReviewed by:
Youqi Zhang, Aalto University, FinlandJeffrey Scott Weidner, The University of Texas at El Paso, United States
Copyright © 2024 Schatz and Domer. This is an open-access article distributed under the terms of the Creative Commons Attribution License (CC BY). The use, distribution or reproduction in other forums is permitted, provided the original author(s) and the copyright owner(s) are credited and that the original publication in this journal is cited, in accordance with accepted academic practice. No use, distribution or reproduction is permitted which does not comply with these terms.
*Correspondence: Yohann Schatz, eW9oYW5uLnNjaGF0ekBoZXNnZS5jaA==