 Ali Alhussain
 José P. Duarte
 Nathan C. Brown
- 1Department of Architectural Engineering, The Pennsylvania State University, State College, PA, United States
- 2Department of Architectural Engineering, King Fahd University of Petroleum and Minerals, Dhahran, Saudi Arabia
- 3Stuckeman Center for Design Computing, Stuckeman School of Architecture and Landscape Architecture, The Pennsylvania State University, State College, PA, United States
With the growing global need for housing and infrastructure, 3D concrete printing (3DCP) has emerged as an innovative construction method offering several potential benefits including design flexibility, speed, and sustainability. However, enhancing the reliability of 3DCP involves managing a variety of parameters that influence various aspects of the 3D printed structure. Process parameters like nozzle velocity, nozzle diameter, nozzle height, and material flow velocity have a major impact on the structural stability and filament shape. This project aimed to develop fast and accurate data-driven models for predicting and classifying filament shape based on process parameters. A print experiment systematically varied process parameters across 144 samples. The resulting filament geometry (width, height, contact width) was measured and classified by quality. Models were trained on this data to predict filament width, contact width, filament height, and classify filaments. These models can be utilized with any buildable material - a material with a high enough yield stress to bear the weight of upper layers without significant deformation. This condition does not restrict this study’s scope as it is a prerequisite for all 3DCP applications. The models’ robustness and generalizability were confirmed through validation on literature data across various printable materials and setups. These data-driven models can aid in optimizing parameters, generating variable width filaments, and printing non-planar layers. By linking print inputs to filament outputs, this comprehensive modeling approach advances 3DCP research for more reliable and versatile concrete printing.
1 Introduction
The world’s population is growing, and with it comes an increased need for housing and infrastructure. By 2025, it’s estimated that 3 billion people will require new affordable homes - that’s 96,000 homes that need to be built every day (UN-Habitat, 2022). To address this challenge, an innovative technology called 3D concrete printing (3DCP) has emerged. It offers several benefits over traditional building methods (Tay et al., 2017). 3D printing can produce complex and unique structures with high accuracy and precision. This enables the creation of more sustainable and creative designs that can be customized to meet specific needs. Additionally, 3DCP can speed up construction times, lower labor costs, and improve construction safety. It also allows for using sustainable materials like recycled concrete, reducing waste and minimizing the environmental impact of construction (El-Sayegh et al., 2020).
Despite its advantages, 3DCP is a relatively new technology that requires more research and development to improve the reliability of the printing system and the material (Mohan et al., 2021). Dealing with the large number of variables in the 3DCP process is one of the main challenges. These variables can be broadly classified into three categories: those related to the material, the process, and the design of the structure being printed. Material variables encompass aspects such as material yield stress, structuration rate, viscosity and density. Process variables include nozzle velocity, material flow velocity, nozzle diameter, and nozzle height. Finding the optimal combination of all of them is a complex task, often approached through trial-and-error methods. However, evaluating the performance of each aspect in the printing process and optimizing the parameters accordingly can address the complexity of the system.
The 3D printing of cementitious materials involves 4 main steps (Perrot et al., 2021): mixing the material, delivering it to the printhead, depositing successive layers to form the 3D object, and post-print drying and curing. The deposition step which is the focus of this study is crucial as it directly impacts the final product’s shape, stability and quality. Precise, consistent deposition ensures the final print matches intended design specifications. By evaluating this step, one can adjust these parameters to improve the efficiency of the process and prevent possible failures or deformations in the structure, thereby saving time, resources, and ensuring a successful print.
The authors of this paper identified seven criteria that describe performance during the depositing stage:
• Criteria 1 - Filament is self-supported (Carneau et al., 2022)
• Criteria 2 - No deformation from pressing stress (Carneau et al., 2022)
• Criteria 3 - Avoid plastic collapse (Perrot et al., 2016; Roussel, 2018)
• Criteria 4 - Prevent elastic buckling (Roussel, 2018)
• Criteria 5 - Avoid cold joints (Wangler et al., 2016)
• Criteria 6 - Maintain desired filament width
• Criteria 7 - Ensure consistent filament geometry
To perform an optimization, the criteria need to be evaluated using a fast simulation technique. This is because in the optimization process, performance will be evaluated multiple times with different variable combinations each time. Therefore, analytical models or data-driven models are most suitable for this application due to their speed. Numerical models, while accurate, are too slow for this application (Comminal et al., 2020).
The first five criteria have analytical models that are fast, and their accuracy has been evaluated which makes their evaluation in the optimization process feasible. However, for the last two criteria - ensuring that the printed filament width equals the desired width and that the extruded filament is consistent and controllable - only numerical methods are available. There is an analytical model for filament width simulation, but it was built based on unproven assumptions which will be discussed in this study (Carneau et al., 2022).
This project aimed to develop fast and accurate data-driven models for predicting and classifying the shape of the filament, taking into account variables including nozzle velocity, material flow velocity, nozzle height, and nozzle diameter. An experimental print was conducted using various parameter combinations, and the printed filaments were cut and scanned to gather data related to the shape and quality of the filament. This data served as the basis for training the prediction and classification models which have multiple applications. They can help in optimizing process parameters and facilitate creating non-planar layers and filament with variable width. These models are promising for use with any buildable material, which means that the material should meet the first three criteria listed before. In other words, there should be minimal deformation in the printed filament, which can be achieved by increasing the time gap between layer printing or using a mix with faster hardening rate. Satisfying these criteria does not restrict this study’s scope as it is a prerequisite for almost all 3DCP applications. However, it’s important to note that the developed models are designed for the layer pressing approach with circular nozzle geometries and do not directly apply to the infinite brick printing approach.
2 Literature review
2.1 Extrusion approaches for 3D concrete printing
Two main approaches have been recognized in the 3DCP field (Roussel, 2018; Carneau et al., 2022). The first is called “Infinite Brick Extrusion”, in which the material has high yield stress and low thixotropy, resulting in almost unsheared extrusion layers that have a cross-section similar to the nozzle orifice which is usually a rectangular section (Roussel et al., 2020). This method usually produces a smooth and flat finish. However, it restricts the amount of geometric freedom available and increases the chance of filament tearing, especially at sharp corners.
The second approach, known as “Layer Pressing”, uses a material with low initial yield stress and high thixotropy through a circular nozzle. The material is then pressed between the nozzle and the previous layer, forming an oblong cross-section. The height of the layer is determined by the nozzle height, while the width can be adjusted by changing the nozzle velocity, the material flow velocity, or the nozzle height. The two extrusion approaches are illustrated in Figure 1.
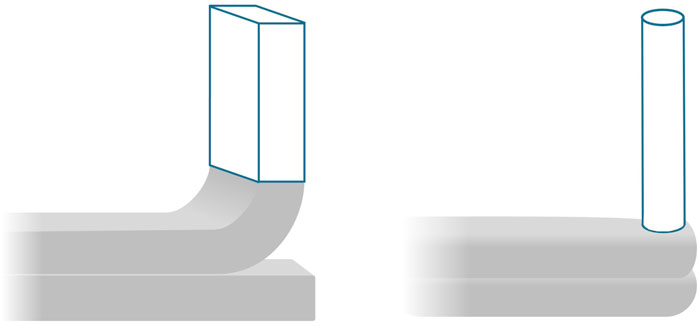
FIGURE 1. A comparison of two primary 3DCP approaches at the nozzle level: infinite brick extrusion (on the left) and layer pressing (on the right).
The layer pressing technique has several advantages for 3D concrete printing. It allows for precise control of the upper surface position of each layer, avoiding any vertical error accumulation and ensuring accuracy in the final product (Roussel, 2018). It also enables varying the layer thickness and inclination throughout the printing process, expanding the design possibilities, and allowing for more complex geometries. Moreover, it uses a circular nozzle, which gives more freedom to the robot path and avoids layer twisting issues (Bos et al., 2016). In addition, it increases the bond strength between the layers due to the pressure applied by the nozzle (Pan et al., 2022). However, it also increases the risk of sub-layer distortion due to the material pressure (Carneau et al., 2022).
This study investigates the layer pressing technique and its potential to create different filament geometries with a single circular nozzle.
2.2 Process parameters impact on filament geometry
This section outlines how process parameters affect filament shape in material extrusion, highlighting three distinct behaviors and their implications on the final product’s quality and stability.
2.2.1 Process parameters
The filament shape is determined by a combination of process and material parameters. Process parameters including nozzle velocity (VN), material flow velocity (VM), nozzle height (HN), and nozzle diameter (D) are shown in Figure 2. A single dimensionless parameter, (V* = VN/VM), which combines VN and VM, is sufficient to represent the amount of deposited material (Reinold et al., 2022). By expressing the ratio of filament width to nozzle diameter, W* = W/D, and the ratio of filament height to nozzle diameter, HF* = HF/D, the filament shape can be described and generalized to any nozzle diameter. The filament height (HF) may not always equal the nozzle height (HN), as a reduction in velocity ratio can cause a swelling effect, leading to a higher filament height due to extrusion pressure (Comminal et al., 2020).
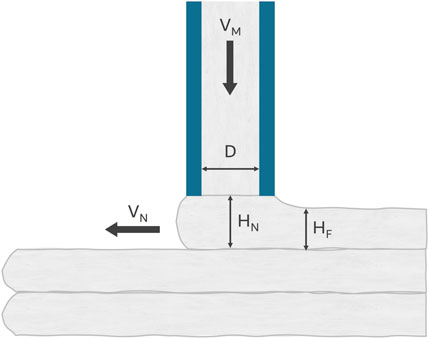
FIGURE 2. Process parameters affecting the filament geometry.
2.2.2 Printed filament behaviors
The shape of the filament can vary depending on the specific combination of process parameters used, resulting in three distinct behaviors of material extrusion. Note that these behaviors are related to the pressing approach, which is the study focus.
The first behavior is characterized by the production of a large filament surface area due to a slow nozzle velocity ratio and a small nozzle height ratio. As a result, a greater amount of material is deposited than expected, leading to the material being compressed and spread out horizontally (Tay et al., 2019b). In this scenario, the layer cross-section is closer to a rectangular shape with a low aspect ratio (height/width) (Comminal et al., 2020; Reinold et al., 2022). While the excess material deposited enhances the connection between layers and increases the mechanical strength, it also leads to a rough surface finish and low geometric precision (Tay et al., 2019b). The nozzle’s extrusion pressure over sub-layers can also cause deformation. The deformation is permanent and modifies the filament thickness. According to numerical simulations, the dominant force during extrusion is the extrusion pressure, which exceeds the material weight (Comminal et al., 2020). This phenomenon results in limited control over the final layer width and is predicted to affect the material structuration rate, posing a risk to its overall stability (Carneau et al., 2022).
The third behavior of material extrusion has a large layer height and high velocity ratio, resulting in layer geometries with circular cross-sections (Comminal et al., 2020; Reinold et al., 2022). The major challenge in this behavior is the instability at the filament level, attributable to the increased complexity of stacking layers of filaments with a circular shape. Additionally, there exists a potential for longitudinal tearing. This phenomenon is induced by the slow material extrusion speed and the frictional force between the extruded material and the substrate. These factors collectively generate a shearing effect at the nozzle, leading to breakages (Tay et al., 2019a).
The final behavior of material extrusion is characterized by precise control of the geometry, with all layers having a consistent width and height, without any over-pressing, instable layers stacking, or filament tearing.
2.3 Filament simulation of material extrusion
To evaluate, optimize and control the quality of a system, simulating it is a crucial first step. In the case of 3DCP, filament depositing simulation can be achieved through numerical, analytical or data-driven methods. This section provides an overview of each approach, including their advantages, disadvantages, and examples from existing literature.
2.3.1 Numerical modeling
Numerical methods have been helpful in advancing our understanding of the printing process (Perrot et al., 2021; Khan and Koç, 2022). A number of studies have demonstrated the efficacy of these methods in accurately replicating experimental results (Comminal et al., 2020; Liu et al., 2020; Spangenberg et al., 2021). Liu et al. attributed discrepancies between numerical and experimental results to variations in flow rate and minor changes in rheological properties post-pumping (Liu et al., 2020).
These numerical techniques can be applied at two levels within 3D Concrete Printing (3DCP): the individual printed filament (focusing on shape and quality) and the overall printed structure (emphasizing stability). Numerical simulations at the filament level have proven useful in assessing the impact of process and material parameters on filament geometry. Comminal et al. implemented a CFD model to simulate and understand filament geometry and behavior, focusing on two process parameters: nozzle height and nozzle velocity ratio (Comminal et al., 2020). In Wolfs’ work (Wolfs et al., 2021), CFD models have been used to explain the impact of process parameters in the infinite brick regime. In (Liu et al., 2020), they discovered that filament deformation is largely influenced by yield stress and velocity ratio, rather than plastic viscosity. Furthermore, Mollah (Mollah et al., 2021) studied the influence of nozzle diameter, extrusion speed, printing speed, and nozzle height on the shape of the filament.
Despite these advancements, numerical simulations pose significant challenges due to the extensive computational resources and time required. As per (Comminal et al., 2020), the average simulation time was anywhere between 18 h and 2 days, based on the simulation technique applied. The investigation employed a high-performance computer to run all simulations, utilizing 20 cores. This restriction makes the use of numerical methods challenging for optimization purposes as many iterations need to be simulated to arrive at the optimal objective value.
2.3.2 Analytical modeling
Analytical modeling provides an alternative method for studying filament behavior during 3D printing. It uses mathematical formulas based on fundamental principles to forecast the shape of the filament. Unlike numerical methods, these formulas have precise solutions, allowing for direct problem-solving without the need for approximation or iteration. While numerical models can offer detailed insights, analytical models benefit from having a lower computational cost.
At the filament scale level, research has been primarily concentrated on determining the filament width. Zhang and Sanjayan initially assumed that the filament possessed a perfect rectangular shape and formulated Eq 1 based on this assumption (Zhang and Sanjayan, 2023). However, their subsequent experimental studies revealed a significant error in this relationship, attributable to the rectangular shape assumption.
Carneau et al. improved upon this by hypothesizing that the filament possessed an oblong shape, comprising a rectangle and two half circles on its sides (Carneau et al., 2022). Utilizing this assumption and the principle of mass conservation, they formulated Eq 2. They asserted good accuracy when applying this equation against experimental data, although no quantitative assessment was provided to substantiate this claim.
2.3.3 Data-driven modeling
An alternative approach to numerical simulation that does not come with a high computational cost is data-driven modeling (Nguyen-Van et al., 2023). Researchers used data-driven models to either predict the geometrical properties of the filament or to validate a numerical model using data-driven models. Key studies in this realm have explored the relationship between printing parameters (inputs) and filament geometry (outputs), as outlined in Table 1.
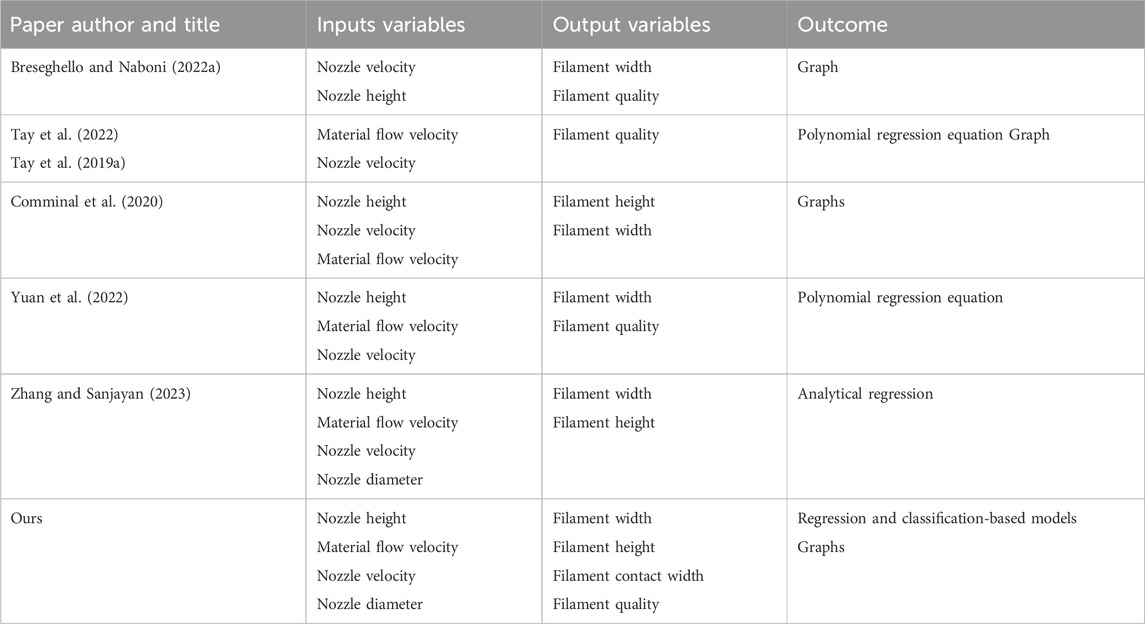
TABLE 1. Summary of papers that used filament shape data-driven modeling for the layer pressing approach.
However, there are still opportunities to develop a more comprehensive data-driven models. Some of the developed models did not consider all the process parameters. Others did not predict all filament-related parameters, for instance, no study has developed a model for predicting filament contact width. Moreover, Previous studies mostly produced graphs representing variable relationships, which are harder to implement than widely shareable data-driven models. Additionally, some used regression models without performance validation.
In our study, a comprehensive approach was adopted by considering all principal printing parameters, such as nozzle height, flow rate, nozzle velocity, and nozzle diameter, as inputs. The prediction of crucial filament geometric properties, including width, height, contact width, and the classification of filament behavior, was undertaken as outputs. Various regression and classification models were thoroughly examined to identify the optimal models for predicting filament geometry. This approach presents a more exhaustive and refined data-driven modeling methodology compared to preceding studies, addressing previous limitations and offering a more practical solution for wider implementation.
2.4 Applications of filament geometry modeling
Filament-level simulation can be used for various applications. Firstly, it helps in producing unconventional toolpaths, which allow for the creation of structures with varying layer widths (Breseghello and Naboni, 2022a; Yuan et al., 2022) and the printing of non-planar layers. Secondly, utilizing filament geometry simulation can help optimize the structure’s efficiency by reducing material use while enhancing its overall structural performance. By selectively placing material only where it is needed, an optimized light beam can be designed that is three times more effective than a traditional full beam (Breseghello and Naboni, 2022b). In a similar study (Tay et al., 2022), researchers printed an optimized beam, which resulted in a 50% enhancement in the strength-to-weight ratio. In both mentioned papers, the printed toolpath was designed by simulating and optimizing printing parameters like nozzle velocity and material flow velocity. Furthermore, by adjusting process parameters, it is possible to use 3DCP filament simulation to print both the main structure and support structure for overhangs using the same material (Tay et al., 2019a). Finally, by incorporating filament simulation into a real-time printing quality workflow, the quality of 3D-printed objects can be improved. It allows for making real-time corrections to the process parameters if any defects or errors were detected during the printing process.
3 Methodology
The proposed research is composed of three main activities: data generation, data collection, and model training. This section details each one of them, starting with a discussion of the research material and setup.
3.1 3D Printing material and system setup
The material used in the experiment met the two buildability criteria (criterion number 1 and 2) described in the introduction section. According to these criteria, the material should be able to withstand its own weight and the weight of the layers above it. This is a necessary condition for all 3DCP applications. Therefore, the material selection in this experiment does not limit the scope of this study, as any other material suitable for 3DCP would also meet the buildability criteria.
The dry mix material utilized in the experiment was formulated by Gulf Concrete Technologies (GCT). It comprised a combination of Portland cement, lime, pulverized limestone, specifically graded masonry sand, fibers, and admixtures. In GCT concrete, the largest particle size does not exceed 1 mm.
Duarte assessed the stiffness of GCT material using a pre-shear protocol that mimics the printing components’ shear history (Duarte et al., 2023). Ashrafi found that the GCT material stopped deforming 33.9 s after printing, indicating faster printing would cause deformation (Ashrafi et al., 2021). This finding informed our experiment design, which used a toolpath with a time interval exceeding 33.9 s. The time gap refers to the period post-extrusion, assuming a 10 ft hose.
Figure 3 illustrates the 3DCP system located in the AddCon lab at Penn State University, which comprises a mixer pump (m-tec Duomix 2000) used for mixing and extruding the material, a silo containing the dry mix and feeding the pump, and a 6-axis robotic arm (ABB IRB 6640). The system offers control over the robot speed, nozzle height, and material flow velocity. The printing path was designed using Rhino and Grasshopper, and the open-source Grasshopper plug-in RobotComponent was utilized to convert the path to the ABB robot programming language (Deetman et al., 2023).

FIGURE 3. 1. a computer used to load the RAPID code to the robot; 2. ABB Robot controller; 3. Robotic arm for moving the nozzle; 4. Silo to store the material; 5. Pump for mixing the dry mix with water and pumping the cement mortar; 6. Nozzle for material deposition; 7. Printed structure.
3.2 Data generation
The data generation stage was aimed at producing as many data points as possible, with each having distinct parameters impacting filament geometry. The literature review revealed four process parameters and three material parameters affecting filament geometry. However, since the chosen material satisfies the two buildability criteria outlined in Section 3.1, its parameters do not impact the shape of the extruded filament and were therefore excluded from the experiment. Material buildability was ensured by using an accelerant and allowing a substantial time gap between the printing of successive layers. Consequently, the experiment focused solely on process parameters. The process parameters influencing filament geometry were nozzle height (HN), nozzle velocity (VN), nozzle diameter (D), and material flow velocity (VM). As concluded from the literature, these could be combined into two dimensionless parameters: the velocity ratio (V* = VN/VM) and the nozzle height ratio (HN* = HN/D).
The next step involved collecting as many filament samples as possible, each with different V* and HN* values. To simplify the process, all samples were printed in a single, continuous zigzag pattern within the reach of the robotic arm. The RobotComponent Grasshopper plugin was used to determine that the robot’s maximum uninterrupted printing path was 30 m (Deetman et al., 2023). This path consisted of six layers, with the top three and bottom three layers having similar printing parameters. In total, the toolpath provided 144 unique data points with varying V* and HN* values, as shown in Figure 4. These values were labeled as (L) or (U) to denote lower or upper layers. Each line in the toolpath was divided into six 30 cm segments, each with a unique HN* value. The distance between lines was adjusted according to the anticipated maximum width of the filament.
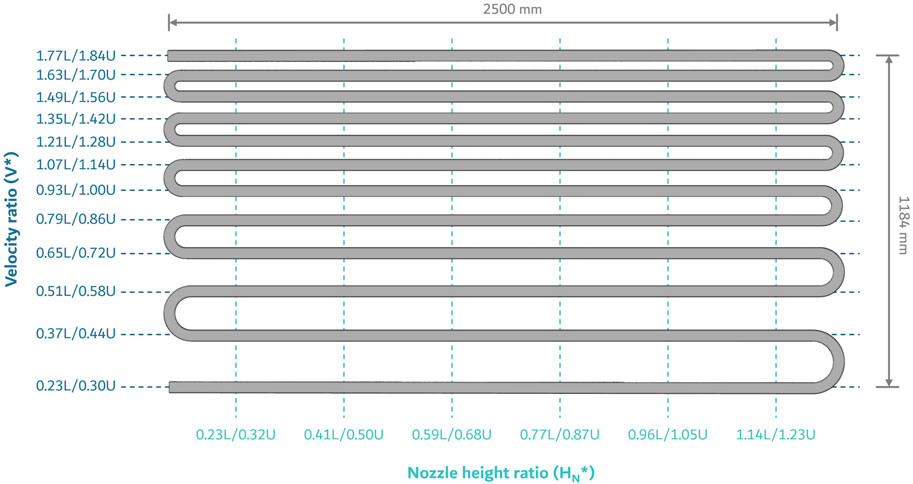
FIGURE 4. Experimental printing path for the data collection process.
Ranges of the parameters were determined based on material and printing limitations, and by comparing previous experiments from different studies. Value of the parameters employed in the experiment are presented in the Supplementary Table S1.
3.3 Data collection
Before the start of the printing process, it was ensured that the surface intended for printing was evenly leveled. This was achieved by placing wooden wedges under the designated printing pallet. Anyway, the impact of the unevenness of the printing bed only affects the first layer which was excluded from the calculation as discussed later in this section.
During printing, paint was applied to each layer to preserve the visibility of filament boundaries when cutting samples. A record was kept of any filaments that were not stable enough to build up three layers. Immediately after printing, while the material was still not fully hardened, a knife was used to make preliminary cuts to obtain samples approximately equal to 30 cm. This resulted in 72 samples (Figure 5), each corresponding to specific V* and HN* values. Cutting the samples facilitated moving them to the table saw machine for more precise and smaller cutting. The print was left to harden for 3 days before being moved to a table saw where each 30 cm sample was cut into three pieces of 10 cm each. This procedure resulted in two data points for each sample, all of which exhibited similar printing properties.
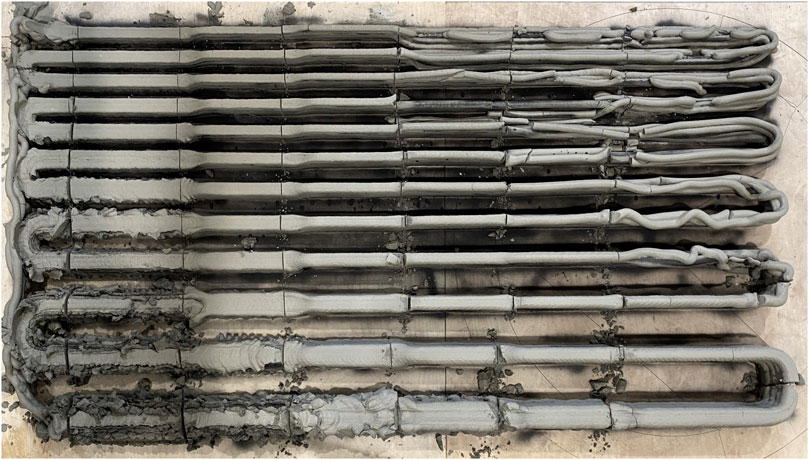
FIGURE 5. Top view of the experimental print showing 72 unique samples.
A desktop paper scanner was used to scan the samples. The high-quality images produced were suitable for digital measurements. ImageJ, a Java-based image processing program, was used to measure multiple geometrical features of each sample.
As mentioned earlier, each sample consisted of 6 layers. The lower three layers had identical properties, as did the upper three layers. Not all layers were considered in the measurement. Instead, only typical layers were used, as illustrated in Figure 6. These typical layers were selected as they do not exhibit unique shapes like the bottom-most layer, which is affected by the flat printing surface, thus ensuring a more accurate representation of the filament features.
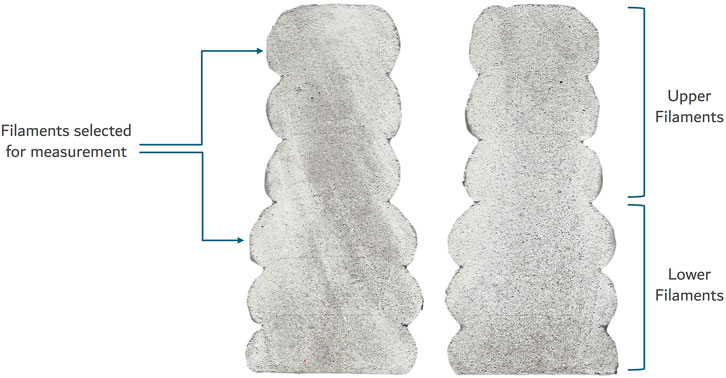
FIGURE 6. Illustration of a typical sample segmented into two sections, highlighting the selected filaments for measurement.
The geometrical features depicted in Figure 7 that were measured include the filament width (defined as the maximum width of the filament), the filament height (which is the vertical distance between layers), and the contact width (the width at which two layers come into contact). These features served as response variables that we aimed to predict. Additionally, the cross-section area of each filament was measured to adjust the actual velocity ratio using the relationship (Velocity ratio = Area of the nozzle/Area of the filament). This step helped in correcting the targeted velocity ratio (V*) with another one that reflects reality.
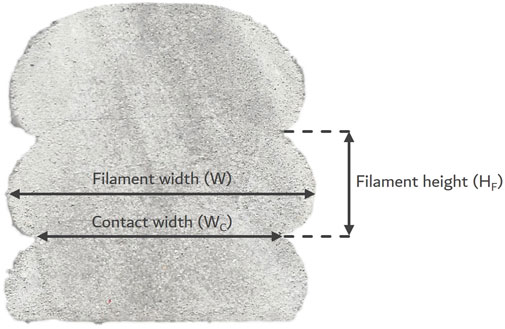
FIGURE 7. Geometrical features measured in the experiment.
In addition to the aforementioned features, the quality of the filament was also assessed through visual inspection. The filament quality is a measure of the consistency and stability of the filament. The filament samples were qualitatively classified into three classes as shown in Figure 8. Qualitative classification was preferred over quantitative classification because it is easier to visually assess classes. Moreover, the visually labeled categories were sufficient to develop a classification model with high accuracy. Most other studies only publish pictures of printed filaments, so the visual approach makes it easier to compare our results with those in the literature.
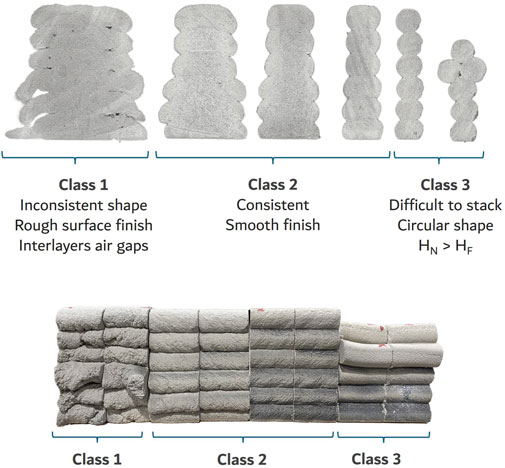
FIGURE 8. Qualitative classification of 3d printed filament samples: cross-section view and side view.
Class 1 contains filaments that are inconsistent in shape, have a rough surface finish, and exhibit an air gap between layers. These characteristics could potentially compromise the structural integrity of the entire print, leading to either elastic collapse due to instability or plastic collapse due to high extrusion pressure on previously printed layers. The presence of air gaps between layers in this class could also affect the bound strength between layers. Moreover, rough surface finish is not usually aesthetically desired. Class 2 filaments, considered the ideal class, demonstrated consistency that allowed for easy stacking of three layers without collapse. This consistency not only ensured a smoother surface finish but also contributed significantly to the overall strength and stability of the structure. Moreover, it guaranteed a high degree of contact between successive layers and more control over the filament shape. Class 3 filaments were characterized by a rounded shape that made stacking without collapse very difficult. The rounded shape could induce instability during the stacking process, potentially undermining the structural integrity of the final product.
3.4 Prediction model training
The experimental data were initially processed and explored using Microsoft Excel. This stage involved preliminary cleaning, where outlier points were identified and reevaluated to ensure accuracy.
After the cleaning phase, the results were further explored and statistically analyzed using the Python programming language. A correlation matrix was utilized to comprehend the relationships between variables and to identify any multicollinearity. Descriptive statistics for selected 3DCP features were also calculated to understand the distribution of data, compare different sample groups, and identify any potential outliers.
The next step was to train several data-driven models, each one predicting a certain feature of the response. Scikit-learn python library was used in this step. For each model, the data was split into training and testing sets, using an 80/20 ratio. This step was important to avoid overfitting and to evaluate the generalization performance of the models on unseen data.
Depending on the type of the feature, either classification or regression models were used. For the classification models, some of the algorithms used were logistic regression, decision tree, random forest, support vector machine (SVM), linear discriminant analysis, and quadratic discriminant analysis (QDA). For the regression models, some of the algorithms used were polynomial regression, k-nearest neighbors (KNN), random forest regression and support vector regression (SVR).
Before training the models, some preprocessing steps were applied to the data, such as scaling which was used to normalize the numerical features to have a similar range of values.
The models were trained using cross-validation (CV) with 5 folds, which means that the training set was divided into 5 subsets, and each subset was used as a validation set once, while the rest were used as a training set. The CV score was calculated as the average of the scores obtained from each fold. The score metric used for the classification models was accuracy, which is the proportion of correctly predicted labels. The score metric used for the regression models was R-squared (R2), which is the proportion of variance explained by the model. The higher the score, the better the model performance. The best model for each feature was selected based on its CV score and its ease-of-use outside of the python environment.
The validation phase constituted a critical component of the prediction process, enabling the assessment of our models’ performance on unseen data, and their generalizability and robustness. The validation data was procured from a variety of studies conducted under disparate laboratory setups and with diverse materials, thereby providing a comprehensive and realistic dataset for evaluation. The incorporation of various data sources was crucial for two reasons: firstly, it facilitated the testing of our models’ accuracy and reliability, and secondly, it ascertained whether the selected models were compatible with varied materials.
During the collection phase of the validation dataset, we sought printing experiments that utilized data corresponding to the variables we had selected (V*, HN*, W*). However, in instances where different variables were employed in the studies, we derived the needed variables from those provided. For instance, if the actual nozzle height (HN) was used, this value was divided by their nozzle diameter (D) to obtain the nozzle height ratio (HN* = HN/D). In the case of the classification model, given that the printed filaments were qualitatively classified, our classification criteria were implemented to categorize filaments from literature data. This categorization was based on the photographs provided and filament behavior descriptions provided by the authors.
After preparing the literature data, they were imported into the Python code and the same trained models were tested using that data. The models’ predictions were compared with the actual values or labels of the validation data, and the performance of each model was evaluated.
4 Results and discussion
In this study, classification models were developed and evaluated with the objective of predicting filament quality. Additionally, models for predicting filament shape were also constructed and tested. A separate discussion for each of these geometrical features is provided in this section. Inter-layer bonding was also investigated, and ways in which it could be enhanced by the proposed models were delineated. An exploratory data analysis was conducted prior to the utilization of the data for model training, the details of which are presented early in this section.
4.1 Data exploration
It is an essential step to identify errors in the data set and make corrections accordingly. Prior to printing, the material flow velocity was calibrated to match the desired velocity. However, an analysis of the printed samples revealed an average error of 8% between the calibrated and measured flow rates. That error does not correlate with time, indicating it is likely caused by inconsistencies in the pump speed rather than hose clogging or material property changes over time. To compensate for this error, the velocity ratio was recalculated using the formula: Velocity ratio = Area of the nozzle/Area of the filament.
For selected features, the mean of the data corresponding to class 2 was calculated. The emphasis was placed on data from class 2 as it exemplifies the desired class characterized by stable and consistent filament geometry. In addition, the 95% confidence interval was also calculated for this class (refer to Table 2).
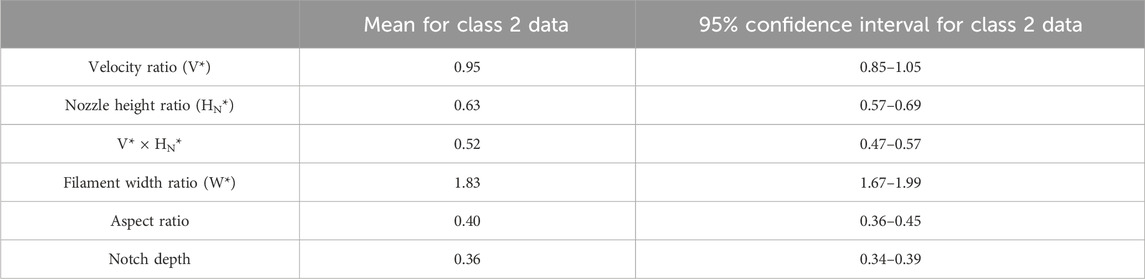
TABLE 2. Statistical findings within ‘Class 2′filaments.
4.2 Filament quality
The findings in Table 2 only provide rough estimations for the filament class. To find a more precise classification, a data-driven classifier is proposed. Several potential classifiers were trained, and their cross-validated prediction accuracy calculated. SVM performed the best with 0.95 accuracy. The QDA model also had good prediction accuracy (0.92) and was recommended due to its versatility in handling data from a variety of sources. A visual representation of the classifier’s performance is showcased in Figure 9, where V* and HN* are plotted on the axes, revealing three distinct regions corresponding to the three classes generated by the QDA model. Within the same plot, data points collected during the experimental study are plotted and color-coded according to their respective classes.

FIGURE 9. Classification of measured data points and prediction regions for filament classes.
To validate the efficacy of the newly developed filament quality classifier, a validation dataset consisting of 29 data points was utilized, and the model demonstrated perfect accuracy by correctly predicting all data points. Further validation was performed by collecting data from various previous studies. Researchers in these studies used different materials and printing setups. The accuracy of the developed model on data from previous studies is plotted in Figure 10. The model exhibited robust performance on most data from different sources (Comminal et al., 2020; Breseghello and Naboni, 2022b; Carneau et al., 2022; Yuan et al., 2022; Zhang and Sanjayan, 2023). The data from some of the papers were not presented in a tabulated format. Instead, they were presented in pictures and plots and were visually extracted to be used for validation of the proposed model. Human error in extracting these data can explain the low prediction accuracy in data from some of the papers. Since these studies utilized different materials, we can conclude that material properties are not a major parameter in determining filament class. This is likely because printable filaments tend to possess similar properties.
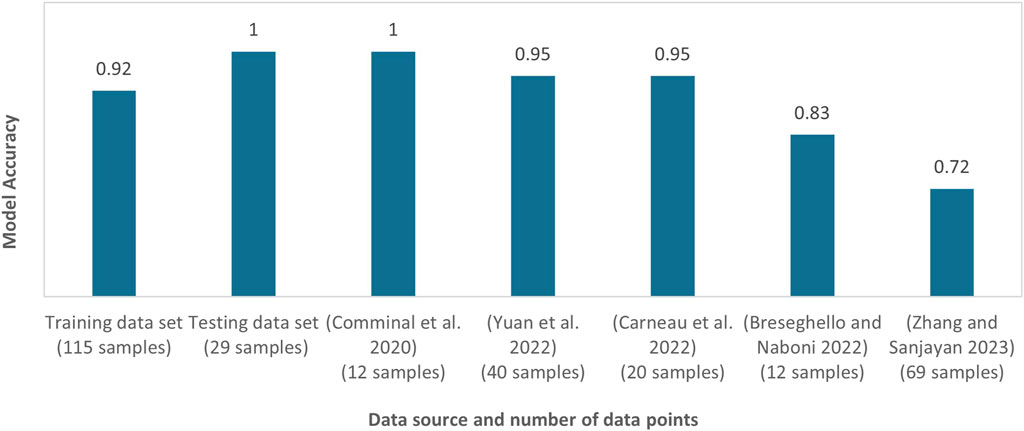
FIGURE 10. Validation of filament quality classifier (QDA) across diverse data sources.
4.3 Filament shape
This section outlines the process of selecting and validating prediction models for three geometrical features: filament width, filament contact width and filament height ratio.
4.3.1 Filament width
Preliminary predictive modeling of filament width employed both parametric (polynomial regression) and nonparametric (K-nearest neighbors, random forest, support vector regression) techniques. Polynomial models up to order 4 were trained and evaluated via cross-validation, achieving scores from 0.56 (order 1) to 0.98 (order 4). Though higher order polynomials demonstrated improved accuracy, they risk overfitting given the underlying complexity. The third degree polynomial has a balance between predictive power (0.96 cross-validation score) and generalizability. Additionally assessed were K-nearest neighbors (K = 4, 0.81 score), random forests (0.79), and support vector regression (0.98).
Following this, two models were selected for further analysis: the Support Vector Regression model, chosen for its high accuracy, and Polynomial Regression (order = 3), selected for its adaptability across various platforms, such as Excel and Grasshopper without the need for sophisticated software.
In addition to the selected models, an analytical equation was introduced for the purpose of comparison. The equation computes filament width based on an assumed oblong shape, as shown in Figure 11 and by mass conservation principles as discussed in section 2.3.2.

FIGURE 11. Filament shape used for developing analytical equation.
The width ratio is expressed in Eq. 3 utilizing the notations used in our paper.
To further enhance the accuracy of the analytical equation, a fourth prediction model was implemented using an analytical regression method. This model employs the same equation as the analytical model but adjusts the constants based on a training dataset. Within the equation (Eq. 4), the modified parameters are β0 = 0.0139, β1 = 0.7188, and β2 = 0.2784.
The four models showed excellent performance when trained and tested on the dataset generated in this study (Table 3). Interestingly, these models also performed well with data generated by different researchers using different materials and setups, suggesting that material properties are not a significant factor in predicting filament width. This is likely due to the similar rheological properties of most printable concrete materials. However, it should be noted that the accuracy of all models was lower with data from the literature compared to our data, which could be due to differences in measurement methods and measurement errors.
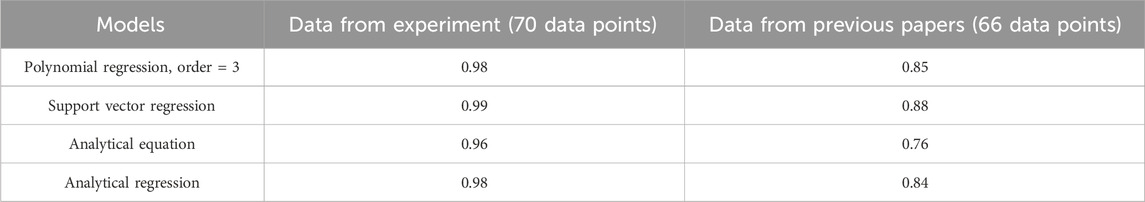
TABLE 3. Coefficient of determination (R2) for various models with different data sources.
Upon conducting the validation process, certain conclusions were drawn. All models struggled to reliably predict the width of unstable or over-extruded filaments (Filaments outside of class 2). Despite this limitation, the models can likely predict widths accurately enough for most applications since inconsistent filaments tend to fail anyway. Regression models perform accurately only within the constraints of the training data, specifically when V* <2.0 and HN < 1.6. Outside of these velocity ratio and nozzle height ratio ranges, the models’ predictions decline in accuracy.
Using data from literature, Figure 12 depicts the binned average error between predicted and actual filament widths for each model across various (V* × HN*) ranges. The overall error is similar across all models; however, it exhibits variability with changes in (V* × HN*) values. This variability was quantified by assessing the standard deviation of each model’s error. Figure 12 highlights that the analytical equation model has the highest standard deviation. That model assumes perfect semi-circular filament ends, a condition typically valid for filaments with a high aspect ratio. Notably, in the same figure, the analytical equation demonstrates its poorest performance at low V×Hn values, corresponding to low aspect ratios. Despite the generally comparable performance of all models, a preference is suggested for regression-based models over the analytical equation due to their increased reliability in predicting extreme width values.
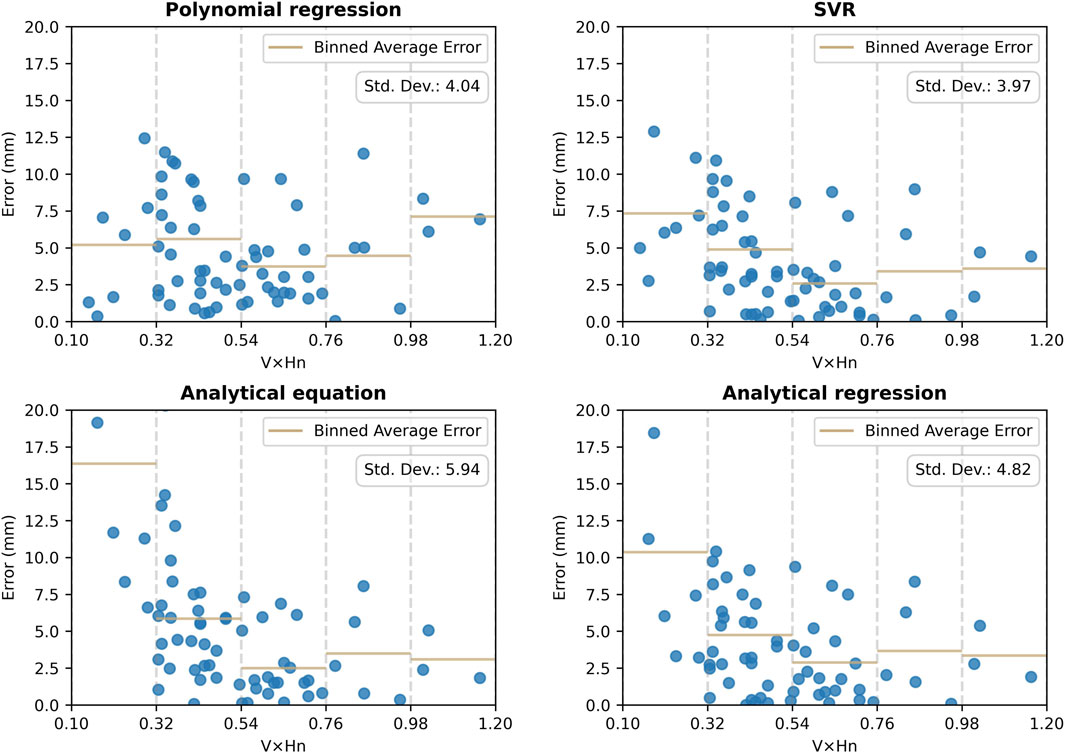
FIGURE 12. Comparative analysis of prediction models: binned average error and standard deviation across (V*×Hn*) Ranges.
To demonstrate the behavior of filament width under varying conditions of V* and HN*, seven curves were plotted against V* and HN*, with each curve representing different width ratios (Figure 13). These curves were generated utilizing an analytical regression model. The findings align with the earlier observations in section 4.1, indicating that filament width ratios between 1.7 and 2 predominantly exhibit a consistent behavior falling within the class 2 category.
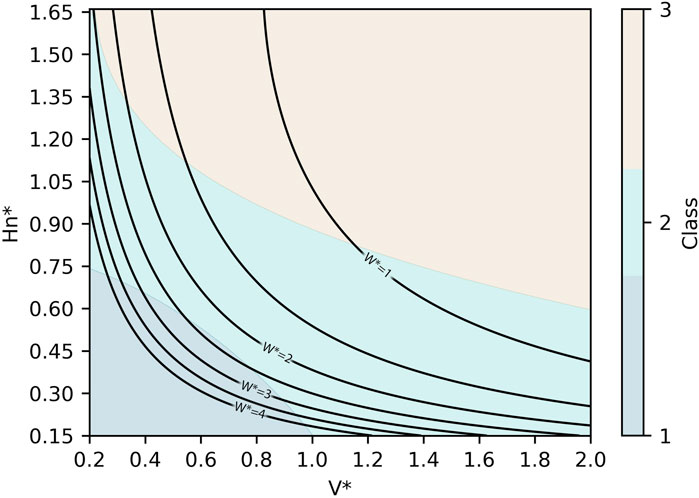
FIGURE 13. Filament width ratio patterns across V* and HN* conditions: generated by analytical regression model.
4.3.2 Filament contact width
The filament contact width (WC) is described as the width at which two successive filaments come into contact. For structural simulations at the layers level, using the contact width rather than the total filament width can yield more precise outcomes. Moreover, the contact width is used in the calculation of one helpful indicator which is the notch depth. Defined by the equation (
Several models were trained to predict the contact width, similar to those discussed in previous sections. Here’s a summary of their performance:
• The Polynomial regression model (order = 3) had an R2 score of 0.97 with both the training data and the testing data set.
• The Support vector machine model had an R2 score of 0.98 with both the training data and the testing data set.
• The Analytical equation model had an R2 score of 0.82 with the training data and 0.80 with the testing data set.
• The Analytical regression model had an R2 score of 0.97 with the training data and 0.96 with the testing data set.
Among all the models trained for predicting contact width, outstanding performance was exhibited by most, with the exception of the analytical equation. To the author’s knowledge, measurement or prediction of contact width has not been addressed in prior studies. Therefore, the models were validated using testing data set rather than data from existing literature. The analytical equation for the contact width ratio can be expressed, based on Figure 11, as: (
From the base analytical equation, an enhanced analytical regression model was developed. This model employs the same foundational equation but with refined parameters. The enhanced analytical regression equation is represented as:
This refined equation is recommended, due to its simplicity and its high prediction accuracy.
4.3.3 Filament height ratio
The nozzle height HN which is an input variable, can be higher than the actual filament height (HF) because there is no upper limit on HN, while HF has physical constraints. HN can also be lower than HF if there is an over-extrusion (low V*). In both these scenarios, the filament is either unstable or over-extruded. If the filament is stable and consistent (class 2), HN and HF are nearly equal. This can be proven by a scatter plot of the two heights colored by the classes (refer to Figure 14). Points belonging to class 2 are all approximately equal with a coefficient of determinacy (R2) of 0.98. In contrast, HF is greater than HN in points from class 1 (over-extruded filaments), and the opposite is valid for class 2 (unstable filaments).
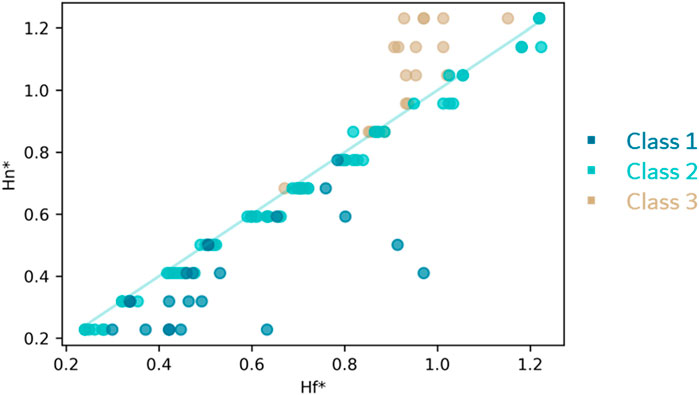
FIGURE 14. Scatter plot of Filament Height (HF) vs. Nozzle Height (HN) differentiated by class.
4.4 Interlayer bonding
For a given nozzle diameter, there exists a maximum achievable filament width. In instances where a wider filament is desired, it is possible to print two adjacent filaments. However, this approach results in the development of inter-filament voids due to the inherent oval shape of the filaments.
In response to this challenge, the author has proposed a novel slicing strategy. This strategy aims to reduce the inter-filament voids and simultaneously enhance the inter-layer bonding strength. The implementation of this strategy involves shifting one column of filaments by half of the nozzle height in the vertical direction and by a distance approximately equals the notch depth in the horizontal direction. This is clearly depicted in Figure 15.
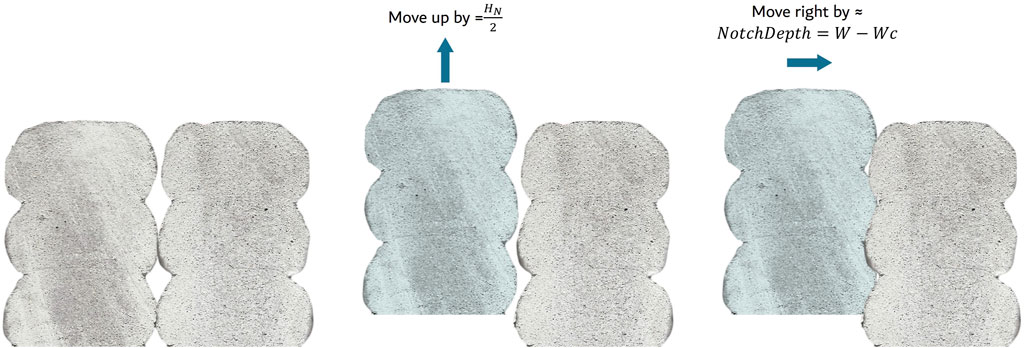
FIGURE 15. Steps for the proposed slicing method to increase interlayer bound.
The result of this strategic shift ensures that each filament is in contact with four neighboring filaments in the adjacent layer. This contrasts with the conventional slicing strategy where each filament only touches three neighboring filaments, and with a smaller contact area.
From Figure 15, it is clear that the filament shifting causes a gap in the first layer. To successfully implement this slicing strategy, it is necessary to print one of the filaments in the first layer with a nozzle height equal to 3/2 times the typical nozzle height or add a filament with a nozzle height equal to half the typical nozzle height. This adjustment has an impact on the filament width, which can be compensated by modifying the velocity ratio according to the regression models presented in Section 4.3.1.
The expectation is that this proposed slicing strategy will enhance the mechanical properties of printed parts by increasing inter-layer bonding. However, further experimental studies are required to validate this hypothesis.
5 Conclusion
5.1 Summary of Contributions
This paper presented a comprehensive data-driven workflow to enhance the reliability of 3D concrete printing processes through modeling and simulation of extruded filament geometry. The key contributions include:
• Generation of an experimental dataset relating 144 combinations of major printing parameters to resulting filament width, contact width, height ratio, and overall quality. The new data covers a wide range of typical values for nozzle height, printing velocity, flow rate and nozzle diameter.
• Development and validation of four predictive models to simulate filament geometry outcomes based on printing inputs. A polynomial regression model performed best for predicting filament width, achieving R2 scores of 0.98 on experimental data and 0.86 on literature data. Analytical regression was optimal for modeling contact width, with R2 scores of 0.97 and 0.96 on training and testing data respectively. Filament height was found to equal nozzle height in the “consistent filament class”. A quadratic discriminant analysis classifier categorized filament quality with 92% cross-validated accuracy. The developed regression and analytical equations are summarized in Supplementary Table S2.
• Demonstration of how this data-driven modeling approach provides more comprehensive and generalized simulation capabilities compared to previous studies that focused on specific parameters or geometries.
• Proposal of multiple applications where data-driven filament geometry simulation can optimize efficiency, enhance quality control, and enable innovative designs. The models can be integrated into a real-time control system to adjust parameters based on detected defects. For design, the models facilitate creating non-planar layers and filaments with variable width.
Overall, this work advances knowledge on relating printing parameters to extruded filament geometry through extensive data collection and data-driven modeling.
5.2 Limitations
The developed models are optimized for the layer pressing approach with circular nozzle geometries. The models do not directly apply to the infinite brick printing approach, where filament geometry is typically defined solely by the nozzle shape rather than layer pressing.
Additionally, the models were validated on concrete materials that satisfy buildability criteria, meaning the printed filament does not significantly deform under its own weight or the weight of upper layers. However, this is not a major limitation because having a buildable material is a pre-requirement for nearly all 3DCP applications.
5.3 Future work
Looking ahead, the proposed models have immense potential to make 3D concrete printing a more reliable and versatile construction method. Future work can focus on implementing the developed models in software such as Rhino/Grasshopper, a platform commonly used for custom toolpath generation and design of geometries.
In addition, future studies can leverage the findings and tools developed in this paper in an optimization workflow along with already available analytical models. This could potentially lead to better performance at both the printed filament and structure level.
To ensure filament width and quality stays consistent, the developed models can be integrated with real-time sensors to control the four process parameters in real-time during printing.
The developed tools also hold promise for printing structural elements with improved structural performance by leveraging the ability to print non-planar layers. These structural elements could also have variable filament widths depending on the structural need, further enhancing their structural performance.
Data availability statement
The original contributions presented in the study are included in the article/Supplementary Material, further inquiries can be directed to the corresponding author.
Author contributions
AA: Conceptualization, Data curation, Funding acquisition, Investigation, Methodology, Validation, Writing–original draft, Writing–review and editing. JD: Conceptualization, Investigation, Methodology, Resources, Supervision, Writing–review and editing. NB: Conceptualization, Investigation, Methodology, Supervision, Writing–review and editing, Project administration, Software, Validation.
Funding
The author(s) declare that no financial support was received for the research, authorship, and/or publication of this article. AA was funded by a scholarship from King Fahd University of Petroleum and Minerals, Dhahran, Saudi Arabia. Nathan Brown and José Duarte were funded by The Pennsylvania State University. Additional funds for this research were provided by the Stuckeman Center for Design Computing. Gulf Concrete Technology provided the printable concrete mixture.
Conflict of interest
One of the co-authors, JD, has equity in a company, X-Hab 3D, whose activity is concrete printing.
The remaining authors declare that the research was conducted in the absence of any commercial or financial relationships that could be construed as a potential conflict of interest.
Publisher’s note
All claims expressed in this article are solely those of the authors and do not necessarily represent those of their affiliated organizations, or those of the publisher, the editors and the reviewers. Any product that may be evaluated in this article, or claim that may be made by its manufacturer, is not guaranteed or endorsed by the publisher.
Supplementary material
The Supplementary Material for this article can be found online at: https://www.frontiersin.org/articles/10.3389/fbuil.2024.1363370/full#supplementary-material
References
Ashrafi, N., Nazarian, S., Meisel, N. A., and Duarte, J. P. (2021). Experimental prediction of material deformation in large-scale additive manufacturing of concrete. Addit. Manuf. 37, 101656. doi:10.1016/j.addma.2020.101656
Bos, F., Wolfs, R., Ahmed, Z., and Salet, T. (2016). Additive manufacturing of concrete in construction: potentials and challenges of 3D concrete printing. Virtual Phys. Prototyp. 11, 209–225. doi:10.1080/17452759.2016.1209867
Breseghello, L., and Naboni, R. (2022a). “Adaptive toolpath: enhanced design and process control for robotic 3DCP,” in Computer-aided architectural design. Design imperatives: the future is now, communications in computer and information science. Editors D. Gerber, E. Pantazis, B. Bogosian, A. Nahmad, and C. Miltiadis (Singapore: Springer), 301–316. doi:10.1007/978-981-19-1280-1_19
Breseghello, L., and Naboni, R. (2022b). Toolpath-based design for 3D concrete printing of carbon-efficient architectural structures. Addit. Manuf. 56, 102872. doi:10.1016/j.addma.2022.102872
Carneau, P., Mesnil, R., Baverel, O., and Roussel, N. (2022). Layer pressing in concrete extrusion-based 3D-printing: experiments and analysis. Cem. Concr. Res. 155, 106741. doi:10.1016/j.cemconres.2022.106741
Comminal, R., Leal da Silva, W. R., Andersen, T. J., Stang, H., and Spangenberg, J. (2020). Modelling of 3D concrete printing based on computational fluid dynamics. Cem. Concr. Res. 138, 106256. doi:10.1016/j.cemconres.2020.106256
Deetman, A., Rumpf, G., Wannemacher, B., Dawod, M., Akbar, Z., and Rossi, A. (2023). Robot components: intuitive robot programming for ABB robots inside of rhinoceros grasshopper. Hawaii, United States: Zenodo. doi:10.5281/zenodo.10413440
Duarte, G., Duarte, J. P., Memari, A., Brown, N., and Gevaudan, J. P. (2023). Towards a model for structural performance in concrete printing based on buildability and toolpath design. J. Build. Eng. 69, 106325. doi:10.1016/j.jobe.2023.106325
El-Sayegh, S., Romdhane, L., and Manjikian, S. (2020). A critical review of 3D printing in construction: benefits, challenges, and risks. Arch. Civ. Mech. Eng. 20, 34. doi:10.1007/s43452-020-00038-w
He, L., Chow, W. T., and Li, H. (2020). Effects of interlayer notch and shear stress on interlayer strength of 3D printed cement paste. Addit. Manuf. 36, 101390. doi:10.1016/j.addma.2020.101390
Khan, S. A., and Koç, M. (2022). Numerical modelling and simulation for extrusion-based 3D concrete printing: the underlying physics, potential, and challenges. Results Mater. 16, 100337. doi:10.1016/j.rinma.2022.100337
Liu, Z., Li, M., Weng, Y., Qian, Y., Wong, T. N., and Tan, M. J. (2020). Modelling and parameter optimization for filament deformation in 3D cementitious material printing using support vector machine. Compos. Part B Eng. 193, 108018. doi:10.1016/j.compositesb.2020.108018
Mohan, M. K., Rahul, A. V., De Schutter, G., and Van Tittelboom, K. (2021). Extrusion-based concrete 3D printing from a material perspective: a state-of-the-art review. Cem. Concr. Compos. 115, 103855. doi:10.1016/j.cemconcomp.2020.103855
Mollah, M. T., Comminal, R., Serdeczny, M. P., Pedersen, D. B., and Spangenberg, J. (2021). Stability and deformations of deposited layers in material extrusion additive manufacturing. Addit. Manuf. 46, 102193. doi:10.1016/j.addma.2021.102193
Nguyen-Van, V., Li, S., Liu, J., Nguyen, K., and Tran, P. (2023). Modelling of 3D concrete printing process: a perspective on material and structural simulations. Addit. Manuf. 61, 103333. doi:10.1016/j.addma.2022.103333
Pan, T., Guo, R., Jiang, Y., and Ji, X. (2022). How do the contact surface forces affect the interlayer bond strength of 3D printed mortar? Cem. Concr. Compos. 133, 104675. doi:10.1016/j.cemconcomp.2022.104675
Perrot, A., Pierre, A., Nerella, V. N., Wolfs, R. J. M., Keita, E., Nair, S. A. O., et al. (2021). From analytical methods to numerical simulations: a process engineering toolbox for 3D concrete printing. Cem. Concr. Compos. 122, 104164. doi:10.1016/j.cemconcomp.2021.104164
Perrot, A., Rangeard, D., and Pierre, A. (2016). Structural built-up of cement-based materials used for 3D-printing extrusion techniques. Mater Struct. 49, 1213–1220. doi:10.1617/s11527-015-0571-0
Reinold, J., Nerella, V. N., Mechtcherine, V., and Meschke, G. (2022). Extrusion process simulation and layer shape prediction during 3D-concrete-printing using the Particle Finite Element Method. Automation Constr. 136, 104173. doi:10.1016/j.autcon.2022.104173
Roussel, N. (2018). Rheological requirements for printable concretes. Cem. Concr. Res. SI Digital Concr. 112, 76–85. doi:10.1016/j.cemconres.2018.04.005
Roussel, N., Spangenberg, J., Wallevik, J., and Wolfs, R. (2020). Numerical simulations of concrete processing: from standard formative casting to additive manufacturing. Cem. Concr. Res. 135, 106075. doi:10.1016/j.cemconres.2020.106075
Spangenberg, J., Silva, W. R. L. da, Comminal, R., Mollah, M. T., Andersen, T. J., and Stang, H. (2021). Numerical simulation of multi-layer 3D concrete printing. RILEM Tech. Lett. 6, 119–123. doi:10.21809/rilemtechlett.2021.142
Tay, Y. W. D., Li, M. Y., and Tan, M. J. (2019a). Effect of printing parameters in 3D concrete printing: printing region and support structures. J. Mater. Process. Technol. 271, 261–270. doi:10.1016/j.jmatprotec.2019.04.007
Tay, Y. W. D., Lim, J. H., Li, M., and Tan, M. J. (2022). Creating functionally graded concrete materials with varying 3D printing parameters. Virtual Phys. Prototyp. 17, 662–681. doi:10.1080/17452759.2022.2048521
Tay, Y. W. D., Panda, B., Paul, S. C., Noor Mohamed, N. A., Tan, M. J., and Leong, K. F. (2017). 3D printing trends in building and construction industry: a review. Virtual Phys. Prototyp. 12, 261–276. doi:10.1080/17452759.2017.1326724
Tay, Y. W. D., Ting, G. H. A., Qian, Y., Panda, B., He, L., and Tan, M. J. (2019b). Time gap effect on bond strength of 3D-printed concrete. Virtual Phys. Prototyp. 14, 104–113. doi:10.1080/17452759.2018.1500420
UN-Habitat, 2022. Housing. URL https://unhabitat.org/topic/housing (Accessed 3.14.23).
Wangler, T., Lloret, E., Reiter, L., Hack, N., Gramazio, F., Kohler, M., et al. (2016). Digital concrete: opportunities and challenges. RILEM Tech. Lett. 1, 67–75. doi:10.21809/rilemtechlett.2016.16
Wolfs, R. J. M., Salet, T. A. M., and Roussel, N. (2021). Filament geometry control in extrusion-based additive manufacturing of concrete: the good, the bad and the ugly. Cem. Concr. Res. 150, 106615. doi:10.1016/j.cemconres.2021.106615
Yuan, P. F., Zhan, Q., Wu, H., Beh, H. S., and Zhang, L. (2022). Real-time toolpath planning and extrusion control (RTPEC) method for variable-width 3D concrete printing. J. Build. Eng. 46, 103716. doi:10.1016/j.jobe.2021.103716
Keywords: 3D concrete printing (3DCP), printing parameters, filament geometry, printing quality, data-driven modeling, parameters optimization, interlayer bonding, variable width filaments
Citation: Alhussain A, Duarte JP and Brown NC (2024) Developing a data-driven filament shape prediction model for 3D concrete printing. Front. Built Environ. 10:1363370. doi: 10.3389/fbuil.2024.1363370
Received: 30 December 2023; Accepted: 19 February 2024;
Published: 29 February 2024.
Edited by:
Vittoria Laghi, University of Bologna, ItalyReviewed by:
Lixiao Li, Shenzhen University, ChinaSonia Mariel Vrech, Universidad Nacional de Tucumán, Argentina
Copyright © 2024 Alhussain, Duarte and Brown. This is an open-access article distributed under the terms of the Creative Commons Attribution License (CC BY). The use, distribution or reproduction in other forums is permitted, provided the original author(s) and the copyright owner(s) are credited and that the original publication in this journal is cited, in accordance with accepted academic practice. No use, distribution or reproduction is permitted which does not comply with these terms.
*Correspondence: José P. Duarte, anhwNDAwQHBzdS5lZHU=