
94% of researchers rate our articles as excellent or good
Learn more about the work of our research integrity team to safeguard the quality of each article we publish.
Find out more
ORIGINAL RESEARCH article
Front. Built Environ., 01 February 2024
Sec. Sustainable Design and Construction
Volume 10 - 2024 | https://doi.org/10.3389/fbuil.2024.1347056
This article is part of the Research TopicSolar Neighborhood Planning: Optimize Solar Energy Use in Cities Through the Digitalization of the Built EnvironmentView all 8 articles
 Gilles Desthieux1*
 Martin Thebault2
As cities are major energy consumers challenges arise in densely populated areas that limit solar resources, hindering the deployment of urban solar power plants. To address this, the paper underscores the importance of digital tools for modeling solar energy accessibility within the urban fabric, focusing on rooftops, building facades, and other relevant locations. In this context, the development of the solar cadaster in Greater Geneva is presented in the paper within the framework of the European INTERREG G2 Solar project (2019–2022). The solar cadaster relies on a rich database from the Geneva Land Information System (SITG), offering comprehensive data on Digital Surface Models, building and roof cadasters, land cover, and more. Notably, this data, including the solar cadaster outputs, is accessible to the public as open data, fostering its extensive use in academia for teaching and research. It serves as a living laboratory for urban solar studies, with its open data approach contributing to widespread adoption. The project, a collaborative effort involving academia, energy utilities, and public institutions on both sides of the border, aims to unite stakeholders and foster a dialogue on solar energy in the region, in line with its commitment to addressing climate change, striving for carbon neutrality by 2050. The paper articulates the steps, methods, and outcomes of the project, offering insights into the challenges of implementing a shared online application tool in a cross-border territory. The propositions are based on feedbacks from stakeholders and lessons learned from case studies. The paper also delves into the shift in the business model for solar photovoltaic installations, emphasizing the need to model self-consumption in buildings. It concludes by highlighting the solar cadaster as a unifying means, fostering cohesion among diverse stakeholders in the region’s energy sector and propelling them toward common governance around solar energy.
In the context of the ongoing energy transition, solar energy is an essential element to ensure greater autonomy of urban areas in their energy supply by harnessing local and renewable resources. While the development of solar energy is particularly relevant in cities that consume the majority of energy demand, dense areas must be considered as they limit solar resources and consequently the deployment of urban solar power plants. It is therefore crucial to provide digital tools that model the accessibility to solar energy within the urban fabric, especially rooftops, building facades, and any other relevant locations (such as parking shelters, for example).
The canton of Geneva was one of the first regions in Switzerland to develop a solar cadaster back in 2011. The solar cadaster of Geneva relies on a very rich and comprehensive database provided by the SITG1 (Geneva Land Information System), which includes accurate Digital Surface Models, building and roof cadaster, land cover data, and more. The solar cadaster offers detailed information on the photovoltaic and thermal solar potential of roofs and buildings. All of the SITG’s data, including the outputs from the solar cadaster, can be freely downloaded by any user (open data). Thanks to the richness of the SITG database and its public accessibility, the solar cadaster of Geneva has been utilized for over a decade by the academic community for teaching and research activities. It serves as a valuable resource for developing and testing urban solar models based on SITG data. In a sense, Geneva has become a living laboratory for urban solar studies. The open data approach of the SITG contributes to a better appropriation of the solar cadaster and the other information provided by the information system. On this basis, the solar cadaster required further development in two significant ways.
First of all, solar access should not be confined solely to the Canton of Geneva but should be extended to the Greater Geneva region. Greater Geneva (Figure 1) is a cross-border agglomeration spanning both France and Switzerland, made up of three main entities: the Canton of Geneva, the Region of Nyon (that belongs to the Canton of Vaud), and the French Genevan Metropolitan Area (PMFG). The latter encompasses six communities of communes (CC) and two communities of agglomeration (CA) in the French departments of Ain and Haute-Savoie. Key statistics for Greater Geneva include 209 municipalities, an area of 2,000 km2, a population of 1 million inhabitants, and 500,000 jobs (Grand Genève, 2021).

FIGURE 1. Global situation of the Greater Geneva, main entities (Canton of Geneva, Nyon Region, French departments) in colored lines and subdivisions in solid colors. The map also includes the case studies areas and the areas of heritage constrains (see Section 4.2.2). Data source from © SITG.
The agglomeration is administered through a collaborative governance structure among various territorial entities. The legal entity of Greater Geneva was established in 2013. The agglomeration’s “territorial project” is centered around public policies related to urban development, transportation, and environmental concerns. Given the urgent need to address climate change, Greater Geneva is actively working to ensure that ecological transition, energy, and air quality issues are more comprehensively addressed throughout the cross-border agglomeration. The region is dedicated to achieving carbon neutrality by 2050 in response to the climate emergency. This underscores the significance of solar energy in facilitating this transition and highlights the role of the solar cadaster on the agglomeration level in supporting the development of solar projects.
Secondly, until the end of the last decade, the business model for solar PV installations on building roofs was based on selling the entire solar power generated back to the grid. Subsidies were provided to the owner based on the amount of energy sold. However, with the introduction of the new energy law in Switzerland in 2018, subsidies have shifted to supporting the initial investment in solar installations, while also promoting self-consumption of the solar power. As a result, the solar cadaster needs further development to model the potential for self-consumption of the solar energy generated in buildings, considering their electricity load.
These two aspects—the expansion of the solar cadaster to cover Greater Geneva and the modeling of self-consumption—were developed within the framework of the European INTERREG G2 Solar project (2019–2022). This project entailed a complex partnership involving academics, energy utilities, and public institutions from both sides of the border, as well as the three representing entities (Cantons of Geneva and Vaud, and PMFG).
In this context, the aim of this article is to take a critical look at the solar cadaster produced as part of the INTERREG project. We will explore the extent to which the solar cadaster could serve as a support in uniting all stakeholders in the Greater Geneva area and foster a dialogue on solar energy. In order to verify this assumption, we will present an overview of the main steps and methods employed leading first to the creation of the solar cadaster and the related tools, secondly to the establishment of unified regional governance around solar energy through a complex agglomeration-wide partnership.
In the following chapter, we will review the existing solar cadasters developed in cities and regions as a matter of defining the current idea and concept of solar cadaster. Chapter 3 will introduce the methods implemented in the context of the INTERREG G2 Solar project for the development and expansion of the solar cadaster to the agglomeration. Chapter 4 will present the project’s outcomes including a lessons-learned analysis from local projects and the creation of an online application for users. Finally, Chapter 5 will discuss these results, identifying any gaps and outlining the next steps required to maintain a shared governance approach to solar energy.
The advancement of cartography to assess solar and photovoltaic potential over vast areas is increasingly sophisticated, driven by the development of GIS tools combined with energy models. Nevertheless, the output of these tools, which are often used for academic studies, is not systematically made available. This limitation can be partly addressed with the development of solar cadasters. In what follows we briefly introduce the current methods to evaluate solar potential (Section 2.1). Then we present how these data are made available through the development of public solar maps and cadaster (Section 2.2).
The calculation of the solar potential on rooftop has made great progress in the last few years and tools and methods have been developed to assess the large-scale photovoltaic (PV) potential in urban environments. The majority of these tools make use of geographical information systems (GIS). Gassar and Cha (2021) conducted a review of various GIS-based approaches, classifying them into different categories. These include sampling methods, where a selection of typical buildings in a region is initially studied for photovoltaic potential, and the potential of the remaining buildings is then estimated based on the sample studied (Thai et Brouwer, 2021), 3D modeling (Lindberg et al., 2015), and machine-learning approaches (Walch et al., 2020). The majority of these approaches focus on predicting or estimating the available space for integrating photovoltaic (PV) systems and the anticipated PV energy production.
Evaluating the solar potential of rooftops is crucial for photovoltaic (PV) deployment studies, but it is often not the sole criterion to be considered. Indeed, for a more precise assessment of roof potential, it is necessary to take into account a wide range of criteria. These may include the presence of superstructure elements [see, e.g. (Peronato et al., 2018; Krapf et al., 2022)], the economic feasibility (Sommerfeldt et Madani, 2017), the visual impact (Florio et al., 2018) or the heritage constraints (Lucchi et al., 2023).
Recently, various open-access GIS-based tools have emerged with simulation engines that enable the simulation of irradiance on rooftops using open-access data. Lindberg et al. (2015) introduced an add-on to QGIS, facilitating the calculation of irradiance from a digital surface model. Additionally, (Pueblas et al., 2023), presented an open-source workflow for evaluating photovoltaic potential using aerial images and employing deep learning approaches.
Despite the increasing availability of data and tools that enable the calculation of individual solar maps with a reasonable investment, there remains a significant gap in terms of data publication and accessibility. For example, in most of the above-mentioned approaches, irradiance on roofs are calculated and thorough analyses are conducted providing valuable insights. However, the calculated data, such as irradiance on roofs, is often not shared as a result. This restricts the access to valuable knowledge to a limited audience, the authors of the study and their collaborators, whereas making such data openly available could benefit a broader audience. Whether it is a curious citizen exploring the solar potential of their roof or an academic conducting advanced studies on rooftop capabilities, access to this information is crucial. Initiatives like solar cadasters, which provide freely available rooftop evaluations of solar potential over large areas, represent steps toward addressing this limitation.
A solar cadaster is essentially a cartographic representation providing insights into the “solar potential” inherent in rooftops. The term “solar potential” lacks a precise definition, encompassing a spectrum of information ranging from basic irradiation levels on roofs to sophisticated evaluations of photovoltaic production.
The evolution of solar cadasters is apparent in recent developments, as indicated by references (Kanters and Wall, 2014; Lobaccaro et al., 2019). Initially confined to smaller regions, there has been a notable shift in recent years towards a multiplication of solar cadasters, both in terms of the number of territories covered and the spatial expanse considered. An illustrative example is the Geneva solar cadaster, initially covering 280 km2, which expanded to encompass the Greater Geneva area (2,000 km2) in 2019. This trend is not limited to specific regions; at the European level, numerous countries have achieved comprehensive coverage. Notably, Germany (Tetraeder.solar 2023) proposes near-complete coverage, and Google, with its recent API launch2, enables access to rooftop irradiation data for a substantial portion of Europe.
Solar cadasters serve a central objective: to provide comprehensive irradiance information for a multitude of structures. The primary aim is to empower individuals and local authorities with data essential for informed decision-making regarding solar energy adoption. Local authorities use solar cadasters as a means of encouraging citizens to embrace solar technology by illustrating the unused solar potential on their rooftops. The visual representation of solar irradiance on an interactive map serves as a powerful tool for community engagement, fostering awareness and motivation for Solar System installations. Stakeholder engagement represents one of the key in the energy transition (Garg et Barach, 2021). Indeed, engaging with stakeholders enables municipal and county authorities to collect diverse viewpoints from community members. These insights help identify effective approaches to address community issues and garner backing for the development of solar energy (Zingraff-Hamed et al., 2020).
Despite this progress, the information disseminated by these tools remains markedly heterogeneous. While some cadasters furnish “basic” information, typically pertaining to irradiation (cumulative yearly irradiance per square meter), others offer a comprehensive array of technical, economic, and energetic indicators. The Amsterdam solar cadaster (Zonatlas Amsterdam, 2023) is a prime example, providing insights into PV production, self-consumption estimates, roof characteristics (slope, available area), and techno-economic metrics such as investment and payback period. Some cadasters even allow users to pre-design PV sizing based on available roof areas and irradiance distribution (Luxembourg, 2023). These tools typically propose an optimal surface, often determined by irradiance thresholds or economic indicators, and offer various alternatives based on PV-covered areas.
Data accessibility is a crucial aspect of solar cadasters, and various methods exist to deliver this information to users. One approach involves presenting the data through an interactive map interface, allowing users to visually identify their buildings and explore solar potential. This method enhances user experience, enabling an intuitive understanding of solar viability across different locations. Alternatively, users may input specific addresses to receive precise solar potential data for a designated location. This approach as proposed by the SunSPOT tool (SunSPOT, 2023) from the Australian Photovoltaic Institute or the Google SunRoof Project (Google Projet Sunroof, 2023) caters to those seeking targeted information and facilitates a more direct engagement with the solar cadaster results. The availability of data through both interactive maps and address-specific queries ensures a versatile user experience, aligning with the diverse informational needs of individuals and local authorities alike. Although most of the data are freely available, Google recently introduced an API that offers an address-query method for evaluating solar potential. However, it is important to note that each query through the API comes with associated costs. For most of the current cadasters, data for each building is available through selection or querying the address. However, for the vast majority of these cadasters, accessing the raw data for all buildings at once is not feasible. In other words, to obtain information on a hundred buildings simultaneously, one must manually and individually select each one. Therefore, while these tools are well-suited for users requiring information on a small number of buildings, they become impractical when dealing with a larger quantity (several hundreds, thousands, and beyond). In such cases, the raw data layer of solar irradiance (presented as a table or GIS file) becomes essential.
The project G2 Solar was funded by the European INTERREG Swiss-French program and took place between 2019 and 2022. The goals of the project were to: 1) Intensify the use of solar energy in the Greater Geneva area, 2) generate economic activities around the solar sector, and 3) to contribute to achieving the objectives of the energy transition of the Greater Geneva in the context of urban densification (see Chapter 1). The ultimate goal was to create and perpetuate a platform of competences in solar energy on a Greater Geneva scale.
The project is structured into two components involving different types of partners. On a technical level, it contributed to develop cross-border academic collaboration for the development of urban solar models at the cutting edge of innovation on the scale of Greater Geneva. On an institutional level, the project worked on the dissemination and the appropriation of the solar cadaster, and the solar energy in general, among target actors in the agglomeration.
Figure 2 gives the overview of the methodological approach implemented during the project.
1) The G2 Solar project is based on the solar cadaster initially developed in 2011 for the canton of Geneva (SolCADGE), then updated in 2016. At the time of this update, a Web application (APPGE) was developed to publish calculated data of solar potential and thermal and PV energy production on the buildings and the rooftops of the canton, targeting large audience. All the methodological background of this preliminary development is given in (Desthieux et al., 2018a; Desthieux et al., 2018b).
2) Using the same solar modelling algorithms as for the Geneva solar cadaster, but improving the computation processing to pass from the Geneva canton area of 280 km2 to the Greater Geneva area of 2,000 km2, the raw irradiation on an hourly basis were processed to the whole area of the Greater Geneva. Solar potential and energy production were calculated by building, rooftop and other suitable surfaces like existing covers or potential covers on large open parking areas.
3) The same Web application (APPGG1) as for initially developed for the canton of Geneva was extended with few adaptations including solar potential data from the whole set of buildings and rooftops of the Greater Geneva. The aim of this extension with few adaptations was to quickly get solar potential information on the whole agglomeration at the beginning of the project and to work from that to further improvements and developments during the project.
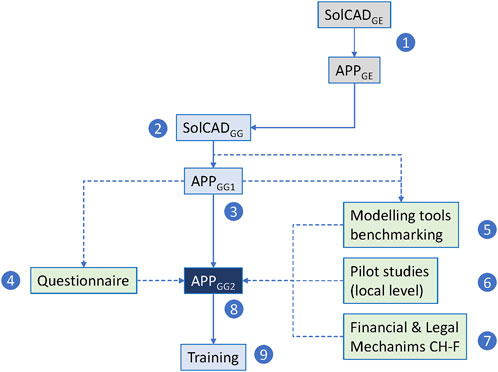
FIGURE 2. Overview of the methodological approach.
The four next stages (in green) contributed to identify the need of improvements.
4) A workshop at the beginning of the project brought together about 20 different users of the Geneva solar cadaster and its APPGE (communes, engineers, installers, energy utilities … ) and enabled to have feedback from them about the solar cadaster. An online questionnaire posted on the Web interface (APPGG1) enabled to have the feedbacks of about 30 users using the APP. Other workshops were organized in the French communities to test and assess the utility of the APPGG1 to initiate local solar projects.
5) On academic and technical aspect, the outputs of the solar cadaster tool were compared with those of common solar modelling tools but specific for the building scale, like DIVA-for-Rhino,Ladybug, ENVI-met, EnergyPlus, or Citysim on a virtual neighborhood (Govehovitch et al., 2021; Thebault et al., 2021). It turned out that the algorithms utilized for the Geneva solar cadasters yielded comparable results in terms of irradiance to those obtained from more building-centered tools.
6) Different local contexts and projects like new neighborhood development, solar planning in villages with heritage issues, building retrofit, solar microgrid in industrial areas, grouping solar communities were investigated. The purposes were multiple: support in launching solar projects, lessons learned on case studies and analysis of the contribution of the solar cadaster in facilitating the initial phases of projects.
7) Another aspect concerns the comparison of the financial mechanisms for setting up solar projects and the regulations between Switzerland and France and also considering local rules depending of the energy utilities. Particular attention was paid to the possibilities and advantages of self-consuming the solar power in the building.
8) The previous stages 4–7 enabled to develop a new version of the Web application (APPGG2) whose KPIs (Key Performance Indicators) meet the requirements expressed through the workshop, the questionnaire and the feedback from local pilot projects and consistent with the varying financial and regulations rules in the different parts of the Greater Geneva.
9) The final stage was to disseminate the new interface and initiate training sessions on this.
The project was successfully completed thanks to a well-organized governance involving three types of Swiss-French partners: academics, public institutions and energy suppliers (DSO).
The project was led by academics who, in collaboration with the other partners, developed and implemented the methods and tools to carry out the solar cadaster and the various tasks. The HES-SO (University of Applied Sciences of Western Switzerland/Geneva) coordinated the Swiss consortium, implemented the solar cadaster, worked on the Swiss financial and regulatory mechanisms and developed the methods for simulating the self-consumption of solar energy. The web application (APP) was developed by the Swiss IT company arx iT. USMB (University of Savoie-Mont-Blanc) based in Annecy and Savoie Technolac coordinated the French consortium, worked on the French financial and regulatory mechanisms and the benchmarking of the solar modeling tools together with the University of Lyon (CETHIL). INES (National Institute of Solar Energy) based in Savoie Technolac worked on the dissemination and training on solar energy in the local communities.
The project involved the public institutions representing the three main geographical entities of the Greater Geneva area: the Canton of Geneva, the Canton of Vaud and the Region of Nyon (which is the Vaud region included in the Greater Geneva area), and the PMFG, which represents the French municipalities of the agglomeration. They were mainly involved in steering the project and facilitating access to the necessary data for the solar cadaster. The Canton of Geneva also organized solar energy workshops with local stakeholders. The Nyon Region helped local municipalities organize meetings with building owners to promote solar energy. PMFG engaged the INNOVALES association to promote solar energy in local French communities with the support of INES, as well as CAUE-74 (Council for Architecture, Town Planning and the Environment in Haute Savoie) to work on solar energy in the context of heritage protection.
Finally, distribution system operators (DSOs) are key partners in moving from potential analysis to implementation of solar projects. By testing the solar cadaster and web application on real cases, they helped to improve the tools. They also provided necessary data such as electricity consumption and load curves. ENEDIS is the main DSO in France. But in Switzerland, DSOs are much more decentralized, about 600 in total, at regional and mostly municipal level. In the canton of Geneva, SIG (Industrial Services of Geneva) has the monopoly of energy distribution. In the Nyon region, there are three different DSOs. For the G2 Solar projects, SIG and ENEDIS were directly involved, while the Nyon Region acted as a link with the three local DSOs.
The purpose of establishing a governance structure in the G2 Solar project is to ensure the continuous promotion and advancement of solar energy development in the Greater Geneva via the solar cadaster over the long term.
This chapter aims at presenting the results of the development of the solar cadaster across the Greater Geneva as a support for promoting solar energy in the region. It is structured into two parts: (Section 4.1) the calculation of gross solar irradiation, (Section 4.2) the development of public interfaces in several stages to make the solar potential accessible to a large audience.
The gross solar irradiation provides the fundamental data required to measure solar energy output on building roofs. It was computed using a raster method with a resolution of 0.5 m × 0.5 m and encompasses the entire terrain, including not only buildings but also other solar access applications, such as solar carports in open parking areas, solar panels in open fields combined with agriculture, and solar pavements. The primary data source is the digital surface model (DSM), which is derived from aerial LIDAR data and weather data. Slope, aspect, and shadow casting are computed by pixel from the DSM. Shadows are calculated at two levels: the local surroundings (buildings, vegetation), and the relief from distant regions. Local statistics on global and diffuse solar radiation on a horizontal area are obtained from weather data using the Metenorm® tool3. The Hay model (Hay, 1979) is used to transpose this information onto a tilted area with a specified slope and aspect. All processes are detailed in (Desthieux et al., 2018b) regarding the creation of the solar cadaster of the Canton of Geneva. Solar irradiation is computed on an hourly basis, pixel by pixel, and then aggregated to monthly and yearly levels. In extensive regions such as the Canton of Geneva and the Greater Geneva area, solar radiation is calculated per tile instead of all at once. The tiles’ dimensions are 3 km by 3 km, and an extra buffer of 200 m is added to account for potential mutual shadows among tiles. Parallel looping permits multiple tiles to be calculated at once. After this, the maps of the tiles are compiled to the size of the territory being studied.
However, extending the solar cadaster from the Canton of Geneva to the Greater Geneva, which includes three administrative entities (Geneva, Vaud, and France), presents three key challenges.
Firstly, it is essential to create a DSM for the entity whose release dates were not uniform - 2014 for France, 2015 for Vaud, and 2017 for Geneva. At the time of the extension in 2019, France and Vaud faced a key issue: the release dates had already passed, resulting in all buildings constructed thereafter being excluded from solar potential assessment. Vaud partially remedied this issue by updating solar irradiation through a new version of the DSM in 2019. Currently, this problem has global implications as all utilized DSM are outdated, and therefore a comprehensive revision of the solar cadaster would be necessary to incorporate new DSM updates.
Secondly, due to the small (280 km2) and flat area of the Canton of Geneva, weather conditions are relatively uniform. Consequently, only one weather station at the airport was considered for the solar cadaster. However, in the case of the Greater Geneva with a much larger area (2,000 km2) and mountainous terrain, the climate is heterogeneous. To resolve this, the tool Metenorm® offers a function that interpolates weather data between measurement stations, considering the variation in cloud cover based on satellite images. Therefore, we generated a representative weather data file for the Greater Geneva extension by tile.
Finally, the vast area of Greater Geneva necessitated the adaptation of computing tools to process data within a reasonable timeframe. The environment in Geneva was based on CPU parallel machines. As for the extension to Greater Geneva, algorithms had to be adapted to run on a GPU machine, which is particularly suitable for processing matrices such as raster grids. This significantly reduced the processing time from 15 h per tile using CPU machines to 1–1.5 h using a single GPU machine. A total of 15 days were required for processing all 292 tiles in Greater Geneva, which is a reasonable duration for a task that needs to be repeated every 3–5 years, according to the updated DSM release.
The procedures for weather data interpolation and computation are detailed in (Stendardo et al., 2020).
The primary outcome of this section is illustrated in Figure 3, which displays a raster map of the annual solar irradiance in the Greater Geneva region. On this basis, indicators of solar energy potential can be calculated by building.
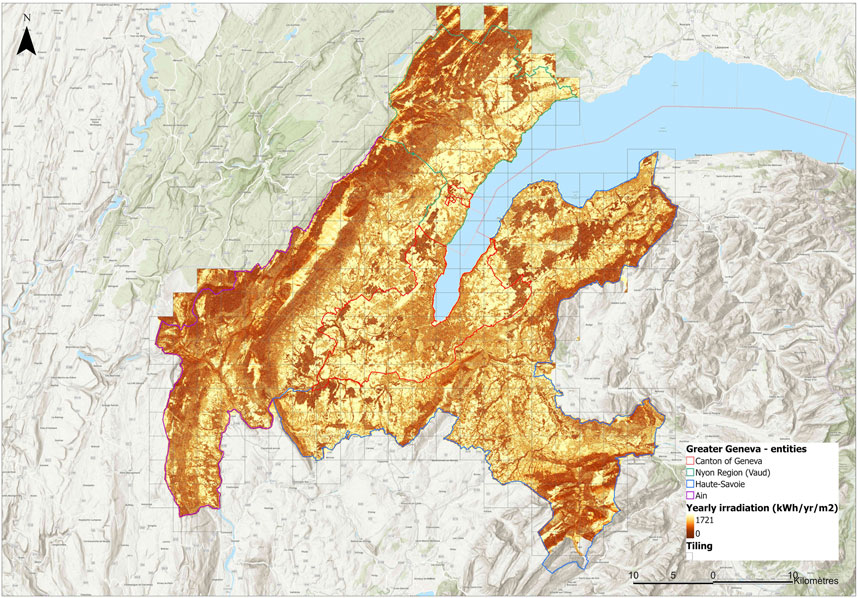
FIGURE 3. Raster map of the annual solar irradiance in the Greater Geneva region, with the grid of tiles superimposed.
At the time of the Canton of Geneva’s solar cadaster, a public web interface (APPGE) was implemented to promote solar installations in built-up areas, as mentioned in Chapter 3.1. The aim was to increase awareness among private and public entities about the solar energy potential available on many rooftops in Geneva. This application displayed the roof areas suitable for solar installation, with a minimum irradiation of 1,000 kWh/m2 per year (Figure 4). It also showed useful indicators for each roof, including geometry, solar energy production, and investment costs, for both thermal and photovoltaic applications. The data was precalculated, and users could not modify any parameters to customize the results.
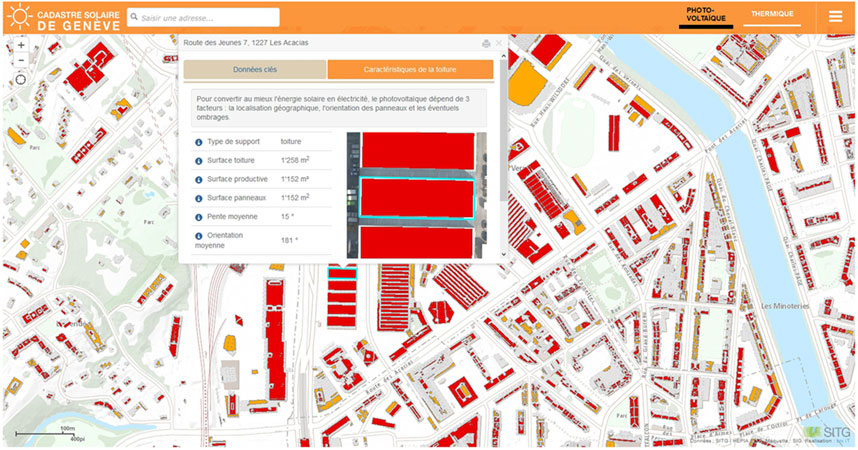
FIGURE 4. Web-based application developed by arx iT under mandate of SITG; example of display for main rooftop characteristics. Reproduced with permission from ©Frontiers Desthieux Gilles et al. (2018b).
As presented in Chapter 3.1, the application was then extended to the Greater Geneva (APPGG1) without technical modifications. The utility of this application and areas for improvement were primarily investigated through two manners detailed in the next sections: workshops and questionnaires addressed to users of the initial APP version (Section 4.2.1) and lessons learned study from pilot solar project at local levels (Section 4.2.2). Furthermore, the solar cadaster has been frequently employed in academic research to test and develop innovative applications, as summarized in the third section of this chapter (Section 4.2.3).
Workshops were organized with the APP users, and a questionnaire was distributed to a broader range of users to identify areas for improvement in the APP for a new version. The propositions are summarized at the end of this section after introducing the workshops and the questionnaire.
The first workshop organized by HES-SO and the Canton of Geneva, held in November 2018, included approximately 20 representatives of APPGE’s users from municipalities, the administration of Geneva, energy utilities, universities, and engineering companies. The goal was to share their experiences using the APP. According to representatives from public administrations, many building owners submitted requests for solar installations after consulting the APP. Therefore, the latter serves as useful support for initiating solar projects.
Four workshops were organized by INNOVALES and INES in the French communities of communes, involving mayors, elected officials, and municipal technicians between November 2020 and May 2021. Three of these workshops were held in the Pays Rochois community (CCPR), and one in the Fauciny-Glières community (CCFG). In France, communities of communes generally need to establish a master plan for air, energy and climate transition (PCAET), making the solar cadaster a valuable tool in this regard. These workshops achieved the following objectives: raised awareness about solar energy in general, presented the solar cadaster of Greater Geneva and its APPGG1, sharing feedback on its use, discussed suitable municipal buildings for solar energy installation with the support of the APPGG1, initiated projects in the framework of the Village solar power plant of CitoyENergie (see chapter 4.2.2). The workshops highlighted the need for organizing training sessions on solar energy. Consequently, a 2-day training session was held in Annemasse in March 2022, covering fundamentals of photovoltaic and thermal solar energy, practical setup of solar projects, and the use of the new version solar cadaster APPGG2 tool. A total of 18 participants, including elected representatives, technicians, local authority staff, energy information advisors, and local businesses, attended the training.
Finally, an online questionnaire4 was sent to 270 known users in the beginning of 2021 and was also published on the APPGG1 website. The aim of the questionnaire was to provide feedback on the use of the APPGG1, and to assess its strengths and weaknesses, as well as areas for improvement, with a view to the development of the new version APPGG2. In total, 30 people responded to it. The profiles of the individuals who responded to the questionnaire included: Citizen cooperatives, Architects, Installers/design offices, Solar industry suppliers, Project owners, Administrative bodies, Energy operators, Heritage protection department, Property management companies.
The following closed questions were asked:
- Do you find the platform easy to use?
- Do you find geolocation easy to access?
- Do you find it easy to identify functions in the menu?
- Do you find site navigation coherent?
- Is the information provided sufficient and clear?
- Based on this initial information, would you go ahead with an equipment project?
For all these questions, the level of satisfaction is generally above 70%, indicating the APP’s simplicity of use. The respondents generally wish (69%) to go ahead with a solar energy project.
The following open-ended questions (with free-form comments) were asked:
- What’s missing from the Web platform?
- What needs to be added?
- What’s your overall assessment?
The outputs of the recommendations derived from these questions, combined with the feedback received during the workshops, are as follows:
1) Create a more dynamic, interactive and ergonomic interface.
2) Evaluate the potential for self-consumption of the solar PV energy produced.
3) Propose a more detailed technical and economic assessment (ROI, profitability, optimal surface area, self-consumption), and provide key data.
4) Prefer east-west orientation of installations (domes) on flat roofs.
5) Plan and contract for regular updating of the solar cadaster and revision of economic assumptions (tariffs).
6) Evaluate the cost and constraints of connecting to the electricity grid.
7) Provide better information on the steps involved in installing solar systems, and on the professionals authorized to guide homeowners through the various stages.
8) Cross-reference solar data with other layers: town-planning, architectural, heritage, energy master plan, glare risk zone (airport).
9) Inform whether the building is already installed by solar panels.
10) Enable extraction and export of data for multiple buildings at once (owner’s building stock), or facilitate grouped evaluations
11) Archive queries for easy retrieval.
12) Set up an exchange forum: community of best practices, examples, chat, co-development (networking players), pointing out any errors.
13) Provide information on technical roofing constraints, such as the quality of roofing and framing.
14) Propose a design of the installation’s layout which enables to better specify the potential.
15) New buildings: provide the option of modeling a building to be constructed (or importing a project) and simulating its solar potential.
16) Simulate solar potential according to panel and inverter type.
Meeting all those requirements at once was undoubtedly ambitious. However, this list helped identify the priority tasks for the new APPGG2 development (see Section 4.4), with the prospect of incorporating others in subsequent versions.
Another aspect was to provide feedback on pilot solar projects at neighborhood level, taking into account different contexts. The aim was to assess what kind of support was needed to bring these projects to completion, and whether tools such as the solar cadaster or other specific solar modeling tools could help in this respect. Figure 1 shows (black circles) an overview of the investigated case studies.
1) Solar energy within the constraints of heritage. Burtigny is a small village in the Nyon Region in the canton of Vaud (Figure 5A), and holds overall protection as a designated ISOS perimeter according to the Swiss federal classification. Moreover, certain specific buildings within the village demand additional and distinct protective measures. The map in Figure 5B illustrates the various levels of protection, including both perimeter and specific building designations, sourced from the geoportal of the canton of Vaud. In this context, the Municipality of Burtigny has drawn up a study on the integration of solar panels and built heritage to aid decision-making. The aim of the document is to provide useful information and recommendations on building-integrated solar installations, to find concerted solutions with owners, to raise awareness among citizens and installers, and to establish a regulatory framework. The solar cadaster reveals a potential of approximately 2 MWp (using photovoltaic panels) on well-irradiated roofs. However, this potential needs careful consideration in light of heritage constraints.
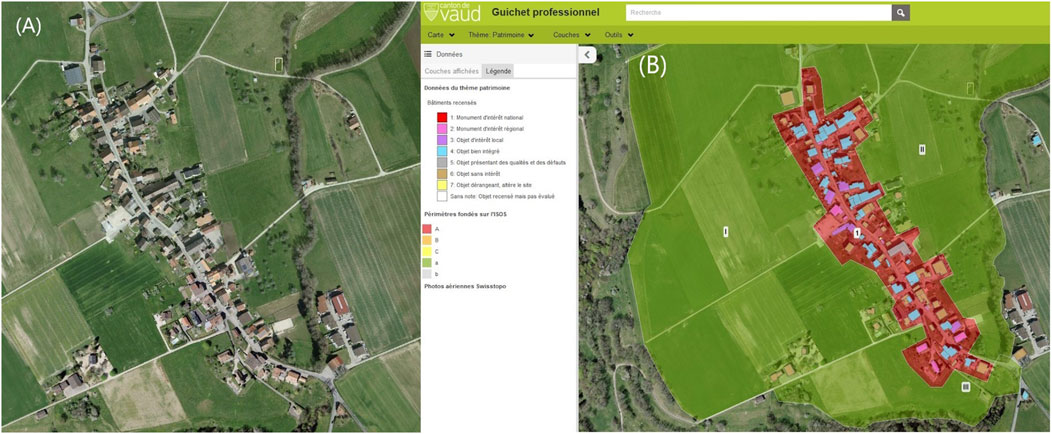
FIGURE 5. Global view of the village of Burtigny, reproduced from ©Swisstopo (A) and heritage protection map from the geoportail of the canton of Vaud, reproduced from © Geodata Vaud and Swisstopo (B). No permission is required from the copyright holders for the use of these images in this manuscript.
Drawing from this experience, a map of heritage constraints was developed for the Greater Geneva area, compiling data from Geneva, Vaud, and France. The objective was to overlay the solar potential with this map, identifying perimeters and buildings requiring specific integration or, in some cases, prohibition for particular structures, and finally find the best compromise between solar energy and heritage protection. This map presented in Figure 1 (brown areas) encompasses protective zones at the perimeter level (such as natural areas along river and lake shores, historical zones, and villages) as well as specific buildings (historical structures and high-value architectures). Notably, the State of Geneva (République and Canton de Genève, 2022) has published a guide for solar installations, featuring a dedicated chapter on integrating solar solutions into protected buildings and areas.
2) Group tender. Between 2019 and 2020, the Municipality of Gland (in the Nyon Region) organized a group tender to install solar panels on several individual buildings simultaneously. The objective was to leverage the collective project for a potential discount, benefiting from economies of scale compared to individual endeavors. The process involved conducting workshops to raise awareness among interested property owners about the advantages of solar energy. Subsequently, a group tender was sent to three different solar installation companies. Ultimately, only 13 owners proceeded with the installation, and the discount offered ranged from 1% to 3%. In 2022, the Municipality initiated another call, this time inclusive of condominium owners who were excluded from the initial round. This second attempt saw much greater success. In this context, the solar cadaster and its associated APPGG1 played a crucial role in identifying buildings with significant solar potential. They provide essential energy and economic indicators to facilitate the preparation of the call for tender.
3) Solar communities in the French villages. CitoyENergie5 is an Energy Village Cooperative established in November 2018 with the goal of developing renewable energies and fostering direct citizen participation in the energy transition. Village Cooperatives thrive through citizen involvement: individuals come together within societies to finance local projects, such as solar installations (in the form of capital shares). These projects also materialize through close collaboration with other local stakeholders, including communities, associations, and local businesses. CitoyENergie has already completed 10 shared solar installation projects in the French Geneva region, with two additional projects currently underway (Figure 6A et Figure 6B). During the project’s inception, stakeholders utilized the solar cadaster tool to identify suitable rooftops. Therefore, the solar cadaster played a significant role in launching these projects.
4) Solar energy and renovation at the neighborhood scale. The Cité Carl Vogt deals with a set of five collective social buildings that underwent renovation between 2018 and 2023 (Figure 7A). The comprehensive energy project included refurbishment, connection to a thermal energy network supplied by a central heat pump utilizing the lake, and the integration of solar energy on roofs. The buildings enjoy partial heritage protection, which posed constraints on facades’ insulation but permitted solar installations on roofs without restrictions. This case highlighted a notable disparity between the solar potential estimated by the solar cadaster tool (740 kWp) and the actual installations (210 kWp). The installed capacity was limited by technical equipment (e.g., ventilation pipes, chimneys) occupying a significant portion of the roofs, reducing the available area (Figure 7B). Although LIDAR images can detect these technical elements, they are not categorized as such in building and roof cadasters, and not considered in the solar potential calculations—a specific limitation worth noting.
5) New urban developments. The ZAC Ferney-Geneva Innovation is a mixed-use project covering 65 ha in the border town of Ferney-Voltaire, carried out by SPL TERRINOV. This ambitious initiative aims to develop 412,000 square meters of floor space, allocated for business areas, housing, and public facilities by the year 2030. The energy project is highly ambitious, incorporating the utilization of thermal waste from CERN in an energy loop with seasonal storage in geothermal probes, a high density of solar installations on roofs and facades. The solar project focuses on the implementation of photovoltaic systems with a local smart grid and a collective self-consumption strategy. The plan allocates 20% of future roofs to the installation of photovoltaic panels. A key element of the design is the discreet integration of the solar panels into the building volumes, so that they remain invisible from the street, preserving the aesthetic appeal of the neighborhood. By adapting energy distribution to the district’s residential and commercial character, the proposal enables businesses to use solar energy during the week, according to their operational needs, while households benefit from it at weekends. The electricity generated both meets daily consumption needs and powers the heat pumps connected to the planned heating and cooling networks, providing a well thoughtful and comprehensive renewable energy solution for the planned district. Another case study involves the construction project in the PAV sector in Geneva (urban project “Grosselin”), which plans to transform a vast industrial and artisanal zone into a mixed-use urban quarter with 500'000 square meters of floor space (Figure 8A). A comprehensive community solar energy project is planned through the development of a self-consumer group. Various layout options were simulated using the solar cadaster tool (which also analyzes solar potential on facades), helping identify the variant that generates the most solar energy on both facades and roofs (Figure 8B). While the solar cadaster is designed for existing buildings, there is also an interest in simulating recent or future projects.
6) Solar microgrid development in an industrial area. The Foundation for Industrial Areas of Geneva (FTI), a public law company is responsible for the development and management of the industrial estate it owns, and in charge of the planning and equipment of the industrial zones throughout the Canton of Geneva. Additionally, its plays a key role in fostering the growth of companies within the Canton of Geneva. This case study focuses on the expansion of the ZIBAY industrial area in Geneva, where FTI grants building rights to companies. Currently, there are ongoing construction projects on six plots within ZIBAY (Figure 9A), featuring large roofs that can be utilized for solar photovoltaic (PV) panels. The ZIBAY low-carbon project, in collaboration with SIG (the main energy utility in Geneva), aims to promote local industrial synergy and involves the creation of an electrical microgrid network to efficiently distribute solar energy among participating companies. The solar installation is concentrated on one of the industrial buildings (Figure 9B), boasting a total power capacity of 1.4 MWp. The goal is to attain a 100% self-sufficiency rate for the six industrial plots through the microgrid. Notably, the area encompasses a logistics center, which, in the future, will house a fleet of electric trucks recharged via the microgrid. The studied pilot project only concerns six industrial buildings under construction. However, the current site of ZIBAY comprises 200 companies, a consumption of 10 GWh, and 50,000 m2 of roofs. Thus, there is a real potential to intensify solar production, expand the microgrid, ultimately gain autonomy by using storage systems. The solar cadaster and the technoeconomic simulation tools for self-consumption that have been developed can contribute in this direction.
7) Power network reinforcement and flexibility. Under the impact of the massive increase in renewable electricity production, the development of self-consumption, and the emergence of new electricity uses such as electric vehicles, the challenges of the electrical system are shifting towards the distribution network (ENEDIS, 2019). A major challenge for the network is to maintain the reliability and quality of electricity supply while managing increasingly intermittent flows. The challenges are both technical (managing the network with real-time data) and economic (optimizing the costs of integrating renewable energies, for example), within the framework of regulations. The network manager plays an increasingly important role as a market facilitator, especially in bringing forth new tools such as flexibilities to optimize the electrical system. In this context, ENEDIS, partner of the G2 Solar project conducts experiments on what is known as local flexibilities. It has developed a Web tool (API) that allows users to check the grid capacity of any building to absorb solar power or the required costs to reinforce the grid connection. This issue is particularly significant in the French communities of Greater Geneva. Therefore, the idea arose to incorporate such a tool, developed by ENEDIS, into the solar cadaster web application tool.
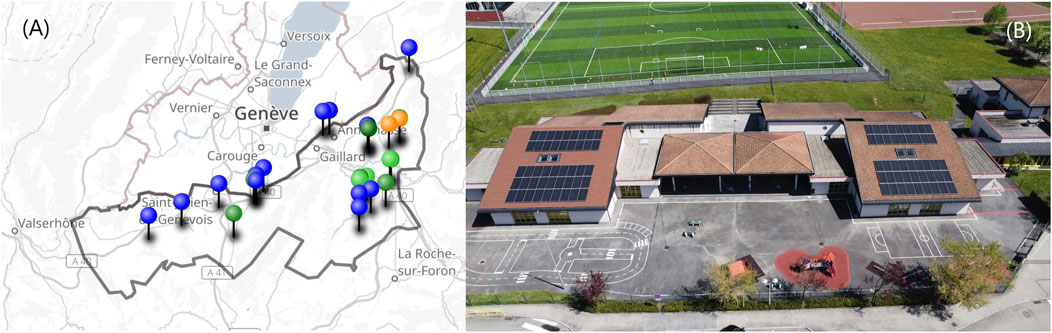
FIGURE 6. Map of the solar projects of CitoyENergie (A) and example of one of the projects on a school in Reignier (B), published with the permission from © CitoyENergie.
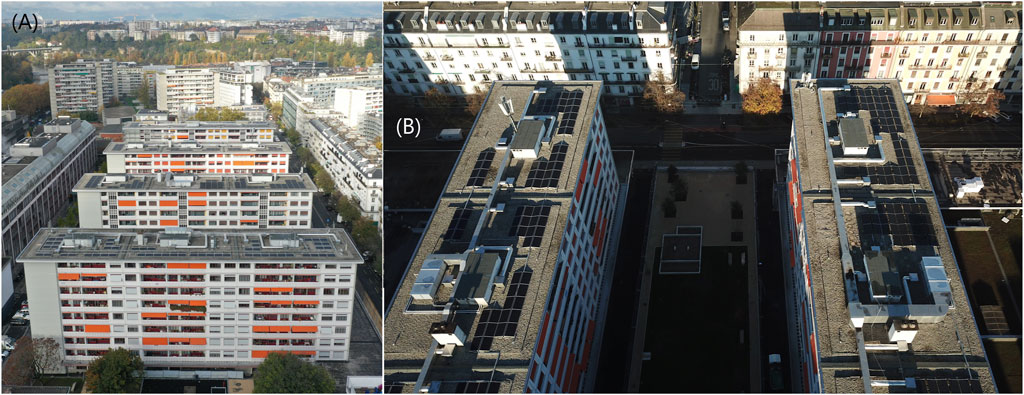
FIGURE 7. Completed renovation of the buildings (A), solar installation on the roofs with a limited area available due to technical equipment (B), published with the permission from © Hospice General Geneva.
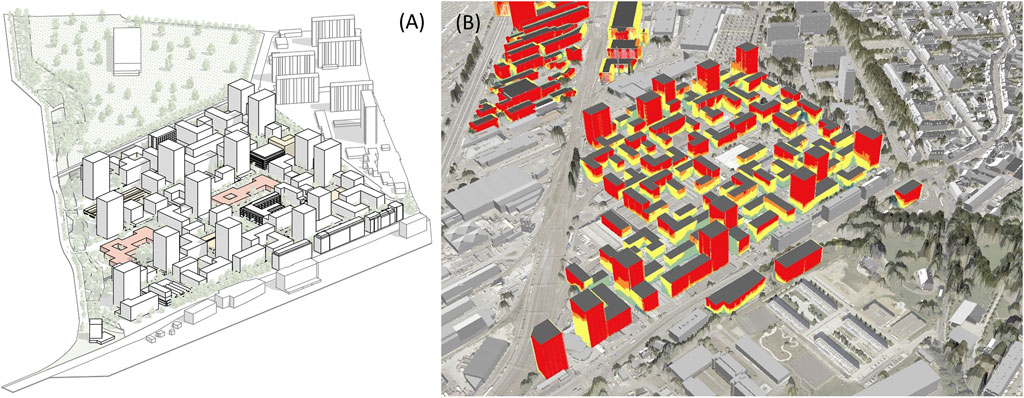
FIGURE 8. Master plan of the urban project of Grosselin in the PAV sector, published with the permission from © Atelier Bonnet (A), solar simulation of one of the alternatives using the solar cadaster tool (B).

FIGURE 9. Map of the six industrial plots location to be built and connected to the microgrid, orthophoto from © SITG (A), Solar central implemented on the industrial building of the plot 2 (B) published from © LyndsayPhotographyGenève with the permission from the image’s holders SIG and FTI.
Finally, the cases of Ferney-Geneve Innovation, PAV–Grosselin, and ZIBAY were promoted within the framework of the project Task 63, titled “Solar Neighborhood Planning,” which is part of the Solar Heating and Cooling Task program of the International Energy Agency (IEA). The outcomes of this project are presented in (Manni et al., 2023).
In addition to the common uses of solar cadasters for local decision makers, one result of the solar cadaster in the canton of Geneva and further the Greater Geneva is that its data are made available in open access through the SITG geoportal. One consequence has been the utilization of these data for research purposes, particularly in large-scale studies where calculation of irradiance in the built environment was required.
(Mohajeri et al., 2019) investigate the impact of street-canyon geometries on solar access in Geneva, Switzerland. Findings indicate that street orientation significantly affects annual solar radiation, with WNE-ESE-oriented streets receiving the highest surface radiation, and SSW-facing facades receiving the most. The research suggests that optimizing urban density can contribute to thermal comfort by minimizing summer solar exposure on streets and maximizing winter exposure on building facades. In this case the entire city of Geneva is investigated and irradiance data on the street, available from the solar cadaster is used.
At a greater spatial scale, here the Canton of Geneva, (Boccalatte et al., 2022), proposed GIS-based methodology to evaluate the impact of urban morphology on solar energy harvesting from building rooftops. The research analyzes 60,000 buildings and calculates 40 morphological features. The rooftop overall shading rate, measured as the scaled insolation, reveals moderate correlations with parameters such as building height and volume. Results show variations in insolation distribution across the city, with denser downtown areas exhibiting higher correlation levels compared to suburban regions. In this study, the data of irradiance on all roofs was used to define a shading factor.
More recently the data of the entire Greater Geneva agglomeration (265,000 buildings) were used by (Thebault et al., 2022) in a study that presents a multicriteria approach to assess the suitability of buildings for photovoltaic (PV) system deployment. Technical (roof complexity), economic (payback period), environmental (CO2 reduction), energy (self-consumption), and social (heritage constraint) criteria are considered. Using the ELECTRE TRI method, buildings are categorized into “very high” (A), “high” (B), and “moderate” (C) PV suitability. Prioritizing A-ranked buildings could potentially generate almost 50% of Geneva Canton’s annual electricity consumption through PV systems, offering a decision-aiding tool for territory-scale energy transition goals.
Another study of (Mohajeri et al., 2018) used Support Vector Machine (SVM) classification to categorize 10'085 building roofs in Geneva, based on their received solar energy. The SVM accurately identifies six roof shapes in 66% of cases, including flat and shed, gable, hip, gambrel and mansard, cross/corner gable and hip, and complex roofs. The classification is conducted considering the roofs’ useful area for photovoltaic installations and their potential for solar energy reception.
Apart from the solar cadaster of Geneva, other cadasters are getting used in order to conduct academic studies. Chatzigeorgiou et al. (2023) used the solar cadaster of Thessaloniki, Greece (40°37′N, 22°56′E) in order to assess the potential of the covered districts to reach net-zero energy. Based on a solar cadaster of Valencia (Spain) (Cuesta-Fernandez et al., 2023) analyzed the potential of Rooftop-PV to decarbonize urban areas through self-consumption.
All these study shows how giving access to these data can provide a prolific ground for academic research. The use of solar cadaster appears then as a tool that is determinant for solar city planning and that should be developed in close collaboration with other academic fields as well as local decision makers (Zhu et al., 2023).
Partners of the G2 Solar project agreed that special emphasis was placed on enhancing the energy autonomy of buildings through the self-consumption of solar energy. This involves prioritizing the use of solar energy generated by the panels within the building to power electrical devices, heat pumps, and electric cars. Additionally, any surplus energy is sold back to the grid. Conversely, the grid provides the necessary electricity when the panels are not producing enough.
The new version of APPGG2 presented later, therefore, includes the simulation of self-consumption for the 265,000 buildings across the Greater Geneva region. This simulation involves creating an hourly energy balance between the produced solar energy and the electricity demand. The approach relies on the annual potential solar energy estimated by the solar cadaster and electricity requirements, with these values being distributed using hourly profiles. Further details about this process can be found in the multicriteria approach presented by (Thebault et al., 2022), particularly in relation to the criteria C1.
Self-consumption is typically profitable, given that the electricity grid tariff is generally higher than the cost of the solar installation per kWh, and the latter is itself more expensive than the price of energy sold back to the grid. To achieve an economic balance, it is crucial to have a comprehensive understanding of all energy prices.
This simulation presents two particular challenges when working in a transborder region like Greater Geneva.
Firstly, financial and regulatory mechanisms differ between France and Switzerland, and even among municipalities in the Canton of Vaud, particularly regarding electricity tariffs, as Distribution System Operators (DSOs) vary from one commune to another.
With the adaptation of the Swiss energy law in 2018, subsidies for solar energy shifted from supporting solar power generation (CHF/kWh) to a unique investment incentive (CHF/kWp). DSOs are obligated to purchase surplus solar energy but generally at a lower price than the installation cost, as mentioned earlier. This system makes it more profitable to maximize self-consumption rather than selling the total solar electricity to the grid, as was the case before 2018. Due to the significant increase in electricity prices since 2022 and the buyback prices by DSOs throughout Switzerland, maximum profitability is achieved when installing solar panels on the entire available roof, which is very positive for promoting solar energy. In contrast, before the current energy crisis with low energy prices, profitability was often achieved by installing panels on only half of the available roof. Since 2023, adaptations to the regulatory framework have allowed for additional subsidies for selling solar energy to the grid, which is particularly relevant in the case of farms with large roofs but limited electricity demand proportionally.
In France, the situation is distinct. Firstly, EDF serves as the primary electricity provider, and ENEDIS manages the majority of the grid while also purchasing surplus solar energy. Currently, French property owners face two options: either sell all the generated electricity at an appealing feed-in price or consume a portion of the generated electricity and sell the excess to the grid at a less favorable but still interesting price. The first option is termed ‘Total Sale,’ and the second is ‘Excess Sale,’ with the latter corresponding to the self-consumption scenario. Moreover, a subsidy is provided to owners who choose the second option. For both choices, the feed-in tariff and subsidy decrease at specified thresholds based on the installation size (3, 9, 36, 100 kWp, etc.). These financial conditions and thresholds often result in the maximum profitability not aligning with the installation of solar panels across the entire roof or the sunniest portions of the roof. Numerous residential PV installations, for example, have been limited to 3 kWp due to this threshold, even when a larger part of the roof could have been utilized based on available surface and/or received irradiance. Historically, owing to the high feed-in price and the low cost of electricity in France, the “Total Sale” option provided a more favorable payback period in past decades, making it the predominant choice. But in the last few years, there has been a shift: the increase in electricity prices has contributed to raising environmental awareness among people and their desire to self-consume. Nowadays, for small residential setups, the self-consumption option is increasingly chosen.
The second challenge involves the intricate data management required to provide inputs for the self-consumption simulation, considering different systems between Geneva, Vaud, and France. The geoportal of Geneva (SITG - Geneva Land Information System) manages several spatial data layers at the scale of Greater Geneva, such as the common building cadaster, but additional data were necessary for processing. The first aspect is to have a comprehensive building layer, including details like floor area and type of use. When the electricity demand is unknown, it can be estimated by multiplying a normative electricity index by the floor area, with the index varying according to the type of use. Floor area and type of use data are well-documented in the Geneva and Vaud databases but are less accurate in France. For example, the category of use is undifferentiated for buildings used for individual housing, collective housing, and offices, while it is known that the electricity profile loads differ between these categories. The second aspect is the electricity demand. In Geneva, SIG provided data on electricity demand by building and category of use for almost all the buildings. In France, ENEDIS could only provide this information for buildings with more than 10 clients, representing about 5,000 out of 150,000 across the French communities. In Vaud, no information on electricity could be provided. To address this, the solution was to create a harmonized calculation base, combining input data (tariffs, electricity demand) from different sources and varying in quality (reliability). Therefore, the quality and reliability of the self-consumption outputs differ depending on the data source. The quality is generally high for buildings in Geneva.
The workshops, questionnaire, and case studies enabled a better understanding of opportunities and constraints in initiating local solar projects in various contexts, as well as expectations regarding the solar cadaster’s APP to support the design of such projects. Within the framework of the G2 Solar project, all academic, institutional, and DSO partners reached a consensus that the development of the new version of the APP (APPGG2) should prioritize the implementation of recommendations 1 to 8 as listed at the end of chapter 4.2.1, with particular emphasis on self-consumption simulation as presented in the last chapter 4.3. The APPGG2 works as showed in Figure 10.
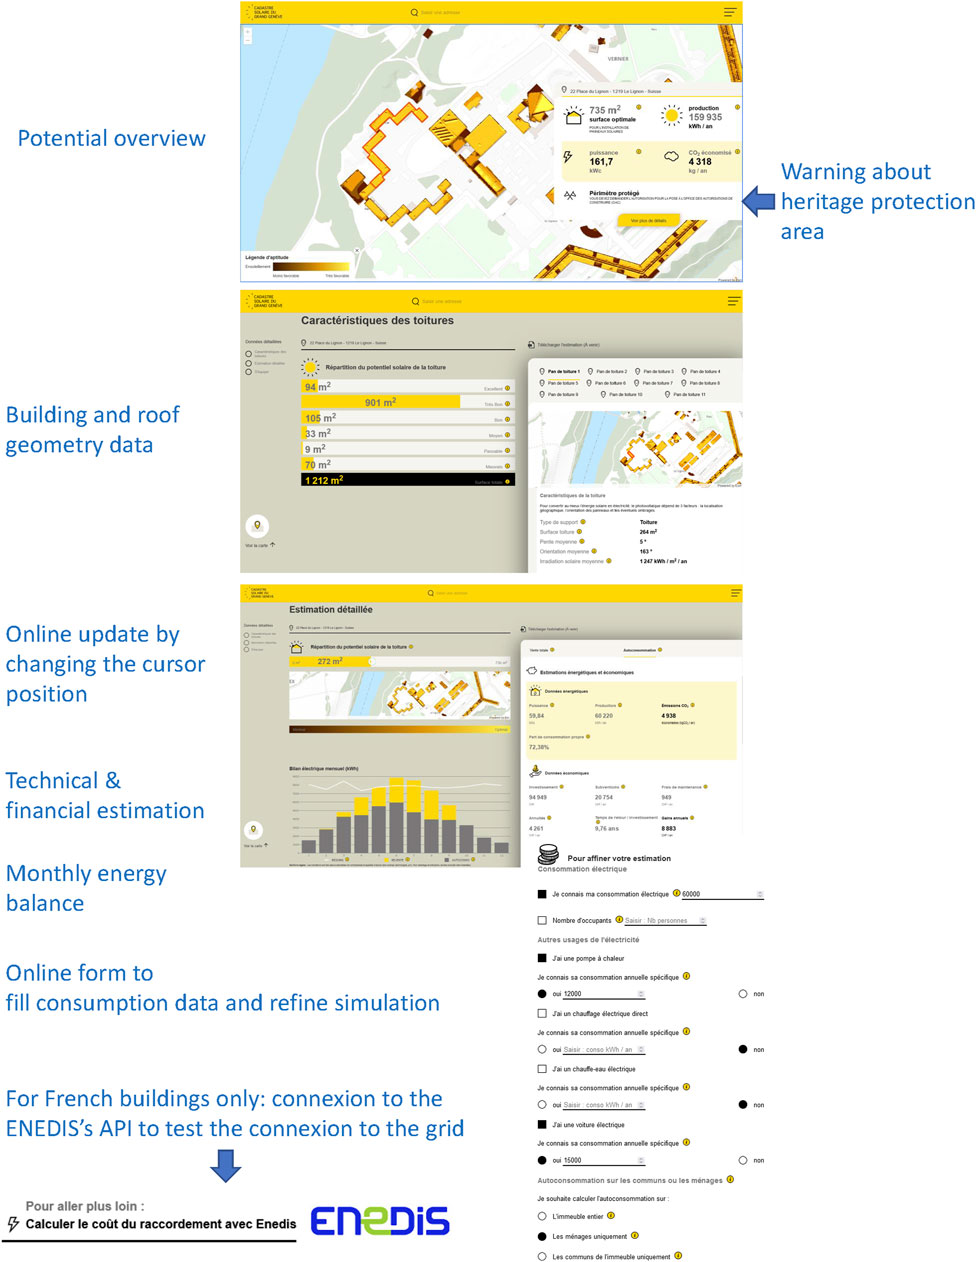
FIGURE 10. Modules of the Web application APPGG2. Reproduced from ©SITG—https://sitg-lab.ch/solaire (2023). No permission is required from the copyright holder for the use of this image in this manuscript.
Upon connecting to the APP, it showcases the yearly irradiation map of the buildings in Greater Geneva. Users can either zoom in on a specific building or enter an address. The selected building will display key indicators, providing an overview of the potential installed area, energy, power, and saved CO2 emissions. As showed in the example, there is a warning message in case if the building is located in a heritage protection area.
On the left side, the next module presents the distribution of roof area, categorized by irradiation levels from “excellent” to “low.” On the right side, detailed information about each roof section, including area, slope, aspect, and mean yearly irradiation, is provided. Note that this function is not available in the French part due to the absence of the roof section layer available.
This feature represents the main innovation of the APP compared to the previous version, offering a dynamic and interactive experience. Starting from the optimal solar potential, users can modify the installation size online, automatically updating the balance.
Depending on the cursor position, the module provides energy and economic performance indicators (further listed). The calculation is made for two options: total sale of solar power (particularly relevant in the French side) and priority to self-consumption.
The graph illustrates the monthly balance of electricity demand (white curve), self-consumed solar power (grey column), and resold power to the grid (orange column), based on the cursor position.
Due to poor input data quality in the French and Vaud parts, users can refine the simulation by specifying their electricity consumption as a whole and by consumption item (e.g., heat pump, electric heater, e-car). For block of flats, users can choose to perform the balance for the whole building, housing units only, or common parts of the building. For the French part only, the user can connect the ENEDIS’s API to test the connection capacity to the grid.
The last part, not illustrated here, provides practical information for initiating and carrying out the project. It also includes a list of professionals to contact based on the building’s location in Geneva, Vaud, or France.
The following list provides an overview and summary of the KPIs offered by the online platform:
- Roof Indicators: area, average slope, aspect, yearly irradiation, and roof area categorized by level of irradiation.
- Energy Indicators: potential installed solar PV area, power, yearly energy production, CO2 emissions saved, and self-consumption rate.
- Economic Indicators: total investment, subsidies, operational costs, yearly incomes, annuities, and return on investment period.
The new APPGG2 was officially launched and presented during the annual European Energy Transition Conference (AETE) held in Geneva in June 2022. The conference saw attendance from key stakeholders in the energy sector in Greater Geneva, providing an opportunity to showcase the tool, as depicted.
Finally, all the indicators presented by the APP are derived from precalculated data stored in the building database, available in open access by the SITG. The SITG geoportal offers a range of thematic maps, and the solar cadaster is depicted on the energy map, as shown in Figure 11. The distinction with the APP lies in the fact that the geoportal primarily addresses to a more technical and expert audience. Moreover, there is no capability to dynamically modify parameters online, such as the solar installation area, or input data like electricity consumption.
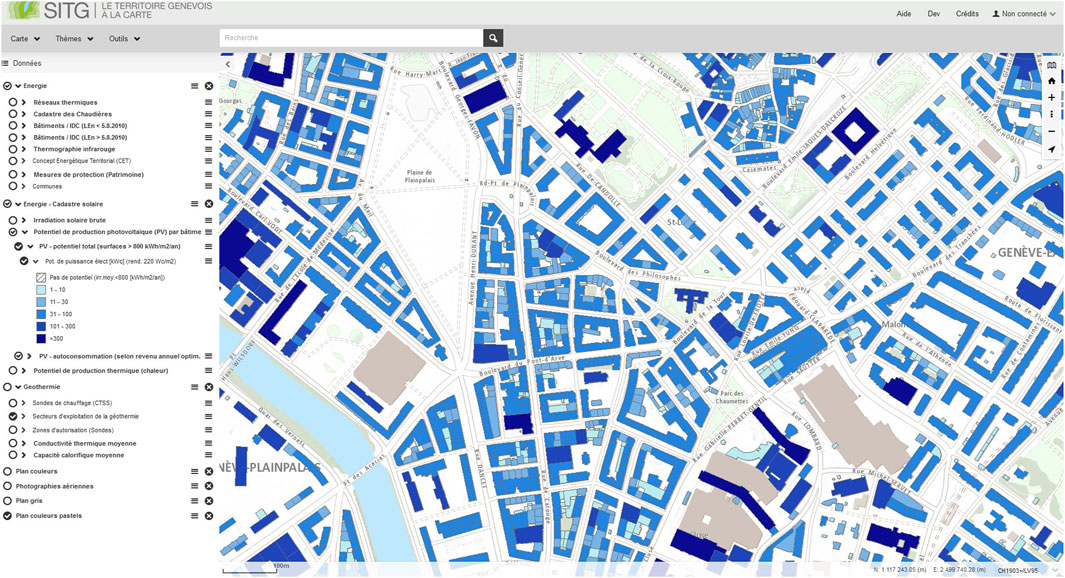
FIGURE 11. SITG geoportal, energy thematic map displaying indicators from the solar cadaster. Reproduced from SITG (2023). No permission is required from the copyright holder for the use of this image in this manuscript.
However, as previously mentioned (Section 4.2.3), the SITG has the significant advantage of offering most of its data through open access. Consequently, the freely available solar energy building database enables a comprehensive assessment across multiple buildings simultaneously, either within a specific neighborhood or among dispersed buildings owned by a single property. This capability allows for prioritizing investments in solar energy within a building portfolio. Alternatively, global statistics can be generated at various scales, as depicted in Figure 12, encompassing communal and Greater Geneva-wide levels.
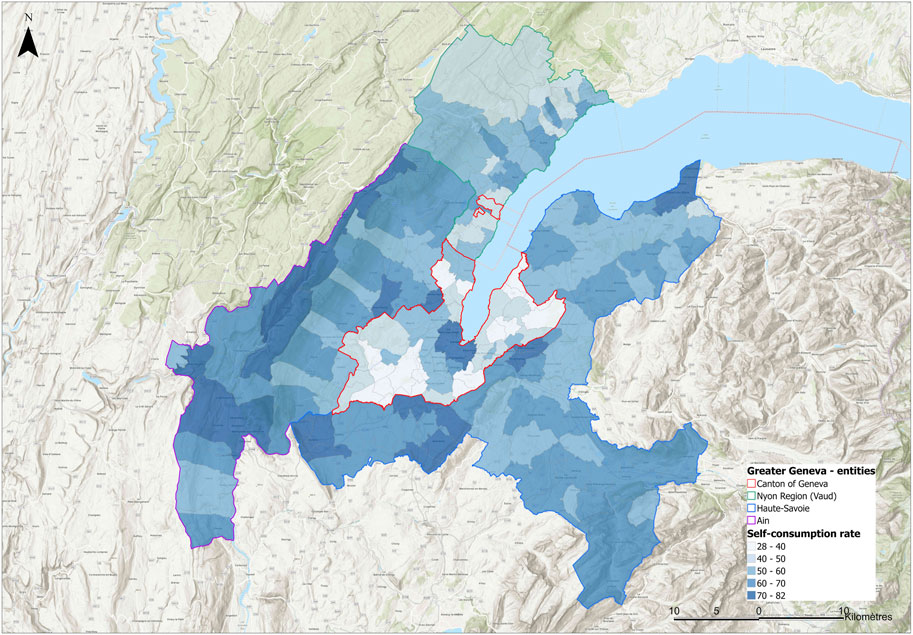
FIGURE 12. Global statistics by the commune in the Greater Geneva, indicating the potential self-consumption ratio by photovoltaic panels.
Overall, the total solar energy potential achievable through the installation of photovoltaic panels on rooftops is as follows: 1,600 MWp (with a 55% average self-consumption rate) for Geneva, 421 MWp (with a rate 56%) for the Nyon Region, 1,211 MWp (with a rate 64%) for France. It is insightful to contextualize the potential for Geneva in regard of the current solar installation status (110 MWp in November 2023 according to the Swiss Federal Office of Energy), and the Energy Master Plan of the Canton of Geneva (OCEN, 2020), which aims to achieve a total installation capacity of 300 MWp by 2030. Consequently, the total potential of 1,600 MWp indicates a substantial scope for improvement.
Through the INTERREG G2 Solar project, the article presented first how the solar cadaster was developed in several stages: a calculation of gross solar irradiation over the entire territory of Greater Geneva, then a first version of a web application (based on a pre-existing model developed for the Canton of Geneva) aimed at disseminating information to the general public. Meetings, workshops and surveys with local actors and users enabled to gauge their expectations of such an application and beyond in terms of solar energy policy. Case studies of pilot districts illustrated the wide variety of solar projects in different contexts and the need for analysis support using the solar cadaster. Finally a more interactive and dynamic version was developed focusing on the analysis of self-consumption potential with a view to gaining greater autonomy in the context of the energy crisis of the last 2 years.
All the steps listed above show that the solar cadaster tool and its web application are not an end in themselves but they are the result of an iterative and complex process associating many stakeholders in the Greater Geneva. Therefore, next, we first present a critical evaluation of the setup process that was conducted to develop the tools, as well as the structuring of governance in solar energy. Additionally, we assess the tools themselves, exploring their usefulness and limitations for users.
In relation to the process, the survey conducted through the questionnaire enabled the evaluation of the first version of the Solar Cadaster web application (APPGG1). Achieving statistical representativeness, especially for close-ended questions, was not feasible for two reasons: user totals were not monitored at that time, and the number of responses was, in any case, too low (approximately 30). However, achieving representativeness was not the primary goal of the survey. It provided insights into the ease of use of the tool, which was found to be satisfactory. Most importantly, responses to open-ended questions highlighted meaningful expectations for the improvement and further development of the tool.
The organization of workshops with users or potential users of the solar cadaster was particularly successful in French communities located in peripheral and rural areas, where there is a high demand to learn more about solar energy. The first version of the APP was particularly significant for local authorities and stakeholders, supporting them in identifying suitable roofs for community solar project developments. While the Swiss part of the region was already familiar with solar energy and solar cadaster tools, the topic was relatively novel for the French communities. The high involvement and commitment of the project partners in this part of Greater Geneva were also major reasons for the successful dissemination activities.
Case studies were another important pillar of the process. Initially, the expectation was to proactively engage in the design of solar solutions, considering different contexts such as heritage protection, renovation, new urban development, and microgrids in industrial areas, with the support of the solar cadaster tools. This was partially the case for the new urban development case of PAV Grosselin, where we simulated the solar energy potential on roofs and facades for different alternatives of the project. In the French communities, partners again co-created solar projects based on the solar cadaster tool. However, in other case studies, the design or potential analysis of solar projects had already been carried out before our intervention. Our involvement consisted of collecting experience feedback and lessons learned from those cases. The entire process, based on the survey, workshops, and lessons learned from case studies, was successful in determining the requirements and specifications that the new version of APPGG2 would need to meet in order to support the design of further solar projects in the region.
Finally, the main assumption of the paper was that the solar cadaster tool constituted a unifying means of creating cohesion among various players in the region’s energy sector, encouraging dialogue, and converging towards common governance around solar energy. A governance structure was thus established for the development of the solar cadaster, its dissemination, and the promotion of solar projects in Greater Geneva. Here are the main reasons for success, as well as the difficulties and limitations experienced. Firstly, the governance brought together representatives from the three entities of Greater Geneva, including academic, institutional, and energy utility stakeholders, providing complementary competencies for accomplishing tasks. The governance also served as a platform for dialogue, facilitating frequent exchanges between partners through technical and steering committees. However, the article highlighted the difficulties inherent in a cross-border territory like Greater Geneva with different institutional systems, energy suppliers, legal and financial mechanisms, and databases for implementing a common solar cadaster tool. Representativeness was likely weaker in the Canton of Vaud (only represented by the Region of Nyon and the administration of the Canton), compared to the Geneva and French entities. In particular, the project could not engage local energy utilities or major municipalities, resulting in limited dissemination activities of the solar cadaster tool in this entity. Despite these challenges, the governance was successful in terms of project outputs, leading to the collaborative development of APPGG2 that met requirements globally, as detailed in the next section, and raised awareness of solar energy in the region. It is, however, too early to evaluate the extent to which the solar cadaster tool has contributed to boosting solar energy projects.
The solar cadaster, extended to Greater Geneva, is now accessible to a wide range of users. Primarily, through the SITG geoportal, users can display and download processed data (including raw raster data and aggregated data by roof and building) as open data. These datasets can be utilized by professionals and experts with GIS tools or Excel sheets. The paper specifically focused on the development process of the web application (from APPGG1 to APPGG2), aiming to reach a broader audience, including individual homeowners, portfolio owners of buildings, municipalities, policymakers, and more.
APPGG2 specifically embraced the challenge of operating within three distinct institutional and economic contexts (Geneva, Vaud, France), characterized by variations in feed-in and buy-back tariffs, subsidies, and data sources related to building and electricity consumption. This achievement was facilitated by establishing a common and standardized calculation base while accommodating the unique aspects of each context. It is important to note that the reliability of the outputs, represented by key performance indicators, may differ from the reliability of the underlying data sources. Specifically, Geneva offers the most reliable self-consumption calculation, leveraging data grounded in known electricity consumption, building usage types, and corresponding electricity load profiles. To enhance the quality of outputs in Vaud and France, future efforts should focus on improving the availability of data sources. In the meantime, users in the Greater Geneva region have the opportunity to input their building data into the form, ensuring the generation of reliable results.
The questionnaire and workshops helped identify 16 types of requirements that APPGG2 needed to address (refer to Section 4.2.1). The first eight requirements have been nearly fully satisfied. However, the sixth requirement, focusing on assessing the grid capacity to absorb solar power, has only been addressed in France thus far. While Geneva’s grid capacity has been adequate to date, it is anticipated that reinforcement will be necessary in the near future due to the rapid growth of solar power. In Vaud, the current status of the grid is not well-documented. Regarding the eighth requirement involving the overlay of solar maps with other spatial layers, only the connection with heritage constraints is established within the APP. However, utilizing the SITG geoportal allows for more sophisticated cross-referencing, enabling easy integration with detailed heritage maps, urban and energy plans, among others. This supports a more comprehensive approach to strategy development and decision-making. Additional observations related to the remaining requirements to be met are as follows:
• Inform whether the building is already equipped with solar panels (9): The official Swiss geoportal6 recently added a layer featuring power plants, including solar panels based on subsidies data. Therefore, integrating this information into the APP is straightforward.
• Enable extraction and export of data for multiple buildings at once (owner’s building stock), or facilitate grouped evaluations (10): This is a key focus for future development and can be easily achieved by aggregating data for sets of buildings. For the moment, as already mentioned, open data can be extracted and processed with separate GIS and Excel tools.
• Archive queries for easy retrieval (11): Incorporating this feature into web development is not complex but would necessitate the creation of a user account.
• Set up an exchange forum–community of best practices, examples, chat, co-development (networking players), pointing out any errors (12): While this would enhance the APP’s dynamism and attractiveness, managing and leading such a social network would necessitate allocating resources.
• Provide information on technical roofing constraints, such as the quality of roofing and framing (13): This is crucial for specifying if solar installation necessitates preliminary work on the roof structure. However, this information is generally unavailable for the entire building database, making it challenging to meet this requirement.
• Propose a design of the installation’s layout which enables to better specify the potential (14), provide for new buildings the option of modeling a building to be constructed (or importing a project) and simulating its solar potential (15), and simulate solar potential according to panel and inverter type (16): These requirements involve advanced simulation functions in the APP, which are feasible but run the risk of creating a tool too complex for a broad audience, contrary to its initial aim.
The initial feedback from professionals has sparked a debate regarding the complexity of the APP, its suitability for a broad audience, and the potential inclusion of additional functions outlined above. There is a consensus that the tool should not become more complex than its current state. The intention is not to replace existing simulation tools, such as PV Syst. To further refine the APP’s features and assess its complexity level, a new survey and workshops should be proposed, involving users to gather diverse experiences with the updated version. This survey would complement the monitoring system implemented since September 2023, which tracks metrics such as daily visitor count (both total and new), number of actions taken, and time spent on the tool. Initial findings for the first month indicate an average of 20 new daily visitors with an average total usage time of 23 min. Proactive advertising related to solar energy and energy transition initiatives is expected to enhance visibility and subsequently increase visitation.
The project G2 Solar presented in the paper enabled to set up a platform of expertise in solar energy and its governance. The major challenge for the post-project period is to consolidate and perpetuate this governance and the solar cadaster tool that supports it. The tool requires updating and maintenance on several aspects: 1) ordinary maintenance updating electricity tariffs, for example, making minor changes according to identified needs, 2) additional developments in line with recommendations made (to be confirmed and completed through a new survey addressed to the users), such as including solar thermal (which was a functional module in APPGG1), consolidating economic assumptions, processing a building stock, among others, adding information on the existing solar panels, 3) updating the entire solar cadaster on the occasion of the publication of digital surface models which are updated every 5 years or so through airborne LIDAR surveys; this is becoming a matter of urgency, as all buildings constructed after 2017 in Geneva, 2019 in Vaud and 2014 in France are not currently considered.
In order to formalize a framework for this maintenance and these additional developments to be carried out, a draft agreement between ten academic, institutional and energy supplier partners was prepared and discussed during 2023. But it proved difficult and complex to get all these players to agree, particularly on the financial division of tasks. As a result, we can see that while all the conditions are in place to structure joint governance of solar energy in Greater Geneva around the updating of the solar cadaster, the practical details make it difficult to implement. As a result, we are moving towards a logic specific to each territorial entity, where distinct updates and developments will be carried out for each entity separately. This approach will facilitate organizational aspects, even though a common discussion platform is not currently being pursued. However, any additional development carried out on behalf of one institution will also be of benefit to the others, ensuring uniformity in the evolution of the solar cadaster within Greater Geneva.
The raw data supporting the conclusion of this article will be made available by the authors, without undue reservation.
GD: Conceptualization, Data curation, Formal Analysis, Funding acquisition, Investigation, Methodology, Project administration, Resources, Supervision, Validation, Writing–original draft, Writing–review and editing. MT: Conceptualization, Formal Analysis, Investigation, Methodology, Resources, Writing–review and editing.
The author(s) declare financial support was received for the research, authorship, and/or publication of this article. The work presented in the paper was conducted within the framework of the G2 Solar project, funded by the INTERREG VA France-Suisse 2014–2020 program (Ref: 4610/2018-95) with a total allocation of 417,500 €. Furthermore, all project partners contributed a self-funding amount totaling 361,400 €, and institutional partners, including the Canton of Geneva, Canton of Vaud, PMFG, and SIG, provided a financial contribution amounting to a total of 88,000 €. An additional funding was brought by the HES-SO (130'000 CHF) and SIG (63,000 CHF) in the framework of the project VALES 107686. Finally, G2 Solar constituted the main Swiss contribution to the IEA SCH Task 63 program with the financial support (10,500 CHF) of the SFOE support: SI/502420-01.
The authors would like to thank all the partners of the INTERREG/G2 Solar team for their valuable contribution: USMB (C. Ménézo), HEPIA (P. Gallinelli, V. Guillot, N. Stendardo), arx iT (M. Bach, Y. Grasset, D. Beni), INES (M. Coët), University of Lyon (S. Giroux, B. Govehovitch), Canton of Geneva (A. Susini, H. Fauvain, A. Vieira de Mello, P. Montier), Canton of Vaud (M. Meghari), Nyon Region (A. Stamm), SIG (T. Kunckler, C. Anthoine-Bourgeois), PMFG (H. Villard), INNOVALES (D. Gaucherand), ENEDIS (V. Raffy), CAUE-74 (S. Desgeorges), and all the case study holders (City of Gland, FTI, SIG, Hospice Général, PAV Geneva, SPL Terrinov, CitoyEnergie, the involved French municipalities). The project was further enriched through academic exchanges with NTNU-Trondheim (NO) within the framework of the HELIOS project. Additionally, valuable contributions were made through collaboration with researchers associated with the IEA SHC || Task 63 || Solar Neighborhood Planning.
The authors declare that the research was conducted in the absence of any commercial or financial relationships that could be construed as a potential conflict of interest.
All claims expressed in this article are solely those of the authors and do not necessarily represent those of their affiliated organizations, or those of the publisher, the editors and the reviewers. Any product that may be evaluated in this article, or claim that may be made by its manufacturer, is not guaranteed or endorsed by the publisher.
2https://developers.google.com/maps/documentation/solar?hl=fr
4https://forms.gle/3pom7zbpkfY9fKsV6
5https://www.citoyenergie.org/
Boccalatte, A., Thebault, M., Ménézo, C., Ramousse, J., and et Marco, F. (2022). « Evaluating the impact of urban morphology on rooftop solar radiation: a new city-scale approach based on Geneva GIS data ». Energy Build. 260, 111919. doi:10.1016/j.enbuild.2022.111919
Chatzigeorgiou, E., and Martinopoulos, et G. (2023). “« Solar cadastre for assessment of near-zero energy districts »,” in IOP Conference Series: Earth and Environmental Science, 1196:012003 (Bristol, England: IOP Publishing).
Cuesta-Fernandez, I., Vargas-Salgado, C., Alfonso-Solar, D., and Gómez-Navarro, et T. (2023). « the contribution of metropolitan areas to decarbonize the residential stock in Mediterranean cities: a GIS-based assessment of rooftop PV potential in Valencia, Spain ». Sustain. Cities Soc. 97, 104727. doi:10.1016/j.scs.2023.104727
Desthieux, G., Carneiro, C., Susini, A., Abdennadher, N., Boulmier, A., Dubois, A., et al. (2018a). “« solar cadaster of Geneva: A decision support system for sustainable energy management »,” in From science to society, progress in IS. Editors B. O. édité par, H. Patrik, N. Stefan, and W. et Volker (Cham: Springer International Publishing), 129–137.
Desthieux, G., Carneiro, C., Camponovo, R., Pierre, I., Morello, E., Anthony, B., et al. (2018b). « Solar energy potential assessment on rooftops and facades in large built environments based on lidar data, image processing, and cloud computing. Methodological background, application, and validation in geneva (solar cadaster) ». Front. Built Environ. 14. doi:10.3389/fbuil.2018.00014
Florio, P., Maria Cristina, M. P., Schüler, A., Roecker, C., and et Jean-Louis, S. (2018). « Assessing visibility in multi-scale urban planning: a contribution to a method enhancing social acceptability of solar energy in cities ». Sol. Energy 173, 97–109. doi:10.1016/j.solener.2018.07.059
Garg, B., and et Rohit, B. (2021). « collaborative governance for urban sustainability: implementing solar cities ». Asia Pac. J. Public Adm. 43 (4), 236–257. doi:10.1080/23276665.2021.1925132
Gassar, A. A. A., and Cha, et S. H. (2021). « Review of geographic information systems-based rooftop solar photovoltaic potential estimation approaches at urban scales ». Appl. Energy 291, 116817. doi:10.1016/j.apenergy.2021.116817
Google Projet Sunroof (2023). « project Sunroof ». 2023. Available at: https://sunroof.withgoogle.com/.
Govehovitch, B., Thebault, M., Bouty, K., Giroux-Julien, S., Peyrol, É., Guillot, V., et al. (2021). « Numerical validation of the radiative model for the solar cadaster developed for greater geneva ». Appl. Sci. 11 (17), 8086. doi:10.3390/app11178086
Hay, J. E. (1979). « Calculation of monthly mean solar radiation for horizontal and inclined surfaces ». Sol. energy 23 (4), 301–307. doi:10.1016/0038-092x(79)90123-3
Kanters, J., Wall, M., and Kjellsson, et E. (2014). “« the solar map as a knowledge base for solar energy use »,” in Energy Procedia, Proceedings of the 2nd International Conference on Solar Heating and Cooling for Buildings and Industry (SHC 2013), 48 (janvier): 1597-1606, Freiburg, Germany, September 23-25, 2013. doi:10.1016/j.egypro.2014.02.180
Krapf, S., Bogenrieder, L., Netzler, F., Georg, B., and et Markus, L. (2022). « Rid—roof information dataset for computer vision-based photovoltaic potential assessment ». Remote Sens. 14 (10), 2299. doi:10.3390/rs14102299
Lindberg, F., Jonsson, P., Honjo, T., and et Dag, W. (2015). « Solar energy on building envelopes–3D modelling in a 2D environment ». Sol. Energy 115, 369–378. doi:10.1016/j.solener.2015.03.001
Lobaccaro, G., Croce, S., Lindkvist, C., Munari Probst, M. C., Scognamiglio, A., Dahlberg, J., et al. (2019). « A cross-country perspective on solar energy in urban planning: lessons learned from international case studies ». Renew. Sustain. Energy Rev. 108, 209–237. juillet. doi:10.1016/j.rser.2019.03.041
Lucchi, E., Adami, J., Peluchetti, A., and Mahecha Zambrano, et J. C. (2023). Photovoltaic potential estimation of natural and architectural sensitive land areas to balance heritage protection and energy production. Energy Build. 290, 113107. doi:10.1016/j.enbuild.2023.113107
Luxembourg, G. (2023). « solar cadastre Luxembourg ». Available at: https://map.geoportail.lu/theme/energie?version=3&zoom=14&X=683950&Y=6379608&lang=fr&rotation=0&layers=1813&opacities=1&time=&bgLayer=basemap_2015_global&crosshair=false.
Manni, M., Formolli, M., Boccalatte, A., Croce, S., Desthieux, G., Hachem-Vermette, C., et al. (2023). « Ten questions concerning planning and design strategies for solar neighborhoods ». Build. Environ. 246, 110946. doi:10.1016/j.buildenv.2023.110946
Mohajeri, N., Assouline, D., Guiboud, B., Bill, A., Gudmundsson, A., and Scartezzini, et J.-L. (2018). « A city-scale roof shape classification using machine learning for solar energy applications ». Renew. Energy 121, 81–93. doi:10.1016/j.renene.2017.12.096
Mohajeri, N., Gudmundsson, A., Kunckler, T., Upadhyay, G., Assouline, D., Kämpf, J. H., et al. (2019). « A solar-based sustainable urban design: the effects of city-scale street-canyon geometry on solar access in Geneva, Switzerland ». Appl. Energy 240, 173–190. doi:10.1016/j.apenergy.2019.02.014
OCEN (2020). « plan directeur de L’ÉNERGIE 2020-2030 ». Geneva, Switzerland: Office cantonal de l’énergie OCEN.
Peronato, G., Rastogi, P., Rey, E., and Andersen, et M. (2018). « A toolkit for multi-scale mapping of the solar energy-generation potential of buildings in urban environments under uncertainty ». Sol. Energy 173, 861–874. doi:10.1016/j.solener.2018.08.017
Pueblas, R., Kuckertz, P., Michael Weinand, J., Kotzur, L., and Stolten, et D. (2023). « ETHOS. PASSION: an open-source workflow for rooftop photovoltaic potential assessments from satellite imagery ». Sol. Energy 265, 112094. doi:10.1016/j.solener.2023.112094
Sommerfeldt, N., and et Hatef, M. (2017). « revisiting the techno-economic analysis process for building-mounted, grid-connected solar photovoltaic systems: Part Two - application ». Renew. Sustain. Energy Rev. 74, 1394–1404. juillet. doi:10.1016/j.rser.2017.03.010
Stendardo, N., Desthieux, G., Abdennadher, N., and Gallinelli, et P. (2020). « GPU-enabled shadow casting for solar potential estimation in large urban areas. Application to the solar cadaster of greater Geneva ». Appl. Sci. 10 (15), 5361. doi:10.3390/app10155361
SunSPOT (2023). « solar and battery calculator | solar savings | SunSPOT, Australia ». Australia: Sunspot Website. Available at: https://www.sunspot.org.au.
Tetraeder.solar (2023). « solarpotenzialkataster in deutschalnd ». Available at: https://www.solare-stadt.de/home/Solarpotenzialkataster.
Thai, C., and et Jack, B. (2021). « Challenges estimating distributed solar potential with utilization factors: California universities case study ». Appl. Energy 282, 116209. doi:10.1016/j.apenergy.2020.116209
Thebault, M., Desthieux, G., Castello, R., and Berrah, L. (2022). « Large-scale evaluation of the suitability of buildings for photovoltaic integration: case study in Greater Geneva ». Appl. Energy 316, 119127. doi:10.1016/j.apenergy.2022.119127
Thebault, M., Govehovitch, B., Bouty, K., Caliot, C., Compagnon, R., Desthieux, G., et al. (2021). “« A comparative study of simulation tools to model the solar irradiation on building façades »,” in ISES solar world congress 2021 (Freiburg, Germany) (International Solar Energy Society). Available at: https://hal.science/hal-04234820/document.
Walch, A., Castello, R., Mohajeri, N., and Scartezzini, J. L. (2020). « Big data mining for the estimation of hourly rooftop photovoltaic potential and its uncertainty ». Appl. Energy 262, 114404. doi:10.1016/j.apenergy.2019.114404
Zhu, R., Kwan, M.-Po, Perera, A. T. D., Fan, H., Yang, B., Chen, B., et al. (2023). « GIScience can facilitate the development of solar cities for energy transition ». Adv. Appl. Energy 10, 100129. doi:10.1016/j.adapen.2023.100129
Zingraff-Hamed, A., Frank, H., Lupp, G., Begg, C., Huang, J., Amy, O., et al. (2020). « Stakeholder mapping to co-create nature-based solutions: who is on board? ». Sustainability 12 (20), 8625. doi:10.3390/su12208625
Zonatlas Amsterdam (2023). « solar cadastre Amsterdam ». 2023. Available at: https://www.zonatlas.nl/amsterdam/ontdek-de-zonatlas/.
Keywords: digital tools for solar modeling, solar cadaster, self-consumption in buildings, Open Data, cross-border collaboration in the greater geneva, shared online application tool, stakeholder engagement
Citation: Desthieux G and Thebault M (2024) Solar governance for the transborder agglomeration of the Greater Geneva based on the solar cadaster development. Front. Built Environ. 10:1347056. doi: 10.3389/fbuil.2024.1347056
Received: 30 November 2023; Accepted: 15 January 2024;
Published: 01 February 2024.
Edited by:
Gianpiero Colangelo, University of Salento, ItalyReviewed by:
Elena Lucchi, Polytechnic University of Milan, ItalyCopyright © 2024 Desthieux and Thebault. This is an open-access article distributed under the terms of the Creative Commons Attribution License (CC BY). The use, distribution or reproduction in other forums is permitted, provided the original author(s) and the copyright owner(s) are credited and that the original publication in this journal is cited, in accordance with accepted academic practice. No use, distribution or reproduction is permitted which does not comply with these terms.
*Correspondence: Gilles Desthieux, Z2lsbGVzLmRlc3RoaWV1eEBoZXNnZS5jaA==
Disclaimer: All claims expressed in this article are solely those of the authors and do not necessarily represent those of their affiliated organizations, or those of the publisher, the editors and the reviewers. Any product that may be evaluated in this article or claim that may be made by its manufacturer is not guaranteed or endorsed by the publisher.
Research integrity at Frontiers
Learn more about the work of our research integrity team to safeguard the quality of each article we publish.