 Wahyu Triyoso
 Widjo Kongko2
- 1Faculty of Mining and Petroleum Engineering, Institut Teknologi Bandung, Bandung, Indonesia
- 2Research Center for Hydrodynamic Technology, Badan Riset dan Inovasi Nasional, Surabaya, Indonesia
- 3Ikatan Ahli Tsunami Indonesia (IATSI), Jakarta, Indonesia
- 4Meteorology, Climatology, and Geophysical Agency, Jakarta, Indonesia
This study uses integrated geological, geodesy, and seismology data to assess the potential tsunami and Probabilistic Seismic Hazard Function (PSHF) near Sumatra’s coastal cities. It focuses on estimating the possible level of ground shaking due to the seismic activity within the Sumatran Fault Zone (SFZ) and subduction zone. It uses the Peak Ground Acceleration (PGA) as a measure. An amplification factor that is based on the previous study is used. It is calculated through the Horizontal-Vertical Spectral Ratio (HVSR), which measures possible surface ground shaking. The Seismic Hazard Function (SHF) is calculated considering magnitudes 6.5 to 9.0 for subduction sources and 6.5 to 7.8 for SFZ sources. Also, the PGA based on the Maximum Possible Earthquake (MPE) magnitude is estimated, and tsunami heights are simulated to assess the possible hazard risk. The tsunami source model in this study is characterized by considering the possibility of the long-term perspectives on giant earthquakes and tsunamis that might occur in subduction zones around the off-coast of southern Sumatra Island. The potentiality source zone is characterized based on the utilization of the cross-correlation of correlation dimension (DC) based on the shallow earthquake catalog of 2010 to 2022 and the SHmax-rate of surface strain rate. Based on the MPE, the relatively high estimated PGA at the base rock was found around Mentawai and Pagai Utara islands at about 0.224 g and 0.328 g, with the largest estimated PGA based on the MPE at the surface with values of about 0.5 g and 0.6 g. The possible maximum tsunami height (Hmax) estimated based on source scenarios position around the west coast of Sumatera Island, such as for Kota Padang and Kota Bungus, reaches up to 12.0 m and 22.0 m, respectively. The findings provide valuable insight into seismic and tsunami hazards, benefiting future mitigation strategies.
1 Introduction
The island of Sumatra moves independently due to the interactions between several tectonic plates, with each segment behaving differently. This movement becomes particularly noticeable with the convergence of the Indo-Australian Plate. This plate subducts towards the Eurasian plate, demonstrating the dynamic nature of the region’s geology (Fitch, 1972; Jarrad, 1986). Further research by Sieh and Natawidjaja (2000) and Bradley et al. (2017) found that the subduction plate movement along the Sunda Trench in Sumatra Island’s southwest part displays a pattern of low-obliquity subduction. A right-lateral shear fault parallel to the trough, known as the Sumatran Fault Zone (SFZ), was discovered near the southwest coast. Sieh and Natawidjaja (2000) uncovered that the curved shape of the plate boundary causes variation in the orientation and magnitude of the relative plate movement velocity vectors along the edges. The observed speeds are 52 mm/yr in the northern segment, 57 mm/yr in the middle, and 60 mm/yr in the southern part. Combining oblique subduction and Sumatran shear faults allows one to discern Sumatra’s complex stress, strain, and deformation patterns. This amalgamation causes displacement along the subduction plane and deformation along the overriding plate (Fitch, 1972). The convergent plate movement occurring at about 49 mm/year (Zachariasen et al., 2000) results in a high annual rate of earthquakes. Notably, over the past 250 years, five significant earthquakes (Mw ≥ 8.0) have occurred along the Sumatran megathrust (Megawati and Pan, 2009). Earthquakes in the subduction zones often trigger subsequent quakes. McClosky et al. (2005) highlighted that such stress interaction could impact seismicity in the forearc area (Pollitz et al., 2006; Triyoso and Sahara, 2021). For instance, the 2004 Sumatra-Andaman earthquake altered the Andaman Sea’s seismic activity (Sevilgen et al., 2012), potentially inducing the 2005 earthquakes in Nias.
Konca et al. (2008) study suggests the Mentawai area—which last experienced a megathrust rupture in 1833—still faces potential seismic events. The 2007 earthquakes, magnitudes of 8.4 and 7.9, seemingly only fractured a small portion of the region disrupted by the 1833 quake, leaving other megathrust patches locked and potentially rupturing. These findings corroborate prior assessments that the Mentawai segment remains at high risk for a significant earthquake. Moreover, the study by Konca et al. (2008) indicates the nature and scope of future ruptures in the Mentawai segment could vary, influenced by factors such as the rupture of singular asperities, the combined rupture of multiple asperities, or the impact of non-permanent resistance zones possessing low local pre-stress. Therefore, we cannot dismiss the possibility of future megathrust events in the Mentawai area. This study unveiled that a substantial amount of strain has been accumulated since the 1833 earthquake, suggesting the stress condition of the Sunda megathrust faults in 2007 may not have been adequate to generate a major fault rupture, further affirming the area’s susceptibility to future quakes (Muhammad et al., 2016).
Satake and Atwater (2007) discussed the long-term perspectives on giant earthquakes and tsunamis in subduction zones. The researchers suggested that future earthquakes on some faults may potentially exceed the size of any previously recorded in the faults’ historical or instrumental record. Evidence of this was demonstrated by the 2004 Sumatra-Andaman earthquake. Further paleoseismological evidence has been uncovered at Cascadia and Hokkaido, suggesting the possibility of historically unparalleled earthquakes. This potential for extreme seismic activity is considered part of the natural variability in earthquake sizes, similar to patterns observed from instrumental recordings of subduction earthquakes off Colombia and Ecuador (Kanamori and McNally 1982), the Aleutians (Johnson et al. 1994; Tanioka and Gonzalez 1998), and the Nankai Trough (Ando 1975). However, it would simplify matters if a subduction zone consistently produced earthquakes of a single size. However, records show that variability is more common. This unsteadiness likely stems from variations in fault segments. For instance, smaller earthquakes result from the rupture of a single segment, while larger earthquakes indicate breaks across multiple segments. These segments often correspond to sedimentary basins (Sugiyama 1994; Wells et al. 2003).
Burton and Hall’s (2014) research centered on the segmentation of the Sumatran fault using the k-means algorithm. They proposed that the optimal segmentation of the Sumatran Fault Zone (SFZ) consists of around sixteen clusters. Furthermore, they posited that the sixteen-cluster model could be broken down into fault segment lengths that range from 22 to 196 km. These lengths correlated with the maximum earthquake potentials, measured in Mw 6.5–7.8 magnitudes. Eight significant segments primarily dominate the SFZ. These central segments are evenly dispersed along Lake Maninjau. Historical data showed that these central fault segments have been the primary contributors to the hazard. Conversely, the far north region poses less of a threat because it comprises shorter segments.
Triyoso et al. (2022) estimated a reasonable correlation between two seismotectonic parameters of correlation dimension (DC) and the b-values along the Sumatran Fault Zone (SFZ). The most critical finding shows that the result of the SHF curve of total probability of exceedance versus the mean of the peak ground acceleration of each observation point indicates that the relatively high Dc coincides with the high SHF curve. This most likely implies that the high correlation dimension is closely related to the possible existence of high seismic hazards. The areas with relatively high DC levels show potential high SHF in West to South Sumatra, specifically, the Padang, Bengkulu, and Lampung zones.
Seismic hazard analysis serves as a compass, guiding toward decreased earthquake damage. It also stands as a gatekeeper, a prerequisite for risk reduction efforts. This is methodically executed through the probabilistic seismic hazard analysis (PSHA), the framework upon which international standards for seismic risk assessment are built. The credibility of a PSHA is directly tethered to the trustworthiness of the earthquake source model, seismic activity rate, and ground motion model. The functionality of the earthquake model is a crucial aspect of this, as emphasized by Triyoso and Shimazaki (2012), along with knowledge of possible sources, data completeness, and seismicity rates. The potential for earthquakes in a given area can be gauged by estimating the seismic moment rate—a measure derived from seismic wave amplitude, GPS or geodetic data, and the slip rate of a Late Quaternary fault (Triyoso and Shimazaki, 2012). Seismic hazards are typically derived from seismic activity relevant to the area in question—this process leans heavily on the Gutenberg–Richter magnitude-frequency relation (Gutenberg and Richter 1944). This critical point was noted by both Triyoso and Shimazaki (2012) and Triyoso et al. (2020). However, this method does come with a catch: hazard estimations become dependent on the extent of our knowledge of the area’s seismic history and often require much subjective judgment.
Triyoso et al. (2020) studied the earthquake hazards of coastal sources of the Padang and Bengkulu cities of Sumatra Island. The estimated hazards are presented as probabilistic seismic hazard maps of the PGA of 10% Probability of Exceedance (PE) in 50 years. In assessing the seismic potential in Sumatra, they jointly estimated the seismic moment rate, a measure indicating the size of an earthquake, from two factors. These included a smoothed average rate of seismicity and a pre-seismic surface strain rate model in the subduction zone nearby. The subjects of interest were particularly Bengkulu and Padang, two regions located along the Sumatran subduction zone. The results demonstrated that the Seismic Hazard Function (SHF), a measure of how often a certain degree of seismic hazard is expected to occur, is greater in Bengkulu than in Padang.
Triyoso and Suwondo (2022) conducted a geodynamic simulation study based on pre-seismic modeling. They used the slip rate input from a recent study focusing on Liwa and its surrounding areas. Their results showed a relatively high level of compression. They estimated the seismic moment rate based on current surface strain data, consistent with their pre-seismic modeling result and a previous analysis using correlation dimension (DC). Their analysis revealed a high DC in the Kumering segment, indicating a relatively high-stress level. It aligns with the assertion that large strike-slip earthquakes occur more frequently. The recent study’s finding that the slip rate has increased supports this. Historical records show that Liwa experienced at least three destructive earthquakes in 1908, 1933, and 1994. From a deterministic hazard analysis viewpoint, the area around the SFZ is expected to experience significant ground shaking due to its proximity to the source. In contrast, a Probabilistic Seismic Hazard Analysis (PSHA) conducted in the southern part of Sumatra Island, particularly in areas close to the coastal boundary, indicated that shaking from subduction and intermediate depth sources is more frequent than the SFZ source.
Triyoso et al. (2023) comprehensively investigated prospective earthquake and tsunami hazards along the Sumatran subduction margin. Their focus was explicitly on the coastal areas of West Sumatra-Bengkulu. This examination was founded on collecting pre-seismic surface displacement data and a catalog of shallow crustal earthquake data spanning 1907 to 2016. The pre-seismic surface displacement data comprised displacement information collated before and corrected displacement figures after significant earthquakes. Drawing inspiration from our earlier study on the local covariance function and the association between the Correlation Dimension (DC) and the b-value of the Gutenberg-Richter (GR) Law, we approximated the highest horizontal crustal strain rate (SHmax-rate) and DC for the specified region. Triyoso et al. (2023) intended to achieve two goals with their research. The first was to estimate the remaining considerable earthquake potential around the Sumatran subduction zone, particularly in the Mentawai region. It followed Konca et al. (2008) remark about the enormous potential of megathrust earthquake events in the Mentawai region. Secondly, Triyoso’s 2023 team aimed to calculate the probabilistic seismic hazard function (PSHF) and peak ground acceleration (PGA) derived from the maximum possible earthquake (MPE). They also suggested simulating tsunami heights to understand potential hazards better and support mitigation plans. Their study allows for the identification of possible source areas for future earthquake hazards, seismic gaps, and tsunami threats. The future potential of these source areas can be determined by the cross-correlation of relatively high DC and the estimated maximum shear strain rate. When this data is overlaid with large historical earthquake data collected from 1907 to 2010, it aligns with the 1797 subduction earthquake event, as noted by Natawidjaja et al. (2006).
Triyoso (2023a) based his study of the probabilistic seismic hazard function (PSHF) around the west coast of Sumatra Island before large earthquakes on the hypothesis that the Akaike information criterion (AIC) is a reliable tool in earthquake forecast algorithms. This research revealed that using the b-value (DC) — a seismic precursor—can be assessed regarding its reliability as a function of time and space before significant seismic events. Triyoso’s (2023a) investigation also examined the correlation between the quantity of δAIC and the class or size of Mw, indicating that the PSHF undergoes a substantial change when this quantity is large enough. Furthermore, as the earthquake potency and PSHF are functions of the b-values (DC), applying the proposed method, we could measure how reliable the b-value (DC) is as the precursor before a large earthquake from the viewpoint of PSHA. The result is suggested to be very beneficial for PSHA and seismic mitigation realization.
Triyoso (2023b) investigated the spatiotemporal probabilistic seismic hazard function (PSHF), leveraging data from the comprehensive earthquake catalog from 1963 to 2016 to enhance future earthquake spatial predictions. Seismicity is smoothed using a catalog of small to moderate earthquakes, with the model anchored to larger earthquakes. The model combines the uniform background seismicity rate from the earthquake fault’s data and pre-seismic surface strain rate data to establish a more reliable seismicity rate. The model’s efficiency in active zone characterization along the Sumatra subduction zone is assessed using the Akaike information criterion (AIC). Combining methodologies from Frankel (1995) and Triyoso and Shimazaki (2012), the model exploits an exhaustive earthquake catalog, focusing on moment magnitudes (Mw) between 4.5 and 6.5. Earthquake faults with an Mw of 6.5 or higher (Natawidjaja and Triyoso, 2007) are used for reliability assessment. By adopting the ideas of Taroni and Akinci (2021), Frankel (1995), and Triyoso and Shimazaki (2012), the model can more accurately identify potential active source zones, thereby improving spatial earthquake forecast accuracy. The key finding from Triyoso, (2023b) reveals an algorithm that substantially improves future earthquake spatial forecasts using PSHF. Incorporating comprehensive seismic data with pre-seismic surface strain rate information, this model could significantly contribute to establishing a reliable seismicity rate, paving the way for an effective PSHF model.
Following the finding of Triyoso and Suwondo (2022), in the southern part of Sumatra Island, particularly in areas close to the coastal boundary, it was indicated that shaking from subduction and intermediate depth sources is more frequent than the SFZ source. The studies by Triyoso et al. (2023) and Triyoso, (2023b) provided an algorithm that improves the future of shallow earthquake spatial forecasts using the Probabilistic Seismic Hazard Function (PSHF). This algorithm and model significantly contribute to establishing a reliable seismicity rate, thus advancing the development of an effective PSHF model. Therefore, the motivation of this study is to use the combined data of Geology, GPS, and Seismology to understand the possible shallow earthquake hazard near coastal cities on the island of Sumatra with the amplification factor estimated and incorporated into the PGA estimated. Implementing practical earthquake hazard analysis, such as probabilistic seismic hazard analysis (PSHA), requires extensive knowledge and understanding of potential earthquakes and their causes. PSHA involves incorporating a reliable seismicity model. The seismicity of the area where the building is located is a significant factor that must be considered for correctly designing and detailing reinforced concrete (R/C) buildings (Chrysanidis et al., 2022; Chrysanidis, 2023). After identifying potential earthquake hazard zones around the southern coast of Sumatra Island, this study examined the Tsunami Height simulation. We included our current discoveries, which align with Konca et al. (2008) observations about the significant potential for megathrust earthquake events in the Mentawai region. We also considered the possibility of giant earthquakes and tsunamis occurring in subduction zones in the long term, as discussed in Satake and Atwater, (2007). The outputs can then be integrated into planning and policy decisions, enhancing seismic and tsunami hazard mitigation strategies.
2 Data and method
2.1 Data
This study employs earthquake catalog data from PuSGeN 2017 (Tim Pusat Studi Gempa Nasional, 2017), ISC-GEM (2017–2022), and GCMT of 2017–2022 (Dziewonski et al., 1981; Ekström et al., 2012). The data selected are those relating to shallow crustal earthquakes, with a maximum hypocenter depth of 50 km and a minimum magnitude (Mw) of 4.5. Figure 1A illustrates the chosen area and the distribution of such earthquakes from 1963 to 2022. This study also considers pre-seismic surface displacement data from Triyoso et al. (2022), Triyoso et al. (2023) and Triyoso (2023a), Triyoso (2023b). The GPS model generated based on the surface displacement data of Triyoso et al. (2023), as shown in Figure 2A, overlaid with the distribution of shallow earthquake moment magnitudes (Mw) of 6.5 or greater (earthquake faults), less than 50 km depth, and dates between 1963 and 2022. Meanwhile, Figure 1B presents the distribution of shallow earthquakes in the same area and timespan, characterized by depths less than 50 km and magnitudes ranging from 4.5 to less than 6.5. The geological data employed in this analysis is derived from a study conducted by Triyoso et al. (2020), in which alterations and fault geometry were predicated upon the revised and simplified conclusions of Natawidjaja et al. (2006) and Konca et al. (2008). These findings were established using a rectangular fault model. Co-seismic and pre-seismic models, particularly those of the southern geometry of the subduction zone, display disparate characteristics. In the co-seismic model, the fault dip and rake measurements are approximately 20° and 98°, respectively, while the pre-seismic model profiles a rake of about 278° (Shamim et al., 2019). Figure 2B illustrates the bathymetry data that was used for the tsunami simulation. This data was sourced from a mixture of the General Bathymetric Charts of the Oceans (GEBCO version 11.1, as of September 2008) and a digitized Nautical Chart obtained from the Centre for Hydrographic Office, a subsidiary of the Indonesian Navy. The data was arranged in a 1’arc grid (with each grid measuring approximately 1,854 m across). It was later resampled for a finer analysis at a spatial resolution of 30''(equating to an approximate dimension of 927 m).
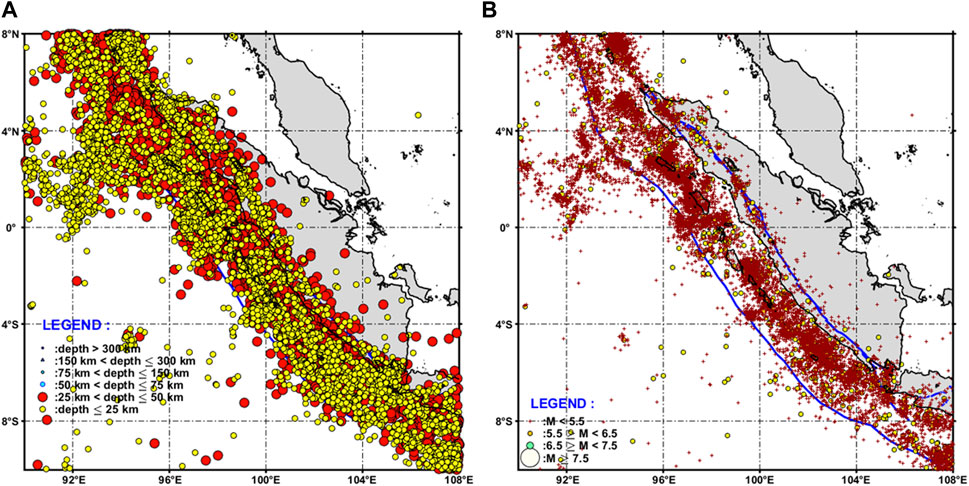
FIGURE 1. (A) The distribution of shallow earthquake catalog data from PuSGeN 2017 (Tim Pusat Studi Gempa Nasional, 2017), ISC-GEM (2017–2022), and GCMT of 2017–2022 (Dziewonski et al., 1981; Ekström et al., 2012). The data selected are those relating to shallow crustal earthquakes, with a maximum hypocenter depth of 50 km and a minimum magnitude (Mw) of 4.5. (A) illustrates the chosen area and the distribution of such earthquakes from 1963 to 2022. Meanwhile, (B) presents the distribution of shallow earthquakes in the same study area and timespan, characterized by depths less than 50 km and magnitudes ranging from 4.5 to less than 6.5.
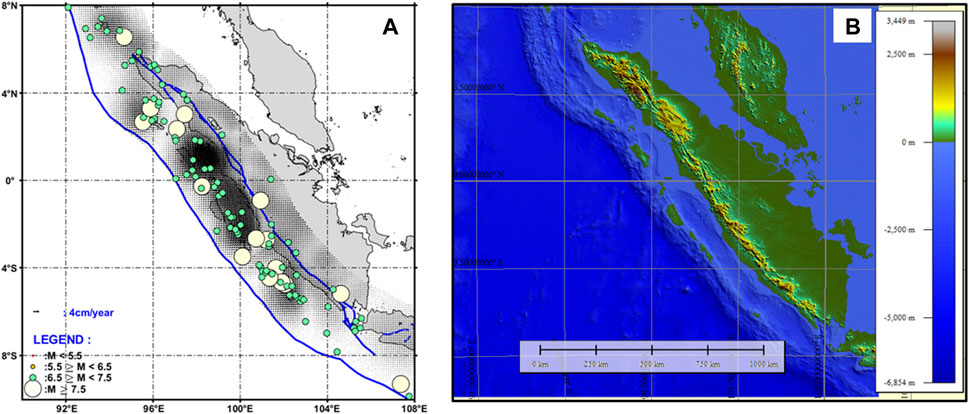
FIGURE 2. (A) The distribution of the GPS model generated based on the data of Triyoso et al. (2023) in this study is overlaid with the distribution of shallow earthquake moment magnitudes (Mw) of 6.5 or greater (earthquake faults), less than 50 km depth, and dates between 1963 and 2022. (B) shows the bathymetry data used for the tsunami simulation. The data was obtained from a mixture of the General Bathymetric Charts of the Oceans (GEBCO version 11.1, as of September 2008) and a digitized nautical chart obtained from the Centre for Hydrographic Office, a subsidiary of the Indonesian Navy. The data was arranged in a 1’arc grid (with each grid measuring approximately 1,854 m across). It was later resampled for finer analysis at a spatial resolution of 30''(corresponding to an approximate dimension of 927 m).
2.2 The b-value and correlation dimension (DC)
2.2.1 The b-value
The b-value from the Gutenberg-Richter Equation, established by Gutenberg and Richter, 1944, is a significant parameter. It exemplifies the correlation between the scaling characteristics of seismic activities and their possible magnitude. Frohlich and Davis (1993) found that, on a regional scale, the b-value typically averages around 1. To understand better and forecast the behavior of future earthquakes, accurate calculation of the b-value is critical (Ben-Naim, 2008; De Santis et al., 2011; Nuannin et al., 2012; Triyoso et al., 2021; Triyoso et al., 2022; Wang et al., 2021). Aki’s (1965) maximum likelihood method is one of the most effective for calculating this value. Further elaborations by Utsu (1978) on this method further highlighted that the b-value could be written as follows:
where
2.2.2 Correlation dimension (DC)
A correlation dimension is a fundamental tool for determining the geometric characteristics of self-similar (repetitive pattern) objects, as outlined by Grassberger and Procaccia, 1983. The two primary estimates are utilized: the correlation dimension (DC) and the correlation sum (C(r)). The correlation dimension estimates the number of degrees of freedom of the system’s dynamics. In contrast, the correlation sum is a quantity related to the probability of finding pairs of points in the phase space that are less than a certain distance apart. Both estimates work together for a quantitative understanding of a system’s complexity. The DC and the correlation sum C(r) are estimated as follows:
C(r) is the correlation function, and r is the distance between two epicenters. The earthquake epicenter distribution has a fractal structure, and the following relationship would be obtained (Pailoplee and Choowong, 2014; Triyoso et al., 2022; Triyoso et al., 2023):
N is the number of pairs of events separated by distance R < r.
DC is the correlation dimension, and r is the distance between two earthquakes in degrees. The spatial and temporal distribution patterns of earthquake seismicity were fractal using a two-point correlation dimension (DC). Following Triyoso et al. (2023), DC is evaluated based on the mean value of the following relationship:
and
DC is the Correlation Dimension, and b is the b-values of the Gutenberg-Richter Equation (Gutenberg and Richter, 1944).
Lower b-values and a high DC indicate lower heterogeneity in the fractured medium. They can also suggest higher stress or strain, increased deformation rates, and more considerable faults, pointing to a heightened degree of maximum shear strain or seismic moment. As such, areas with these characteristics (Caneva and Smirnov, 2004; Wyss et al., 2004; Roy et al., 2011; Goebell et al., 2017; Triyoso et al., 2023).
2.3 Geodetic modeling: SHmax and seismic moment (Mo-rate) rate estimation
This study procured geodetic modeling data by assuming a homogeneous, isotropic horizontal displacement field for each observation point over the entire seismogenic depth. The study denotes the horizontal displacement in east-west and north-south directions by the variables u and v. Citing the works of El-fiky et al. (1999), an assumption is made to pinpoint signals in u and v that exhibit no correlation. The study area was gridded into sections measuring 10 km by 10 km, and the surface strain rate was subsequently computed. The horizontal crustal strain rate in each grid or cell is calculated based on the procedures from previous studies (Triyoso et al., 2020; Triyoso et al., 2021; Triyoso et al., 2022; Triyoso and Sahara, 2021; Triyoso and Suwondo, 2022; Triyoso, 2023b; Triyoso et al., 2023) in which the Least Square Collocation method were applied. The local covariance functions using the horizontal surface displacement data were utilized in estimating each grid or cell’s horizontal surface displacement within the study area. The study used the horizontal crustal strain to gauge the maximum shear strain across the region. By using the following formula, the LSC-based surface strain rate model is subsequently applied to compute the maximum shear strain (SHmax) and the scalar moment rate.
SHmax is the maximum shear strain, and ɛij is the strain component.
Where µ is the rigidity, H is the seismogenic depth, A is the unit area, and e1 and e2 are the principal strain rates. The GPS data mainly used in this study is based on Triyoso et al. (2023) and Triyoso (2023b).
3 Probabilistic seismic hazard function estimation
3.1 Potential earthquake fault area characterization and rate estimation
Following Triyoso (2023b), the earthquake fault characterization and rate estimation potential is achieved by considering the complete earthquake catalog to improve predictions of future earthquake spatial occurrences (Taroni and Akinci, 2021). The model merges methodologies from previous studies by Frankel (1995) and Triyoso and Shimazaki (2012), using the complete earthquake catalog with a moment magnitude (Mw) range of 4.5—less than 6.5 to build the model.
To begin with, we utilized the complete shallow earthquake catalog from 1963 to 2022 (with 4.5 ≤ Mw < 6.5). We then applied seismicity smoothing with correlation distances of 50 and 75 km. We combined these using an equal weight of 0.5 for each and normalized the results. It produced the spatial source earthquake fault model. Next, we applied Equation 8 to build a normalized seismic moment rate model. To determine the reliable long-term earthquake fault rate model, we relied on the methodology provided by Triyoso (2023b). We then combined three parts by multiplying the spatial source earthquake fault model, normalized seismic moment rate model, and the uniform background seismicity rate of the declustered earthquake with Mw ≥ 6.5.
Thus, in this study, the earthquake fault rate model was defined as follows,
Where AEF-background is uniform background earthquake fault seismicity with magnitude ≥ Mref in grid i, the Mo-rate is the seismic moment rate estimated using equation (8) at the grid of i, and max(Mo-rate) is the maximum Mo-rate over the entire study area. The vi represents the likelihood estimation seismicity rate (annual of the 10a) with a magnitude greater than or equal to a given earthquake magnitude reference (Mref). The Mref in this study is Mw = 6.5.
Furthermore, by substituting 10a of Eq. 9 in the Frequency-Magnitude of the Guttenberg-Richter equation (Guttenberg-Richter, 1944), we may write the following equation:
AEF-rate is the estimated seismicity rate above or equal to a magnitude greater than or equal to the magnitude reference (Mref). The b is the b-value.
3.2 Probabilistic seismic hazard function (PSHF) estimation
3.2.1 Probability exceedance (PE)
The Seismic Hazard Function (SHF) is constructed by cross-plotting between the Probability of Exceedance (PE) vs. Peak Ground Acceleration (PGA) of a given magnitude reference (Mref) and a distance between the source and a site of observation. The PE formulation of the annual earthquake rate with a magnitude greater than or equal to Mref, which is the estimated maximum ground acceleration denoted by a, is calculated using GMPE at an observation point due to the earthquake source on the grid k can be written as:
in which Pk (m3 m (ao, Rk)) is the annual PE of earthquakes in the kth grid or cell, m(ao, Rk) is the magnitude in the ith source grid that would produce a PGA estimated of ao or larger at the site, and Rk is the distance between the site and the source grid. The vk in equation (11) is estimated based on equation (10). The PSHF parameter calculation is based on Triyoso and Suwondo (2022), where the starting locking depth at the top is 5 km (The 2017 PusGen, 2017). Following Triyoso and Suwondo (2022), the focal depth value is estimated from half the seismogenic thickness of about 10 km; thus, the focal depth used is 15 km. The function m(ao, Rk) is the GMPE relation. The following equation determined the total PE distribution of PGA at the site,
Thus, by substituting the GMPE in (11) into equation (12), we could calculate the annual PE of the particular PGA as follows:
For a given specified time of observation of T, the PE could be calculated as follows:
The annual PE of each grid or cell of specified ground motion is calculated using Eq. 13. For a time duration of T, the PE of specified ground motions is computed using Eq. 14.
3.2.2 PGA estimation based on the maximum possible earthquake (MPE) magnitude
Following Triyoso et al. (2023), the characterized source area resulting in this study is used to estimate the PGA based on the MPE magnitude using the recommended GMPE—based on Atkinson-Boore’s (2006), Youngs et al.’s (1997), and Zhao et al.’s (2006) studies—by The 2017 PuSGeN (Tim Pusat Studi Gempa Nasional, 2017) for the case of the megathrust source. The MPE magnitude is based on the megathrust source model based on the cross-correlation of DC and the SHmax rate. The study utilizes fault geometry and parameters such as dip, width, and rake based on Triyoso et al, (2023), except for fault length. The fault length has been adjusted based on the results of the present study. In the context of co-seismic events, the dip and rake are approximately 20o and 98o, respectively. In contrast, a 278o rake is used in instances of pre-seismic activities.
3.2.3 The ground motion prediction equation (GMPE) and Horizontal-Vertical Spectral Ratio (HVSR)
To develop SHF as a function of the peak value of the horizontal ground motion component, which can be expressed as a function of the peak ground acceleration (PGA) versus probability exceedance (PE). The GMPE is required to function earthquake magnitude and distance. For the case of the megathrust or subduction zone source, the GMPE is similar, as explained in Section 3.2.2. While the SFZ sources, the GMPE is based on Natawidjaja and Triyoso (2007), Triyoso et al. (2021) and Triyoso and Suwondo (2022). In addition, the GMPE of Fukushima and Tanaka (1992) is used for subduction and strike-slip sources. The Horizontal-Vertical Spectral Ratio (HVSR) method estimates ground motion’s resonant frequency and amplification, factors influenced by the surface layer. This calculation divides the horizontal component’s spectrum from the vertical component’s spectrum. The fundamental principle behind the HVSR method suggests a value of one for the H/V ratio in bedrock.
When Mucciarelli and Gallipoli (2004) reviewed HVSR methods using Rayleigh waves and noise, they found consistent results. Another pivotal research was conducted in the Los Angeles Basin using Rayleigh and body waves. This research, completed by Bowden and Tsai, 2017, demonstrated the superiority of Rayleigh waves in retrieving amplification information in sedimentary basin areas compared to utilizing only body waves. The study uses signal data to calculate amplification, specifically focusing on a frequency band of 0.3–0.7 Hz. This selected frequency range is drawn from the work of Bowden and Tsai (2017). The amplification into Peak Ground Acceleration (PGA) is achieved by multiplying the Seismic Hazard Function (SHF) with the amplification factor. This operation mimics the conversion process from the PGA estimated at the base rock to the PGA at the surface. A separate study by Suwondo (2020) extensively evaluated the Horizontal Vertical Spectral Ratio (HVSR) of the Meteorological, Climatological, and Geophysical Agency (BMKG) data across Sumatra Island, drawing on ground acceleration and microtremor data. The consistency of the H/V ratios in both datasets was very similar when analyzed according to the Bowden and Tsai (2017) method, leading to the decision to use the amplification factor derived from the HVSR method that has been done based on previous research and studies (Suwondo, 2020; Triyoso et al., 2021). The site amplification estimation results for the BMKG stations used in this study are based on the results from Suwondo (2020) and Triyoso et al. (2021), as shown in Figure 3. The amplification was incorporated into the estimated PGA by multiplying the estimated PGA at the base rock by the amplification factor. It means that the PGA estimated at the base rock was converted to the PGA at the surface.
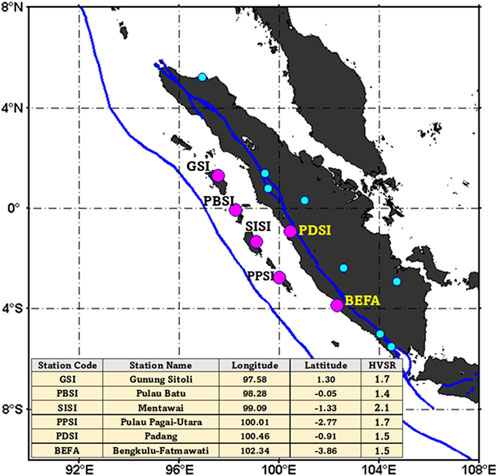
FIGURE 3. The distribution station of BMKG data and the distribution stations (magenta) are used in this study. The estimation of site amplification for the BMKG stations is conducted by referencing the findings of Suwondo (2020) and Triyoso et al. (2021).
4 Tsunami modeling
This study used the Non-Linear Shallow Water Equation (NLSWE) of the TUNAMI-N3 model, which was initially developed by Tohoku University in Japan (Imamura et al., 2006), to simulate and predict the behavior of tsunamis accurately (Pakoksung et al., 2021). The TUNAMI-N3 is modified of the TUNAMI-N2 that is based on linear theory in deep sea, shallow-water theory in shallow sea, and runup on land with varying grids. The TUNAMI does not use the fault data as it is, but it needs the model of the initial wave produced by the fault model. Thus, the TUNAMI uses this initial wave data to start with the modeling. The initial wave is estimated based on the vertical deformation of the fault slip model using Mashinha and Smylie (1971). The potentiality of the tsunami source zone is characterized using a method based on the cross-correlation of DC and the SHmax-rate. Since this study aims to indicate the potentiality of the tsunami source, we assume a simple source model with a uniform slip by referring to the geological data employed from a study conducted by Triyoso et al. (2020), Natawidjaja et al. (2006), Konca et al. (2008) and Triyoso et al. (2023). Referring to the finding of the potentiality of the tsunami source zone in this study, we define the geometry fault parameters based on the subduction zone geometry of Hayes et al. (2012). The dip, width, and rake are based on research by Triyoso et al. (2023), with a fault length of about 536.5 km. Based on the empirical scaling law, the Mw estimated of the Oceanic/Subduction Zone Earthquake source model is about 8.9–9.0 (Blaser et al., 2010). As Hank and Kanamori (1979) suggested, the seismic moment summation of the proposed fault model was utilized to estimate the Mw. To understand better the possible potentiality of the tsunami height, in this study, we proposed using three scenarios of locking area that are expressed as three different source depths in which the epicenters are placed in the middle of the source zone area. The possible potentiality source parameters are summarized in Table 1. In this study, the controlling Megathrust Earthquake and Tsunami Dynamics: Stress, Rigidity, and Sediment Strength were based on Ulrich et al. (2022). The gauge sites evaluated are Sibolga, Kota Pariaman, Kota Padang, Kota Bungus, Kota Bengkulu, and Tua Pejat, as is shown in Figure 8.
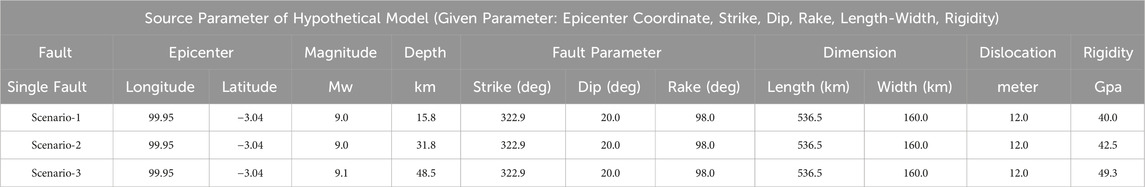
TABLE 1. Three scenarios the source parameter of hypothetical model.
5 Results and discussion
This paper strives to utilize the combined data from Geology, GPS, and Seismology to assess the potential for shallow earthquake hazards near coastal cities on Sumatra Island, incorporating an estimation of the amplification factor into the estimated Peak Ground Acceleration. This study delved into the Tsunami Heights simulation after pinpointing the potential earthquake hazard zones along Sumatra’s southern coast. Our recent findings align with observations made by Konca et al. (2008) concerning the significant likelihood of megathrust earthquake events in the Mentawai region and have not been disregarded. Additionally, the possibility—outlined by Satake and Atwater (2007)—of enormous earthquakes and tsunamis in the long term was considered in subduction zones.
In developing the model, the present approach was aligned with Triyoso’s (2023b) earthquake fault characterization and rate estimation potential methods. This method relies on the complete earthquake catalog to better forecast future spatial occurrences. The model of this study harmonizes methodologies from earlier studies by Frankel (1995) and Triyoso and Shimazaki (2012). It draws on the comprehensive earthquake catalog encompassing a moment magnitude range of 4.5 to less than 6.5. The research started by utilizing the complete shallow earthquake catalog spanning 1963 to 2022 with a moment magnitude (Mw) within the range of 4.5 ≤ Mw < 6.5. Following this, seismicity smoothing was pursued with correlation distances of 50 and 75 km. An equal weight of 0.5 for each correlation distance was provided and normalized the subsequent results. The result is shown in Figure 4A. Consequently, this generated the spatial source earthquake fault model. Next, the equation was utilized to create a normalized seismic moment rate model, as shown in Figure 4B. Through the methodology outlined by Triyoso (2023b), a dependable, long-term earthquake fault rate model could be constructed. Conclusively, three elements were combined, multiplying the spatial source earthquake fault model, the normalized seismic moment rate model, and the uniform background seismicity rate of the declustered earthquake with Mw ≥ 6.5. Referring to Triyoso (2023b), then the earthquake fault data (Mw ≥ 6.5) was used as the reference to find the adjustment rate factor and the maximum log-likelihood value to produce the most reliable long-term earthquake fault rate of the combined three models. The result is shown in Figure 4C.
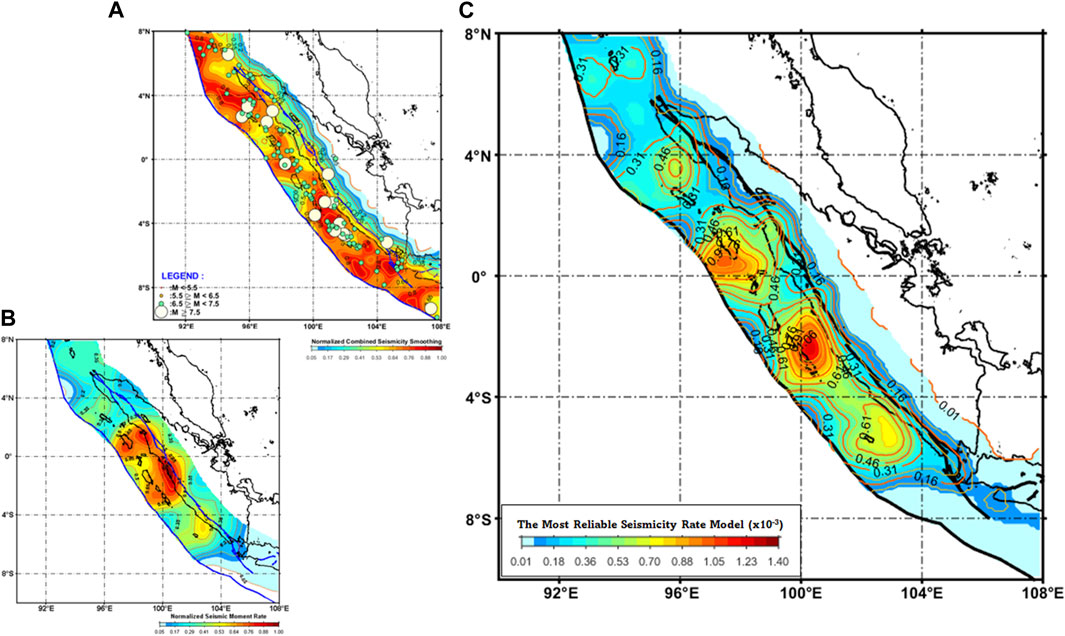
FIGURE 4. (A) The result of combined seismicity smoothing the complete shallow earthquake catalog with correlation distances of 50 and 75 km. An equal weight of 0.5 was used for each correlation distance, and the subsequent results were normalized. The shallow earthquake catalog spanning 1963 to 2022 with moment magnitude (Mw) within the range of 4.5 ≤ Mw < 6.5. It is addressed to better characterize the spatial source earthquake fault model. (B) shows the normalized seismic moment rate model. (C) shows the three models’ most reliable long-term earthquake fault rate. It is constructed by following the algorithm of Triyoso et al., 2023 by using the earthquake fault data (Mw ≥ 6.5) as the reference to find the adjustment rate factor and the maximum log-likelihood value to produce the most reliable long-term earthquake fault rate of the combined three models.
Figure 5 represents the outcomes of the Probabilistic Seismic Hazard Function (PSHF) for the coastal and near-coastal cities on the islands of Sumatra. Figure 5A illustrates the PSHF at the base rock and the surface for locations P1, P2, P3, and P4. In calculating PSHF, we only considered the subduction source. As per Triyoso et al. (2021) and Triyoso and Suwondo (2022), the impact of the SFZ is trivial compared to subduction sources and, hence, can be disregarded. Figure 5B shows the PSHF estimation for locations P5 and P6 at the base rock and the surface. This estimation incorporates the amplification factor using the HVSR result from Figure 3 and considers both the subduction source and the SFZ for its formulation. The PSHF estimation consists of both the subduction source and the SFZ. The PSHF estimated is expressed as the median PGA. Thus, based on each source, the median value in the PSHF calculation was used in each observation site. The PSHF is in the form of a cross plot between PE and PGA values. The PE and PGA of the selected influence sources around the study area’s subduction zone are estimated based on the magnitude range of 6.5–9.0 for megathrust sources and a magnitude of 6.5–7.8 for the SFZ sources. Since there was a focus on the shallow source characterization, the intermediate to deep sources were not included. The parameters that influence the predicted ground motions change the variable’s value in the magnitude and distance of earthquakes. The radius distance used in this study is about 100 km. Therefore, the source position is placed in the middle of the seismogenic thickness in the case of shallow crustal sources. The focal depth value is estimated from half the seismogenic depth at 10 km and the starting locking depth at 5 km. Thus, the focal depth used is 15 km. The recommended GMPE—based on Atkinson-Boore’s (2006), Youngs et al.’s (1997), and Zhao et al.’s (2006) studies—by Tim Pusat Studi Gempa Nasional, 2017 for the case of the megathrust source is used in this study. According to Triyoso and Suwondo (2022), the GMPE Zhao et al. (2006) tends to ft better with BMKG data, especially for Sumatra, so in this study, we put more weight on the estimated PGA based on this GMPE. The GMPE of Fukushima and Tanaka (1992) is used for strike-slip sources. The b-value used to estimate PSHF was based on the earthquake with magnitude Mw ≥ 6.5 (earthquake fault), for which the b-value estimated is ∼ 1. Based on Figure 5A, it is observed that the Probabilistic Seismic Hazard Functions demonstrate that site P3 (in Mentawai) has the most substantial hazard function, both at the surface and at the base rock. In contrast, Figure 5B reveals that the effect of the Seismic Fault Zone is predominant for the PSHF at both sites P5 (Padang) and P6 (Bengkulu Fatmawati). Among the two, P5’s PSHF, owing to the SFZ source, potentially presents a more extensive hazard compared to P6.
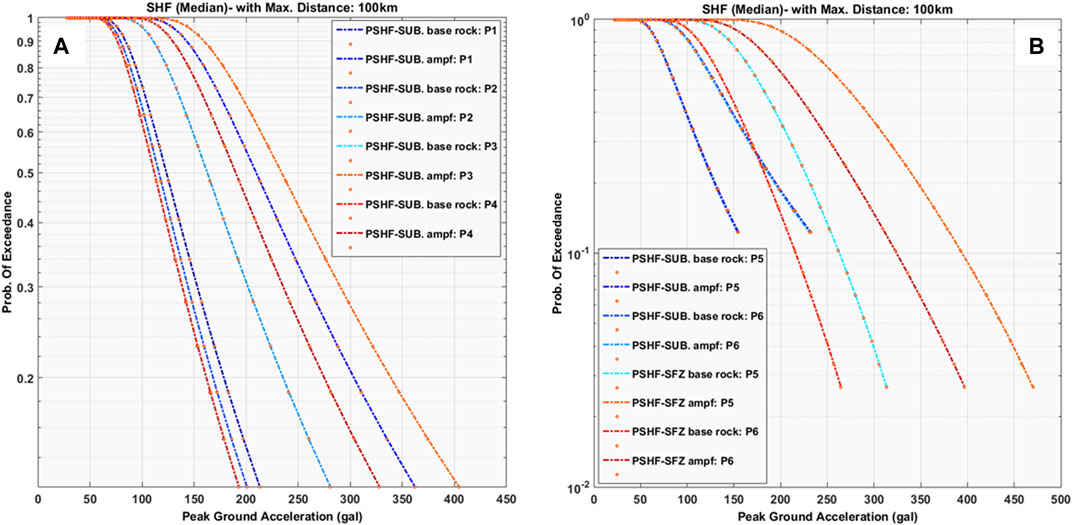
FIGURE 5. Shows the outcomes of the Probabilistic Seismic Hazard Function (PSHF) for the coastal and near-coastal cities on the islands of Sumatra. (A) illustrates the PSHF at the base rock and the surface for locations P1, P2, P3, and P4. In calculating PSHF, we only considered the subduction source. As per Triyoso et al. (2021) and Triyoso and Suwondo (2022), the impact of the SFZ is trivial compared to subduction sources and, hence, can be disregarded. (B) shows the PSHF estimation for locations P5 and P6 at the base rock and the surface. This estimation incorporates the amplification factor using the HVSR result from Figure 3 and considers both the subduction source and the SFZ for its formulation.
Aligned with the work by Triyoso et al. (2023), this study utilizes the cross-correlation of DC and SHmax-rate, giving insights into potential seismic and corresponding tsunami source zones. The earthquake catalog used to estimate DC is based on shallow earthquake data with depths less than or equal to 50 km from late 2010 to 2022. The fault’s configuration classification, including the estimated dip (∼20o) and the rake (∼98o), relied on their research. The fault length, however, is an exception, updated to approximately 536.5 km based on the findings of this research. The Maximum Probable Earthquake is conjectured from the empirical scaling law (Mw ∼ 9.0 per Blaser et al., 2010), which becomes the basis for determining Peak Ground Acceleration (PGA). Consequently, this study extensively uses Triyoso et al. (2023) findings for fault’s geometrical attributes and parameters with the sole amendment to the length. Figures 6A, B visually represent future earthquake or tsunami potential and the estimated PGA based on the deterministic method at the base rock around the coastal city and the near coastal city, respectively, considering the MPE of Mw ∼ 9.0. The PGA estimates based on the MPE for various sites P1, P2, P3, P4, P5, and P6 at the base rock, respectively, as follows: 0.021, 0.078, 0.224, 0.328, 0.039 g, and 0.059g. An analysis of these values reveals that sites P3 and P4 exhibit the greatest estimated PGA based on MPE at the surface, with values of about 0.5 and 0.6 g.
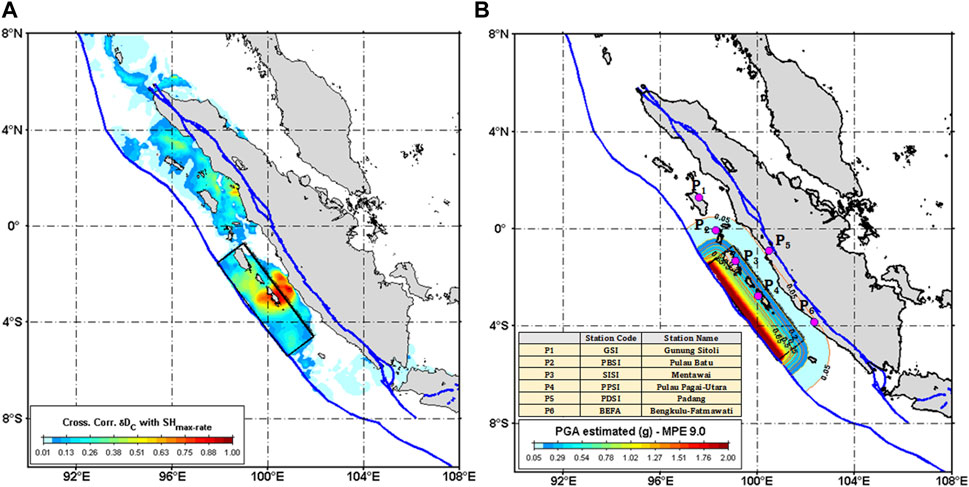
FIGURE 6. (A) shows the utilization of the cross-correlation of DC based on the shallow earthquake catalog of 2010 to 2022, estimated based on averaging of equations (5 and 6), and the SHmax-rate calculated based on equation (7), giving insights into potential seismic and corresponding tsunami source zones. The fault’s configuration classification refers to Triyoso et al. (2023). The fault length, however, is an exception, updated to approximately 536.5 km based on the findings of this research. The MPE of the Moment Magnitude is about 9.0 (Mw ∼ 9.0 per Blaser et al., 2010). (B) shows The PGA estimates based on the MPE. The PGA for sites P1, P2, P3, P4, P5, and P6 at the base rock are as follows: 0.021 g, 0.078 g, 0.224 g, 0.328 g, 0.039 g, and 0.059 g. An analysis of these values reveals that sites P3 and P4 exhibit the greatest estimated PGA based on MPE at the surface, with values of about 0.5 g and 0.6 g.
The outcomes of the tsunami model could be described as follows. From the earthquake data analysis, three scenarios of the fault model are used to evaluate the impact of tsunamis along the offshore islands of Mentawai and Sumatera Island. These are the fault models with the epicenter close to the trench, between the offshore island and Sumatera Island, and near the coast of Sumatera Island, as shown in Figure 7 and as described in Table 1. The tsunami modeling results from these three scenarios showed the importance of the fault model location segmentation related to the offshore island’s effect on the tsunami propagation and the resulting impact, as shown in Figure 8 and described in Table 2. The first scenario, where the location of the fault model close to the trench provided a high impact to the west coast of the offshore islands with Hmax ∼ 8.69 m and less to the west coast of Sumatera Island, where the maximum tsunami height is less than 5 m. In this case, the offshore islands acted as an offshore breakwater that protected the west coast of Sumatera Island, located behind the offshore island. The displacement of the epicenter and hence the location of the fault model close to Sumatera Island or between the offshore island and Sumatera Island for Scenario-2 and Scenario-3 provide a huge impact on the west coast of Sumatera Island, such as for Kota Padang and Kota Bungus. The maximum tsunami height (Hmax) reaches up to 12 and 22 m, respectively, compared to scenario 1, where the Hmax is less than 5 m. The shifting of the epicenter with Scenario-2 and Scenario-3 provides a multiplication of Hmax with factor ∼ 3 to 5 times compared to the Hmax at Scenario-1 for all Hmax recorded at the west coast of Sumatera Island that are perpendicular to the source areas, as is shown in Table 2. The tsunami arrival time shows that the tsunami will arrive < 15 min after the quake for locations perpendicular to the source region. These results provide significant information on tsunami impact and hazard mitigation measures and early warning to people who lived along the west coast of the offshore island and the west coast of Sumatera Island. Based on this assessment, knowing the epicenter location of the earthquake immediately after the quake could provide information and warning to people about the potential impending tsunami that may have occurred and the best way to deal with the tsunami attack. Model results in this study have profound implications for tsunami warnings and hazard mitigation. For offshore islands, the warning system relies primarily on natural signals from earthquake-induced ground shaking. Land-use planning, building codes, and ongoing education are crucial in these systems. However, aside from these measures, there’s an additional opportunity to issue timely tsunami warnings for the west coast of Sumatra Island. For instance, a tsunami warning can be circulated less than 5 minutes post-earthquake using a combination of real-time coastal cGPS and sea-level measurements. This method supplements Indonesia’s operational tsunami warning system based on earthquake data and a pre-calculated database. The tsunami early warning system can utilize GPS to acquire tsunami source parameters in near real-time (Chen et al., 2015; Melgar et al., 2016). Concurrently, real-time monitoring of sea levels along the coast can provide a near-real-time report of anomalies in sea-level changes.
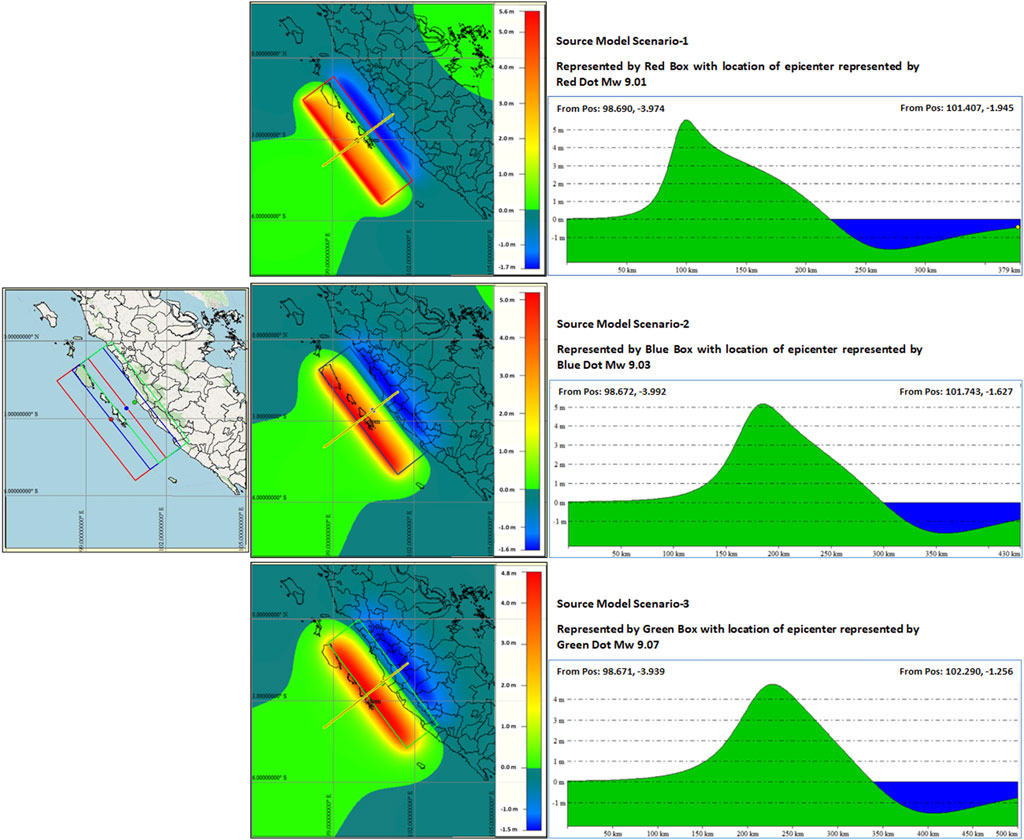
FIGURE 7. The illustration of the 3-fault model scenario location with their initial tsunami conditions was calculated using Mashinha and Smylie (1971).
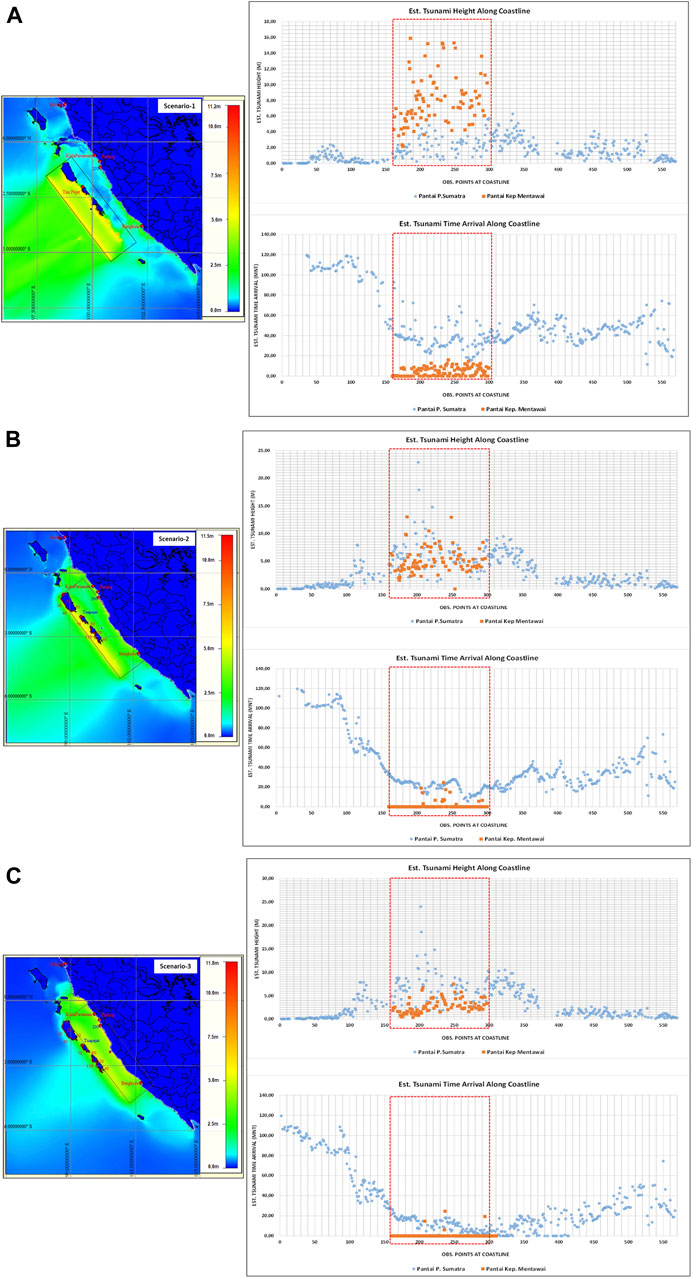
FIGURE 8. The maximum tsunami height (Hmax) distribution plot from the three scenarios. They are Scenario-1 (A), Scenario-2 (B), and Scenario-3 (C) of Figure 7 correspond with the maximum tsunami height plot along the coast of the offshore island (Mentawai) and the West coast of Sumatera Island, showing a different peak of tsunami height distribution with shifting the epicenter hence the fault segment towards the Sumatera Island. In comparison, the arrival time of a tsunami is less than 15 min after the quake for the areas perpendicular to the source region.
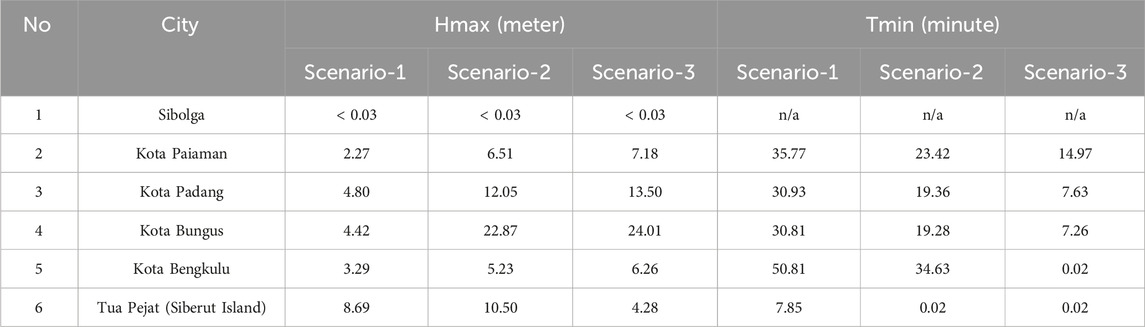
TABLE 2. The difference between maximum tsunami height Hmax and tsunami arrival time from three scenarios.
6 Conclusion
In summary, this study has used integrated data sources from geology, GPS, and seismology to assess the potential for shallow earthquake hazards near coastal cities on the island of Sumatra. Combining these techniques has produced a comprehensive shallow large earthquake potential model and robust spatial predictions of future seismic events. The method also provided important insights into potentially hazardous tsunamis, particularly in the Mentawai region. These results have profound implications for disaster preparedness and response in these regions. They underscore the importance of advanced warning systems, detailed land-use planning, adherence to building codes, and ongoing public education to mitigate the effects of such events. Ultimately, the model and methodology outlined in this study provide a valuable tool for predicting and better-managing earthquake and tsunami risks, thus helping to protect communities in areas of high seismic activity better. For further research, it would be advisable to extend the seismic hazard models to include intermediate and deep sources and study the socio-economic impacts of potential seismic events on the regions studied.
Data availability statement
The raw data supporting the conclusion of this article will be made available by the authors, without undue reservation.
Author contributions
WT: Conceptualization, Data curation, Methodology, Supervision, Writing–original draft, Writing–review and editing. WK: Validation, Writing–review and editing. GP: Investigation, Validation, Writing–review and editing. AS: Data curation, Resources, Writing–review and editing.
Funding
The author(s) declare financial support was received for the research, authorship, and/or publication of this article. This research was partly supported by the Riset P3MI ITB 2022 grant funded by the Research and Community Services program (LPPM), Institute of Technology, Bandung (ITB), Indonesia.
Acknowledgments
The author thanks the Global Geophysics Group, the Faculty of Mining and Petroleum Engineering, and the Bandung Institute of Technology for their support in producing this paper.
Conflict of interest
The authors declare that the research was conducted in the absence of any commercial or financial relationships that could be construed as a potential conflict of interest.
Publisher’s note
All claims expressed in this article are solely those of the authors and do not necessarily represent those of their affiliated organizations, or those of the publisher, the editors and the reviewers. Any product that may be evaluated in this article, or claim that may be made by its manufacturer, is not guaranteed or endorsed by the publisher.
References
Aki, K. (1965). Maximum likelihood estimate of b in the formula log N = a bM and its confidence limits-. Bull. Earthq. Res. Inst. Tokyo Univ. 43, 237–239.
Ando, M. (1975). Source mechanisms and tectonic significance of historical earthquakes along the Nankai Trough, Japan. Tectonophys 27, 119–140. doi:10.1016/0040-1951(75)90102-X
Atkinson, G. M., and Boore, D. M. (2006). Earthquake ground-motion prediction equations for Eastern North America. Bull. Seismol. Soc. Am. 96 (6), 2181–2205. doi:10.1785/0120050245
Ben-Naim, A. (2008). A farewell of entropy: statistical thermodynamics based on information. New Jersey: World Scientific.
Blaser, L., Kruger, F., Ohrnberger, M., and Scherbaum, F. (2010). Scaling relations of earthquake source parameter estimates with special focus on subduction environment. BSSA 100 (6), 2914–2926. doi:10.1785/0120100111
Bowden, D. C., and Tsai, V. C. (2017). Earthquake ground motion amplification for surface waves. Geophys Res. Lett. 44, 121–127. doi:10.1002/2016GL071885
Bradley, K. E., Feng, L., Hill, E. M., Natawidjaja, D. H., and Sieh, K. (2017). Implications of the diffuse deformation of the Indian Ocean lithosphere for slip partitioning of oblique plate convergence in Sumatra. J. Geophys Res. Solid Earth 122, 572–591. doi:10.1002/2016JB013549
Burton, P. W., and Hall, T. R. (2014). Segmentation of the Sumatran fault. Geophys. Res. Lett. 41, 4149–4158. doi:10.1002/2014GL060242
Caneva, A., and Smirnov, V. (2004). Using the fractal dimension of earthquake distributions and slope of the recurrence curve to forecast earthquakes in Colombia. Earth Sci. Res. J. 8, 3–9.
Chen, G. Y., Chin-Chu Liu, C. C., and Yao, C. C. (2015). Forecast system for offshore water surface elevation with inundation map integrated for tsunami early warning. IEEE J. Ocean. Eng. 40 (1). doi:10.1109/JOE.2013.2295948
Chrysanidis, T. (2023). Experimental and numerical research on cracking characteristics of medium-reinforced prisms under variable uniaxial degree of elongation. Eng. Fail. Anal. 145 (2023), 107014. doi:10.1016/j.engfailanal.2022.107014
Chrysanidis, T., Mousama, D., Tzatzo, E., Alamanis, N., and Zachos, D. (2022). Study of the effect of a seismic zone to the construction cost of a five-story reinforced concrete building. Sustainability 14, 10076. doi:10.3390/su141610076
De Santis, A., Cianchini, G., Favali, P., Beranzoli, L., and Boschi, E. (2011). The gutenberg–richter law and entropy of earthquakes two case studies in Central Italy. Bull. Seismol. Soc. Am. 101 (3), 1386–1395. doi:10.1785/0120090390
Dziewonski, A. M., Chou, T.-A., and Woodhouse, J. H. (1981). Determination of earthquake source parameters from waveform data for studies of global and regional seismicity. J. Geophys. Res. Earth Surf. 86, 2825–2852. doi:10.1029/JB086iB04p0282
Ekström, G., Nettles, M., and Dziewonski, A. (2012). The global CMT project 2004–2010: centroid-moment tensors for 13,017 earthquakes. Phys. Earth Planet. Inter. 200–201, 1–9. doi:10.1016/j.pepi.2012.04.002
El-fiky, G. S. A., Kato, T., and Oware, E. N. (1999). Crustal deformation and interplate coupling in the Shikoku district, Japan, as seen from continuous GPS observation. Tectonophysics 314, 387–399. doi:10.1016/S0040-1951(99)00226-7
Fitch, T. J. (1972). Plate convergence, transcurrent faults, and internal deformation adjacent to southeast Asia and the western Pacific. J. Geophys. Res. 77, 4432–4460. doi:10.1029/JB077i023p04432
Frankel, A. (1995). Mapping seismic hazard in the central and eastern United States. Seismol. Res. Lett. 66 (4), 8–21. doi:10.1785/gssrl.66.4.8
Frohlich, C., and Davis, S. (1993). Teleseismic b-values: or, much ado about 1.0-. J. Geophys. Res. 98 (B1), 631–644.
Fukushima, Y., and Tanaka, H. (1992). The revision of A new attenuation relation for peak horizontal acceleration of strong earthquake ground motion in Japan, Abstracts The Seismological Society of Japan. Fall Meeting B18. (in Japanese).
Goebell, T. H. W., Kwiatek, G., Becker, T. W., Brodsky, E. E., and Dresen, G. (2017). What allows seismic events to grow big?: insights from b-value and fault roughness analysis in laboratory stick-slip experiments. Geology 45, 815–818. doi:10.1130/G39147.1
Grassberger, P., and Procaccia, I. (1983). Measuring the strangeness of strange attractors. Phys. D. Nonlinear Phenom. 9 (1–2), 189–208.
Gutenberg, B., and Richter, C. F. (1944). Frequency of earthquake in California. Bull. Seismol. Soc. Am. 34, 185–188. doi:10.1785/BSSA0340040185
Hanks, T. C., and Kanamori, H. (1979). A moment magnitude scale. J. Geophys. Res. 84 (5), 2348–2350. 9B0059. doi:10.1029/JB084iB05p02348
Imamura, F., Yalciner, A. C., and Ozyurt, G. (2006). TSUNAMI MODELLING MANUAL (TUNAMI model), disaster control research center. Sendai, Japan: Tohoku University. Revision due on APRIL 2006.
Jarrard, R. D. (1986). Terrane motion by strike-slip faulting of forearc slivers. Geology 14, 780–783. doi:10.1130/0091-7613(1986)14%3C780:TMBSFO%3E2.0.CO;2
Johnson, J., Tanioka, Y., Ruff, L., Satake, K., Kanamori, H., and Sykes, L. R. (1994). The 1957 great aleutian earthquake. Pure Appl. Geophys. 142, 3–28. doi:10.1007/BF00875966
Kanamori, H., and McNally, K. (1982). Variable rupture mode of the subduction zone along the Ecuador-Colombia coast. Bull. Seism. Soc. Am. 72, 1241–1253.
Konca, A. O., Avouac, J. P., Sladen, A., Meltzner, A. J., Sieh, K., Fang, P., et al. (2008). Partial rupture of a locked patch of the Sumatra megathrust during the 2007 earthquake sequence. Nature 456 (7222), 631–635. doi:10.1038/nature0757
Mashinha, L., and Smylie, D. E. (1971). The displacement fields of inclined faults. Bull. Seismol. Soc. Am. 61, 1433–1440. doi:10.1785/BSSA0610051433
McClosky, J., Nalbant, S., and Steacy, S. (2005). Indonesian earthquake: earthquake risk from co-seismic stress. Nature 434, 291. doi:10.1038/434291a
Megawati, K., and Pan, T. (2009). Regional seismic hazard posed by the mentawai segment of the sumatran megathrust. Bull. Seismol. Soc. Am. 99, 566–584. doi:10.1785/0120080109
Melgar, D., LeVeque, R. J., Dreger, D. S., and Allen, R. M. (2016). Kinematic rupture scenarios and synthetic displacement data: an example application to the Cascadia subduction zone. J. Geophys. Res. Solid Earth 121, 6658–6674. doi:10.1002/2016JB013314
Mucciarelli, M., and Gallipoli, M. R. (2004). “The HVSR technique from microtremor to strong motion: empirical and statistical consideration,” in 13th World Conference on Earthquake Engineering Canada, British Columbia, Canada, August, 2004.
Muhammad, A., Goda, K., and Alexander, N. A. (2016). Tsunami hazard analysis of future megathrust Sumatra earthquakes in Padang, Indonesia using stochastic tsunami simulation. https://scite.ai/reports/10.3389/fbuil.2016.00033
Natawidjaja, D. H., Sieh, K., Chlieh, M., Galetzka, J., Suwargadi, B. W., Cheng, H., et al. (2006). Source parameters of the great Sumatran megathrust earthquakes of 1797 and 1833 inferred from coral microatolls. J. Geophys. Res. Solid Earth 111 (B6). doi:10.1029/2005JN004025
Natawidjaja, D. H., and Triyoso, W. (2007). The Sumatran fault zone—from source to hazard. J. Earthq. Tsunami 1, 21–47. doi:10.1142/S1793431107000031
Nuannin, P., Kulhánek, O., and Persson, L. (2012). Variations of b-values preceding large earthquakes in the Andaman–Sumatra subduction zone. J. Asian Earth Sci. 61, 237–242. doi:10.1016/j.jseaes.2012.10.013
Pailoplee, S., and Choowong, M. (2014). Earthquake frequency-magnitude distribution and fractal dimension in mainland Southeast Asia. Earth Planets Space 66, 8. doi:10.1186/1880-5981-66-8
Pakoksung, K., Suppasri, A., and Imamura, F. (2021). Probabilistic tsunami hazard analysis of inundated buildings following a subaqueous volcanic explosion based on the 1716 tsunami scenario in taal lake, Philippines. https://scite.ai/reports/10.3390/geosciences11020092.
Pollitz, F. F., Banerjee, P., Burgmann, R., Hashimoto, M., and Choosakul, N. (2006). Stress changes along the Sunda Trench following the 26 december 2004 sumatra-andaman and 28 march 2005 Nias earthquakes. Geophy. Res. Lett. 33, L06309. doi:10.1029/2005GL024558
Roy, S., Ghosh, U., Hazra, S., and Kayal, J. R. (2011). Fractal dimension and b-value mapping in the Andaman-Sumatra subduction zone. Nat. Hazards., 57, 27–37. doi:10.1007/s11069-010-9667-6
Satake, K., and Atwater, B. F. (2007). Long-term perspectives on giant earthquakes and tsunamis at subduction zones. Annu. Rev. Earth Planet. Sci. 35, 349–374. doi:10.1146/annurev.earth.35.031306.140302
Sevilgen, V., Stein, R. S., and Pollitz, F. F. (2012). Stress imparted by the great 2004 Sumatra earthquake shut down transforms and activated rifts up to 400 km away in the Andaman Sea. Proc. Natl. Acad. Sci. 109 (38), 15152–15156. doi:10.1073/pnas.1208799109
Shamim, Sk, Khana, P. K., and Mohanty, S. P. (2019): Stress reconstruction and lithosphere dynamics along the Sumatra subduction margin. J. Asian Earth Sci. 170 (2019), 174–187. doi:10.1016/j.jseaes.2018.11.008
Sieh, K., and Natawidjaja, D. H. (2000). Neotectonics of the Sumatran fault, Indonesia. J. Geophys. Res. 105, 28295–28326. doi:10.1029/2000JB900120
Sugiyama, Y. (1994). Neotectonics of southwest Japan due to the right-oblique subduction of the Philippine Sea plate. Geofis. Int. 33, 53–76. doi:10.22201/igeof.00167169p.1994.33.1.540
Suwondo, A. (2020). Analisa fungsi seismik hazard dan amplifkasi di Pulau Sumatra. Master Thesis. Bandung, Indonesia: Bandung Institute of Technology ITB. (in Indonesian).
Tanioka, Y., and González, F. I. (1998). The Aleutian earthquake of June 10, 1996 (Mw 7.9) ruptured parts of both the Andreanof and Delarof segments. Geophys. Res. Lett. 25, 2245–2248. doi:10.1029/98GL01578
Taroni, M., and Akinci, A. (2021) A new smoothed seismicity approach to include aftershocks and foreshocks in spatial earthquake forecasting: application to the global Mw ≥ 5.5 seismicity. Appl. Sci. 2021, 11, 10899, doi:10.3390/app112210899
Tim Pusat Studi Gempa Nasional-2017 (The 2017 PuSGen) (2017). Peta sumber dan bahaya gempa indonesia tahun 2017. Jakarta: Kementrian Pekerjaan Umum dan Perumahan Rakyat. (in Indonesian).
Triyoso, W. (2023a). Probabilistic seismic hazard function based on spatiotemporal earthquake likelihood simulation and Akaike information criterion: the PSHF study around off the west coast of Sumatra island before large earthquake events. Front. Earth Sci. 11, 1104717. doi:10.3389/feart.2023.1104717
Triyoso, W. (2023b). Applying the Akaike information criterion (AIC) in earthquake spatial forecasting: a case study on probabilistic seismic hazard function estimation in the Sumatra subduction zone. Submitt. Geomat. Nat. Risk (Under Review).
Triyoso, W., Kongko, W., Prasetya, G. S., and Sarsito, D. A. (2023). Spatial correlation of the maximum shear strain loading rate and the correlation dimension along the Sumatra subduction margin for potential earthquake and tsunami hazard study and analysis. All Earth 35 (1), 287–301. doi:10.1080/27669645.2023.2249669
Triyoso, W., and Sahara, D. P. (2021). Seismic hazard function mapping using estimated horizontal crustal strain off West Coast Northern Sumatra, Front. Earth Sci. 28. doi:10.3389/feart.2021.558923
Triyoso, W., Sahara, D. P., Sarsito, D. A., Natawidjaja, D. H., and Sukmono, S. (2022) Correlation dimension in Sumatra island based on active fault, earthquake data, and estimated horizontal crustal strain to evaluate seismic hazard functions (SHF). GeoHazards, MDPI 3, 227–241. doi:10.3390/geohazards3020012
Triyoso, W., and Shimazaki, K. (2012). Testing various seismic potential models for hazard estimation against a historical earthquake catalog in Japan. Earth Planets Space 64, 673–681. doi:10.5047/eps.2011.02.003
Triyoso, W., and Suwondo, A. (2022). From the geodynamic aspect to earthquake potential hazard analysis of Liwa city and its surrounding. Nat. Hazards. doi:10.1007/s11069-022-05705-0
Triyoso, W., Suwondo, A., Sahara, D. P., and Sarsito, D. A. (2021). “Earthquake potential hazard around off coast the West Sumatra-Bengkulu: application spatial correlation between estimated Shmax and correlation dimension,” in Proceedings of the 18 Annual Meeting of the Asia Oceania Geosciences Society (AOGS 2021), Singapore, August, 2021.
Triyoso, W., Suwondo, A., Yudistira, T., and Sahara, D. P., (2020) Seismic hazard function (SHF) study of coastal sources of Sumatra island: SHF evaluation of Padang and Bengkulu cities, Geosci. Lett. 7 (2). doi:10.1186/s40562-020-00151-x
Triyoso, W., and Yuninda, O. (2022). “Seismic hazard function (SHF) study prior to large earthquake event of the year 1994 and 2006 off coast of the Java island: the SHF analysis based on the change of the b-value,” in Proceedings of the 19th Annual Meeting of the Asia Oceania Geosciences Society (AOGS 2021), Singapore, August, 2022.
Utsu, T. (1978). Estimation of parameter values in the formula for the magnitude-frequency relation of earthquake occurrence. Zisin 31, 367–382. doi:10.4294/zisin1948.31.4_367
Wang, R., Chang, Y., Miao, M., Zeng, Z., Chen, H., Shi, H., et al. (2021). Assessing earthquake forecast performance based on b value in yunnan province, China. Entropy 23, 730. doi:10.3390/.e23060730
Wells, R. E., Blakely, R. J., Sugiyama, Y., Scholl, D. W., and Dinterman, P. A. (2003). Basin-centered asperities in great subduction zone earthquakes: a link between slip, subsidence, and subduction erosion? J. Geophys. Res. 108, 2507. doi:10.1029/2002JB002072
Wiemer, S. (2001). A software package to analyze seismicity: ZMAP. Seismol. Res. Lett. 72 (2), 373–382. doi:10.1785/gssrl.72.3.373
Wyss, M., Sammis, C. G., Nadeau, R. M., and Wiemer, S. (2004). Fractal dimension and b-value on creeping and locked patches of the san andreas fault near parkfield, California. Bull. Seism. Soc. Am. 94, 410–421. doi:10.1785/0120030054
Youngs, R. R., Chiou, S. J., Silva, W. J., and Humphrey, J. R. (1997). Strong ground motion attenuation relationships for subduction zone earthquakes. Seismol. Res. Lett. 68 (1), 58–73.
Zachariasen, J., Sieh, K., Taylor, F. W., and Hantoro, W. S. (2000). Modern vertical deformation above the Sumatran Subduction Zone: paleo geodetic insights from coral microatolls. Bull. Seismol. Soc. Am. 90, 897–913. doi:10.1785/0119980016
Keywords: PSHF near coastal area of Sumatra, PGA, HVSR, amplification, tsunami height simulation
Citation: Triyoso W, Kongko W, Prasetya GS and Suwondo A (2024) Study on earthquake and tsunami hazard: evaluating probabilistic seismic hazard function (PSHF) and potential tsunami height simulation in the coastal cities of Sumatra Island. Front. Built Environ. 10:1310251. doi: 10.3389/fbuil.2024.1310251
Received: 09 October 2023; Accepted: 12 January 2024;
Published: 25 January 2024.
Edited by:
Aybige Akinci, National Institute of Geophysics and Volcanology (INGV), ItalyReviewed by:
Ahmet Anil Dindar, Gebze Technical University, TürkiyeTheodoros Chrysanidis, University of Thessaly, Greece
Copyright © 2024 Triyoso, Kongko, Prasetya and Suwondo. This is an open-access article distributed under the terms of the Creative Commons Attribution License (CC BY). The use, distribution or reproduction in other forums is permitted, provided the original author(s) and the copyright owner(s) are credited and that the original publication in this journal is cited, in accordance with accepted academic practice. No use, distribution or reproduction is permitted which does not comply with these terms.
*Correspondence: Wahyu Triyoso, d3RyaXlvc29AZ21haWwuY29t