 Nathan Hays
 Lidia Badarnah
 Anuj Jain
94% of researchers rate our articles as excellent or good
Learn more about the work of our research integrity team to safeguard the quality of each article we publish.
Find out more
ORIGINAL RESEARCH article
Front. Built Environ., 26 February 2024
Sec. Indoor Environment
Volume 10 - 2024 | https://doi.org/10.3389/fbuil.2024.1309621
The built environment faces significant challenges in managing energy demands amidst rising temperatures and increasing concerns linked to climate change. Meeting carbon emissions targets and resource management goals necessitates urgent innovation in more energy-efficient cooling solutions. Nature offers a large database of adaptive and efficient thermal solutions that can be harnessed through biomimetic methods in building design and systems. Emerging biomimetic and computational approaches hold promise in facilitating practical application efforts. This paper investigates the translation of morphological features from elephant skin to building facades, optimizing their inherent cooling capabilities through computational design using evolutionary algorithms. Through this exploration, we propose a set of generalized evolutionary principles, offering a foundational framework for the development of textured facade tiles with the aim of mitigating heat gain from solar radiation. This study provides an in-depth analysis of how assembly, texture depth, and orientation impact thermal performance, enabling the design of more effective passive cooling systems through an understanding of the relationship between morphological variations in textured surfaces and environmental performance. Future research may involve studying natural convection dynamics, optimizing capillary networks, evaluating materials for water adhesion and cleaning, assessing impacts on biological growth, and exploring biodiversity integration within textured facade panels.
As the world continues to struggle with the challenges of climate change and limited resources, there has been a growing recognition of the potential of drawing inspiration from nature (i.e., biomimicry or biomimetics) for the development of innovative design solutions for sustainable architecture (Kuru et al., 2019). Globally, a significant amount of energy is used for cooling which contributes to human-induced urban heat island effect and climate change. In the past decade alone, energy demand for space cooling has been rising at a steady pace of 4% every year (IEA 2022). From 1990–2017, electricity usage for space cooling in residential and commercial buildings increased by 7.5% in hot and humid southeast Asia. By 2040, this number is expected to quadruple, and with it, our carbon footprint (IEA 2021; Jain and Swaminathan 2023). Rightly so, architects and designers have focused on exploring novel strategies to enhance thermal comfort for hot and humid climates while reducing energy consumption. However, the majority of such efforts in the region have been limited to architectural design studios (Arumugam et al., 2023) with less effort devoted to developing real-world prototypes.
Looking at strategies and principles from nature as design inspiration, i.e., biomimicry and biomimetics, has drawn great attention in the last decade. There have been noticeable advancements in the development of biomimetic solutions in material science, engineering, and in architecture (Chayaamoor-Heil et al., 2023). Specifically, in the domain of water harvesting and cooling, numerous initiatives have translated nature’s efficient mechanisms into innovative building solutions (Badarnah and Kadri 2015; Sommese et al., 2022). Researchers and designers have drawn inspiration from various natural models such as barnacles, cacti, desert beetles, prairie dogs, and termite mounds, to create innovative design solutions that harvest moisture from air and enable ventilation (Sommese et al., 2022; Jain and Swaminathan 2023). Patterns in nature have been selected through evolution because they are functional—they satisfy or contribute to the fulfillment of specific needs (Thompson 1992). These patterns can manifest as or comprise agent interactions, network motifs, temporal patterns, geometric patterns, or collections of these and others. In this research, we focus on the geometric pattern of elephant skin, characterized by its bumped, cracked, and creviced morphology.
Despite the existing developments and progress made in biomimicry, the potential of exploiting the morphology of elephant skins as an evolutionary-based computational approach for efficient cooling in tropical climates remains underexplored. Elephants have evolved unique skin morphology to withstand high irradiation and facilitate heat loss via evaporation. Their skin acts as a cooling system, efficiently regulating body temperature and protecting them from overheating (Lilywhite et al., 1987; Mole et al., 2016; Weissenbock et al., 2010; Martins et al., 2018). In nature, certain morphological patterns can encapsulate several strategies serving multiple functions (Badarnah 2017). By investigating the strategies related to the broad function of thermoregulation, including self-shading, evaporative cooling, and natural convection, designers can gain valuable insights into developing innovative solutions for buildings.
Current research on morphological manipulations of building facades to influence thermal performance has also gained more attention in recent years. For example, the work of Grobman and Elimelech (2015) has paved the way for understanding how alterations in surface geometry can create microclimates, ultimately acting as thermal barriers. Using the skin morphology of elephants as inspiration for the design of textured facade panels has proven to be a particularly promising avenue and has the potential to provide effective evaporative cooling mechanisms, where the impact of surface area to volume (SA:V) ratios varies for different surface roughness profiles (Peeks and Badarnah 2021). This study builds on findings from previous studies, such as (Peeks and Badarnah 2021), and further investigates the potential of exploiting the distinct skin morphology of elephants in architectural design by employing an evolutionary-based design approach to optimize design solutions and achieve more effective cooling. While the morphology of elephant skin may play a role in functions beyond thermoregulation, this paper focuses on aspects of the patterns that contribute to cooling through self-shading. To complement this, the study seeks to augment understanding of the underlying mechanisms driving benefits from self-shading to guide the design of façade tiles that reduce the need for additional energy in cooling. The emphasis of this research lies predominantly in the exploration of facade tile geometry, and thus, material choice is not the focal point in this stage of our study.
This study focuses on the design of morphological cooling solutions for buildings inspired by elephant skins. To achieve this, we needed to first determine whether self-shading from the skin patterns genuinely contributes to cooling. Should these benefits be confirmed, our aim is to shed light on the physical processes driving this cooling effect. A comprehensive understanding of these physical processes can inform the generative design process and guide further research into how these processes elicit or are linked to the related strategies of natural convection and evaporative cooling.
In this study, a biomimetic problem-based approach is adopted (Badarnah 2017), where clearly defined functions and morphological configurations are formulated. To address the defined design challenge, an integrated biomimetic computational approach is configured and represented in (Figure 1) with three basic stages: Abstraction, Synthesis, and Solution. The Abstraction stage involves defining the key geometrical features from the natural model; the Synthesis stage focuses on evolving the pattern, analyzing results, and refining our fitness objectives; and the Solution stage consists of defining design principles, reporting on performance results, and discussing visions. The following subsections elaborate on the different stages of this study inspired by elephant skin.
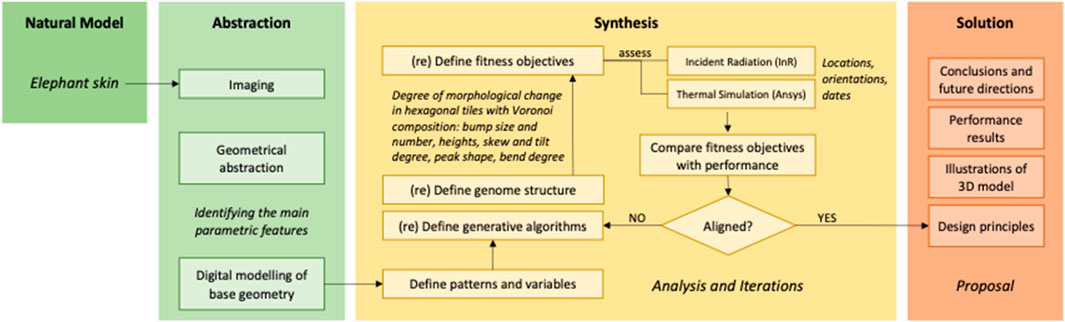
FIGURE 1. Flow chart of the research process. ‘Natural Model’ refers to elephant skin. The ‘Abstraction’ phase involves deconstructing elephant skin patterns into fundamental geometric elements. In ‘Synthesis’ more specific features of the geometry are evolved using incident radiation data and tested with thermal simulation software. The ‘Solution’ phase condenses the findings into actionable ‘Design Principles’ and discusses the limitations of the study and potential avenues for future research.
In the Abstraction stage, we established a base geometry—an abstracted version of the elephant skin morphology, building on initial findings from (Peeks and Badarnah 2021). The specific characteristics of the pattern were further fine-tuned in the Synthesis stage as the pattern evolved to better fit the fitness objectives that were defined based on the Incident Radiation (InR) data.
Since this study investigates the bumps’ interaction with radiation and the differences in heat transfer due to variations in bump characteristics beyond their base (e.g., bump scale, shape, height, etc.), we opted for a 2D Voronoi pattern for the bump arrangement. The application of the Voronoi pattern allowed us to quickly generate pseudo-random bump arrangements while focusing on aspects that have a greater impact on the geometry’s relationship with radiation and heat transfer, such as pattern scale and bump shapes.
First informally used by René Descartes in 1644 and precisely defined in 1908 by Georges Voronoï, the Voronoi technique for partitioning space finds use today in fields ranging from biology and medicine to computer science (Lau et al., 2021; Okabe et al., 2000; Voronoï 1908a; Voronoï 1908b). We applied a straightforward approach whereby a 2D surface is divided into cells based on seed points. Each cell emerges from a seed point and encompasses all points on the surface closer to its seed point than to any other. We let each Voronoi cell represent the base of a bump. The edges of the Voronoi cells became the crevices in the elephant skin pattern and the base of each bump matched the shape of the corresponding cell (Figure 2).
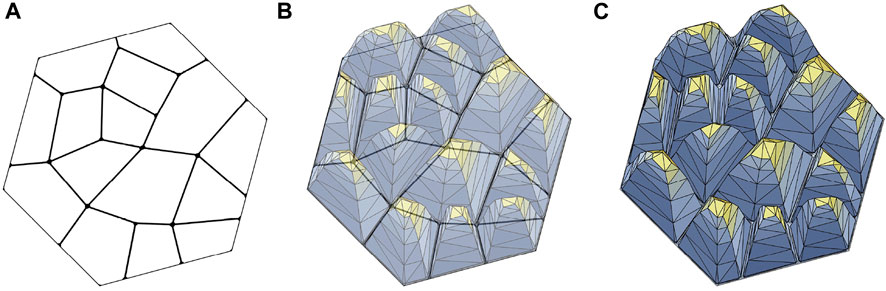
FIGURE 2. Geometric base for the elephant skin-inspired tiles, consisting of a crevice network following the edges in a Voronoi pattern (A) and bumps rising from the Voronoi cells (B,C).
We acknowledge that the character of the crevice network (directionality, connectivity, average crevice length, and width, etc.) may significantly impact the capillary action pull of water and, in turn, the coverage of the surface with water. However, quantifying the water capture and transport benefits of the design was outside the scope of this paper. Future studies might examine this aspect more closely.
Additionally, we opted for non-textured bumps, dissimilar from the actual elephant skin which is textured even at smaller scales (Martins et al., 2018). Smaller scale textures may introduce additional benefits like improved water adherence and could be included in future research focused on material selection. However, small-scale textures would significantly increase the computational complexity of our simulation models and were deemed to be outside the scope of the current study.
Generative design was employed in the Synthesis stage. This involved integrating Grasshopper (build 1.0.0007), a plugin for Rhinoceros software (Robert McNeel and Associates 2020), and Ansys® software [Ansys 2022 R1] workflows to move towards an optimal pattern with respect to irradiation, and ultimately, thermal performance. A Grasshopper script was developed to generate variations of the pattern conceptualized during the Abstraction phase. These variants were assessed based on metrics originating from their Incident Radiation (InR) output. The generative algorithm, in turn, produced variants that scored progressively better in these assessments. An additional step of evaluating the InR metrics was performed by simulating the thermal performance of the generated geometries using Ansys® and comparing their relative InR scores to their relative thermal performance scores.
Generative design, and more specifically, a performance-based generative design system, is a computational approach to generate design options based on environmental data and designer-defined goals. This method enables rapid iteration with feedback on performance, often resulting in complex, unintuitive, and better-performing solutions that may not be achievable through manual design processes (Caetano et al., 2020).
Evolutionary algorithms (EAs) are the subcategory of generative design used in this study. EAs are inspired by the principles of evolution, incorporating mechanisms such as genes, sexual reproduction and crossover, mutation, and natural selection (Bäck and Schwefel 1993). By emulating the natural progression in living systems towards more optimal solutions, these algorithms bias the pseudo-random generation of forms in directions that tend to perform better according to specified performance metrics. These metrics, or fitness objectives, steer the optimization. By simulating the physical environment and evaluating each iteration’s performance within that environment, and by using this method to explore nature’s own morphological discoveries, we can gain insights into the factors influencing evolution’s trajectory while simultaneously unveiling novel solutions for human design applications.
A Grasshopper script was developed that generates a hexagon tile with a diameter of 10 cm. The tiles were selected to be of hexagon shape because such a shape allows for optimized placement when the tiles are clustered together (Thompson 1992) in real-life applications. Peeks and Badarnah (2021) provided valuable insights by showcasing the benefits of hexagonal panel assemblies in the context of building façade tiles, not only for efficient packing but also for cooling. The front-facing surface of the tile received a pseudo-random arrangement of Voronoi seed points from which 2-dimensional Voronoi cells were made. By incorporating this randomness in the tile generation process we can focus our examination on more general and inclusive pattern characteristics rather than single, one-off tile geometries. While the exact locations of the Voronoi seeds are random, the number of seeds, bump heights, and other bump characteristics are controlled by genes. Figure 3 illustrates how differences in these genes translate to variations in tile morphology.
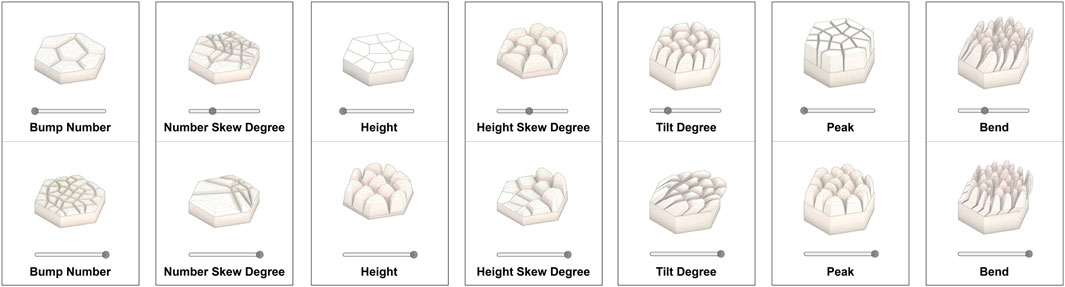
FIGURE 3. Seven different genes, used in different combinations for different evolutions, and their associated influence on tile morphology.
Crevices exist where the bases of the bumps meet. The width and height of the crevices were controlled by input parameters but were maintained at constant values of 0.67 mm and 0.4 mm, respectively, as approximations of elephant skin crevices. Future research can explore the optimization of crevice heights and widths, as well as optimal directionality and connectivity for crevice networks, to enhance capillary action pull and achieve more complete water coverage on façade surfaces.
Fitness objectives based on Incident Radiation data served as goals for our evolutionary process. We derived fitness objective scores from ratios that compare simulated InR data on bumpy patterns to InR data on flat surfaces. When the score is 1.0, there is no difference between a flat tile and a bumpy pattern relative to the chosen metrics. If the score is less than 1.0, the bumpy pattern being analyzed performs “better” than a flat tile in the same orientation. Conversely, if the score is greater than 1.0, that bumpy pattern performs “worse” than a flat tile in the same orientation.
This approach allowed us to make our fitness objectives meaningful beyond goals for an evolutionary algorithm EA (i.e., to make their values more easily interpretable within a larger context) and to ensure consistency across different geographic locations, times of the year, and orientations. We will discuss tile orientations in more detail in the following section.
We used the Wallacei plugin (V 2.7) as our evolutionary algorithm engine, which supports multi-objective optimizations (Showkatbakhsh and Makki 2018). During some evolutionary runs, we used multiple objectives. Other runs combined relevant data into a single fitness objective. For an in-depth understanding of the specific fitness objectives used, and more detailed information about the evolutionary runs, refer to Supplementary Material SI 1.
A straightforward way to evolve tile morphologies that are optimized for thermal performance would be to use data directly related to the temperature on the back surface of the tile, or heat flux into the hypothetical building, as our fitness objective. However, since the necessary thermal analysis tools are not yet available to directly test tiles’ thermal performance in Grasshopper or its plugins, we derived fitness objectives from proxy data that could be obtained within Grasshopper. The same data used to derive fitness objectives were used in Ansys® thermal simulations. Simulated thermal performance data, as given by Ansys®, was used to iteratively fine-tune the fitness objectives used in Grasshopper.
Incident Radiation (InR) data from Ladybug’s (Ladybug Tools 2021) Sky Matrix and Incident Radiation components was collected and used in transient thermal simulations with Ansys® Mechanical [2022 R1]. For a step-by-step guide of this data transfer process, and for an account of the simulation parameters used in Ansys® Mechanical, refer to Supplementary Material SI 2.
Since our primary focus is on developing façade designs for hot and humid climates, Singapore serves as the primary point of interest. Additionally, we examine Phoenix, Arizona, in the United States, to compare results from Singapore with a location that experiences higher radiation levels.
Singapore Changi Airport and Sky Harbor Airport in Phoenix were selected as specific locations for the simulations. Conducting thermal analyses (in Ansys®) throughout an entire year, for multiple tiles, would demand computational resources and time beyond what was available. Consequently, specific dates were selected across the year for evaluation. For Phoenix, the chosen dates represented periods with varied Sun paths and temperatures (and that would benefit from irradiation management). We aimed to observe both extreme and slightly more moderate heat conditions. In Singapore, dates were selected when the Sun’s path was at its nadir (in December) and near its zenith. Buildings in Singapore can benefit from irradiation remediation year-round and experience relatively consistent temperatures. In Singapore, we analyzed data from December 11 for a 1-day period and December 19–21 and April 18–20 for two separate 3-day periods. For Phoenix, we examined data from July 3 for a 1-day period, and April 18–20, and June 19–21 for two different 3-day periods (Table 1). The weather data comes from EPW files provided by the Ladybug Tools EPW Map (Ladybug Tools 2024; Mostapha and Pak 2013). The colors in Table 1 provide a rough scale for irradiation levels for the given locations and dates (with red corresponding to higher levels and yellow for lower).

TABLE 1. Days and Locations of weather data used for evolutions and simulations.
Using Ladybug’s Sky Matrix and Incident Radiation components, we obtained hour-by-hour InR data for each mesh face. Since our goal was to find representative values spanning different possible scenarios, rather than specific values for a singular design, we deemed these components sufficient for our purposes. The InR data was used to define our fitness objectives and was used as input for Ansys® thermal simulations.
We analyzed the tiles in different orientations at each location. Different orientations were denoted by plane numbers (e.g., “Plane_00” or “P_00”). Frequently referenced planes include Plane_00, which faced geographic south (toward the south pole); Plane_02, which faced southwest and received slightly more radiation than Plane_00 since it faced more towards the Sun when the Sun is lower; Plane_01, which faced southwest at an altitude of 31.7° (and usually experienced the highest irradiation levels since its upward tilt comes closer to matching the Sun’s elevation in the afternoon); and Plane_12, which faced east and slightly north (and experienced high irradiation in the mornings at both locations).
We assessed the thermal performance of the bumpy patterns by comparing these tiles to flat tiles in the same orientations. Temperature and heat flux measurements were taken on the backs of the tiles. The tiles that were compared had equal volumes (0.3 m2). Heat flux, being a vector quantity, has a direction associated with it. Considering only the tile’s exterior surface is subject to additional energy from radiation, we inferred that the heat flux on a tile’s back surface represents heat moving toward the interior of a hypothetical building. To gauge performance using a single metric, we compared the integrals of the heat flux graphs for both the bumpy and flat tiles. This comparison yielded a thermal performance ratio of total energy crossing the back surface of the tiles, bumpy to flat. A lower ratio signifies a better-performing tile. The ratio thus compares the performance of bumpy patterns to flat surfaces.
While the material choice was not the focal point of our study, it did hold a certain degree of importance, predominantly due to varying conduction coefficients (K) associated with different materials. Lower K values can highlight significant differences arising from different InR distribution patterns that would be obscured by higher K values. We opted for a conduction coefficient of 2.2 W/m°C, a value representative of an insulative form of concrete (Talebi et al., 2020). The lower K value helps underscore key disparities between patterns and more accurately approximates the conduction coefficient of many materials likely to be considered for practical applications in the real world.
The first results presented relate to a tile that encapsulates the essential geometric principles identified as beneficial for cooling. Presenting these analyses in the Results section serves to frame and contextualize the subsequent findings. This tile, called Tile Zero, was compared to a flat tile in the different locations, dates, and orientations discussed earlier. To look more closely at the specific impact temperature difference (from outside to inside) has on thermal performance ratios, we simulated non-air-conditioned scenarios (in addition to our standard air-conditioned scenarios) for Tile Zero. In air-conditioned scenarios, the interior temperature was set to a constant 22.8°C (73°F). In non-air-conditioned scenarios, the interior temperature simply reflected the exterior temperature hour-to-hour.
We closely examined the influence of surface area by adjusting both the number and the height of the bumps and then gauged the resulting changes in thermal performance ratios. To determine if properties beyond surface area contributed to performance, we carried out a simulation series that relocated the concentrations of irradiation. In this study, the total amount of InR on the surface, and the tile’s surface area and geometry, were held constant, while the distribution of irradiation varied. The goal of this redistribution study was to determine whether optimizing bump shapes for specific environments is a worthwhile endeavor, or if increasing surface area remained the primary and unrivaled design strategy.
We first examine the findings from a single tile featuring a bumpy pattern based on the design principles derived from our study. This tile, called Tile Zero, features a bumpy pattern biased toward regular ‘bumpy’ shapes and away from more complicated geometries (Figure 4). The bumpy characteristics are not those that performed best in our simulations—rather, they stem from the insights gained from the evolutions and thermal analyses.
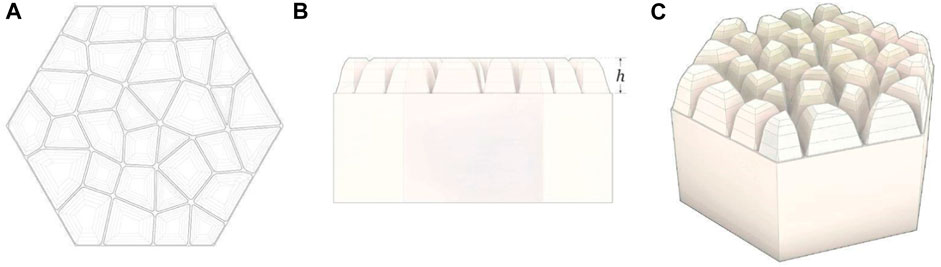
FIGURE 4. Tile Zero, a basic tile design based on principles gleaned from this study, in plan (A), elevation (B), and perspective (C) views. Rather than the exaggerated features that performed best in simulations, this tile encapsulates a moderated interpretation of effective characteristics. The height (h) for bumps on Tile Zero is 12.81 mm.
Comparison of temperature and heat flux between Tile Zero and a flat tile is shown in Figure 5. The heat flux on a tile’s back surface represents heat moving toward the interior of a hypothetical building. When comparing the total energy crossing the back surface of the tiles (bumpy to flat), the performance ratio is 0.708, indicating a 30% reduction in heat energy across the back of Tile Zero relative to the flat tile in the same location and orientation.
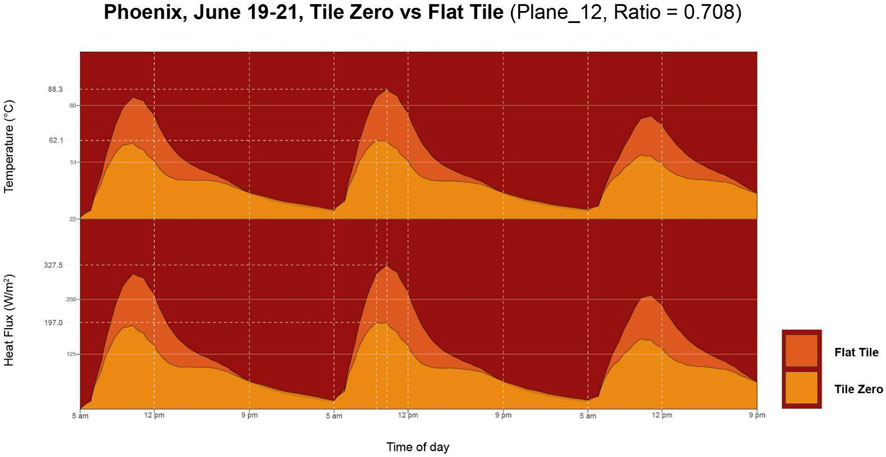
FIGURE 5. Tile Zero compared to a flat tile in the same location and orientation for Plane_12 in Phoenix for the dates June 19–21. Heat flux and temperature peak in the morning hours because Plane_12 faces east. The top graph tracks the temperature on the back surface of the tiles (closely paralleling heat flux). The bottom graph shows the heat flux on the back surface of the tiles through time (peaking in the morning hours on these east-facing tiles).
Similar graphs are shown in Figure 6. Less total heat passes through Tile Zero than the flat tile for the four orientations and the two different time periods depicted. This was the case for all orientations and hours tested.
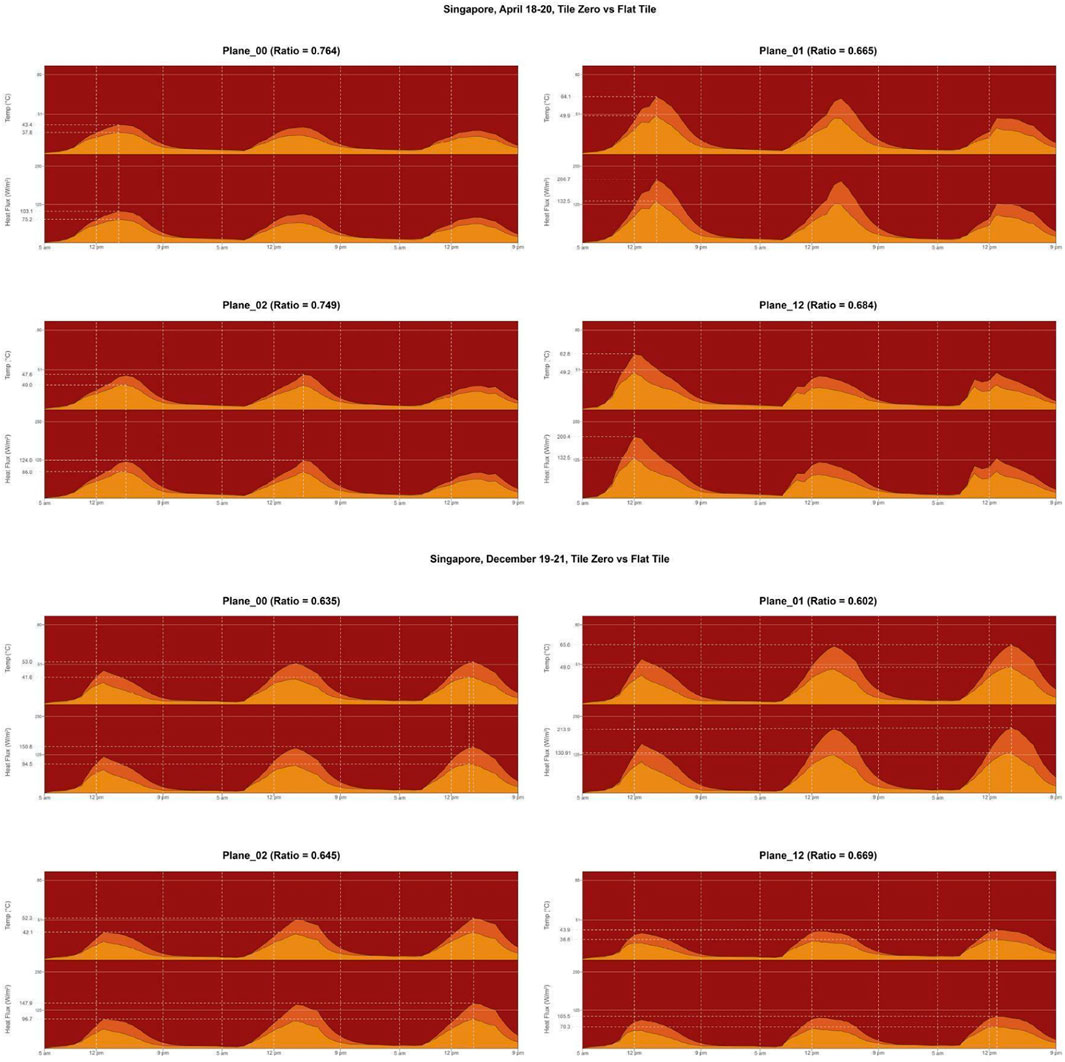
FIGURE 6. Tile Zero compared to a flat tile in Singapore at four different orientations over two different time periods. Tile Zero outperforms the flat tile of equal volume in every scenario.
Tile Zero represents a single geometry. The findings we present here cover a variety of geometries. Increasing bump number and increasing bump height are two straightforward ways of increasing surface area. In Figures 7A,B, bump number increases from bottom to top, and bump height increases from left to right. For both timeframes, a distinct improvement was observed with these increases.
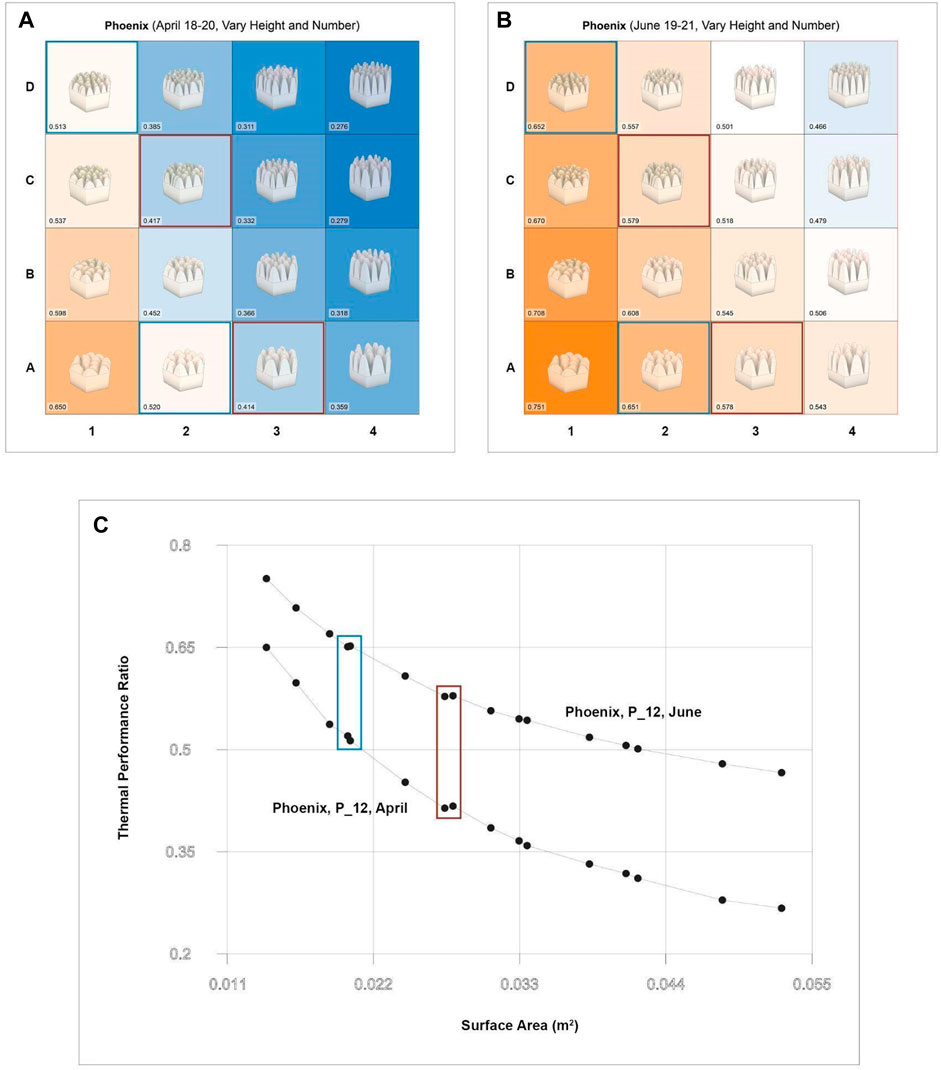
FIGURE 7. Relationship between surface area and performance. Panels (A) and (B) show how performance improves as we increase the bump number (move from A to D) and as we increase the bump height (move from 1 to 4). Thermal performance ratios are provided at the bottom left corner of each cell. Panel (C) maps the relationship between the tiles’ surface areas and their thermal performance ratios. Slight deviations (or inversions) in the expected performance ratio to surface area relationships were observed in tiles A2 and D1 (outlined in blue) and A3 and C2 (outlined in red).
The parameters (surface area, fitness scores, and performance ratios) were tested for normality using the Shapiro-Wilk normality test and were found to be normally distributed. We found a relationship between surface area and performance ratios (Figure 7C) i.e., the surface area was negatively correlated with the performance ratios in April (Pearson’s R = −0.956, t = −12.2, p < 0.001) and June (Pearson’s R = −0.96, t = −12.9, p < 0.001) respectively. This meant that increased surface area had better performance ratios.
The relationship between surface area of the tiles (Figures 7A,B) and performance is consistent except for small deviations in two sets of two tiles (Figure 7C). These tile pairs are A2 and D1, outlined in blue; and A3 and C2, outlined in red. These deviations suggest that factors beyond surface area can play a role in thermal performance, especially in tiles with more pronounced bumpy shape variations.
To test the hypothesis that the location of InR has no role in a tile’s performance, we created a hypothetical scenario in which InR values from the tips of the bumps were interchanged with those close to the base and progressively continued in this manner until all InR values were spatially swapped (Figure 8). Using the geometry of a high-performing tile, performance was compared as the InR was distributed differently across the tile surface.
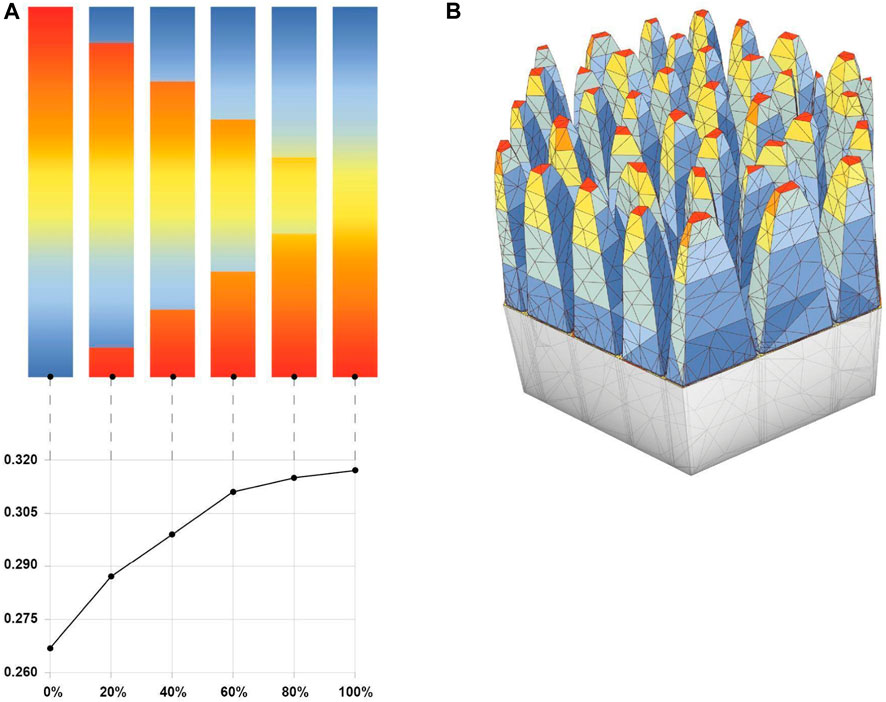
FIGURE 8. Redistribution of InR values according to position along the z-axis (A). Stronger radiation values (red) are typically seen higher on bumps and further away from the back surface of the tiles (B). The graph at the bottom of (A) suggests performance gets progressively worse as values falling on mesh faces with high z coordinates are swapped with values on mesh faces with low z coordinates. At each step, an additional 10% at each pole (by distance) is swapped until 100% of the values have been swapped with their z-coordinate mirror. Total InR values on the surface are equal at every step.
This experiment allowed us to test the possibility that shapes that promote smaller concentrations of InR further away from a tile’s back could lead to benefits beyond those attributed to the surface area. Had the performance remained consistent even in this artificial and exaggerated scenario, it would suggest no added benefit from varying bump shapes beyond increasing surface area. In such a case, we might conclude that, for self-shading, the specific form of the bumps is inconsequential.
As shown in the graph in Figure 8, when InR is predominantly situated further from the back, less heat makes it across the back of the tile. With each subsequent step, swapping more InR values, the tile performs progressively worse. Because of this, we included weights to reward tiles that concentrated InR in smaller areas and further from the back surface as part of our fitness objective in the evolutions. However, even in this extreme scenario, the difference in tile performance associated with InT distribution, compared to changes in surface area, from self-shading alone, is below 5%.
In section 3.1, we noted that Tile Zero performed significantly better than a flat tile in every scenario we simulated. It is also worth noting that the performance ratios improved as total radiation input increased. This implies the cooling benefits might be more pronounced under conditions of more intense sunlight.
This relationship was broadly consistent in both Singapore and Phoenix during the periods we tested, with the exception of Plane_02 in Phoenix in April (Figure 9) which performs worse than what we might predict. At peak radiation during these dates in Phoenix, the Sun is nearly perpendicular to Plane_02, so minimal shade is cast. However, this explanation might not be sufficient if the primary advantage of increased surface area is more surface through which gained heat can dissipate.
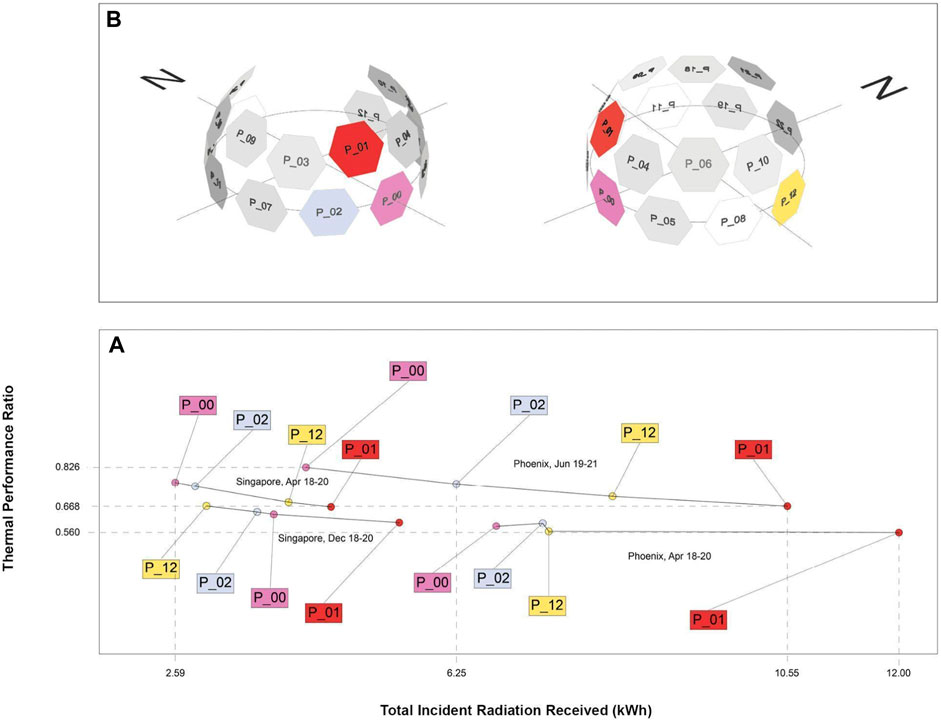
FIGURE 9. (A) Performance Ratios of Tile Zero plotted by the amount of radiation falling on the tile (which varies depending on the location, dates, and orientation). (B) Shows the orientations of the different planes shown in (A).
Statistically, radiation input was not significantly correlated with the performance ratios in Phoenix (Pearson’s R = −0.58, t = −1.75, p = 0.13) whereas the correlation was significant for Singapore (Pearson’s R = −0.79, t = −3.24, p = 0.017) across the time periods tested. The parameters (radiation input and performance ratios) were tested for normality using the Shapiro-Wilk normality test and were found to be normally distributed.
Figure 9 also shows that the performance ratios are slightly better during cooler months for each location. The hours we examined for Singapore in December were marginally cooler than those in April—a trend more pronounced between April and June for Phoenix. This improvement during cooler periods likely stems from the reduced temperature difference between the exterior and interior. In such conditions, a more significant portion of the heat passing through the tile comes from radiation, meaning self-shading can mitigate a higher percentage of the heat transfer.
This inference is supported by the results from air-conditioned versus non-air-conditioned simulations (Figure 10) for each location, time, and plane. In every instance, the performance ratio was better (lower) in non-conditioned scenarios where the interior temperature mirrored the exterior temperature.
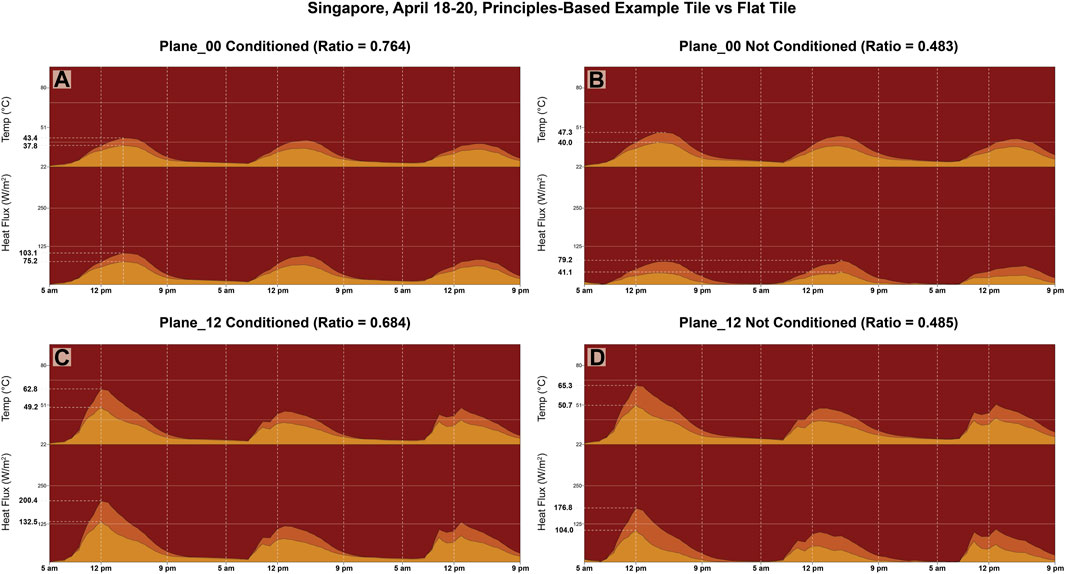
FIGURE 10. Simulations for air-conditioned (A,C) and non-air-conditioned (B,D) scenarios. Non-air-conditioned scenarios consistently give better (lower) Performance Ratios.
Part of our investigation involved the use of evolutionary algorithms (EAs) in Grasshopper to discover whether these algorithms could reveal subtle bump characteristics or distinctive morphological patterns tailored to specific locations and orientations, beyond generalized principles applicable to all cooling scenarios. The prominent example of a generalized principle in this paper is high surface area—and all the tiles generated evolved toward high surface areas. This section will present the performance outcomes of evolved tiles and what they revealed regarding characteristics beyond surface area.
Since it is not possible to directly test thermal performance within Grasshopper. Therefore, we must utilize proxy data related to thermal performance and calibrate a filter to enhance its predictive capability regarding thermal performance. After several iterations, we arrived at a fitness objective that sought to minimize InR per unit area (effectively increasing surface area), while limiting InR to smaller clusters situated further from the back of the tile. Figure 11 shows results from tiles that evolved using this fitness objective.
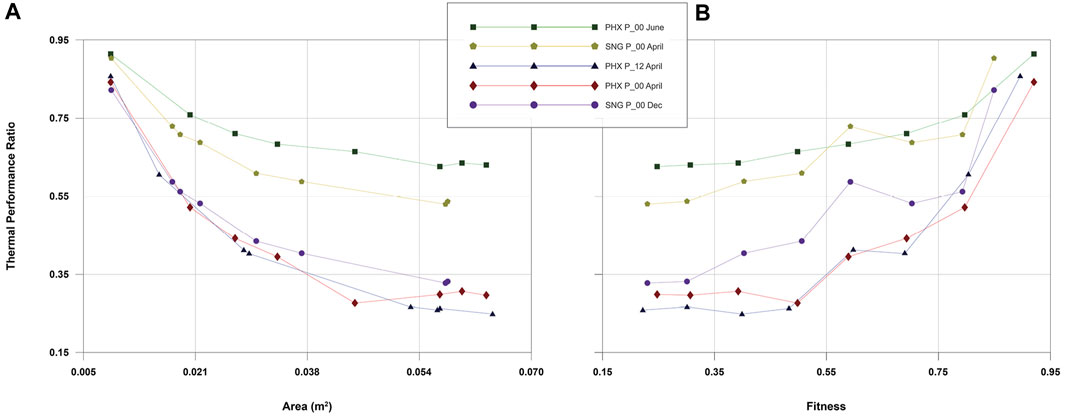
FIGURE 11. Comparing the relationship between (A) surface area (m2) and performance; (B) fitness and performance. Each point represents a unique tile. The same tiles are shown in (A) and (B) with the only difference between the two graphs coming from the x-axis—Area for (A) and Fitness for (B).
It should be highlighted that the tiles illustrated in Figure 11 were evolved using data aggregated over an entire year. In contrast, the thermal simulations spanned only 1 or 3 days. As discussed in Section 2.2.4, conducting thermal analyses over an entire year would exceed the time and resource constraints of this study. Future research might look at thermal performance over shorter durations of tiles evolved exclusively over those specific dates. This more focused analysis would benefit from more advanced simulation that could account for and inspect the associated cooling strategies of evaporative cooling and natural convection.
Differences in tile morphologies for tiles evolved for more focused periods, or in different locations and orientations, manifest primarily as differences in tilt and bend. These characteristics exert a small influence on performance which is dampened as the analysis window increases.
A negative relationship between surface areas and performance ratios was found for Singapore and Phoenix with correlation values ranging from −0.83 to −0.97. A positive relationship was found between fitness and performance ratios with correlation values ranging from 0.83 to 0.99. Thus, the predictive capacity of surface areas and fitness objective scores are very close to each other. Note that the performance ratio values for Phoenix were not normally distributed whereas Singapore values were normally distributed as seen via the Shapiro-Wilk normality test. Hence, Spearman’s and Pearson’s correlation coefficients were used for the two locations respectively.
Beyond determining whether self-shading at a small scale can confer thermal advantages. This study has aimed to uncover any specific morphological principles that can enhance these benefits. To reveal specific morphologies acutely tuned to particular sunlight scenarios, we used an evolutionary algorithm with fitness objectives derived from surface irradiation data. For this approach to be a dependable method of finding optimal tile morphologies, the objectives we derive must be predictive of thermal performance—i.e., tiles that score high on fitness should exhibit greater cooling effects.
However, in some instances surface area seemed to be a better predictor of performance and where fitness did not map to performance as expected. An illustration of this can be seen in Figure 12. Tile E, when compared to tiles F and G, performed better with respect to fitness but worse in the thermal simulations. The plot in Figure 12 (a) shows these three tiles align as we would expect according to their surface areas, and (b) shows tile E’s deviation. Figure 12 (c) shows the tiles responsible for these results, revealing a type of surface area increase that leads to poor fitness scores coupled with good performance ratios: flat peaks. Tiles F and G display this characteristic which, when compared to bumps of the same height but rounded bumps, gives them more surface area. But flat peaks expand the area subject to the highest levels of InR, resulting in less favorable fitness scores compared to similar tiles with rounded bumps. Still, correlation strength was comparable for both surface area to performance ratio and fitness to performance ratio, given the entire sets. Performance ratio was negatively correlated with surface area (Pearson’s R = −0.89, t = −5.016, p = 0.002) and positively correlated with fitness score (Pearson’s R = 0.89, t = 5.016, p = 0.002).
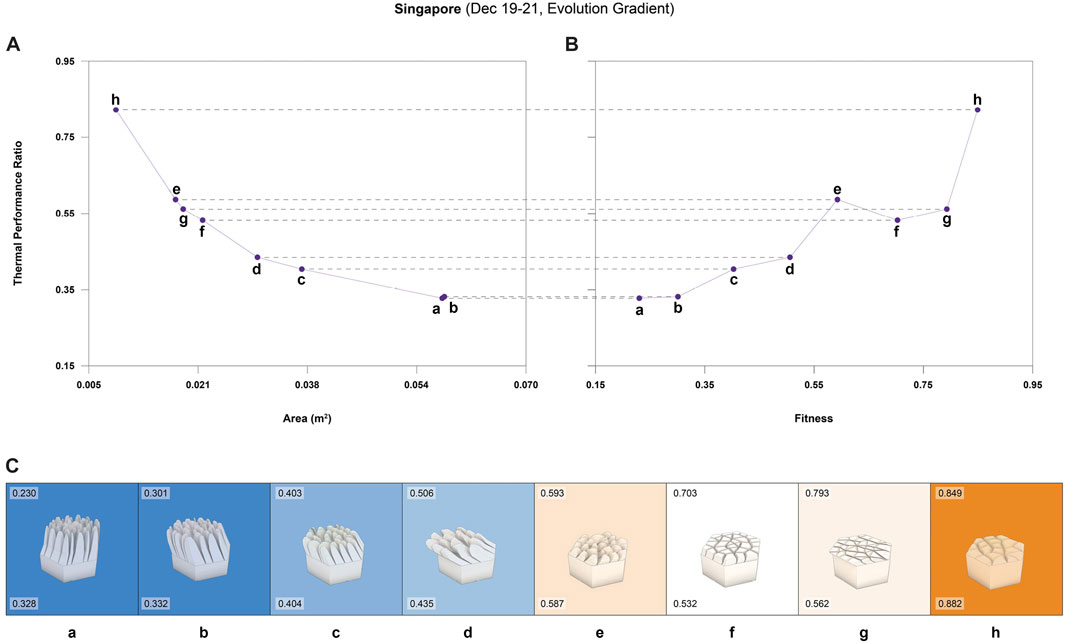
FIGURE 12. (A) Surface area compared with thermal performance, (B) fitness score compared with thermal performance for the same tiles, and (C) the geometries of the tiles responsible for (A, B). In (C), fitness scores are shown in the top left corner and performance ratios are in the bottom left. Tiles f and g have bumps with flat tips, which do not typically score well relative to the fitness metrics but do perform well in the thermal simulations.
Figure 13 explores changes only along this axis, altering the shape of the bumps’ peaks. As peaks grow more rectangular, filling the spaces between bumps to match the crevice width, surface areas increase and performance ratios improve. However, if we keep the surface area for the tiles constant as we change peak shapes (by decreasing the height of the bumps with flatter peaks), there is a slight advantage to tiles with rounder peaks. Furthermore, the transient thermal simulations in Ansys Mechanical cannot account for some related, and potentially important, changes to the external air movement and temperature.
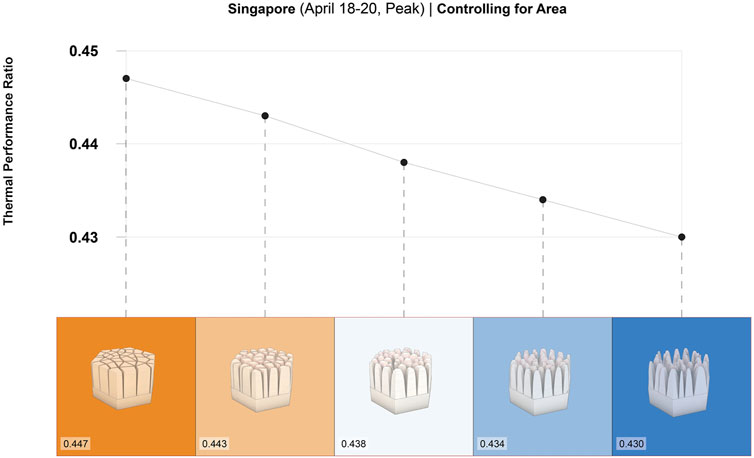
FIGURE 13. Interrogating how the shape of bumps’ peaks influences tile performance. The surface area is held constant across all tiles. Note: the range of difference in performance ratios is small here (between 0.430 and 0.447).
It is plausible that as the air velocity approaches zero within the expanded crevices, and as the air temperature within the crevices increases, tiles that have maximized surface area in this manner might simultaneously diminish the efficiency with which much of that surface area can dissipate heat back to the environment. There is a related complication tied to fluid dynamics: flat-peaked bumps may compromise certain features integral to natural convection, features that are more likely present in surfaces with the undulations of rounded bumps. Without additional insights from CFD simulations or empirical data, we cannot adequately address these potentially significant influences on thermal performance. We can conclude, however, that bumps with rounded peaks perform well. Given our results in Figure 13 and considering the potential drawbacks of flat peaks, we feel confident enough to include rounded peaks in the list of morphological principles.
The final two characteristics on the principles list have to do with the tilt and the bend of the bumps. Because we refer to height as z-axis reach, for bumps of the same height, tilted bumps have more surface area than those without tilt. For a similar reason, bumps that bend have more surface area than those that do not. When controlling for surface area—as we did in the peak comparisons—we observe negligible differences in performance, with a barely measurable advantage for tilts apparent only in the tallest bumps (Figure 14).
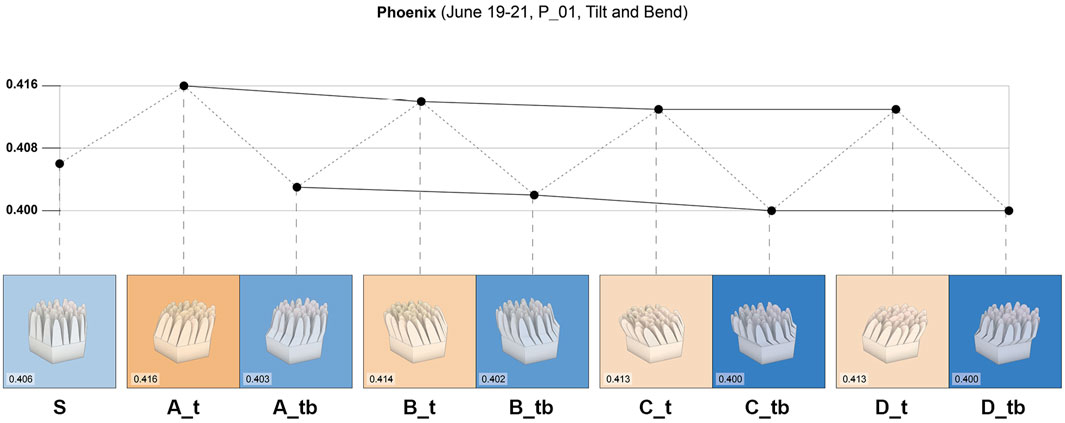
FIGURE 14. Comparing straight bumps (S) to bumps (A–D) with tilts (_t) and bumps with tilts and bends (_tb). (A) represents the tilt direction with the best fitness score in the evolution for this scenario—towards the western-most vertex of the hexagon—whereas (B–D) represent tilts 90°, 180°, and 270° counterclockwise from (A), respectively. The differences in performance across all tiles are minor, with straight bumps marginally outperforming those with tilts but not bends, and marginally underperforming those with both tilts and bends. Tilt direction introduces an even subtler effect.
For similar reasons to those in the peak discussion, near-surface air movement and temperatures complicate the thermal analysis for any tiles with very tall bumps. For taller bumps, and for those with exaggerated tilts and bends, the limitations of our simulation method prevent us from making definitive conclusions. Even if we were able to conclude bent bumps offered cooling advantages compared to straight bumps through CFD simulations and/or empirical observations, other concerns related to durability, fabrication, and cleaning might make simpler and shorter bumps more desirable.
In this section, we will delve deeper into the implications of our study’s findings, highlighting the practical applications of our work, and identifying potential areas for future investigation.
Our study builds upon existing research in the field that has primarily focused on morphological manipulations of building facades to influence thermal performance. By extending this research, we have shifted the focus to the assembly and depth of texture, demonstrating how these factors can significantly impact heat loss. Using the skin morphology of elephants as inspiration for the design of textured facade panels has proven to be a particularly promising avenue. Elephants’ skin, with its intricate network of wrinkles and crevices, has evolved to help them regulate their body temperature in hot climates. Similarly, our tiles emulate these natural features to facilitate cooling. In regions with distinct climatic conditions, adjusting the surface roughness of textured panels can optimize their thermal performance. By acknowledging the variability in SA:V ratios and their effects on heat transfer, architects and designers can make informed decisions when selecting or customizing facade tile solutions for different projects. Our findings provide valuable insights into the nuanced interplay between surface morphology and thermal performance, offering a wide perspective for architects and designers aiming to create energy-efficient and environmentally conscious structures.
Our study corroborates findings from previous studies and takes them a step further by optimizing hexagonal panel designs using evolutionary generative methods. The hexagonal assembly’s efficiency in both packing and cooling is of great practical significance in architectural design. These panels have the potential to reduce energy consumption in buildings by facilitating passive cooling mechanisms, thereby contributing to energy-efficient and environmentally friendly construction practices.
The use of evolutionary generative methods in architectural design is a novel and innovative aspect of our study. This approach allows for the exploration of design solutions that may not be immediately apparent through traditional design methods. By applying computational techniques to optimize facade panel designs, we have demonstrated the power of merging biological inspiration with computational creativity. This opens up new possibilities for architects and designers to create highly functional and aesthetically appealing building facades that contribute to improved thermal performance and energy efficiency.
Our study has uncovered a set of generalized evolutionary principles that serve as a foundational framework for designing textured facade tiles aimed at minimizing heat gain from radiation. These principles encapsulate key findings from our results and offer guidance for architects and designers seeking to create tiles that enhance thermal performance while remaining practical in real-world applications. The proposed principles are as follows:
• Greater surface area is advantageous - The primary predictor of thermal performance was found to be surface area, with an increased surface area correlating with improved thermal performance. Our results suggest that as surface area increases, a smaller portion of the Incident Radiation (InR) falling on a tile’s surface passes through the tile as heat. This significantly reduces the solar heat contribution, thereby improving cooling performance. Indeed, all of the tiles generated in our study evolved toward high surface areas. Greater surface area can be achieved by increasing the number of bumps, increasing the height of the bumps, or a combination of both. Tile Zero demonstrates this with a balanced approach, leaning more into the bump number than height. Although tiles with taller bumps performed better in our simulations, Tile Zero serves to highlight the significant cooling benefits that even modest bump heights can offer. Future research could explore natural convection on surfaces with very tall bumps, along with any issues related to the fabrication process, cleaning requirements, and whether tall bumps encourage biological growth (desired or undesired).
• Moderately rounded bump peaks are sufficient - While bumps with orthogonal sides and flat peaks performed better in our simulations, our study suggests the improved performance stems from the increase in surface area and not the shape itself. When corrected for surface area, bumps with rounded peaks were found to perform as well or better than those with flat peaks. While tiles with flat-peaked bumps performed only marginally worse, potential complications tied to air movement and heat dissipation, in addition to the potential benefits from rounded peaks in natural convection as a supplementary cooling mechanism, suggest that rounded bumps are a better choice. Our simulations do not account for the potential change in air temperature in the small spaces between flat-peaked bumps, or changes in air velocity between bumps, which may significantly affect how efficiently flat-peaked bumps lose heat to the environment. Additionally, we found that the spatial distribution of InR plays a secondary role in the thermal performance of tiles. Tiles that concentrate InR in smaller areas, further away from the tile’s back surface, tend to perform better in our simulations. It appears more difficult, however, to achieve large cooling benefits by focusing on this aspect alone, as the range of improvement related to InR distribution seems limited. Combining greater surface area with a desirable InR distribution is rather straightforward, though, and occurs naturally on surfaces that have taller bumps with rounded peaks.
• Straight bumps are sufficient - our study indicates that neither tilt or bend plays a significant role in tile performance. Both higher Tilt Degrees and higher Bend Degrees were correlated with improved performance. However, as with peaks, we attribute this to the increase in surface area associated with these changes. When surface area was controlled, the tilt and bend of the bumps showed minimal influence on thermal performance. This finding suggests that straight bumps are sufficient for achieving the desired thermal performance and that complex tilting or bending may not be necessary.
• Bumps of approximately uniform size and shape are sufficient - another key finding of our study is that bumps of approximately uniform size and shape are sufficient to achieve effective thermal performance. We found no advantage from the activation of the Number Skew or Height Skew genes [see Figure 3]. This suggests that the complexity of bump size and shape variations may not necessarily translate into significant improvements in thermal performance. Similarly-shaped bumps, without the need for skewing or irregularities, can be utilized effectively in the design of tiles.
These generalized evolutionary principles provide architects and designers with a valuable framework for the creation of tiles optimized for thermal performance. By integrating textured surfaces guided by these principles, designers can develop practical and energy-efficient solutions for building facades. Additionally, the emphasis on simplicity in bump size and shape (as prompted by the minimal impact of bump tilt and bend) streamlines the design process and facilitates the implementation of these principles in real-world architectural projects.
Our study significantly advances the understanding of how surface geometry, particularly the assembly and depth of texture, influences thermal performance in building facades. By blending nature-inspired design principles with computational methods, we have demonstrated the potential to create energy-efficient and eco-friendly architectural solutions. These findings contribute notably to sustainable building practices and the field of biomimetic architectural design.
While our study is innovative, avenues for future research exist. Given our reliance on simulation data, incorporating real-world testing and considering factors like cost and ease of manufacture is essential for validating and extending our findings. Future investigations could explore natural convection on surfaces, optimization of the crevice/capillary network, and assess different materials in relation to water adhesion, cleaning, and potential biological growth. Moreover, accommodating biodiversity within textured facade panels is worth exploring.
In summary, our study lays a foundation for future research, encouraging a transition from simulations to real-world applications. Addressing these areas can propel the evolution of biomimetic architectural design, ensuring innovative solutions align with sustainability, efficiency, and practicality in the built environment.
The original contributions presented in the study are included in the article/Supplementary Material, further inquiries can be directed to the corresponding author.
NH: Conceptualization, Data curation, Formal Analysis, Investigation, Methodology, Software, Validation, Visualization, Writing–original draft, Writing–review and editing, Resources. LB: Conceptualization, Methodology, Supervision, Writing–original draft, Writing–review and editing, Resources. AJ: Conceptualization, Funding acquisition, Methodology, Supervision, Writing–original draft, Writing–review and editing, Project administration, Resources.
The author(s) declare financial support was received for the research, authorship, and/or publication of this article. This work was funded by bioSEA Pte. Ltd., nuLUCA co., and University of the West of England, and the Good Design Research initiative by the DesignSingapore Council (Reference: DSGSP-2021-004).
We thank Bu Jing Yi, Celine Tan, Christian Delacruz, Eugene Soh, Hortense Le Ferrand, Kuo Wei Chiu, Munshi Mukhtar Toh, Petra Gruber, and Zheng Kai for their helpful comments and feedback. Thank you to Alex Grishin and Phoenix Analysis and Design Technologies, Inc. for the guidance in Ansys simulations.
Authors NH and AJ were employed by bioSEA Pte. Ltd. Author NH was employed by nuLUCA Co.
The remaining author declares that the research was conducted in the absence of any commercial or financial relationships that could be construed as a potential conflict of interest.
All claims expressed in this article are solely those of the authors and do not necessarily represent those of their affiliated organizations, or those of the publisher, the editors and the reviewers. Any product that may be evaluated in this article, or claim that may be made by its manufacturer, is not guaranteed or endorsed by the publisher.
The Supplementary Material for this article can be found online at: https://www.frontiersin.org/articles/10.3389/fbuil.2024.1309621/full#supplementary-material
ANSYS (2022). Ansys® mechanical enterprise, 2022 R1. Canonsburg, PA: ANSYS, Inc. Available at: https://www.ansys.com/.
Arumugam, G., Abidin, S. N. Z., Kusumo, C. M. L., and Jain, A. (2023). Teaching nature and architecture: student-led account of biomimicry innovations in the tropics. Biomimetics 8, 13. doi:10.3390/biomimetics8010013
Bäck, T., and Schwefel, H. P. (1993). An overview of evolutionary algorithms for parameter optimization. Evol. Comput. 1 (1), 1–23. doi:10.1162/evco.1993.1.1.1
Badarnah, L. (2017). Form follows environment: biomimetic approaches to building envelope design for environmental adaptation. Buildings 7 (2), 40. doi:10.3390/buildings7020040
Badarnah, L., and Kadri, U. (2015). A methodology for the generation of biomimetic design concepts. Archit. Sci. Rev. 58, 120–133. doi:10.1080/00038628.2014.922458
Caetano, I., Santos, L., and Leitão, A. (2020). Computational design in architecture: defining parametric, generative, and algorithmic design. Front. Archit. Res. 9, 287–300. doi:10.1016/j.foar.2019.12.008
Chayaamor-Heil, N., Perricone, V., Gruber, P., and Guena, F. (2023). Bioinspired, biobased and living material designs: a review of recent research in architecture and construction. Bioinspiration Biomimetics 18 (4), 041001. doi:10.1088/1748-3190/acd82e
Grobman, Y., and Elimelech, Y. (2015). Microclimate on building envelopes: testing geometry manipulations as an approach for increasing building envelopes’ thermal performance. Archit. Sci. Rev. 59 (4), 269–278. doi:10.1080/00038628.2015.1025688
IEA (2021). Breakout session 1: space cooling roadmap for southeast asia. IEA. Available from: https://iea.blob.core.windows.net/assets/c6341e88-492c-42b5-9437-f76aab6a3aa8/BreakoutSession1Cooling6April2021.pdf (Accessed October 31, 2022).
IEA (2022). Space cooling. Paris: IEA. License: CC BY 4.0 Available at: https://www.iea.org/reports/space-cooling.
Jain, A., and Swaminathan, S. (2023). Biomimicry for tropical building skins. A design toolkit to manage thermal comfort using nature’s genius. Singapore: bioSEA Pte. Ltd. ISBN: 978-981-18-7102-3.
Kuru, A., Oldfield, P., Bonser, S., and Fiorito, F. (2019). Biomimetic adaptive building skins: energy and environmental regulation in buildings. Energy Build. 205, 109544. doi:10.1016/j.enbuild.2019.109544
Ladybug Tools (2021). Ladybug tools 1.3.0. Available at: https://www.food4rhino.com/en/app/ladybug-tools.
Ladybug Tools (2024). Ladybug EPW map. Available at: https://www.ladybug.tools/epwmap/.
Lau, C., Kalantari, B., Batts, K. P., Ferrell, L. D., Nyberg, S. L., Graham, R. P., et al. (2021). The Voronoi theory of the normal liver lobular architecture and its applicability in hepatic zonation. Sci. Rep. 11 (1), 9343. doi:10.1038/s41598-021-88699-2
Lillywhite, H. B., and Stein, B. R. (1987). Surface sculpturing and water retention of elephant skin. J. Zoology 211, 727–734. doi:10.1111/j.1469-7998.1987.tb04483.x
Martins, A. F., Bennett, N. C., Clavel, S., Groenewald, H., Hensman, S., Hoby, S., et al. (2018). Locally-curved geometry generates bending cracks in the African elephant skin. Nat. Commun. 9 (1), 3865–3868. doi:10.1038/s41467-018-06257-3
Mole, M. A., Rodrigues Dáraujo, S., Van Aarde, R. J., Mitchell, D., and Fuller, A. (2016). Coping with heat: behavioural and physiological responses of savanna elephants in their natural habitat. Conserv. Physiol. 4 (1), cow044. doi:10.1093/conphys/cow044
Mostapha, R. S., and Pak, M. (2013). “Ladybug: a parametric environmental plugin for Grasshopper to help designers create an environmentally-conscious design,” in Proceedings of the 13th International IBPSA Conference, Lyon, France, August 25–30, 2013.
Okabe, A., Boots, B., Sugihara, K., and Chiu, S. N. (2000). Spatial tessellations: concepts and applications of Voronoi diagrams, with a foreword by DG Kendall. Wiley Series in Probability and Statistics, 696.
Peeks, M., and Badarnah, L. (2021). Textured building façades: utilizing morphological adaptations found in nature for evaporative cooling. Biomimetics 6 (2), 24. doi:10.3390/biomimetics6020024
Robert McNeel and Associates (2020). Rhinoceros (version 7) [computer software]. Seattle, Washington: Robert McNeel and Associates. Available at: https://www.rhino3d.com/.
Showkatbakhsh, M., and Makki, M. (2018). Wallacei. Available at: https://www.wallacei.com/.
Sommese, F., Badarnah, L., and Ausiello, G. (2022). A critical review of biomimetic building envelopes: towards a bio-adaptive model from nature to architecture. Renew. Sustain. Energy Rev. 169 1364–0321. 112850. doi:10.1016/j.rser.2022.112850
Talebi, H. R., Kayan, B. A., Asadi, I., and Hassan, Z. F. B. A. (2020). Investigation of thermal properties of normal weight concrete for different strength classes. J. Environ. Treat. Tech. 8 (3), 908–914.
Thompson, D. W. (1992). “Life sciences, physiology and biological physics, cell biology and developmental biology, general,” in On growth and form (canto). Editor J. Bonner (Cambridge, England: Cambridge University Press). doi:10.1017/CBO9781107325852
Voronoï, G. (1908a). Nouvelles applications des paramètres continus à la théorie des formes quadratiques. Premier mémoire. Sur quelques propriétés des formes quadratiques positives parfaites. J. für die Reine und Angewandte Math. 133, 97–102. doi:10.1515/crll.1908.133.97
Voronoï, G. (1908b). Nouvelles applications des paramètres continus à la théorie des formes quadratiques. Deuxième mémoire. Recherches sur les parallélloèdres primitifs. J. für die Reine und Angewandte Math. 134, 198–287. doi:10.1515/crll.1908.134.198
Keywords: adaptation, biomimicry, nature inspired, thermal, design, algorithms, architecture, tropical climate
Citation: Hays N, Badarnah L and Jain A (2024) Biomimetic design of building facades: an evolutionary-based computational approach inspired by elephant skin for cooling in hot and humid climates. Front. Built Environ. 10:1309621. doi: 10.3389/fbuil.2024.1309621
Received: 08 October 2023; Accepted: 31 January 2024;
Published: 26 February 2024.
Edited by:
Dafni Mora, Technological University of Panama, PanamaReviewed by:
Lucio Blandini, University of Stuttgart, GermanyCopyright © 2024 Hays, Badarnah and Jain. This is an open-access article distributed under the terms of the Creative Commons Attribution License (CC BY). The use, distribution or reproduction in other forums is permitted, provided the original author(s) and the copyright owner(s) are credited and that the original publication in this journal is cited, in accordance with accepted academic practice. No use, distribution or reproduction is permitted which does not comply with these terms.
*Correspondence: Lidia Badarnah, bGlkaWEuYmFkYXJuYWhAdXdlLmFjLnVr
Disclaimer: All claims expressed in this article are solely those of the authors and do not necessarily represent those of their affiliated organizations, or those of the publisher, the editors and the reviewers. Any product that may be evaluated in this article or claim that may be made by its manufacturer is not guaranteed or endorsed by the publisher.
Research integrity at Frontiers
Learn more about the work of our research integrity team to safeguard the quality of each article we publish.