 Pedro Fernández-Valderrama
 Crismal Ureña-Estrella1
 David Bienvenido-Huertas
- 1Department of Graphical Expression and Building Engineering, University of Seville, Seville, Spain
- 2Department of Building Construction, University of Granada, Granada, Spain
The building sector is very dynamic and complex, so construction works are surrounded by uncertainties. The deficiencies of this sector are mainly related to poor project planning and management, resulting in losses because of missed deadlines, cost overruns, reworks, and unsatisfied clients. For a project to be successful, all the parties involved should work together to effectively manage the risks that could emerge in the project life cycle. This research defines and establishes a classification of the factors causing cost and time deviations in construction projects in the Dominican Republic. For this purpose, the most common factors are compiled, and their risk levels are determined by using the data obtained in a survey in which professionals from the building sector participated. The indexes marked by the participants show that the serious risk factors are design variations and the variations made by clients, a tight project schedule and the preparation of bid offers, deficiencies in the work planning and schedule, the lack of skilled labour, and work performance errors.
1 Introduction
The building sector, like many other sectors, is surrounded by uncertainty because of both long performance periods and the involvement of various participants, thus implying more negative risks. The success or failure of any project could be measured through the fulfilment of its goals, the impact on the interested parties and users’ satisfaction, among other dimensions. However, success is defined by delivering a quality project within the budget and schedule established.
Cost and time deviations in construction projects constitute a worldwide problem for the building sector. Many works are not finished as planned. Flyvbjerg et al. (2002) showed this aspect in their study on cost underestimation in 20 countries in 5 continents. Cost overruns take place in 9 out of every 10 major construction projects. In this regard, Cantarelli et al. (2012) stated that cost overruns are a global phenomenon, but the size varies according to the location. KPMG (2015) reported that only 31% of the projects analysed finished with deviations lower than 10% of the initial budget. The remaining 69% presented excesses between 10% and 50%, whereas only 25% of projects fulfilled the schedule established. Al-Nahhas et al. (2024) indicate that certain construction projects in highly developed countries reach cost overruns between 16% and 95%. In the case of infrastructure projects, the author states that in certain developing countries the cost overruns are between 70% and 200%. This causes taxpayers to have to pay higher expenses for services associated with these projects. For the author, it is essential to thoroughly assess and analyse risks, as well as implement risk management plans. For Chen et al. (2023), the risks that come from the complexity of infrastructure projects have caused budget overruns around the world, having a substantial impact on economies. Ammar et al. (2023) study project cost overruns and indicate that contingency reserves are usually implemented to address such risks and uncertainties, with risk management in this context being one of the most important jobs of planners. The problem also exists with respect to the compliance with temporary deadlines in projects, the problem also exists. Gurgun et al. (2024) indicates that completing projects on time is widely considered one of the greatest indicators of project success. In this regard, they argue that despite technological advances in the current era of digitalisation, in the construction sector there is still a poor result in compliance with schedules. For the authors, the reasons for this circumstance require investigation.
According to the Project Management Institute (2017), risk is any uncertain event that, if it happens, affects at least one project objective. Several factors could affect the fulfilment of goals, varying because of the sector, the geographic environment, and the project’s characteristics. Consequently, risks should be assessed in all works to guarantee success. In their study on risks in power plant projects, Islam, Nepal and Skitmore (2023) refer to the importance of studying the specific risks of a specific country or geographic environment. Risk management is the process of identifying, analysing, responding planning, response implementation, and monitoring project risks (Project Management Institute, 2017). Risk management is crucial to be considered as a discipline within project management to achieve success. It is aimed at both improving performance and contributing to the fulfilment of goals by reducing threats and by increasing opportunities.
Risk management has been required since ancient times, but the first research studies in the building sector emerged in the mid of the 20th century (Taroun, 2014). According to Flanagan and Norman (1993), risks have been managed in the building sector since the last two decades. Baloi and Price (2003) indicated that the risk management techniques based on statistical models are seldom used in practice by contractors. De Camprieu et al. (2007) also showed the lack of applying this type of models. Moreover, Taroun (2014) reviewed the techniques used to manage risks in recent decades and stated that there is a significant gap between the theory and the use in practice of these techniques. Thus, risk management is a useful tool that provides benefits and avoids problems; however, it should be more studied.
In this research, risks are events that can affect the cost and time objectives of the project. Within the risk management process, this research is aimed at developing the risk identification stage in construction projects in the Dominican Republic. According to the Banco Mundial (2020), the Dominican Republic’s economy is among the Latin America’s higher growth economies, with an annual average of 6.3% between 2014 and 2018. In 2019, the gross domestic product (GDP) increased by 5.1%, the highest in Latin America, corresponding 12% of the GDP to the building sector. Moreover, this sector has played a crucial role in the growth of the service sector in the country. This research is also aimed at determining the importance level of risk factors in relation to both the cost and time goal and its relationship with the interested parties, thus providing project managers with useful information to tackle with them.
To identify these risks, both the existing literature has been exhaustively reviewed and influential factors have been listed. The literature review was carried out using Scopus, Web of Science, and Google Scholar as main search engines. These risks have been assessed by various professionals of the sector through a survey based on two attributes: occurrence probability and impact. The data obtained were used to classify the serious risk factors, thus determining their influence on the following aspects: (i) cost and time goals, (ii) the stage in which risk factors take place, and (iii) the agents responsible for these risk factors.
2 Literature review
Cost and time deviations, together with their causes in projects, have been widely studied in various areas of the building sector, particularly since the 1980s. These studies are mainly based on questionnaire surveys targeting professionals of the sector.
In addition, there is a worldwide distribution of the territorial contexts where these studies were conducted. The territorial scale is sometimes very large. Flyvbjerg et al. (2002) studied the cost overruns of 258 projects in 5 continents, mainly focusing on Asia and Africa. On the other hand, there are more reduced scopes, such as that in Ahmed et al. (2003), which identified the main delay causes in the building sector when building constructions in Florida. Moreover Enshassi et al. (2009) studied the delay and cost overrun causes in the construction projects in the Gaza Strip.
There are many risk factors which vary according to both the characteristics of the project and the geographic scope analysed. However, there are also general risks, as Zou et al. (2007) showed by comparing factors between Australia and China. Table 1 includes the most stressed risk factors in literature and summarises the studies identifying them. These factors are also understood as sources of risk, that is, uncertain events that, if they occur, can affect the objectives of the projects.
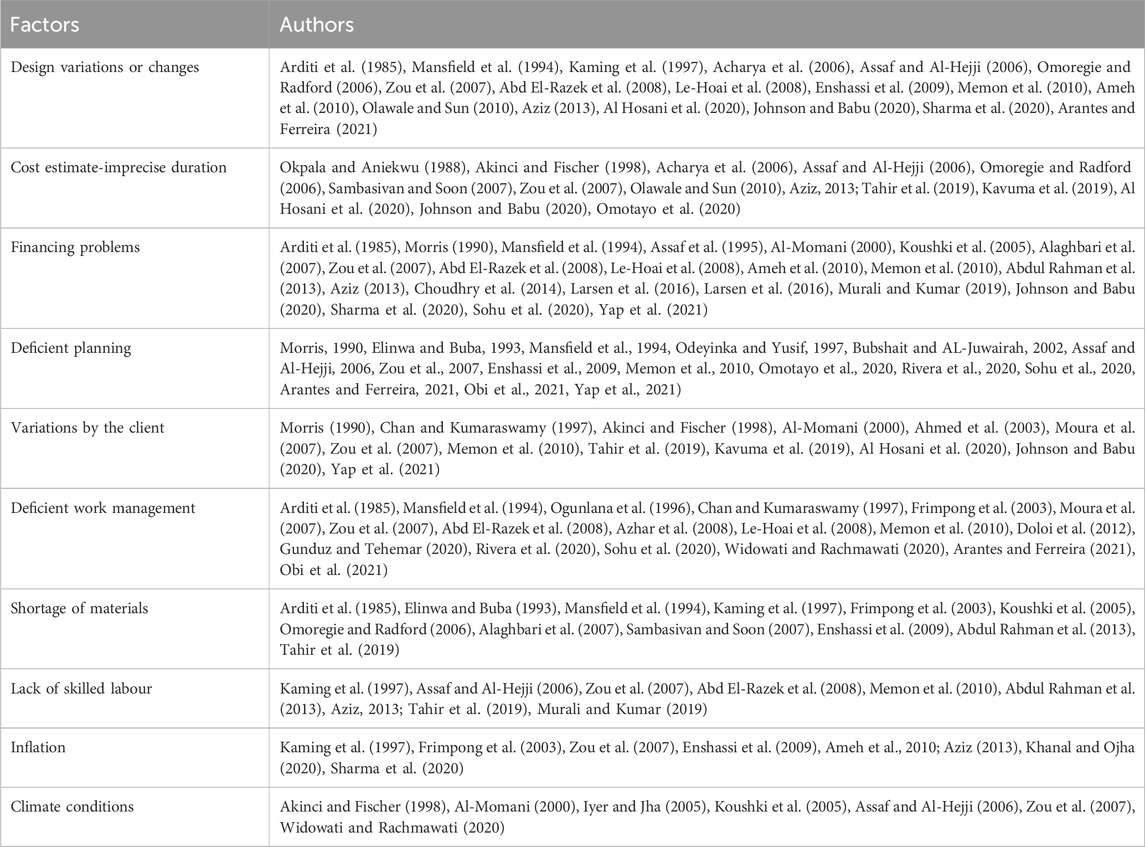
Table 1. Main risk factors influencing construction projects.
Cost and time risk factors are usually identified and analysed in large projects (high budget and complexity) belonging to both the public and civil engineering sector. Some of these studies only considered the risk on the cost goal (Akinci and Fischer, 1998) or on the time goal ((Ogunlana et al., 1996; Al-Momani, 2000)). Others, such as Kaming et al. (1997), Frimpong et al. (2003), Le-Hoai et al. (2008) and Al-Hazim et al. (2017)), studied the risks affecting both goals, prevailing the studies on cost factors. There were also other criteria according to the nature of the risk, its source or origin, or the project stage where the risk takes place.
Most research studies are qualitative and are based on the professionals’ experience and judgement. Surveys, questionnaires, and interviews are used as tools for data acquisition. In addition, various methods are used to analyse the consequences of the risk factors: (i) Assaf and Al-Hejji (2006) and Le-Hoai et al. (2008) used the frequency index, the severity index, and the importance index; (ii) Chan and Kumaraswamy (1997) and Frimpong et al. (2003) used the relative importance index (RII); (iii) Bubshait & AL-Juwairah (2002) used the severity index; and (iv) Zou et al. (2007) used the significance index.
Nevertheless, there are few studies focused on the risk management in Latin America, particularly on the factors of cost and time deviations in the construction projects of one of the economies with the best indexes in recent years: the Dominican Republic. Senior and Rodríguez (2012) analysed the barriers to improve productivity (the study was based on surveys targeting 134 professionals of the construction sector), and Martínez et al. (2016) conducted a work for the Technological Institute of Santo Domingo on the key factors required for the building construction of that city to be successful.
Knowing the factors that cause cost overruns increases the effectiveness of cost control, so continuous researching and the diversification of studies on this issue throughout time and in various geographic context are crucial. The reduction of cost and time increases is also among the main challenges to be overcome by the interested parties of a project.
In this work, a central research question is proposed: What are the specific risks that can negatively impact the cost and time of construction projects in the Dominican Republic? To answer it, we propose the objective of developing the stage of identification of those events that may affect the cost and deadline of construction projects in this geographical area. The project risk management process is usually made up of the stages of identification, analysis, monitoring, and control. In this way, it is intended to contribute, using these techniques, to improving project management. The methodology followed in the research is described below.
3 Methodology
3.1 Obtaining the preliminary list of risk factors
After analysing the references, a total of 135 risk factors affecting the time and cost goals in construction projects were initially obtained. As explained below, this set of factors was subjected to a first refinement process and subsequently to a pilot survey. After this process, the final list of factors was obtained, which was the subject of expert surveys.
Risk factors related to this research were taken from all references throughout the review process. Each time a factor was found that was considered to refer to the same concept or was even named in the same way, a point was added to the count. Some of these factors were similar, which is something usual when using various references; however, the goal in this first stage was based on identifying as many risk factors as possible. The risk factors with the highest points in the count were as follows: (i) project financing problems/lack of resources/method of financing/owner incapable of facing the economic load of the project, with 23 points; (ii) design variations, with 22 points; (iii) environmental/climate conditions, with 21 points; (iv) variations by the client/requests for changing project requirements or definitions, with 20 points; and (v) incomplete, imprecise or inappropriate cost estimate/incorrect estimate method, with 19 points. On the other hand, various factors obtained just one point in the count: (i) executive bureaucracy in owner organizations, (ii) slow exchange of documentation among participants, (iii) worker’s nationality, and (iv) schedule restriction to carry out activities.
The next stage consisted in improving the initial list with the 135 risk factors, which were analysed considering several aspects. Thus, certain factors related to similar concepts or those mentioned an unclear, ambiguous, or contradictory way were removed. In addition, those considered insignificant as they obtained just one point in the repetition count were also removed. After this second stage, the initial list went from 135 to 71 risk factors. In a third stage, a pilot survey was conducted, thus reducing again the list to 56 risk factors, which were then assessed by a panel of experts.
After analysing and improving the list, the risk factors were classified and organised in homogeneous groups. Several ways of classification were considered, such as that presented by Zou et al. (2007) related to the interested parties of the project. On the other hand, Assaf and Al-Hejji (2006) combined the interested parties with other risk sources, including design, external factors, materials or equipment. Finally, the criterion by Garcia Casares (2015) was adopted as it deals with the factor origin. Thus, a set of 71 units were previously established and again improved after a pilot survey. The factors were eventually grouped in several blocks: (i) design equipment, (ii) client, (iii) contractor, (iv) subcontractors and suppliers, (v) government, (vi) materials and equipment, (vii) contract, (viii) project administration or management, (ix) project’s own factors, and (x) external factors.
3.2 Risk modelling
The process of obtaining the final level of a risk, that is, risk modelling, is usually considered as a combination of the probability of its occurrence and its consequences (ISO, 2018). Taroun (2014) stated that the combination of probability with impact as the result of both prevails in research studies to model the risk.
For the experts’ assessments of the probability of the risk and its impact on the time and cost goals of the various factors, a scale similar to the Likert scale but with 6 levels was provided. The scale includes 6 values: 0.50 = almost null; 1 = very loo; 2 = low; 3 = moderate; 4 = high; and 5 = very high. Two questions were included in one section, independently of the assessments: one question was based on the factor that should be removed from the list, and another on the convenience of including any other factor that could imply delays and increase costs in a project. These two questions were open-ended questions. Another section included two questions aimed at knowing the state of the risk management process in the Dominican Republic. In this case, the information required was the frequency of using risk management in the projects in which the expert has participated, as well as the tools they knew or had used for the task.
To analyse the values obtained, the response options of the scale used were associated with numeric values. For this, the scale indicated by the Project Management Institute (Project Management Institute, 2017) was used as a starting point, where the probability value adopts a range between 0.10 and 0.90 and the impact range between 0.05 and 0.80. The ranges used in our research include the probability values of 0.05 and the impact value of 0.025, corresponding to the almost null value (0.5) of the assessment scale. Table 2 includes the values adopted.

Table 2. Equivalence of experts’ assessments scale with numerical scale of probability and impact.
After obtaining the probability and impact values, these values were combined to obtain the significance score of each risk (
Where
The next calculation was to obtain the average score for each risk (Eq. 2). This average score was called in Zou et al. (2007) as “risk significance index score”. It was used to classify all risks, both for the cost and time goal.
Where
To obtain severity levels of the risks expressed at a qualitative level based on the risk significance indexes calculated, the matrix from Figure 1 was used. This matrix is based on that indicated by the Project Management Institute (2017), being adapted to the 6 possible probability and impact values. The matrix was divided into 4 zones according to their significance index for the cost and time goals of the project. Values could achieve four risk levels: “Very low,” “Low,” “Medium,” and “High.”
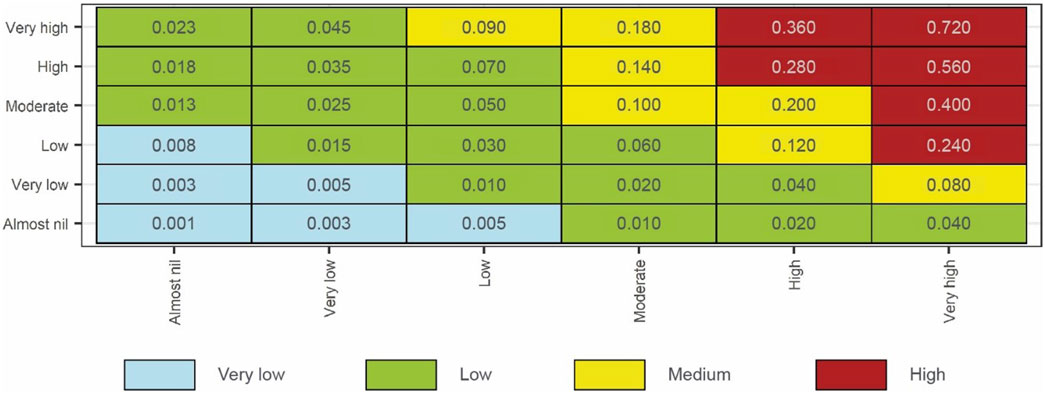
Figure 1. Risk severity matrix.
3.3 Pilot survey and improvement of the list of risk factors
Surveys were addressed to a panel of experts. A pilot test was previously conducted to include in the activity the adjustments required before sending it to the participants. The survey was expedited using on Google Forms and was divided into 4 blocks and 14 sections, as Table 3 shows. The survey was configured to a response by each respondent through a compulsory login but remaining anonymous. All questions were defined in the questionnaire as compulsory to remove the error of no answer.

Table 3. Structure of the survey.
Block 1 is composed of 6 questions aimed at obtaining information on the respondent’s professional profile. These questions are closed questions, with several response options. Block 2 shows the list containing the 71 risk factors previously identified in both the literature review and the first improved stage. Factors were grouped in 10 classification categories, each focused on a section. For each risk factor, the experts assessed 3 variables: (i) occurrence probability of the factor; (ii) impact on the cost goal of the project if the factor takes place; and (iii) impact on the time goal of the project if the factor takes place.
A total of 10 professionals were selected for the pilot surveys, but 7 of them took part in it. The university degree is engineering for 6 of the participants and one architect. The professional profile of engineers is that of project manager, construction supervisor, and contractor, and on the part of the architect that of designer. Each respondent was individually discussed with their general opinion on the survey and on the risk factors that seemed confusing and difficult to understand. Participants in this pilot test were surveyed on the refined list of 71 risk factors with the value scales and methodology described above. After having the data from the assessment in the pilot test, the factors were organised according to the values obtained in the significance index for the time and cost goals. Semi-structured interviews are then held with the participants in the pilot survey. The objective of these interviews was to obtain complementary information useful for the final design of the survey. Thus, added difficulties when developing the activity or factors which were confused or difficult to understand were detected. Data cleaning was also carried out, the factors with the lowest score were analysed to determine if they should be removed from the list and the reasons, so the factors with the lowest score were removed, as well as those considered doubled because of their similarity with others. After these adjustments, the list was reduced to the 56 factors indicated in Table 4, which were included in the definite survey.
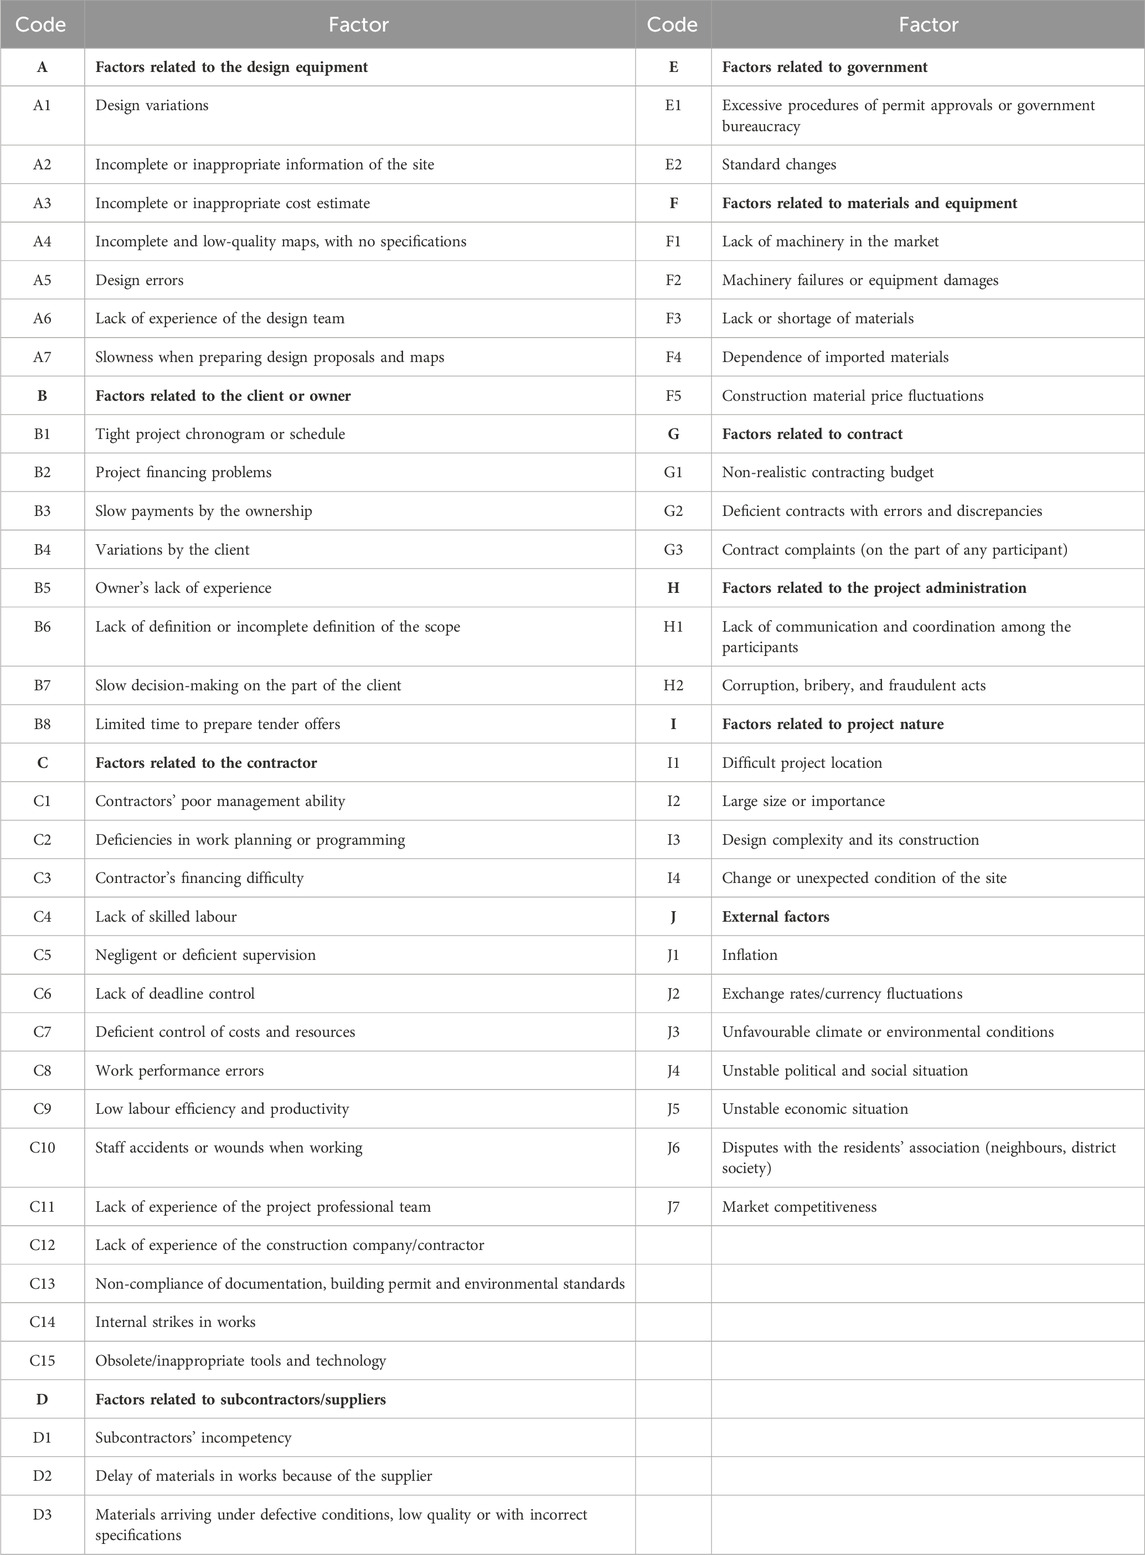
Table 4. Significance index for time and cost goals.
3.4 Surveys for the panel of experts
In this stage of the research, surveys are carried out with the group of experts. To identify the panel of participants, intentional sampling was carried out. The panel of experts was formed through professional colleagues from the research group in the Dominican Republic. These colleagues, in turn, provided other new professionals who met the established requirements to be part of the group of respondents. One of the requirements was to have a qualified professional profile related to the construction sector, engineers and/or architects, or other related subjects. The second requirement was to have a minimum of 5 years of work experience in the public or private construction sector in the Dominican Republic. In total, 86 professionals were identified to whom the survey was sent electronically. The survey is created and distributed using Google Forms. 47 responses were received to the form, of which 6 were eliminated because they presented the same answer to all the questions. The remaining 41 surveys represent a response rate of 47%, which is considered acceptable according to Zou et al. (2007). The professional profile of the respondents, obtained from the first block of the survey, is shown in Table 5.
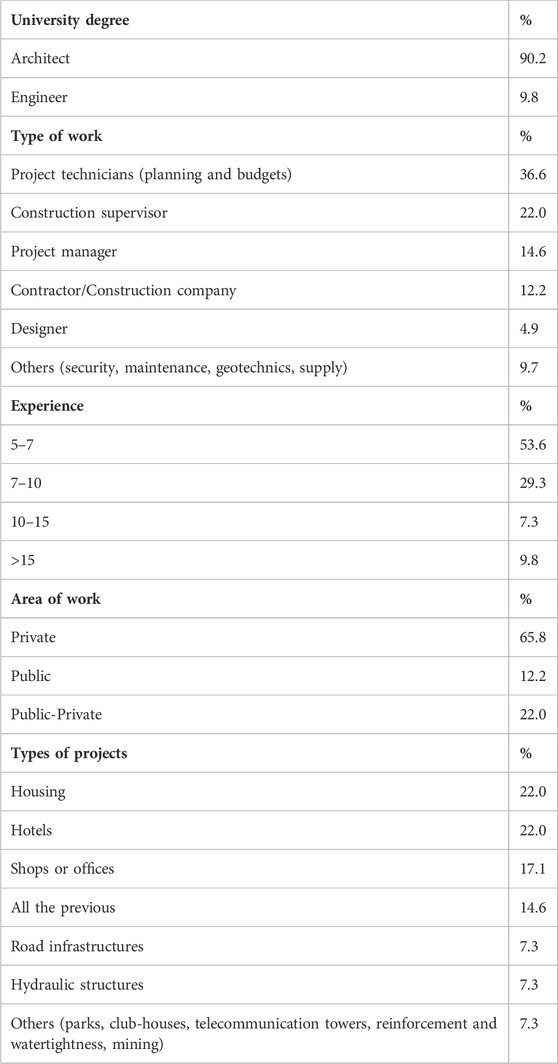
Table 5. Respondents’ professional profile.
4 Results and interpretation
4.1 Risk level of the factors
Data from surveys were collected and analysed. The aim was to identify the serious factors for both goals and to determine tendencies, similarities, and variations in the results. In the second block of the survey, the participants assessed the probability and occurrence, as well as the impact on the 56 factors. These factors were classified in the 10 groups previously mentioned. After obtaining the values, probability and impact were combined. The significance of each risk was obtained by applying Eq. 1, and the significance index that indicates the severity level of each risk was obtained with Eq. 2. Figure 2 shows the value distribution of the significance index for each factor, both for the cost and time goal.
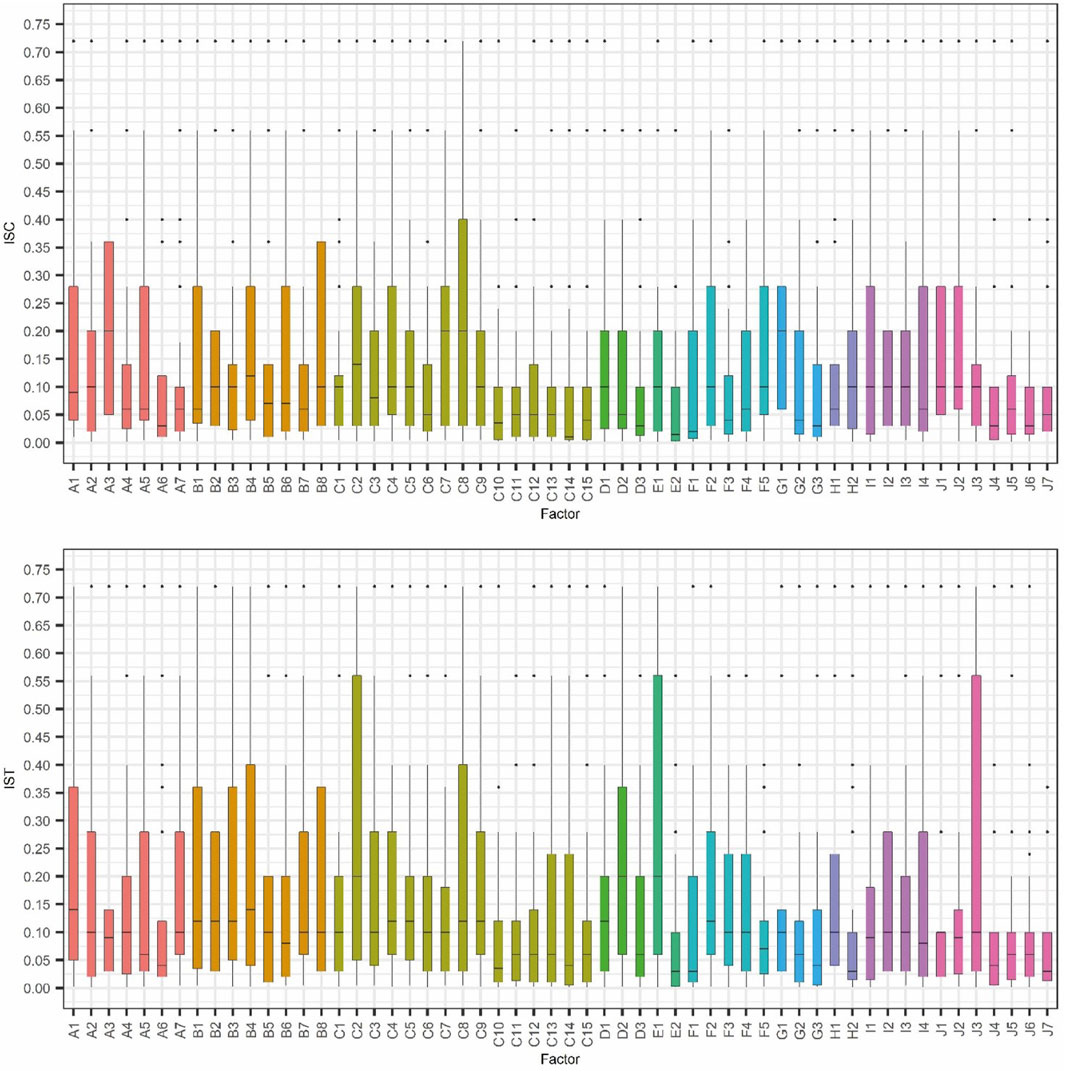
Figure 2. Box plots with the values of the significance indexes for the cost (ISC) and time goal (IST).
Figure 2 shows the factors with the greatest significance index. In general, the indexes with the greatest values (between 0.20 and 0.30) and repeated in both goals constituted the serious risk factors: (i) A1-Design variations; (ii) B4-Variations by the client; (iii) B1-Tight project chronogram or schedule; (iv) B8-Limited time to prepare tender offers; (v) C2-Deficiencies in work planning or programming; (vi) C4-Lack of skilled labour; and (vii) C8-Work performance errors.
Afterwards, the severity matrix of the risk (Figure 1) was used as it turned the numerical significance index values into a scale of severity level of the risk qualitatively expressed. Thus, most serious factors reached a “High” risk level, i.e., numerical significance index values between 0.20 and 0.30 were reached. In this regard, Table 6 shows the risk levels achieved by the 56 factors.
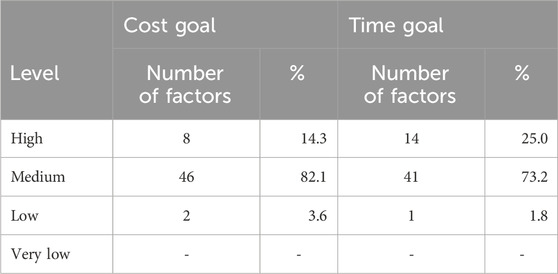
Table 6. Risk level of the factors.
The results showed more factors with a “High” level for the time goal. The risk perceived was therefore greater for the time goal than for the cost goal. Figure 3 shows this aspect, including a radar graph for each group of risk factors. The graphs represent the significance indexes in relation to the cost (ISC) and time (IST) of the various factors, constituting a greater graphic surface of risks for the time goal. In addition, serious factors, i.e., those achieving significance index values between 0.20 and 0.30, were repeated both for the time and goal (A1, B1, B4, B8, C2, C4, and C8). On the other hand, there was no factor at the “Very low” risk level in any of the goals. Thus, all the risks included in the list should be consider in the construction projects. Figure 3 also shows that the risk sources concentrating more serious risks were group C (contractor) and B (client), with greater graphic surfaces of risks than the other groups.
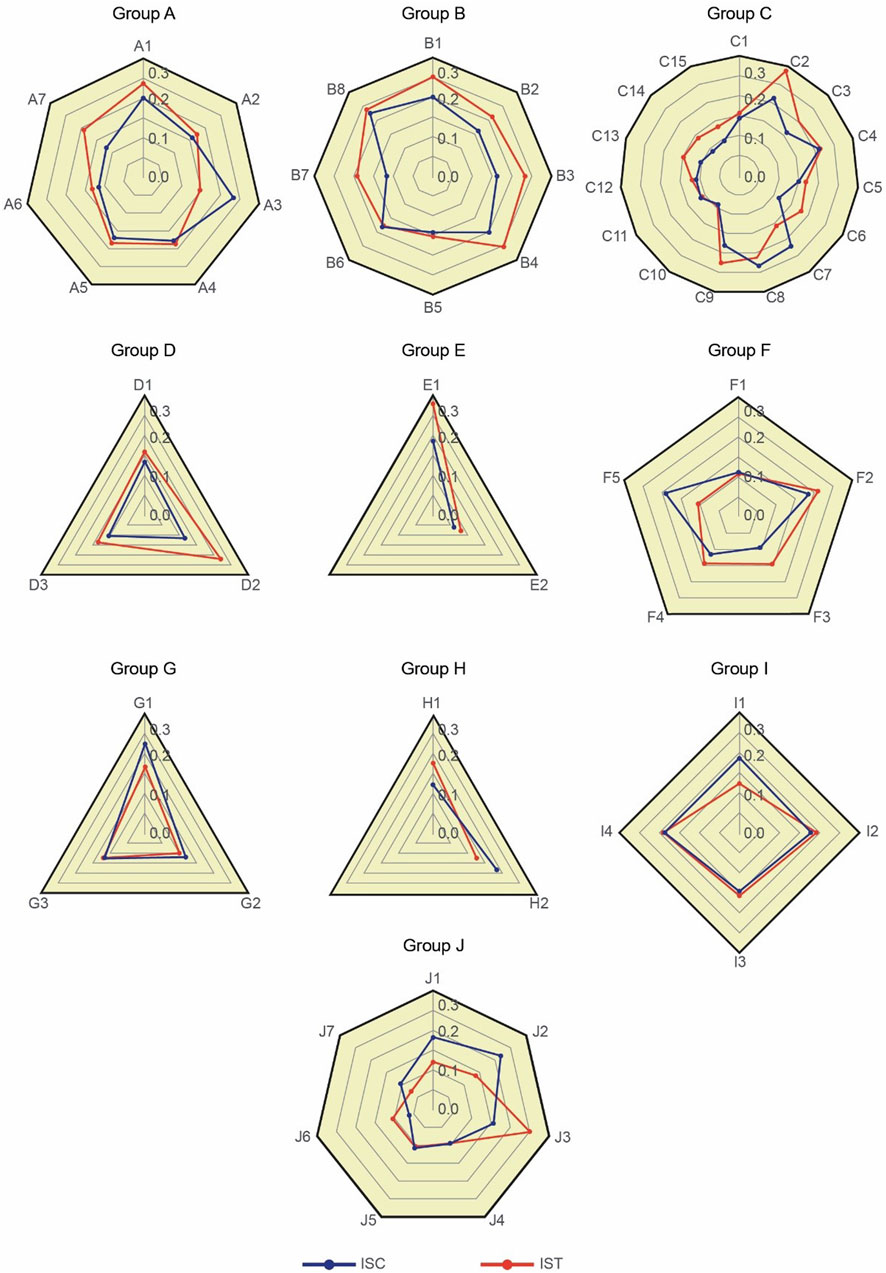
Figure 3. Comparison of the risk significance indexes according to the risk factors groups indicated in Table 4.
4.2 Relationship among the factors and assessment by respondents
The Pearson correlation coefficient was used to measure the relationship level among the risk factors, independently of the group to which they belonged. In addition, Seaborn, a statistical tool, was used to calculate the coefficients among the factors for both goals. The results are graphically shown in Figure 4, 5 with matrix heatmaps. The most intense red colours represent the most correlated factors, with values close to 1. The less correlated factors, with values close to 0, are represented with darker blue colours.
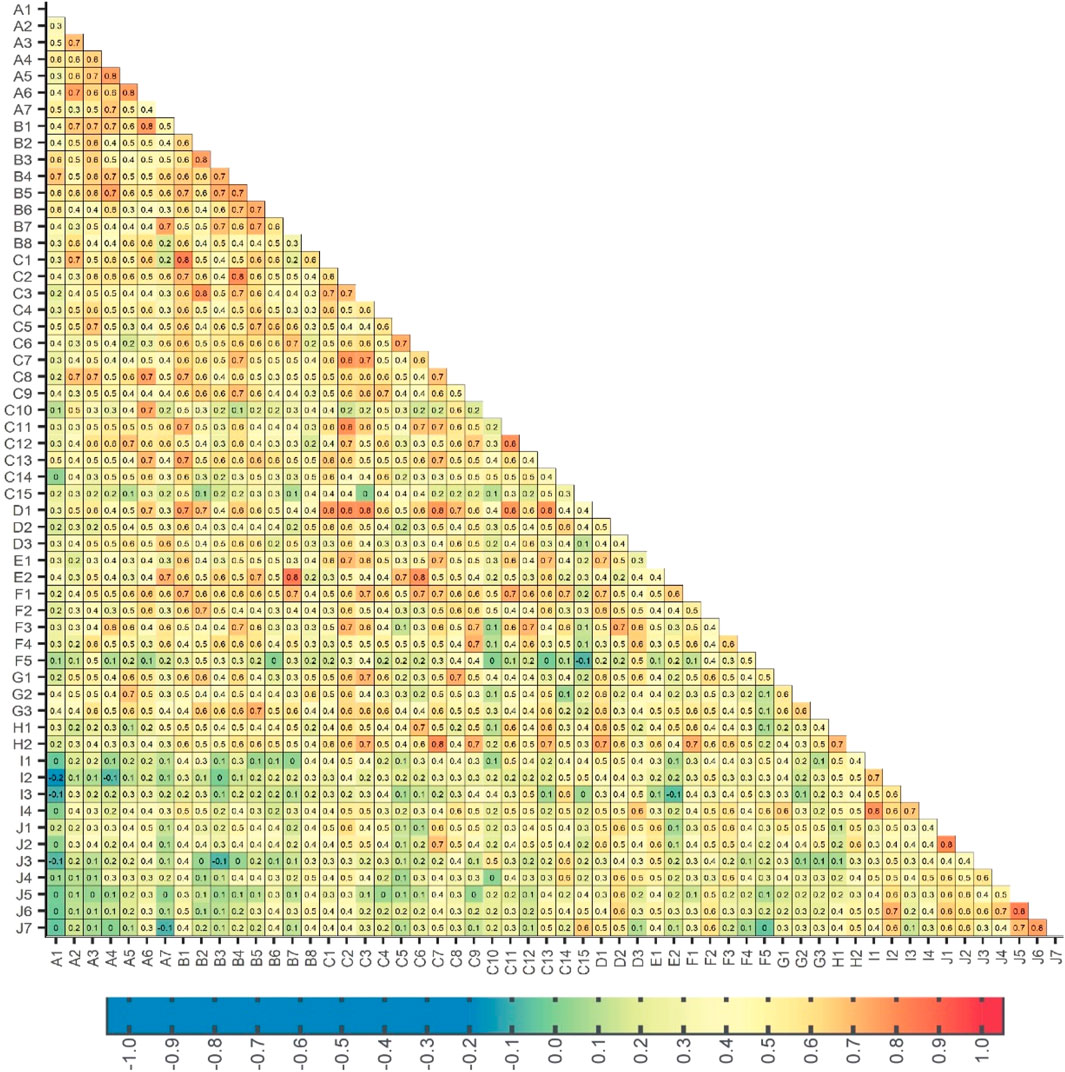
Figure 4. Correlation matrix among the risk factors according to the cost significance index.
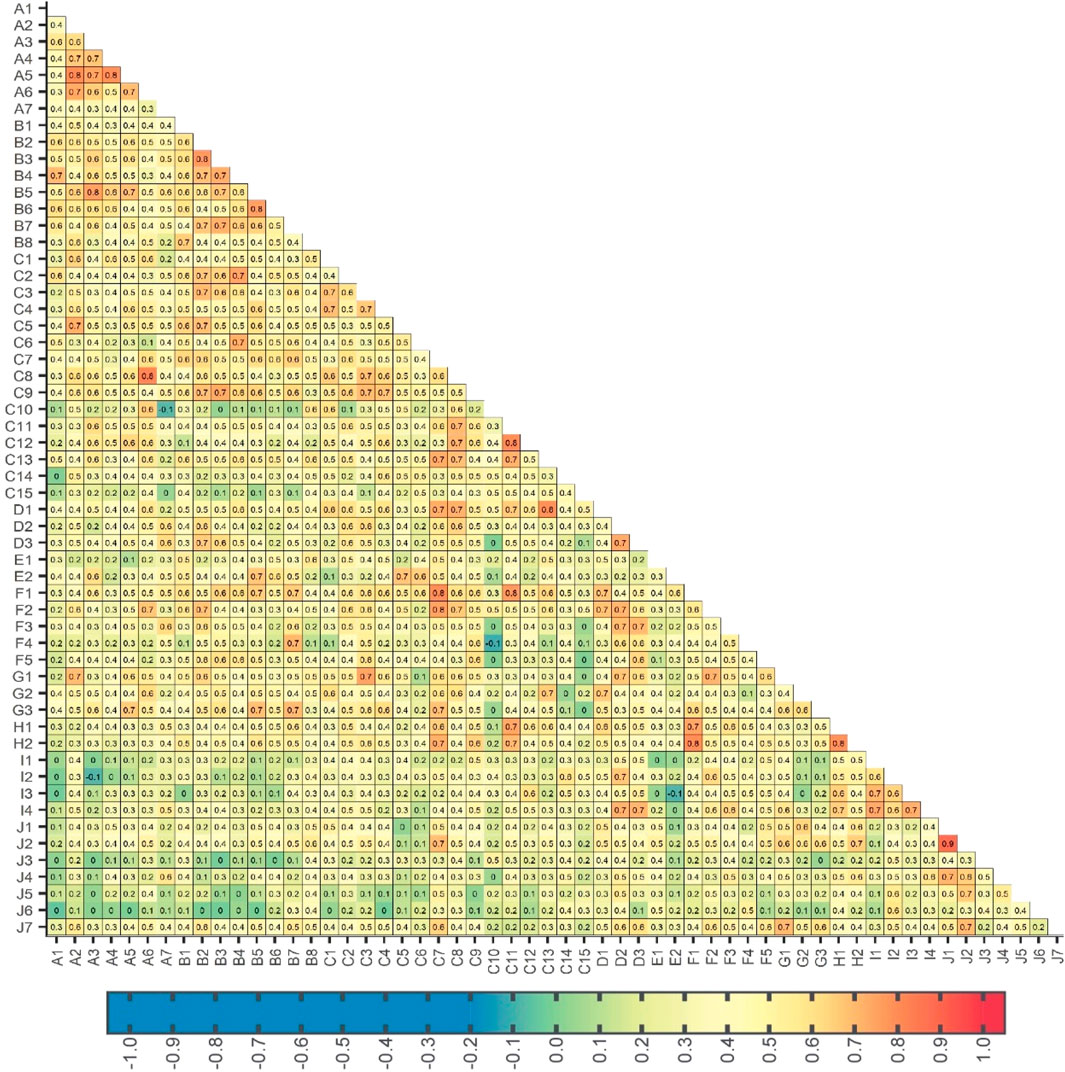
Figure 5. Correlation matrix among the risk factors according to the time significance index.
The factors with a stronger correlation for both time (J1-J2 and A6-C8) and cost goals (B1-C1, B7-E2, and J5-J6) are shown in Table 7, reaching correlation values between 0.81 and 0.88. To see Figure 4, 5 clearly, the number indicating the correlation values is represented with a decimal as in these Figures there are more factors with a coefficient of 0.8 than those indicated in Table 7.
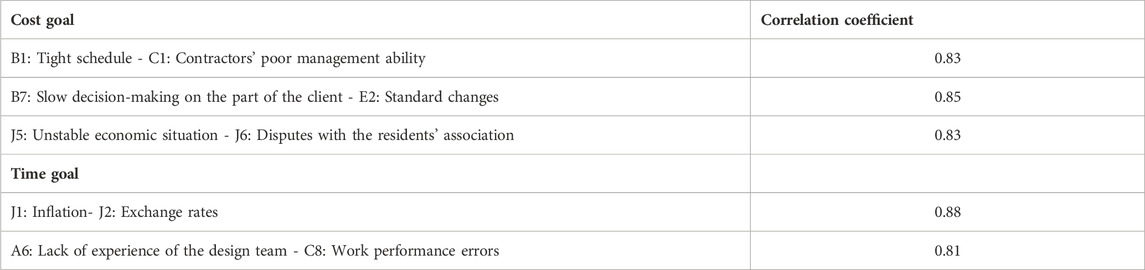
Table 7. Risk factors with a stronger correlation.
The similarities among the respondents’ opinions were also analysed with the Pearson correlation coefficient. For the cost goal, the greatest similarities took place between the group of contractors/subcontractors and supervisors, with a strong correlation (0.64). The group project managers and supervisors showed a moderate relationship (0.42). The remaining relationships among groups was weak: designers and supervisors (0.35), contractors/subcontractors and designers (0.32), contractors/subcontractors and project managers (0.29), and project managers and designers (0.27). For the time goal, there was a strong correlation between contractors/subcontractors and supervisors (0.648), as well as a weak correlation between contractors/subcontractors and designers (0.3775). The remaining relationships among groups was moderate: project managers and supervisors (0.45), designers and supervisors (0.42), contractors/subcontractors and project managers (0.41), and project managers and designers (0.40).
4.3 Risk sources and life cycle of the project
This stage analysed the relationships between the risk sources (10 groups of factors, Table 4) and the life cycle of the project in which the risk is materialised. Three life cycles were established, containing most risks: a conceptual and study phase related to the project viability, a design phase, and a construction phase. For the analysis, the factors were classified in tables with double entry: risk source and life cycle phase. Table 8 corresponds to the cost goal, and Table 9 to the time goal. The severest risk factors, i.e., the factors with the greatest significance indexes (values between 0.20 and 0.30), were considered. These factors were 13 for the cost goal, and 14 for the time goal. Both tables show in bold the 7 serious risk factors previously identified, which are the severest taking place in both goals. For each risk source, the various factors were classified in each of the three life cycle phases in which they took place. For the cost goal, the construction phase included 54% of the factors, the design phase included 38%, and the viability phase included 8%. For the time goal, 64% of the risks were in the construction phase, 22% in the design phase, and 14% in the viability phase. For both goals, 57% of the serious factors took place in the construction phase, and the remaining 43% in the design phase. Therefore, the stage with the greatest risk was the construction phase, which included the severest and most serious factors, with the contractor and the client being the most responsible for them.
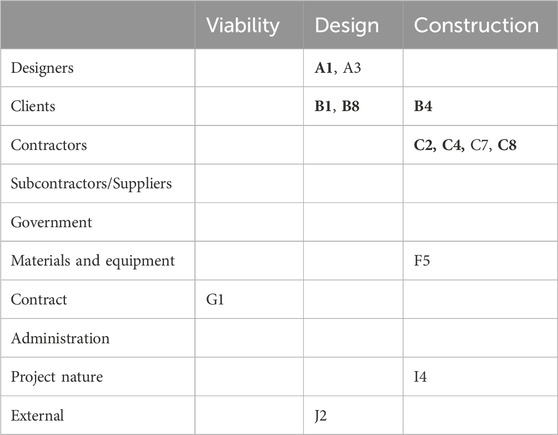
Table 8. The severest risk factors (cost goal) according to both the project phases and the interested parties.
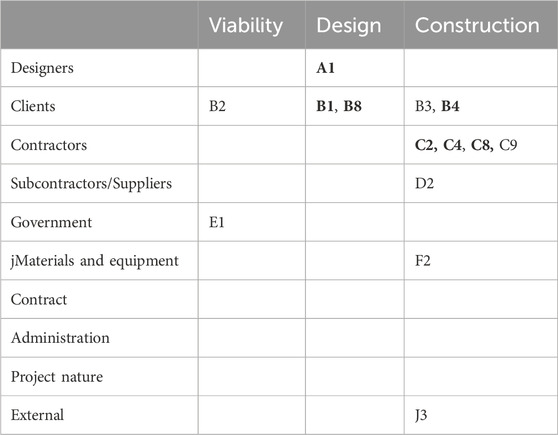
Table 9. The severest risk factors (time goal) according to both the project phases and the interested parties.
4.4 Factors that could be removed and possible new factors
In the third block, information was obtained about the possibility of not considering certain risk factors included in the list. A total of 79.5% of the respondents considered that no risk factor should be removed. The remaining 19.5% (8 participants) considered the following risk factors to be removed: (i) those related to the client (1 participant), (ii) Difficult project location (2 participants); (iii) environmental factors (1 participant); (iv) corruption, bribery, and fraudulent acts (1 participant); (v) market competitiveness (2 participants), and (vi) great size of the project (1 participant).
In this block, participants were also asked about the other possible factors which could be included in the analysis. There were 15 positive responses; however, some corresponded to general concepts such as allocation, internal works in the place or the lack of task delegation. Others corresponded to factors already considered in the list, such as climate or deficiencies in the planning. Finally, 3 possible new factors were indicated: (i) participants’ wage conditions, (ii) health factors, such as the COVID-19 pandemic, and (iii) government changes.
4.5 Application of risk management in the Dominican Republic
This issue was developed in the fourth block of the survey through two questions. The first question was: “How often risk management has taken place in the projects in which you have been involved?.” The results showed that 17.1% “never” used it, 36.6% “hardly,” 26.8% “sometimes,” and 19.5% “almost always.” To verify this information, the tools or techniques known or used to manage risks were also asked. From the respondents who answered “sometimes,” 36% did not know any tool, whereas 64% knew some tool. From the respondents who answered “almost always,” 25% did not know any tool, whereas 75% knew some tool. The tools and techniques mentioned by the participants and related to this research were as follows: (i) risk matrix, (ii) risk indicators, (iii) the ISO 31000 standard, (iv) the model analysis of failures and effects, (v) @Risk, (vi) Montecarlo, (vii) past experience analysis, (viii) Moday.com, and (ix) flow graph of processes and questionnaires.
Ferreira (2015) analysed the frequency of using the risk record in the public projects in the Dominican Republic. In their survey, 50% of participants answered that they had “never” used this tool, 20% “sometimes,” 3% “almost always”, and anyone answered “always.” By comparing these results with the results obtained in our survey, it is seen that the use of risk management in the country has increased. However, risk assessment should be more studied, focusing on security, labour, and quality management risks.
5 Conclusion
This research is focused on cost and time deviations in projects, which are among the main problems of the building sector. Given their importance, risks should be assessed in all projects, and risk management is a key tool. These techniques are very beneficial; however, the results confirmed that they are scarcely used in the Dominican Republic: only 19.5% of the respondents usually use risk management tools and methodologies. Unfortunately, culture on identifying and assessing risks in the country is poor. On the other hand, the collected information indicate that most risks managed are financing risks or those related to labour security.
The indexes marked by the participants show the serious risk factors: the factors related to the design variations and the variations by the client, tight project schedule and offer preparation, the deficiencies in the performance of construction works and their programming, and the lack of skilled labour. These results are similar to the key factors mentioned by various studies. The study by Zou et al. (2007) was conducted in China and also added financing problems. Regardless of the similarities in the serious factors, all factors included in the list present a significant interest. Most of them reach high and moderate severity levels, according to the participants. For the cost goal, 14.3% represents the high level, and 82.1% the moderate level, whereas for the time goal, the percentages are 25% and 73.3%, respectively. In addition, there is a greater perception of the risk for the time goal than for the cost goal. In addition, the factors with a low level did not achieve 4% in any of the two cases. Identifying all these risk factors contributes to creating links with the improvement of results in construction projects in the Dominican Republic. Evaluations of experts participating in the research coexist with the problems of construction projects in the country, as this is their field of work. Therefore, this compilation of lessons learnt must contribute especially to the development of one of the processes in project management: the management of the knowledge generated during the development of the project. Specifically, for the collection, recording, and dissemination of these lessons learnt. They are expected to be put into practice in the construction sector in the country.
The Pearson correlation coefficient determined a strong-moderate correlation for both goals in around 52% of the factors. The factors with a strong correlation are as follows: (i) slow decision-making on the part of the client - standard changes, (ii) tight project schedule - contractors’ poor management ability, (iii) unstable economic situation - disputes with the residents’ association, and (iv) inflation - exchange rates.
Regarding the risk sources, around 70% of the serious factors are caused by the contractor, the client, and designers in both goals. These results could be expected, as they are the stakeholders that have the greatest capacity to intervene in the development of the project. However, despite what is expected, it is necessary to confirm these assumptions scientifically for the geographical context analysed, the Dominican Republic. Not in vain, this country has been one of the economies in Latin America where the greatest growth has been experienced recently. We must take into account that each geographical context has its specific risks and these are the ones that have been identified in the research. In the same sense, the results of the work show that, for the cost objective, the contractor is the greatest source of risk with 30.8% of the most critical factors and for the time objective the client with 35.7%. On the other hand, the most susceptible phase to the risks in the life cycle of the project is the construction phase. Most of the risks identified take place in this phase, as well as most of those considered serious.
The assessments of the professional profiles are assessed, and it is determined that the respondents disagree on the risk level of the various factors. The reason could be the diversity of work area in which participants are involved. Osipova and Eriksson (2013) points out that the use of expert assessments within this risk management process implies different perceptions, since each group of actors may have their own vision of the importance of the risks. The Pearson correlation coefficient is also used for this analysis. The results indicate the greatest consensus on the severity of the risk factors in both goals, between contractors/subcontractors and supervisors, whose correlation is strong. The greatest disagreement, in this case for the cost goal, is between project managers and designers. Thus, it can be deduced that those working in a construction work have a similar perception of the risk, differing from those working in offices.
Finally, we must indicate that this work has been based on the evaluations of a selection of professionals with experience and knowledge of the construction sector in the Dominican Republic. However, these conclusions must be reported with some caution due to the possibility that the assessments of these experts may not represent the general opinions of the country. Regardless of this issue, this research shows that methodologies and plans should be established to identify and assess risks, so that the interested parties of the project could know the risks and face them appropriately to achieve their goals. It also aims to foster their use and to remove the gap between the theory and the practice of risk management in the building sector. This work continues the research line on the identification and analysis of risk factors in various territorial contexts. Further studies could be focused on other territories, particularly in the Dominican Republic, to verify the expected increase in using risk management techniques in construction projects.
Data availability statement
The original contributions presented in the study are included in the article/Supplementary Material, further inquiries can be directed to the corresponding author.
Author contributions
PF-V: Writing–review and editing, Writing–original draft, Methodology, Investigation, Formal Analysis, Conceptualization. CU-E: Writing–review and editing, Methodology, Investigation, Formal Analysis, Data curation, Conceptualization. JM: Writing–review and editing, Validation. DB-H: Writing–review and editing, Validation.
Funding
The author(s) declare that no financial support was received for the research, authorship, and/or publication of this article.
Conflict of interest
The authors declare that the research was conducted in the absence of any commercial or financial relationships that could be construed as a potential conflict of interest.
Publisher’s note
All claims expressed in this article are solely those of the authors and do not necessarily represent those of their affiliated organizations, or those of the publisher, the editors and the reviewers. Any product that may be evaluated in this article, or claim that may be made by its manufacturer, is not guaranteed or endorsed by the publisher.
References
Abd El-Razek, M. E., Bassioni, H. A., and Mobarak, A. M. (2008). Causes of delay in building construction projects in Egypt. J. Constr. Eng. Manag. 134 (11), 831–841. doi:10.1061/(ASCE)0733-9364(2008)134:11(831)
Abdul Rahman, I., Memon, A. H., and Abdul Karim, A. T. (2013). Significant factors causing cost overruns in large construction projects in Malaysia. J. Appl. Sci. 13 (2), 286–293. doi:10.3923/jas.2013.286.293
Acharya, N. K., Im, H.-M., and Lee, Y.-D. (2006). Investigating delay factors in construction industry: a Korean perspective. Korean J. Constr. Eng. Manag. 7 (5), 177–190.
Ahmed, S. M., S. Azhar, S., Kappagntula, P., and Gollapudil, D. (2003). “Delays in construction: a brief study of the Florida construction industry,” in Proceedings of the 39th annual ASC conference (Clemson, SC: Clemson University), 66.
Akinci, B., and Fischer, M. (1998). Factors affecting contractors’ risk of cost overburden. J. Manag. Eng. 14 (1), 67–76. doi:10.1061/(ASCE)0742-597X(1998)14:1(67)
Alaghbari, W., Kadir, M. R. A., Salim, A., and Ernawati, (2007). The significant factors causing delay of building construction projects in Malaysia. Eng. Constr. Archit. Manag. 14 (2), 192–206. doi:10.1108/09699980710731308
Al-Hazim, N., Salem, Z. A., and Ahmad, H. (2017). Delay and cost overrun in infrastructure projects in Jordan. Procedia Eng. 182, 18–24. doi:10.1016/j.proeng.2017.03.105
Al Hosani, I. I. A., Dweiri, F. T., and Ojiako, U. (2020). A study of cost overruns in complex multi-stakeholder road projects in the United Arab Emirates. Int. J. Syst. Assur. Eng. Manag. 11 (6), 1250–1259. doi:10.1007/s13198-020-00979-8
Al-Momani, A. H. (2000). Construction delay: a quantitative analysis. Int. J. Proj. Manag. 18 (1), 51–59. doi:10.1016/S0263-7863(98)00060-X
Al-Nahhas, Y. S., Hadidi, L. A., Islam, M. S., Skitmore, M., and Abunada, Z. (2024). Modified Mamdani-fuzzy inference system for predicting the cost overrun of construction projects. Appl. Soft Comput. 151, 111152. doi:10.1016/j.asoc.2023.111152
Ameh, O. J., Soyingbe, A. A., and Odusami, K. T. (2010). Significant factors causing cost overruns in telecommunication projects in Nigeria. J. Constr. Dev. Ctries. 15 (2), 49–67. Available at: https://ir.unilag.edu.ng/ handle/123456789/8924 (Accessed January 27, 2021).
Ammar, T., Abdel-Monem, M., and El-Dash, K. (2023). Appropriate budget contingency determination for construction projects: state-of-the-art. Alexandria Eng. J. 78, 88–103. doi:10.1016/j.aej.2023.07.035
Arantes, A., and Ferreira, L. M. D. F. (2021). A methodology for the development of delay mitigation measures in construction projects. Prod. Plan. Control 32 (3), 228–241. doi:10.1080/09537287.2020.1725169
Arditi, D., Akan, G. T., and Gurdamar, S. (1985). Reasons for delays in public projects in Turkey. Constr. Manag. Econ. 3 (2), 171–181. doi:10.1080/01446198500000013
Assaf, S. A., and Al-Hejji, S. (2006). Causes of delay in large construction projects. Int. J. Proj. Manag. 24 (4), 349–357. doi:10.1016/j.ijproman.2005.11.010
Assaf, S. A., Al-Khalil, M., and Al-Hazmi, M. (1995). Causes of delay in large building construction projects. J. Manag. Eng. 11 (2), 45–50. doi:10.1061/(ASCE)0742-597X(1995)11:2(45)
Azhar, N., Farooqui, R. U., and Ahmed, S. M. (2008). “Cost overrun factors in construction industry of Pakistan,” in First international conference on construction in developing countries (iccidc–I), advancing and integrating construction education, research & practice, 499–508.
Aziz, R. F. (2013). Factors causing cost variation for constructing wastewater projects in Egypt. Alexandria Eng. J. 52 (1), 51–66. doi:10.1016/j.aej.2012.11.004
Baloi, D., and Price, A. D. F. (2003). Modelling global risk factors affecting construction cost performance. Int. J. Proj. Manag. 21 (4), 261–269. doi:10.1016/S0263-7863(02)00017-0
Banco Mundial (2020). República Dominicana: panorama general. Available at: https://www.bancomundial.org/es/country/dominicanrepublic/overview (Accessed August 12, 2020).
Bubshait, A. A., and Al-Juwairah, Y. A. (2002). Factors contributing to construction costs in Saudi Arabia. Cost. Eng. 44 (5), 30.
Cantarelli, C. C., Flyvbjerg, B., and Buhl, S. L. (2012). Geographical variation in project cost performance: The Netherlands versus worldwide. J. Transp. Geogr. 24, 324–331. doi:10.1016/j.jtrangeo.2012.03.014
Chan, D. W. M., and Kumaraswamy, M. M. (1997). A comparative study of causes of time overruns in Hong Kong construction projects. Int. J. Proj. Manag. 15 (1), 55–63. doi:10.1016/S0263-7863(96)00039-7
Chen, Y., Ahiaga-Dagbui, D. D., Thaheem, M. J., and Shrestha, A. (2023). Toward a deeper understanding of optimism bias and transport project cost overrun. Proj. Manag. J. 54 (5), 561–578. doi:10.1177/87569728231180268
Choudhry, R. M., Aslam, M. A., Hinze, J. W., and Arain, F. M. (2014). Cost and schedule risk analysis of bridge construction in Pakistan: establishing risk guidelines. J. Constr. Eng. Manag. 140 (7), 4014020. doi:10.1061/(ASCE)CO.1943-7862.0000857
de Camprieu, R., Desbiens, J., and Feixue, Y. (2007). “Cultural” differences in project risk perception: an empirical comparison of China and Canada. Int. J. Proj. Manag. 25 (7), 683–693. doi:10.1016/j.ijproman.2007.07.005
Doloi, H., Sawhney, A., Iyer, K., and Rentala, S. (2012). Analysing factors affecting delays in Indian construction projects. Int. J. Proj. Manag. 30 (4), 479–489. doi:10.1016/J.IJPROMAN.2011.10.004
Elinwa, A. U., and Buba, S. A. (1993). Construction cost factors in Nigeria. J. Constr. Eng. Manag. 119 (4), 698–713. doi:10.1061/(ASCE)0733-9364(1993)119:4(698)
Enshassi, A., Al-Najjar, J., and Kumaraswamy, M. (2009). Delays and cost overruns in the construction projects in the Gaza Strip. J. Financial Manag. Prop. Constr. 14 (2), 126–151. doi:10.1108/13664380910977592
Ferreira, M. (2015). Estudio de la de proyectos Y de obras públicas de la república dominicana. Barcelona: Universitat Politècnica de Catalunya. Available at: https://upcommons.upc.edu/handle/2117/76701 (Accessed March 4, 2021).
Flanagan, R., and Norman, G. (1993). Risk management and construction. Oxford: First. Blackwell Science.
Flyvbjerg, B., Holm, M. S., and Buhl, S. (2002). Underestimating costs in public works projects: error or lie? J. Am. Plan. Assoc. 68 (3), 279–295. doi:10.1080/01944360208976273
Frimpong, Y., Oluwoye, J., and Crawford, L. (2003). Causes of delay and cost overruns in construction of groundwater projects in a developing countries; Ghana as a case study. Int. J. Proj. Manag. 21 (5), 321–326. doi:10.1016/S0263-7863(02)00055-8
Garcia Casares, R. (2015). Factores de riesgo que inciden negativamente en los cumplimientos de tiempo y coste programados en la ejecución de proyectos de edificios de uso hotelero en España’. Madrid: Universidad Politécnica de Madrid.
Gunduz, M., and Tehemar, S. R. (2020). Assessment of delay factors in construction of sport facilities through multi criteria decision making. Prod. Plan. Control 31 (15), 1291–1302. doi:10.1080/09537287.2019.1704903
Gurgun, A. P., Koc, K., and Kunkcu, H. (2024). Exploring the adoption of technology against delays in construction projects. Eng. Constr. Archit. Manag. 31 (3), 1222–1253. doi:10.1108/ECAM-06-2022-0566
Islam, M. S., Nepal, M., and Skitmore, M. (2023). Structuring risks for a comprehensive understanding of cost overruns in power plant projects. Constr. Innov. ahead-of-p(ahead-of-print). doi:10.1108/CI-05-2022-0120
ISO (2018). ISO 31000:2018 - risk management — guidelines’. Vernier, Switzerland: International Organization for Standardization, 16.
Iyer, K. C., and Jha, K. N. (2005). Factors affecting cost performance: evidence from Indian construction projects. Int. J. Proj. Manag. 23 (4), 283–295. doi:10.1016/j.ijproman.2004.10.003
Johnson, R. M., and Babu, R. I. I. (2020). Time and cost overruns in the UAE construction industry: a critical analysis. Int. J. Constr. Manag. 20 (5), 402–411. doi:10.1080/15623599.2018.1484864
Kaming, P. F., Olomolaiye, P. O., Holt, G. D., and Harris, F. C. (1997). Factors influencing construction time and cost overruns on high-rise projects in Indonesia. Constr. Manag. Econ. 15 (1), 83–94. doi:10.1080/014461997373132
Kavuma, A., Ock, J., and Jang, H. (2019). Factors influencing time and cost overruns on freeform construction projects. KSCE J. Civ. Eng. 23 (4), 1442–1450. doi:10.1007/s12205-019-0447-x
Khanal, B. P., and Ojha, S. K. (2020). Cause of time and cost overruns in the construction project in Nepal. Adv. Sci. Technol. Eng. Syst. J. 5 (4), 192–195. doi:10.25046/aj050423
Koushki, P. A., Al-Rashid, K., and Kartam, N. (2005). Delays and cost increases in the construction of private residential projects in Kuwait. Constr. Manag. Econ. 23 (3), 285–294. doi:10.1080/0144619042000326710
KPMG (2015). Maturity in preparation. Glob. Constr. Surv. 2015, 36. Available at: https://assets.kpmg/content/dam/kpmg/pdf/2015/04/global-construction-survey-2015.pdf.
Larsen, J. K., Shen, G. Q., Lindhard, S. M., and Brunoe, T. D. (2016). Factors affecting schedule delay, cost overrun, and quality level in public construction projects. J. Manag. Eng. 32 (1), 4015032. doi:10.1061/(ASCE)ME.1943-5479.0000391
Le-Hoai, L., Lee, Y. D., and Lee, J. Y. (2008). Delay and cost overruns in Vietnam large construction projects: a comparison with other selected countries. KSCE J. Civ. Eng. 12 (6), 367–377. doi:10.1007/s12205-008-0367-7
Mansfield, N., Ugwu, O., and Doran, T. (1994). Causes of delay and cost overruns in Nigerian construction projects. Int. J. Proj. Manag. 12 (4), 254–260. doi:10.1016/0263-7863(94)90050-7
Martínez, C., Morla, S., Peña, N., Rosario, R., Slaiman, C., Solis, H., et al. (2016). Estudio de los factores críticos para el éxito en la construcción de edificaciones en la ciudad de Santo Domingo, República Dominicana al año 2014. República Dominic. al año 2014’, Cienc. Soc. 41 (1), 113–151. doi:10.22206/cys.2016.v41i1.pp113-151
Memon, A. H., Rahman, I. A., Abdullah, M. R., and Azis, A. A. A. (2010). Factors affecting construction cost in Mara large construction project: perspective of project management consultant. Int. J. Sustain. Constr. Eng. Technol. 1 (2), 41–54.
Morris, S. (1990). Cost and time overruns in public sector projects. Econ. Political Wkly., M154–M168.
Moura, H. M. P., Teixeira, J. M. C., and Pires, B. (2007). Dealing with cost and time in the Portuguese construction industry.
Murali, S., and Kumar, S. (2019). Factors affecting overruns construction time and cost: a case study. Int. J. Recent Technol. Eng. 7 (6C2), 284–288.
Obi, L. I., Arif, M., Awuzie, B., Islam, R., Gupta, A. D., and Walton, R. (2021). Critical success factors for cost management in public-housing projects. Constr. Innov. 21, 625–647. doi:10.1108/CI-10-2020-0166
Odeyinka, H. A., and Yusif, A. (1997). The causes and effects of construction delays on completion cost of housing projects in Nigeria. J. Financial Manag. Prop. Constr. 2, 31–44.
Ogunlana, S. O., Promkuntong, K., and Jearkjirm, V. (1996). Construction delays in a fast-growing economy: comparing Thailand with other economies. Int. J. Proj. Manag. 14 (1), 37–45. doi:10.1016/0263-7863(95)00052-6
Okpala, D. C., and Aniekwu, A. N. (1988). Causes of high costs of construction in Nigeria. J. Constr. Eng. Manag. 114 (2), 233–244. doi:10.1061/(ASCE)0733-9364(1988)114:2(233)
Olawale, Y. A., and Sun, M. (2010). Cost and time control of construction projects: inhibiting factors and mitigating measures in practice. Constr. Manag. Econ. 28 (5), 509–526. doi:10.1080/01446191003674519
Omoregie, A., and Radford, D. (2006). Infrastructure delays and cost escalation: causes and effects in Nigeria.
Omotayo, T., Awuzie, B., Egbelakin, T., Obi, L., and Ogunnusi, M. (2020). AHP-systems thinking analyses for kaizen costing implementation in the construction industry. Buildings 10 (12), 230. doi:10.3390/buildings10120230
Osipova, E., and Eriksson, P. E. (2013). Balancing control and flexibility in joint risk management: lessons learned from two construction projects. Int. J. Proj. Manag. 31 (3), 391–399. doi:10.1016/j.ijproman.2012.09.007
Project Management Institute (2017). A guide to the project management body of knowledge (PMBOK guide). Pennsylvania: Project Management Institute.
Rivera, L., Baguec, H., and Yeom, C. (2020). A study on causes of delay in road construction projects across 25 developing countries. Infrastructures 5 (10), 84. doi:10.3390/infrastructures5100084
Sambasivan, M., and Soon, Y. W. (2007). Causes and effects of delays in Malaysian construction industry. Int. J. Proj. Manag. 25 (5), 517–526. doi:10.1016/j.ijproman.2006.11.007
Senior, B. A., and Rodríguez, T. A. (2012). “Analyzing barriers to construction productivity improvement in the Dominican republic,” in Proc. 20th ann. Conf. Of the int’l. Group for lean construction, 18–20.
Sharma, V. K., Gupta, P. K., and Khitoliya, R. K. (2020). “Investigation of critical factors influencing cost overrun in highway construction projects,” in International conference on innovative technologies for clean and sustainable development (Springer), 327–336.
Sohu, S., Ansari, A. A., and Jhatial, A. A. (2020). Most common factors causing cost overrun with its mitigation measure for Pakistan construction industry. Int. J. Sustain. Constr. Eng. Technol. 11 (2), 256–261.
Tahir, M. M., Haron, N. A., Alias, A. H., and Diugwu, I. A. (2019). “Causes of delay and cost overrun in Malaysian construction industry,” in GCEC 2017: Proceedings of the 1st global civil engineering conference, Springer Singapore, 1, 47–57.
Taroun, A. (2014). Towards a better modelling and assessment of construction risk: insights from a literature review. Int. J. Proj. Manag. 32 (1), 101–115. doi:10.1016/j.ijproman.2013.03.004
Widowati, E. D., and Rachmawati, F. (2020). “Identifying factors affecting schedule and cost performance on building project,” in IOP conference series: materials science and engineering (Bristol, United Kingdom: IOP Publishing), 12022.
Yap, J. B. H., Goay, P. L., Woon, Y. B., and Skitmore, M. (2021). Revisiting critical delay factors for construction: analysing projects in Malaysia. Alexandria Eng. J. 60 (1), 1717–1729. doi:10.1016/j.aej.2020.11.021
Keywords: construction, cost, developing country, risk assessment, time
Citation: Fernández-Valderrama P, Ureña-Estrella C, Moyano J and Bienvenido-Huertas D (2024) Cost and time risk factors in construction projects in the Dominican Republic. Front. Built Environ. 10:1307572. doi: 10.3389/fbuil.2024.1307572
Received: 11 October 2023; Accepted: 13 June 2024;
Published: 16 July 2024.
Edited by:
Zhen Chen, University of Strathclyde, United KingdomReviewed by:
Fidelis A. Emuze, Central University of Technology, South AfricaHasim Altan, Prince Mohammad bin Fahd University, Saudi Arabia
Copyright © 2024 Fernández-Valderrama, Ureña-Estrella, Moyano and Bienvenido-Huertas. This is an open-access article distributed under the terms of the Creative Commons Attribution License (CC BY). The use, distribution or reproduction in other forums is permitted, provided the original author(s) and the copyright owner(s) are credited and that the original publication in this journal is cited, in accordance with accepted academic practice. No use, distribution or reproduction is permitted which does not comply with these terms.
*Correspondence: Pedro Fernández-Valderrama, cGZ2YWxkZUB1cy5lcw==