
94% of researchers rate our articles as excellent or good
Learn more about the work of our research integrity team to safeguard the quality of each article we publish.
Find out more
ORIGINAL RESEARCH article
Front. Built Environ., 20 February 2024
Sec. Sustainable Design and Construction
Volume 10 - 2024 | https://doi.org/10.3389/fbuil.2024.1280072
 Abd Al-Kader A. Al Sayed1*†
 Hebah Mohammad Al-jabali2
 Mohamed Fahmy1†
 Ghada N. Mohamed1†
 El-Said Abd-Allah Bayoumi3
 Tarek Ibrahim Selouma4
This study investigates recent incidents of slabs collapse in reinforced concrete T-beam constructions attributed to deficiencies in design detailing and execution. It employs numerical analyses using the finite element method in ANSYS software to model T-section beams, with validation against experimental tests. Subsequently, a parametric study is conducted to explore the behavior of T-section beams under various design and construction variables, including the spacing of secondary reinforcements in the slab, the diameter of secondary main reinforcements, and slab thickness. The numerical analysis results are found to align well with experimental findings. The parametric study highlights that the eccentricity of reinforcing bars in the secondary direction of the slab is more detrimental than in the main direction. Furthermore, using 10 mm diameter reinforcement in the slab, either in the main or secondary direction, enhances the slab’s resistance to applied loads. Additionally, the study reveals that increasing the stiffness of the slab contributes to an improved resistance of the beam.
When floor slabs and their supporting beams are poured together as a single unit, they exhibit deflection in response to external loads, in tandem with the beams. T-section beams, known for their straightforward construction and cost-effectiveness, have been widely employed in flooring systems and continue to be a practical and efficient construction method (Rossetto et al., 2017; Issa et al., 2019). In this system, the concrete slabs and beams collaborate to withstand external loads. To classify a beam as a T-section beam, it is essential to verify that there exists a robust connection between the slab and the drop beam. This connection between the slab and the beam should reliably resist both longitudinal and transverse flexural forces (Khalaf et al., 2014). Due to a rising number of floor collapse incidents, particularly in reinforced concrete T-beam construction, it is imperative to scrutinize the material quality, design deficiencies, and human errors prevalent in on-site construction practices. Common construction mistakes encompass issues such as improper placement of main and distribution reinforcement, reinforcement splicing in different areas, misalignment of reinforcement within slabs and beams, fluctuations in the water/cement ratio during concrete casting, variations in slab thickness, and discrepancies in concrete cover for different structural components (Hong and He, 2015; Huang et al., 2019).
In Egypt, the National Research Center for Housing and Building (HBNRC) (Elrakib and Arafa, 2012) conducted a statistical analysis to investigate the factors contributing to the deterioration of concrete structures over various time periods. The findings revealed that approximately 83% of the causes of building failures could be attributed to poor construction practices that began in the 1980s (Elrakib and Arafa, 2012). The HBNRC report identified cracks in concrete as a potential indicator of structural failure in reinforced concrete floor systems. These cracks in concrete structures can result from various factors and may manifest as either surface cracks or internal cracks. The presence of cracks can signify potential structural deterioration or more significant underlying issues. The significance of these cracks is influenced by the type of structure and the characteristics of the cracking itself (Bhashyam, 2002; Elrakib and Arafa, 2012; Peansupap and Ly, 2015; Wang and Cheng, 2020). Several buildings experience two distinct types of cracks in their monolithic floor slabs. The first type of crack emerges in the upper section of the floor slab, where it connects to the floor beam, while the second type of crack forms in the lower part of the floor beam at its midpoint. These cracks predominantly result from alterations in the positioning of the reinforcement within the floor slab. Such shifts in reinforcement placement lead to a reduction in the load-bearing capacity of the floor slab (Yagaanbuyant and Bayar, 2011; Ahmed et al., 1989).
Słowik (2019) conducted an experimental research project aimed at examining the failure behavior of reinforced concrete T-beams with different reinforcement ratios. The findings revealed that in heavily longitudinal reinforced concrete T-beams lacking transverse reinforcement, shear failure characterized by the formation of diagonal cracks becomes predominant. Also, The tested beam is well reinforced longitudinally and that the cracks are probably close to the support (Słowik, 2019). Conversely, in plain and lightly reinforced concrete T-beams, brittle failure occurs as a result of the development of flexural cracks. González and Ruiz conducted a study to examine how the presence of flanges affects the load-carrying capacity of reinforced concrete T-beams that lack web reinforcement (Ribas González and Fernández Ruiz, 2017). Their findings indicated that having a compression flange in T-beams improved their shear capacity when compared to beams with rectangular cross-sections of equivalent dimensions. In T-beams lacking shear reinforcements, a diagonal crack can initiate from the upper side of the flange, and this diagonal shear crack extends as an inclined crack within the flange towards the support. Al-Mahaidi et al. conducted an experimental study to explore the impact of flange dimensions on the shear strength of reinforced concrete T-beams under concentrated loads (Giaccio et al., 2002). The findings indicated that under the influence of a concentrated point load, T-beams could fail in one of two ways. The first is characterized by a beam shear mechanism, where a diagonal tension crack extends from the web and traverses through the flange. The second failure mode involves a punching shear mechanism, where the applied load punctures through the flange. Increasing the width of the flange in T-beams resulted in higher maximum applied loads before failure and an enhancement in overall deflection, signifying an increase in stiffness (Ciesielczyk et al., 2017; Pansuk and Sato, 2007).
An examination of how the width of the flange impacts the flexural performance of reinforced concrete T-beams reveals that an increase in flange width leads to a higher stiffness in the T-beam. The initial cracking load is also affected by the flange width, with a wider flange resulting in a higher cracking load. However, it is important to note that the crack pattern in T-beams with varying flange widths remains generally consistent (Harry, 2016; Bayoumi, 2022; Thamrin et al., 2016; Ciesielczyk et al., 2017). W. Pansuk and Y. Sato (Lafta and Ye, 2015) studied the shear capacity of reinforced concrete T-beams. Their findings indicated that an increase in flange width enhances shear capacity in T-section beams with shear reinforcement, exhibiting a nonlinear relationship. In contrast, for T-beams lacking shear reinforcement, the flange width has minimal impact on shear capacity. The presence of a concrete top flange significantly influences the shear behavior of reinforced concrete T-beams, while the effect of the flange area on shear strength is relatively less prominent.
Cogurcu (2015) and Peansupap and Ly (2015) investigated construction and design defects in residential buildings. They emphasized three primary factors contributing to the failure of structural components in residential buildings, which can be categorized as design errors, construction errors, and errors in occupancy and usage. Construction errors encompass issues such as substandard workmanship, the use of materials with insufficient strength, inadequate utilization of transverse reinforcement, deficiencies in interlocking length, and a lack of rigorous quality control. In this study, a numerical investigation was conducted to analyze how three crucial parameters affect the performance of T-section beams. The parameters examined included the impact of spacing between secondary reinforcements in the slab and the thickness of the slab itself. To achieve this, a parametric study was carried out using finite element analyses, which were validated through experiments conducted on tested T-beams. These beams were subjected to uniformly distributed loads applied to the edges of the T-beam slabs.
Evaluation of the Structural Performance of T-Section Beams with Construction Defects Utilizing Numerical Analysis holds significant importance for various reasons:
Structural Safety Enhancement: The study addresses the critical issue of structural safety by focusing on T-section beams, a commonly used structural element in construction. Evaluating their performance in the presence of construction defects can lead to improved safety standards in the industry.
Defect Identification and Mitigation: By utilizing numerical analysis, this research enables the identification and assessment of construction defects in T-section beams. Understanding the impact of defects and their consequences will allow for the development of effective mitigation strategies to reduce failures and accidents.
Cost Savings and Sustainability: Preventing structural failures due to construction defects can result in significant cost savings for construction projects. Furthermore, the research indirectly contributes to sustainability by reducing the need for extensive repairs or even demolitions due to structural issues.
Industry Best Practices: Findings from this research can inform industry best practices and guidelines for constructing T-section beams, which will be beneficial for architects, engineers, and construction professionals. This, in turn, contributes to the overall advancement of the construction industry.
Safety and Public Welfare: Ensuring the structural integrity of buildings and infrastructure is crucial for public safety. This research directly impacts the wellbeing of individuals by striving to minimize the risks associated with construction defects and potential structural failures.
Academic Advancement: The research adds to the body of knowledge in the field of structural engineering and numerical analysis. It provides a basis for further academic research and discussions, contributing to the ongoing advancement of structural engineering science.
Innovative Methodology: The use of numerical analysis as a tool for evaluating structural performance in the presence of defects showcases an innovative approach that can be applied to various other structural elements and materials.
Regulatory and Legal Implications: The research can have implications for building codes, regulations, and legal standards related to construction quality and safety, which are paramount in ensuring the protection of property and life.
In summary, the research on the evaluation of T-section beams with construction defects through numerical analysis is significant not only for the construction industry but also for public safety, sustainability, and the advancement of structural engineering knowledge. It addresses real-world concerns and has the potential to bring about positive changes in construction practices and standards. Also, Figure 1 shows a research methodology. Flowcharts provide a visual representation of the research process, making it easier for researchers and stakeholders to understand the step-by-step procedures involved in the study. This visual clarity helps in avoiding ambiguity and misinterpretation of the research methodology. Also, its assist in logically sequencing the various stages of the research, ensuring that each step is followed in a systematic and orderly manner. This is particularly crucial in numerical analysis where the sequence of calculations can impact the results.
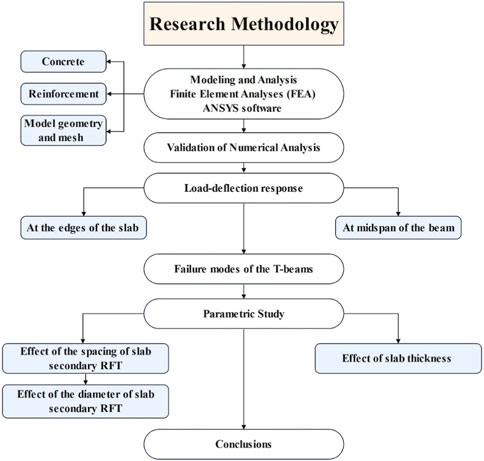
FIGURE 1. Research methodology flowchart.
In summary, the use of flowcharts is crucial for ensuring methodological rigor, clear communication, and effective management throughout the research process. Flowcharts contribute to the research’s reliability, transparency, and impact within the academic and engineering communities.
ANSYS software were performed to simulate the behavior of T-section beams subjected to different loading conditions as nonlinear finite element analyses (FEA) (Bhashyam, 2002; Abbas and Fadala, 2021; Wang and Cheng, 2020). The beams as three-dimensional deformable solid objects with non-linear material characteristics were presented. In the numerical analysis, all materials based on the available material modeling associated with the elements provided in the ANSYS software were idealized. This analysis employed two distinct elements to represent the concrete and steel reinforcement materials, as elaborated upon in the following sections.
In this research, concrete was simulated using a three-dimensional eight-node solid element. The SOLID65 element was employed for modeling the concrete, which allows for the consideration of cracking in three orthogonal directions, plastic deformation, and crushing. The element is characterized by eight nodes, each possessing three degrees of freedom for translation in the x, y, and z directions. To define the concrete material in ANSYS, it is essential to specify both the modulus of elasticity (Ec) and Poisson’s ratio (υ). In this investigation, a Poisson’s ratio of 0.2, a modulus of elasticity of 20,000 MPa, and a compressive strength of concrete of 30 MPa were assumed. The smeared modeling technique presumes that the reinforcement is evenly distributed within specific regions of the finite element mesh. This method is particularly well-suited for situations where the exact placement of reinforcement does not significantly impact the overall structural response, and where reinforcement elements are connected to the same nodes within the concrete mesh, resulting in shared nodes between both elements.
The reinforcement materials, including longitudinal bars and stirrups, were represented using link elements, each featuring one node at both ends. The LINK180 finite element type was employed for this purpose. The Link180 element is a uniaxial tension-compression element, and it offers three degrees of freedom at each node, allowing for translation in the nodal x, y, and z directions (Bhashyam, 2002; Wang and Cheng, 2020). The steel reinforcement was considered to exhibit an elastic-perfectly plastic behavior, characterized by a yield stress, an elastic modulus, and a Poisson’s ratio of 400 MPa, 200 GPa, and 0.3, respectively.
The T-section beams were represented as 3D solid models, matching the dimensions of the full-scale experimental test specimens. Figure 2 illustrates the finite element mesh setup for both the concrete and the reinforcing bars in the composite model. A mesh refinement analysis was performed to ascertain an appropriate mesh size for the models, aimed at reducing any potential influence of mesh size on the simulated behavior of T-beams.
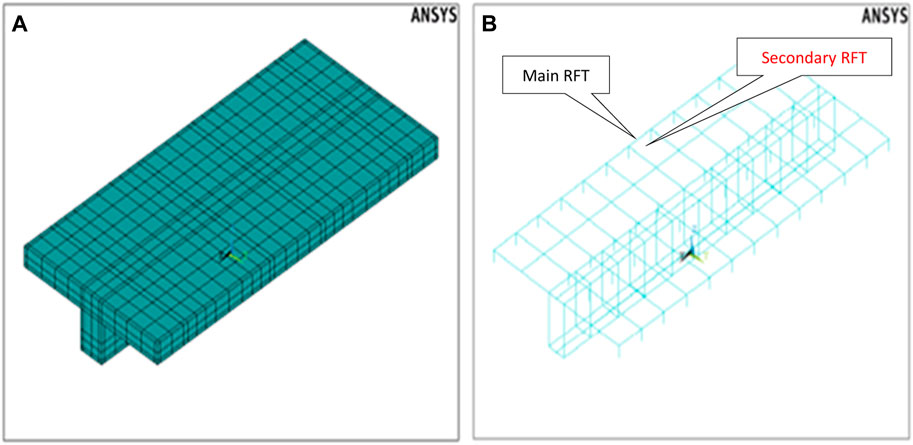
FIGURE 2. Numerical model: (A) Concrete part Finite Element (FE) mesh, and (B) Arrangement of steel reinforcements (RFT).
The results of the numerical analysis were validated with the experimental results reported in the literature (Bayoumi et al., 2019). Three T-section beams were chosen for validation, and their properties are detailed in Table 1. These test specimens were all comprised of a beam (web) and a slab (flange) cast together monolithically to form a T-shaped cross-section. Consequently, both the slab and the beam work in tandem to withstand the imposed loads. All the test specimens shared identical concrete dimensions, as depicted in Figure 3. Figure 3A shows the positions of the instrumentation on the beam according to specimen setup at lab showed in Figure 3B. The slab width is 950 mm, 100 mm in thickness, and a length of 2000 mm. Meanwhile, the projected beam width 150 mm, a drop depth of 200 mm, and a length of 2000 mm. The beams supported in a simple manner with a span length of 1,800 mm. Uniformly distributed linear loads were applied to the long edges of the slabs, as shown in Figure 2.
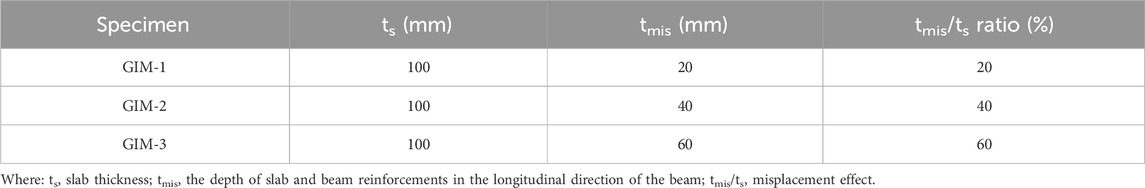
TABLE 1. Details of the numerically simulated T-section beams.
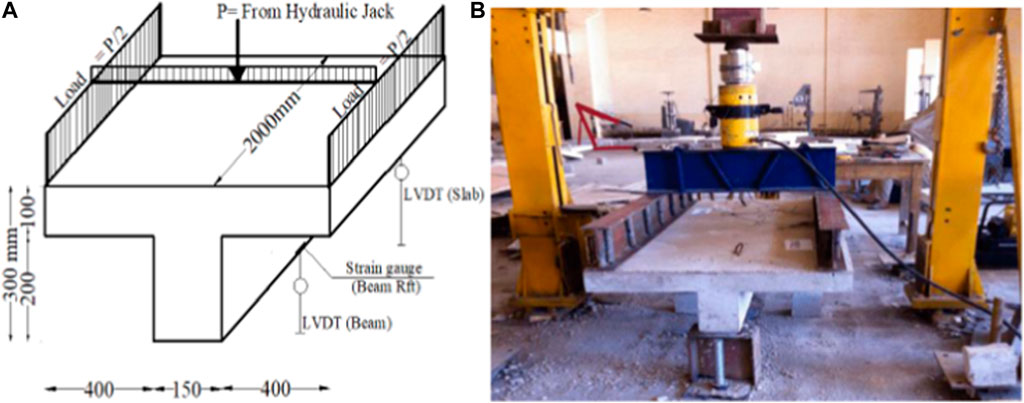
FIGURE 3. (A) Dimensions and loading of the numerically validated test specimens, (B) Specimen setup at lab.
The authors previously examined these specimens in a prior experimental study (Bayoumi et al., 2019). To explore how the misplacement of slab reinforcements influences the behavior of T-beams, the authors conducted experiments. They quantified this misplacement effect using the ratio (tmis/ts), where tmis represents the depth of slab and beam reinforcements in the longitudinal direction of the beam and ts represents the slab thickness, as depicted in Figure 4. The ratio tmis/ts was altered at three levels: 20%, 40%, and 60% for the selected specimens. Specimen GΙM-1 served as the control specimen, and it was meticulously designed and constructed to adhere to the standard criteria, which included proper compaction using a mechanical vibrator, sufficient concrete cover, and orderly placement of reinforcements. The control specimen did not incorporate any splices in either the slab or beam reinforcement.
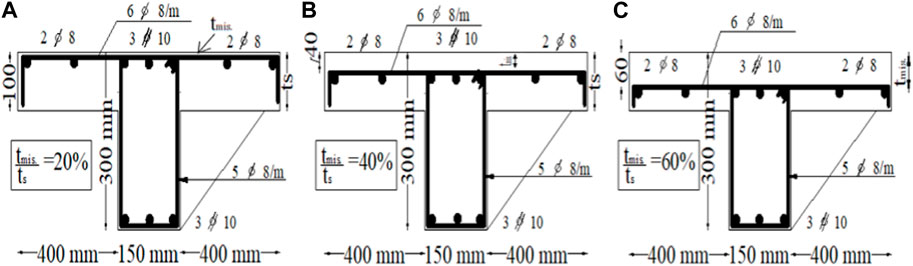
FIGURE 4. Cross-sectional details in (mm) of numerically validated T-beam specimens: (A) GIM-1 (control), (B) GIM-2, and (C) GIM-3.
The subsequent sections entail a comparison between the findings derived from the experimental tests and those obtained through finite element analysis (FEA). This comparison involves a scrutiny of the load-deflection curves, both at the slab’s edge and at the midspan of the beam. Additionally, the failure modes exhibited by each T-beam are illustrated and analyzed.
Figure 5 displays the load-deflection behaviors at the slab edges, as observed in the experimental tests and as predicted through numerical analyses, for beams GIM-1, GIM-2, and GIM-3. The deflection of the slabs is assessed both at the midspan of the beam and at the slab’s edge, as illustrated in Figure 3. Table 2 shows summary of the results for tested specimens of loading slab. According Table 2 values, ultimate load “Pu” refers to the maximum measured load or force that a concrete slab specimen can sustain before experiencing failure or reaching a state of ultimate limit state, cracking load “Pcr” measured at which a concrete slab specimen undergoes cracking or the point at which cracks begin to develop in the structure, ultimate deflection (∆u) refers to the maximum measured displacement or deformation that the slab undergoes before reaching a state of failure or structural limit. It represents the extreme limit of bending or flexural movement that the slab can sustain under applied loads. Toughness refers to the ability of a concrete slab to absorb energy and resist fracture or failure under impact or dynamic loading conditions.
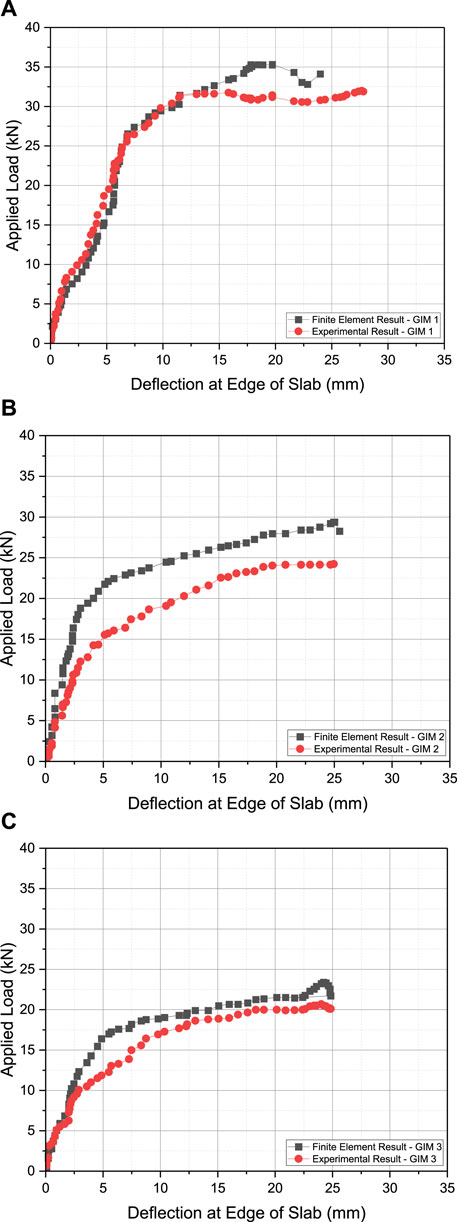
FIGURE 5. Load-deflection curves at the edge of slab from experiments compared to FEA results for specimens: (A) GIM-1 (control), (B) GIM-2, and (C) GIM-3.
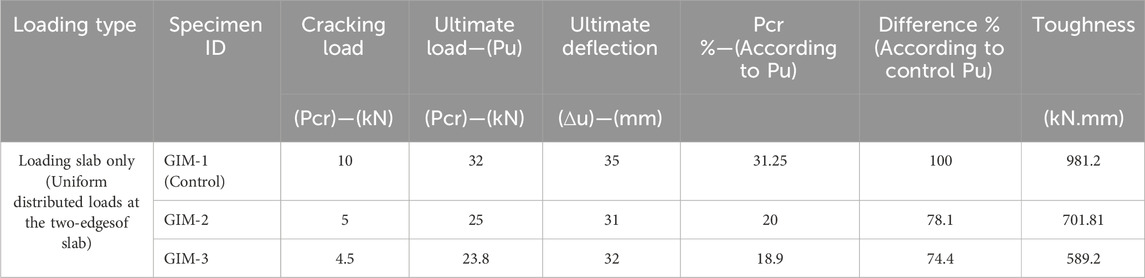
TABLE 2. Summary of the results for tested specimens of loading slab.
Values of “Pcr %—(According to Pu)” calculated by Eq. 1 and “Difference % (According to control Pu)” calculated by Eq. 2
Examining the load-deflection curves in Figure 5 reveals a notable concurrence between the experimental and FEA results during the initial loading phase, extending up to the point of cracking. However, it is evident that beyond the cracking point, the experimental test results exhibit a lower stiffness compared to those obtained through FEA. The deflection values at the point of ultimate load, as obtained through numerical analysis, are roughly 8%, 11%, and 10% lower than the corresponding experimental results for specimens GIM-1, GIM-2, and GIM-3, respectively. Furthermore, the ultimate loads determined through numerical analysis for specimens GIM-1, GIM-2, and GIM-3 are approximately 11%, 13%, and 12% less than the values achieved in the experimental tests, respectively. Generally, the numerical results exhibit a slight overestimation of the force values; nonetheless, they align quite well with the experimental data. Figure 6 provides an isometric view of the deflection for model GIM-1.
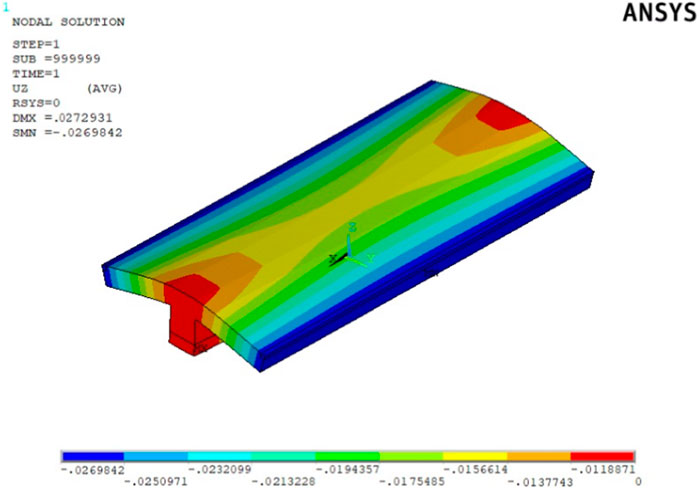
FIGURE 6. An isometric view of the deflection for model GIM-1.
Figure 7 presents the load-deflection behaviors at the midspan of the beams for specimens GIM-1, GIM-2, and GIM-3, as projected by the finite element model and as observed in the experimental outcomes. Additionally, Figure 8 provides an isometric view of the beam’s deflection for model GIM-3.
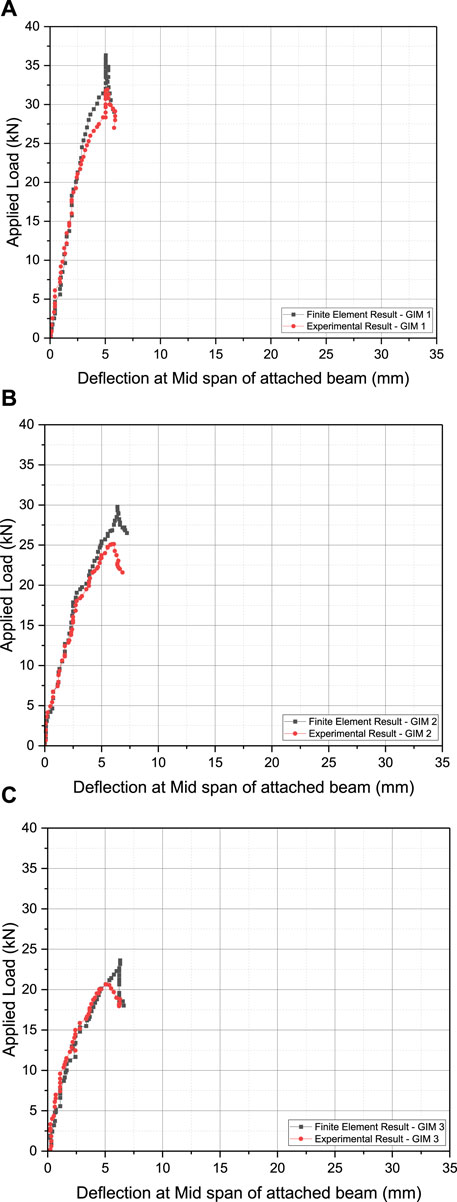
FIGURE 7. Load-deflection curves at the midspan of the beam from experiments compared to FEA results for specimens: (A) GIM-1 (control), (B) GIM-2, and (C) GIM-3.
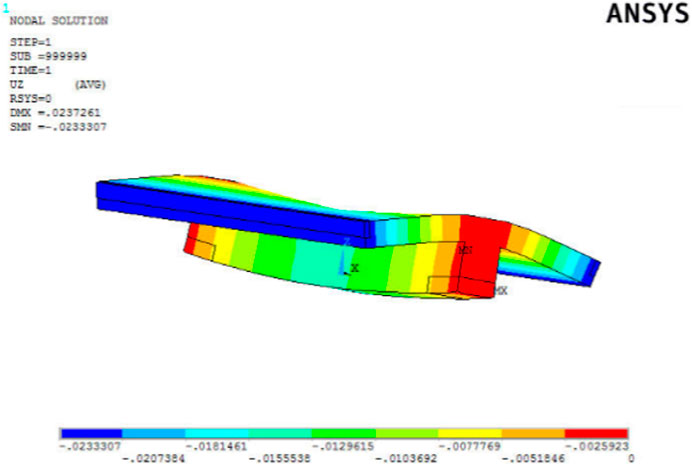
FIGURE 8. An isometric of the deflection model GIM-3.
Overall, there was a strong alignment between the load-midspan deflection curves obtained from the experimental test data and the numerical analysis results. Nevertheless, a slight deviation between the two curves became noticeable after the initial crack load. At the ultimate load level and for midspan, the average correlation factor reached 14.33% between the experimental tests and numerical results.
For GIM-1, the values were 27 kN and 21 kN for FEA and EXP, respectively, resulting in a 23% increase between the two tests. Similarly, for GIM-2, the values were 29 kN and 26 kN for FEA and EXP, respectively, with a 11% increase. Likewise, for GIM-3, the values were 36 kN and 33 kN for FEA and EXP, respectively, resulting in a 9% increase. Consequently, the average correlation factor, calculated as the average percentage increase between the experimental tests and numerical results (23% + 11% + 9%), reached 14.33%.
All T-beam configurations subjected to uniformly distributed loads at the slab’s edge exhibited crack patterns in the finite element models that closely resembled those observed in the tested specimens as reported in the study (Bayoumi et al., 2019). Initially, cracks initiate on the upper surface of the slabs along the junction line where the slab meets the beam. These cracks start to form at load values of approximately 12 kN, 10 kN, and 6 kN for the numerical models GIM-1, GIM-2, and GIM-3, respectively. As the loads increase, these flexural cracks propagate and widen, eventually reaching ultimate loads of 35.5 kN, 29 kN, and 23.5 kN for models GIM-1, GIM-2, and GIM-3, respectively. Figure 9 depicts the crack pattern in the finite element model at the onset of cracking and at the point of failure for GIM-1. Comparing this with the experimental results, it can be concluded that the behavior of the finite element model under load closely mirrors the behavior observed in the experimental tests.
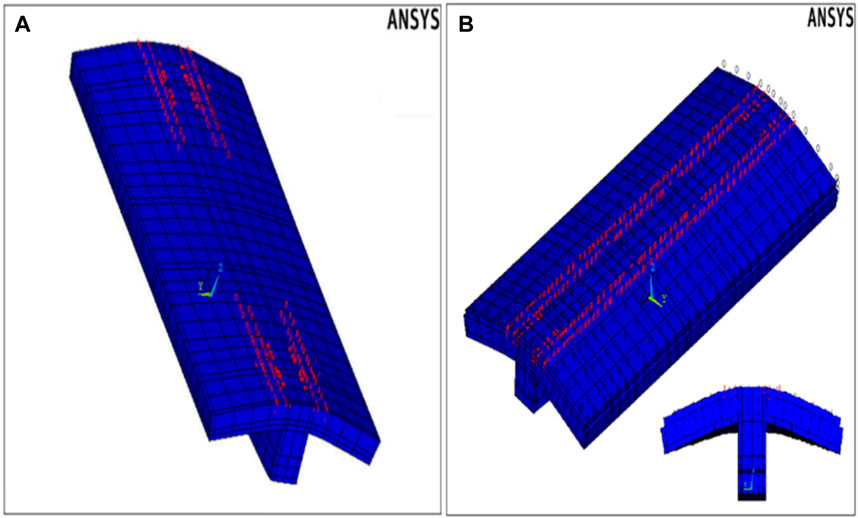
FIGURE 9. Concrete crack pattern for specimen GIM-1 (A) at initiation of cracks and (B) at failure.
In this research, a numerical investigation was conducted to explore how three crucial factors influence the performance of T-section beams. These factors included 1) the spacing of secondary reinforcements within the slab, 2) the diameter of the secondary slab reinforcements, and 3) the slab thickness. To achieve this, a parametric study was conducted using finite element analysis that had been validated through experiments on T-beams that had been tested. The T-beams in question were subjected to uniformly distributed loads applied to the edges of the T-beam slabs.
Experimental tests unveiled that modifying the spacing of secondary reinforcements within the slab, parallel to the longitudinal beam reinforcements, significantly influences the behavior of T-section beams. To thoroughly explore this impact, four numerical models were generated to assess how varying the spacing of the slab’s secondary reinforcements affects the structural response. This variation was quantified using the ratio of the distance (S) from the first bar to the projected beam’s (web’s) face, relative to the width of the slab (flange) on one side, which is set at 400 mm, as illustrated in Figure 8. The generated models, denoted as GINS-1, GINS-2, GINS-3, and GINS-4, possess ratios of 0.25, 0.5, 0.75, and 1, respectively, as depicted in Figure 10. This ratio provides a clear representation of the extent of variation in the secondary reinforcement spacing, allowing for a comprehensive analysis of its impact on the structural behavior of the T-section beams. The load-deflection reactions of the slabs, assessed at both the midspan of the beam and the slab’s edge, are presented in Figure 11 for models GINS-1 through GINS-4. Up to the point of initial cracking, the load-deflection correlations exhibited a linear behavior. During this stage, there were no significant distinctions in deflection values among the four models. However, once the finite element models exhibited initial cracking, the relationship transitioned into a non-linear state, and the distinctions became more pronounced. With increasing loads, multiple cracks developed in the contact region between the slab and the beam, ultimately culminating in the failure of the models. This is line with other studies who investigated the effect of the spacing of slab secondary reinforcement (Huang et al., 2019; Bayoumi, 2022; Abbas and Fadala, 2021; Ayensa et al., 2019).
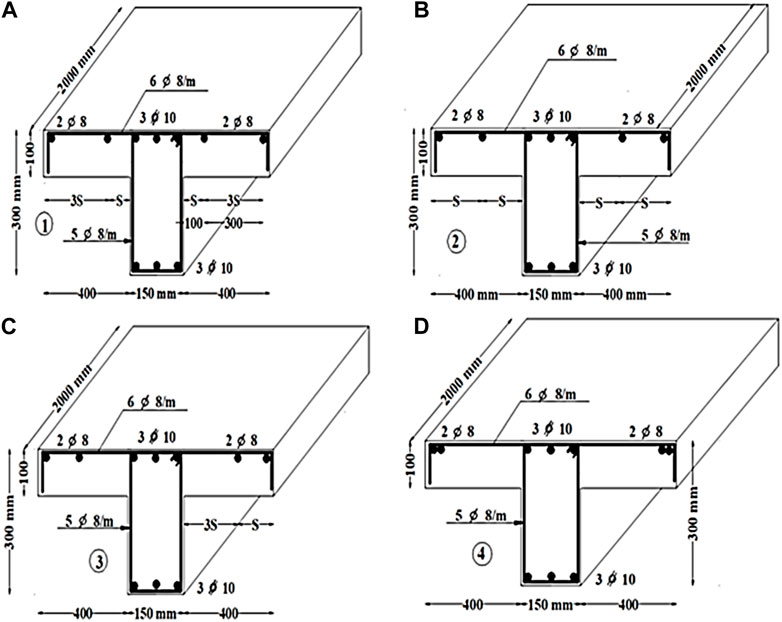
FIGURE 10. Reinforcements details in (mm) of numerical models: (A) GINS-1, (B) GINS -2, (C) GINS-3, and (D) GINS-4.
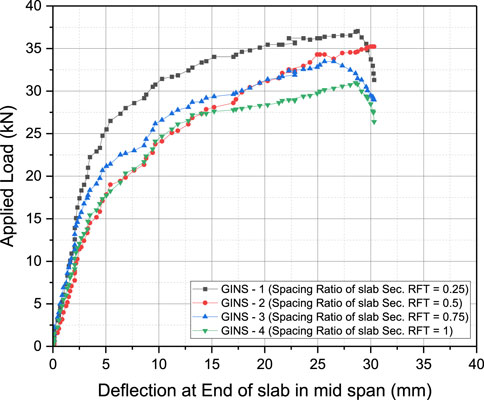
FIGURE 11. Load-deflection curves at the edge of slab for numerical models: (A) GINS-1, (B) GINS-2, (C) GINS-3, and (D) GINS-4.
As demonstrated earlier, the ultimate load values for models GINS-1, GINS-2, GINS-3, and GINS-4 were documented as 36.2kN, 35.55kN, 33.2kN, and 30.75kN, respectively. Notably, there was no substantial disparity in the ultimate load values between GINS-1 and GINS-2. However, the ultimate load of GINS-2 exhibited a 1.8% reduction compared to GINS-1. In contrast, it showed an increment of 7.1% and 15.6% when compared to GINS-3 and GINS-4, respectively. At the point of failure, deflection values measured 30 mm, 27 mm, 26.5 mm, and 25.75 mm for models GINS-1, GINS-2, GINS-3, and GINS-4, respectively. This irregular distribution of reinforcing steel within the slab resulted in a non-uniform stress distribution when subjected to loads, ultimately leading to a significant reduction in the ultimate load value. This observation aligns with findings from other studies that reported a similar behavior when the distribution of reinforcing steel within the slab was irregular. In essence, the uneven distribution of reinforcing steel has a direct impact on the structural performance, influencing both the ultimate load and deflection values of the concrete slab models (Rossetto et al., 2017; Huang et al., 2019; Bayoumi, 2022; Jumaat et al., 2010; ASTM, 2024).
Another significant factor influencing the behavior of T-section beams is the diameter of the secondary reinforcements within the slab. To explore this impact, four numerical models were established, each with varying bar diameters, specifically 6 mm, 8 mm, 10 mm, and 12 mm, employed for the secondary reinforcements in the slabs of models GΙΙNL-1, GΙΙNL-2, GΙΙNL-3, and GΙΙNL-4, respectively. The reinforcement details for these numerical models are depicted in Figure 12, while Figure 13 portrays the load-deflection responses of the slabs, measured both at the midspan of the beam and at the slab’s edge, for models GΙΙNL-1 through GΙΙNL-4.
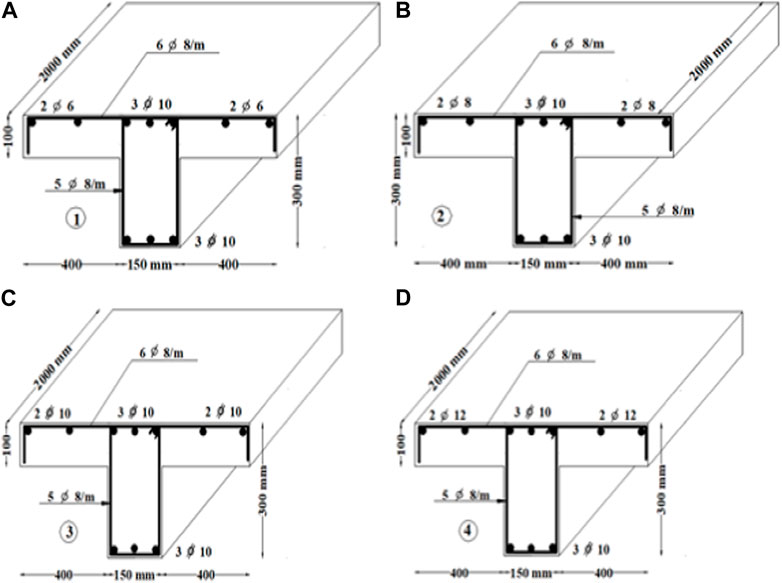
FIGURE 12. Reinforcements details in (mm) of numerical models: (A) GΙΙNL-1, (B) GΙΙNL-2, (C) GΙΙNL-3, and (D) GΙΙNL-4.
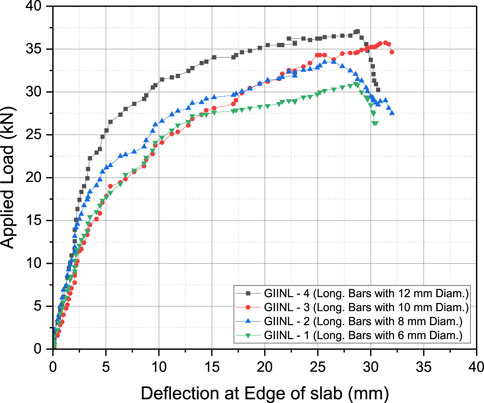
FIGURE 13. Load-deflection curves at the edge of slab for numerical models: (A) GΙΙNL-1, (B) GΙΙNL-2, (C) GΙΙNL-3, and (D) GΙΙNL-4.
Based on the findings, it can be inferred that augmenting the diameter of the slab’s secondary reinforcements had a favorable effect on the ultimate load. This can be attributed to the fact that the secondary reinforcements in the slab actively participated in the distribution of stress along the slab’s longitudinal direction, thereby countering the compressive stresses exerted by the attached beam, forming a T-section.
In the case of model GΙΙNL-2, increasing the reinforcement diameter from 6 mm to 8 mm resulted in an approximately 15% increment in the slab’s ultimate load. Likewise, elevating the diameter of the longitudinal slab reinforcements from 8 mm to 10 mm corresponded to an 11% increase in the ultimate load. Furthermore, employing a 12 mm diameter reinforcement led to an approximate 20% increase in the ultimate load. The results clearly demonstrate that an increase in the diameter of the longitudinal reinforcement substantially enhances the load-bearing capacity of the slab. These results agreed well with the findings from previous work (Ahmed et al., 1989; Pansuk and Sato, 2007; Bayoumi, 2022; Abbas and Fadala, 2021; Chen, 2016; National Education Policy, 2020).
This segment of the study aims to assess how altering the thickness of the slab (flange) impacts the structural performance of T-beams. To investigate this impact, four numerical models were generated to assess the influence of varying the spacing of the slab’s secondary reinforcements. These models, denoted as GIIINT-1, GIIINT-2, GIIINT-3, and GIIINT-4, have slab thicknesses of 80 mm, 100 mm, 120 mm, and 140 mm, respectively. A depiction of the cross-sectional details of these numerical models can be seen in Figure 14.
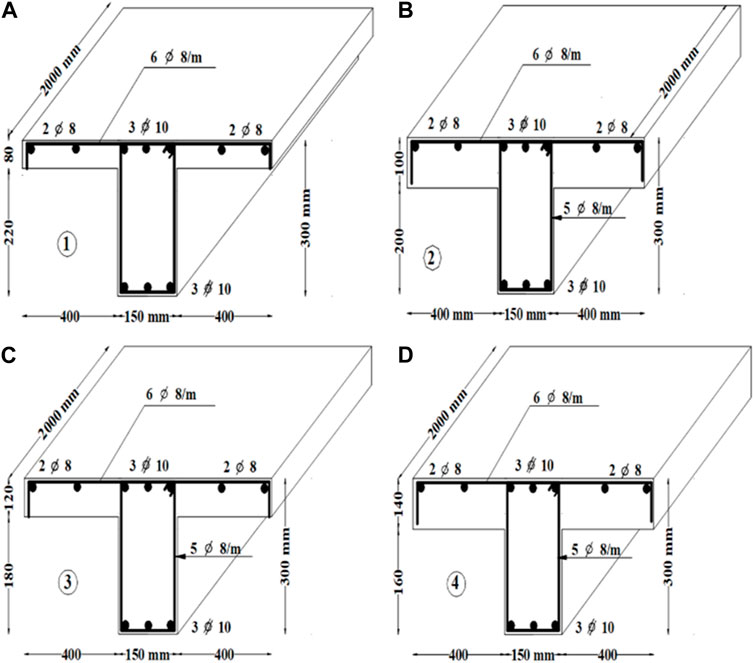
FIGURE 14. Cross-sectional details in (mm) of numerical models: (A) GIIINT-1 with 80 mm slab thick., (B) GIIINT-2 with 100 mm slab thick, (C) GIIINT-3 with 120 mm slab thick, and (D) GIIINT-4 with 140 mm slab thick.
In Figure 15, load-deflection curves for the numerical models are depicted. These curves distinctly reveal that right from the beginning of the loading process, there is a clear differentiation in deflection values, and consequently, in the stiffness, among various slab thicknesses. Typically, the curves exhibit linear behavior from the initiation of loading up to around 30%–40% of the failure load. Beyond this point, the curves exhibit non-linear behavior, with significant deflection occurring even with minor increments in load. The ultimate load values achieved were 31.5 kN, 35.55 kN, 41 kN, and 46 kN for models GIIINT-1, GIIINT-2, GIIINT-3, and GIIINT-4, respectively. Furthermore, the maximum deflection values at the point of failure for these models were measured at 32 mm, 36 mm, 41.5 mm, and 46.5 mm for GIIINT-1, GIIINT-2, GIIINT-3, and GIIINT-4, respectively. This is also in line with the work of Abbas and Fadala (2021).
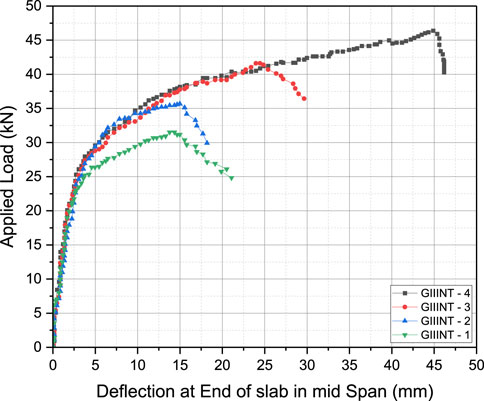
FIGURE 15. Load-deflection curves at the edge of slab for numerical models: (A) GIIINT-1, (B) GIIINT-2, (C) GIIINT-3, and (D) GIIINT-4.
As the thickness of the slab increases from 80 mm to 100 mm, there is a noticeable change in the deflection value, and this change gradually diminishes with further increases in slab thickness. Specifically, for models GIIINT-1 and GIIINT-2, a 25% increase in slab thickness results in an approximately 8% increase in deflection and a 12.9% increase in failure load capacity. However, when the thickness is further increased to 120 mm in model GIIINT-3 (20% greater than that of GIIINT-2), both the failure load and deflection values experience a substantial increase of 15% and 33%, respectively.
In contrast, for model GIIINT-4, raising the slab thickness from 100 mm to 140 mm (a 40% increase compared to GIIINT-2) leads to an approximately 30% boost in failure load capacity and a significant 68.5% increase in deflection. These observations support the concept that increasing the concrete slab thickness positively influences the available failure load capacity, primarily due to the heightened section stiffness. The findings highlight a trend where larger thicknesses contribute to enhanced structural performance, indicating the importance of slab thickness in optimizing failure load capacity and stiffness.
As the slab thickness increases from 80 mm to 100 mm, a noticeable alteration in the deflection value becomes apparent. This alteration gradually diminishes with further increases in slab thickness. Specifically, for models GIIINT-1 and GIIINT-2, augmenting the slab thickness by 25% results in an approximately 8% increase in the deflection value and a 12.9% increase in failure load capacity. However, when the thickness is elevated to 120 mm in model GIIINT-3 (20% greater than that of GIIINT-2), the failure load and deflection values see a substantial 15% and 33% increase, respectively. On the other hand, in the case of model GIIINT-4, raising the slab thickness from 100 mm to 140 mm (a 40% increase compared to GIIINT-2) leads to an approximately 30% boost in failure load capacity and a 68.5% increase in deflection. These observations bolster the concept that augmenting the concrete slab thickness has a favorable impact on the available failure load capacity, primarily due to the heightened section stiffness. This implies that thicker slabs exhibit improved structural performance, with increased capacity to withstand loads and higher resistance to deformation.
The study presented herein demonstrates a strong agreement between the finite element solution using ANSYS and the experimental results, showcasing a similar response to the tested specimens. The parametric analyses conducted on T-section beams under various configurations accurately predict the load-deflection relationships with a notable degree of precision. The following conclusions can be drawn:
1. The 3D nonlinear finite element structural analysis model’s capability to faithfully replicate the experimental behavior of T-shaped section beams under shear testing has been validated. The sole disparities identified pertain to the strains at the stirrups. These variations result from the localization of the critical crack, which does not align between the actual tests and the numerical simulations.
2. Inadequate reinforcement support during the construction and concrete pouring process can result in a lower positioning of the reinforcement. This, in turn, reduces the bending moment capacity of the slab and may potentially lead to a brittle structural response during a collapse scenario.
3. The ultimate load-carrying capacity of T-section beams exhibits a 3% reduction when the ratio of spacing between the longitudinal reinforcing bars of the slab is 25%, as compared to the case where the ratio of spacing between the longitudinal reinforcing bars of the slab is 50%.
4. The load-bearing capacity of T-beams was notably affected by the presence of the flange (slab). T-beams demonstrated a higher flexural capacity in contrast to rectangular beams according to several studies. This underscores the superior efficiency of T-beams when compared to rectangular beams, primarily due to the contribution of the slab in resisting loads.
5. The ultimate load-carrying capacity of T-section beams increases by 6.6% and 13.5% when the ratio of spacing between the secondary reinforcements of the slab is set at 0.75 and 1, respectively, as compared to the scenario where the ratio of spacing between the longitudinal reinforcing bars of the slab is 0.5.
6. The uneven arrangement of secondary reinforcement within the slab led to an unequal distribution of stresses in the slab, causing a notable reduction in the ultimate load capacity.
7. The displacement of reinforcing bars in the slab’s secondary direction had a more detrimental effect compared to the main direction, with the main direction experiencing lower stress levels.
8. Utilizing a 10 mm diameter for the slab reinforcement, in the secondary direction, enhances the slab’s ability to withstand the applied load.
9. Alterations in the stiffness of the concrete slab exert a noteworthy influence on the slab’s capacity to withstand applied loads.
10. The results acquired suggest that an effective shear flange thickness can be determined based on the flange dimensions and longitudinal reinforcement ratio. Moreover, various factors, including the quantity of transverse reinforcement in both the web and flanges, play a significant role due to their capacity to confine the concrete effectively. Given these considerations, the impact of these and other geometric parameters, such as (Flange width/web width) bf/bw, (Flange thickness/flange width) hf/bf, and (Flange thickness/beam width) hf/h ratios, will be explored in future research endeavors. The objective is to formulate a concise yet precise expression for the effective shear flange thickness.
Over the past few decades, several numerical simulation techniques have been developed, including methods like the meshfree method, extended finite element method, interelement crack method, coupling method, and others (Nguyen et al., 2008; Wang and Zhang, 2014; Van Vu et al., 2019). These methods have emerged in response to the complex behavior exhibited by concrete, such as high strains, rapid strain rates, extensive damage, material separation, and intricate contact conditions. They have now become essential tools for describing the process of concrete failure. Consequently, these methods can be governed by the principles of mass, momentum, and energy conservation. They provide a means to obtain crucial details, including the path and velocity of crack propagation, the formation of debris, and more, through these well-established techniques.
An examination of prior research reveals that the field of strengthening RC continuous beams, particularly continuous T beams, is relatively nascent. Factors such as the effective length, width, thickness, and the optimal anchorage system for various materials used to reinforce RC continuous beams require in-depth investigation. In essence, further research is essential to develop a comprehensive design guide for enhancing the structural integrity of RC continuous T beams using various materials.
The raw data supporting the conclusion of this article will be made available by the authors, without undue reservation.
AA-K: Software, Supervision, Validation, Writing–original draft, Writing–review and editing. HA-j: Validation, Writing–review and editing, Software. MF: Validation, Writing–review and editing, Data curation. GM: Writing–original draft, Software, Validation. EB: Conceptualization, Writing–original draft. TS: Validation, Writing–review and editing, Conceptualization.
The authors declare that no financial support was received for the research, authorship, and/or publication of this article.
First, all the authors are very grateful to all our family members for their continuous support, as well as thanks to everyone who contributed to publishing previous research that helped us reach and develop in the field of research presented.
The authors declare that the research was conducted in the absence of any commercial or financial relationships that could be construed as a potential conflict of interest.
All claims expressed in this article are solely those of the authors and do not necessarily represent those of their affiliated organizations, or those of the publisher, the editors and the reviewers. Any product that may be evaluated in this article, or claim that may be made by its manufacturer, is not guaranteed or endorsed by the publisher.
Abbas, R. M., and Fadala, W. A. (2021). Behavioral investigation of reinforced concrete T-beams with distributed reinforcement in the tension flange. E3S Web Conf. 318, 03010–03011. doi:10.1051/e3sconf/202131803010
Ahmed, S. M., Gunasekaran, U., and Macrae, G. A. (1989). “Effect of slab and transverse beam on R. C. beam column joint,” in Int. Conf. Earthq. Anal. Des. Struct., no. Figure 2, 2–6.
ASTM (2024). Standard specification for seamless and welded ferritic/austentic stainless steel pipe. “790.pdf”.
Ayensa, A., Oller, E., Beltrán, B., Ibarz, E., and Marí, A. (2019). 032 Influence of the flanges width and thickness on the shear strength of.pdf, 1–30.
Bayoumi, E. A. (2022). Effect of loading type on RC T-Beam sections involving construction errors. J. Civ. Eng. 37 (2), 100. doi:10.12962/j20861206.v37i2.14715
Bayoumi, E. S. A. A., Asran, A. G., and Eliwa, M. A. A. (2019). Mechanical performance of construction errors in implementation of T-reinforced concrete beams. Jordan J. Civ. Eng. 13 (1), 97–112.
Chen, S. (2016). Language and ecology: a content analysis of ecolinguistics as an emerging research field. Ampersand 3, 108–116. “chen2016.pdf.”. doi:10.1016/j.amper.2016.06.002
Ciesielczyk, K., Szumigała, M., and Ścigałło, J. (2017). The numerical analysis of the effective flange width in T-section reinforced concrete beams. Procedia Eng. 172, 178–185. doi:10.1016/j.proeng.2017.02.047
Cogurcu, M. T. (2015). Construction and design defects in the residential buildings and observed earthquake damage types in Turkey. Nat. Hazards Earth Syst. Sci. 15 (4), 931–945. doi:10.5194/nhess-15-931-2015
Elrakib, T. M., and Arafa, A. I. (2012). Experimental evaluation of the common defects in the execution of reinforced concrete beams under flexural loading. HBRC J. 8 (1), 47–57. doi:10.1016/j.hbrcj.2012.08.006
Giaccio, C., Al-Mahaidi, R., and Taplin, G. (2002). Experimental study on the effect of flange geometry on the shear strength of reinforced concrete T-beams subjected to concentrated loads. Can. J. Civ. Eng. 29 (6), 911–918. doi:10.1139/l02-099
Harry, O. A. (2016). Effect of flange width on flexural behavior of reinforced concrete T-beam, 97–103.
Hong, H. P., and He, W. X. (2015). Effect of human error on the reliability of roof panel under uplift wind pressure. Struct. Saf. 52, 54–65. doi:10.1016/j.strusafe.2014.07.001
Huang, Z., Tu, Y., Meng, S., Bagge, N., Nilimaa, J., and Blanksvärd, T. (2019). Validation of a numerical method for predicting shear deformation of reinforced concrete beams. Eng. Struct. 197, 109367. doi:10.1016/j.engstruct.2019.109367
Issa, A. M., Salem, M. M., Mostafa, M. T., Hadhoud, H. M., and Ghith, H. H. (2019). Performance of shear reinforcement against punching shear loads. Int. J. Eng. Adv. Technol. 9 (2), 841–850. doi:10.35940/ijeat.b3975.129219
Jumaat, M. Z., Rahman, M. M., and a Alam, M. (2010). Shear strengthening of RC T beam using cfrp laminate: a review. Int. J. Phys. Sci. 3, 619–625. no. June.
Khalaf, M., El-shihy, A., and Youssef, A. (2014). Numerical estimation and analysis of effective. Mater. Des. 3 (8), 1–15. doi:10.2648/IJAIEM.120.237
Lafta, Y. J., and Ye, K. (2015). Structural behavior of deep reinforced concrete beams under indirect loading condition. Int. J. Civ. Struct. Environ. Infrastruct. Eng. Res. Dev. 5 (4), 53–72.
National Education Policy (2020). National education policy 2020. Indian: Ministry of Human. “nie2020.pdf.”.
Nguyen, V. P., Rabczuk, T., Bordas, S., and Duflot, M. (2008). Meshless methods: a review and computer implementation aspects. Math. Comput. Simul. 79 (3), 763–813. doi:10.1016/j.matcom.2008.01.003
Pansuk, W., and Sato, Y. (2007). Shear mechanism of reinforced concrete T-Beams with stirrups. J. Adv. Concr. Technol. 5 (3), 395–408. doi:10.3151/jact.5.395
Peansupap, V., and Ly, R. (2015). Evaluating the impact level of design errors in structural and other building components in building construction projects in Cambodia. Procedia Eng. 123, 370–378. doi:10.1016/j.proeng.2015.10.049
Ribas González, C. R., and Fernández Ruiz, M. (2017). Influence of flanges on the shear-carrying capacity of reinforced concrete beams without web reinforcement. Struct. Concr. 18 (5), 720–732. doi:10.1002/suco.201600172
Rossetto, T., Pohoryles, D. A., Melo, J., and Varum, H. (2017). “The effect of slab and transverse beams on the behaviour of fullscale pre-1970s RC beam-column joints,” in Proc. 16th World Conf. Earthq. Eng. 16th World Conf. Earthq. Eng., vol. 3826, Santiago, Chile, January 09-13, 2017.
Słowik, M. (2019). The analysis of failure in concrete and reinforced concrete beams with different reinforcement ratio. Arch. Appl. Mech. 89 (5), 885–895. doi:10.1007/s00419-018-1476-5
Thamrin, R., Tanjung, J., Aryanti, R., Nur, O. F., and Devinus, A. (2016). Shear strength of reinforced concrete T-beams without stirrups. J. Eng. Sci. Technol. 11 (4), 548–562.
Van Vu, T., Khosravifard, A., Hematiyan, M. R., and Bui, T. Q. (2019). Enhanced meshfree method with new correlation functions for functionally graded plates using a refined inverse sin shear deformation plate theory. Eur. J. Mech. A/Solids 74, 160–175. doi:10.1016/j.euromechsol.2018.11.005
Wang, D., and Zhang, H. (2014). A consistently coupled isogeometric-meshfree method. Comput. Methods Appl. Mech. Eng. 268, 843–870. doi:10.1016/j.cma.2013.10.014
Wang, Z., and Cheng, J. (2020). Numerical and analytical study for ultrasonic testing of internal delamination defects considering surface roughness. Ultrasonics 110, 106290. doi:10.1016/j.ultras.2020.106290
Keywords: T-section beams, bar spacing, bar diameter, slab thickness, finite element analysis
Citation: Al-Kader A. Al Sayed A, Al-jabali HM, Fahmy M, Mohamed GN, Bayoumi E-SA-A and Selouma TI (2024) Evaluation of the structural performance of T-section beams with construction defects utilizing numerical analysis. Front. Built Environ. 10:1280072. doi: 10.3389/fbuil.2024.1280072
Received: 19 August 2023; Accepted: 07 February 2024;
Published: 20 February 2024.
Edited by:
Assed N. Haddad, Federal University of Rio de Janeiro, BrazilReviewed by:
Carina M. Stolz, Federal University of Rio de Janeiro, BrazilCopyright © 2024 Al-Kader A. Al Sayed, Al-jabali, Fahmy, Mohamed, Bayoumi and Selouma. This is an open-access article distributed under the terms of the Creative Commons Attribution License (CC BY). The use, distribution or reproduction in other forums is permitted, provided the original author(s) and the copyright owner(s) are credited and that the original publication in this journal is cited, in accordance with accepted academic practice. No use, distribution or reproduction is permitted which does not comply with these terms.
*Correspondence: Abd Al-Kader A. Al Sayed, YWhtZWRhYmRlbGthZGVyMTA5ODZAZ21haWwuY29t
†ORCID: Abd Al-Kader A. Al Sayed, orcid.org/0000-0002-4983-4554; Mohamed Fahmy, orcid.org/0000-0001-6869-5361; Ghada N. Mohamed, orcid.org/0009-0007-4331-2361
Disclaimer: All claims expressed in this article are solely those of the authors and do not necessarily represent those of their affiliated organizations, or those of the publisher, the editors and the reviewers. Any product that may be evaluated in this article or claim that may be made by its manufacturer is not guaranteed or endorsed by the publisher.
Research integrity at Frontiers
Learn more about the work of our research integrity team to safeguard the quality of each article we publish.