 Ping Wang
 Yongzhi Jiang
 Li Ding4
- 1School of Resources, Environment and Safety Engineering, Hunan University of Science and Technology, Xiangtan, China
- 2Key Laboratory of Disaster Prevention and Control of Coal Mine gas and roof plate in Southern China, Xiangtan, Hunan, China
- 3Hunan Provincial Key Laboratory of Coal Mine Safety Mining Technology, Hunan University of Science and Technology, Xiangtan, Hunan, China
- 4Zhejiang engineering survey and design institute group Co., Ltd., Zhejiang, China
- 5Guizhou Institute of Technology, Guiyang, China
- 6Guizhou Panjiang Refined Coal Co., Ltd., Guiyang, China
- 7The Ministry of Education Key Laboratory of Safe and Efficient Coal Mining was jointly established by the Ministry of Education, Xuzhou, China
The regenerated rock mass is a bearing structure formed by natural compaction in a hollow area, and the investigation of its optimal consolidation material and consolidation parameters is the key to improving the supporting effect and bearing stability of roadways. The effects of consolidation materials and parameters on the stability of the regenerative rock mass were studied using laboratory tests, numerical simulations, and theoretical analyses. Acoustic emission was used to monitor the variation characteristics of energy and ringing count during the process of rock mass failure, and the bonding interface area of the extremely weak cementation regeneration structure was tested by electron microscope scanning. The results show that there is a quadratic function relationship between the water–cement ratio of different cementing materials and the bond strength of the recycled rock mass; the regenerative rock mass with superfine cement exhibited the highest compressive strength and the largest cumulative energy of acoustic emission. This shows that it has the strongest bearing capacity, the highest elastic performance, the most stable micro-fracture development, and the best cementation effect, followed by ordinary cement, gypsum, and laterite. The scanning test showed that the regenerated structure had more internal pores, a loose structure, and poor cementation. Three-dimensional scanning modeling of four representative broken rock blocks was carried out, and the simulation verified that the regenerated structure had macroscopic “X”-shaped shear failure characteristics. The numerical simulation also verified three forms of rupture in the regenerative structure detected by electron microscopy scanning. Exploring the mechanism of action of the regenerative rock mass in the goaf provides a certain reference value for the stability control of the regenerated rock mass roadway.
1 Introduction
For a long time, the high-intensity and rough coal mining method was utilized to maintain coal output growth. The high production of this type of coal mining process also results in coal waste, which mostly consists of unmined thin coal seams and stratified, mining-protected coal seams (Zhao et al., 2021).
The high-grade and excellent mining coal resources are gradually exhausted after years of mining underground coal resources, and mines have begun to mine deeper or more complicated coal seams, including the recovery of coal resources in the goaf (Yang et al., 2020; Kang et al., 2019). Remining can enhance the recovery rate of partially mined coal deposits (He et al., 2018a). However, new coal mine workings are frequently located beneath complicated gob areas and, hence, contain multiple regenerated roof roadways (Gu et al., 2019). The regenerated roof is a rock mass formed by recompacting and consolidating the broken coal rock mass in the mining area and serving as the roadway roof (Ma et al., 2020; Ma and Wang, 2019). The top plate of the upper layer will fall over when the coal seam is mined in layers from top to bottom, the broken roof is then bonded by adding water and a binder, and the regenerated top slab is essentially bonded by the process of “crushing–compaction–consolidation” of the shattered rock mass (Guo et al., 2022). Because the major constituent elements of the regenerated rock mass are coal and rock masses, both of which are weakly cemented rock masses, the mechanical properties of the weakly cemented rock masses are significantly altered compared to undamaged rock masses (Wang et al., 2019a; Zhao et al., 2021). The regenerated rock is not fully cemented, is easy to break, and has low strength, and the gallery will be deformed once excavated because of the high amount of disturbance during coal winning. The weak and low strength features of the regenerated roof may become more apparent (Liu et al., 2019; Sun et al., 2017). The geological conditions differ from mine to mine, and this might affect the strength of the recovered rock once it has been created. For example, in deep mines, the ground stress is significant, allowing the cracked rock to be compressed to a great degree, resulting in reduced porosity of the regenerated rock (Yang et al., 2022). Through the immersion of water under the mine, the rock with cementing characteristics becomes mud, which forms a binder, or an artificial binder is added; the stronger the cementing properties, the more difficult it is to break the regenerated rock. The regenerated roof gallery is one type of regenerated rock mass roadway. The regenerated rock mass roadway refers to roadways that have the features of compacted poorly cemented fractured rock, such as a top slab, two helpers, and even a bottom slab (Zhao et al., 2019). The regenerated roof gallery located under or through the mining area is the most prevalent in the project, and the maximal management of the fragmentation or deformation of such regenerative rock mass roadways is the key to safe coal mining under complicated conditions, such as the mining area (Meng, 2014; Meng et al., 2022).
To date, scholars at home and abroad have carried out a lot of experimental research and theoretical analysis on the control theory and technology of soft rock roadways and the deformation and failure characteristics and stability mechanisms of the surrounding rock. However, the deformation and failure characteristics of roadway-surrounding rock in extremely weak cemented strata are different from those of ordinary soft rock roadways. The understanding of its deformation and failure mechanism is not clear, and the research results of the stability control mechanism and technology are less understood, which leads to the lack of a reliable theoretical basis for support design and often leads to the failure of roadway support. Therefore, the main material used in this paper is broken gangue from the roof plate of the Zhoujing Coal Mine. The mechanical properties of the regenerated rock mass and the destruction law under various cementing materials and cementing parameters are thoroughly examined using indoor tests, numerical simulations, and theoretical analyses. This reveals the bearing mechanism of the roadway perimeter rock of the regenerated rock mass in the coal mining hollow area and offers a new theoretical framework and technological approach for coal mining in the coal mining hollow area.
2 Experimental design of the regenerated structural rock mass
The broken coal gangue and the cementing material are mixed and compacted under natural loading to form a rock mass with poor cementation and low strength, which is called “extremely weak cementation.” Due to the extremely weak or uncemented cementation of the regenerated rock mass, the internal friction angle and cohesion of the rock mass are low, resulting in a low anchoring force of the bolt and anchor cable, thereby reducing the bearing stability of the regenerated rock mass roadway. Therefore, exploring the best consolidation characteristics of broken rock mass is the key to improving the support effect and bearing stability of the regenerated rock mass roadway. Based on the foregoing study, in order to study the best consolidation effect of broken rock mass, this paper uses different cementing materials and different water–cement ratios for experimental research. Using the test mold, the damaged roof rock mass can be formed into a regenerative structure with a certain bearing capacity. The cementing materials used include K600 ultrafine cement, M32.5 ordinary cement, gypsum, and laterite, and the roof gangue from the Zhoujing Coal Mine is taken as the experimental material. The coal gangue and the cementing material are weighed in advance according to the mass ratio. In order to make the cementing material fully play its role, the water and the cementing material are first fully mixed and then mixed with the coal gangue evenly. Finally, they are put into the mold to use the same quality of heavy objects for natural compaction. The gangue is 5–10 mm in diameter. According to the weak cementation of regenerated rock mass, the ratio mode of the high proportion of the broken gangue to the low proportion of the cementing material is used to simulate the mechanical properties and breaking characteristics of extremely weakly cemented regenerated rock mass. The test mold was a cube with side lengths of 150 mm, and the test plan is provided in Table 1.
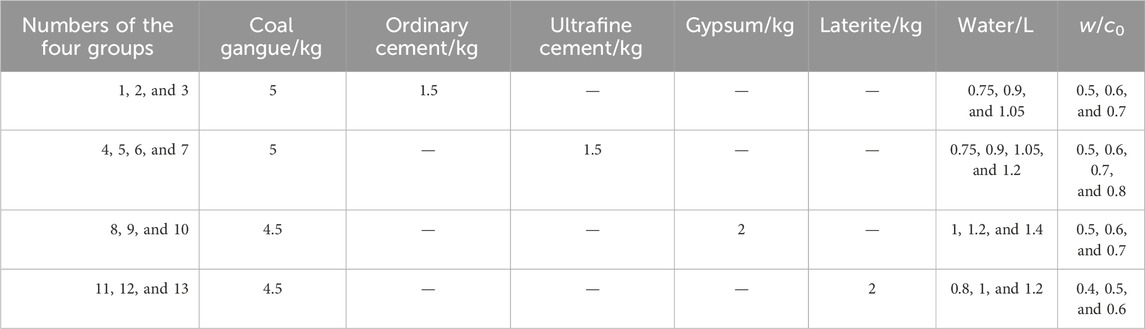
Table 1. Materials and material gauges used for the preparation of recycled rock masses.
The test was carried out by loading the specimens with RMT-150C rock mechanics servo testing equipment, as shown in Figure 1A, and monitoring the fracture progress using an acoustic emission detector. The whole loading process was videotaped in real time so that the camera could capture the crack expansion on the specimen surface, as well as the overall deformation and damage features of the specimen, and the force loading rate was 0.5 N/s. Due to the low strength of laterite specimens, a displacement loading of 0.002 mm/s was applied. The peak strength of specimens and stress–strain curves were examined using uniaxial compression to investigate the mechanical impact on the regenerated rock mass under various water–cement ratio parameters. To reduce test error, four specimens were prepared for each group of test programs, some of which are shown in Figure 1B, and the discreteness of the strength of each group was analyzed. The discrete coefficient was greater than 0.3 for the group of tests, and then, the data of that specimen, which deviated from the average value, were deleted to ensure that the data results of at least three specimens in each group were similar. Then, one of those specimens was deleted. The intervals of strength discrete coefficients of superfine cement, ordinary cement, gypsum, and laterite specimens with different water–cement ratios were [0.033, 0.236], [0.078, 0.225], [0.056, 0.247], and [0.059, 0.286], respectively, according to the results of the calculation of the peak strength dispersion coefficients of the specimens.
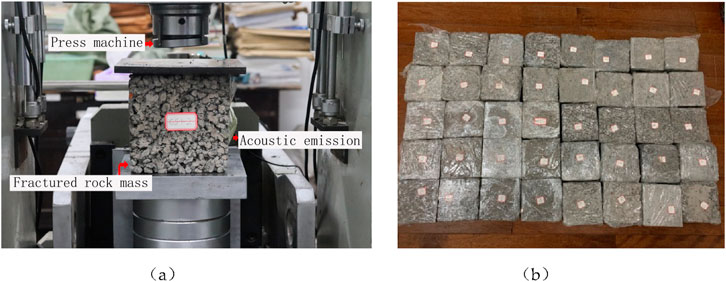
Figure 1. Rock mechanics test system and specimens: (A) RMT-150C Rock Mechanics Test System and (B) specimens for ultrafine cement, ordinary cement, and gypsum cementing.
3 Analysis of test results
The specimens constructed according to the test program were tested in uniaxial compression, and the results are given in Figure 2. The peak intensity increase percentage is shown in Table 2, where the curve is labeled UC0.5-3, where “US” stands for ultrafine cement, “OC” stands for ordinary cement, “GS” stands for gypsum sample, “LS” stands for laterite sample, “0.5” is the water–cement ratio, and “3” indicates that the third of the four specimens is chosen for analysis, and the selection rule is as follows: the specimen with peak strength closest to the average of the four specimens is chosen, and so on.
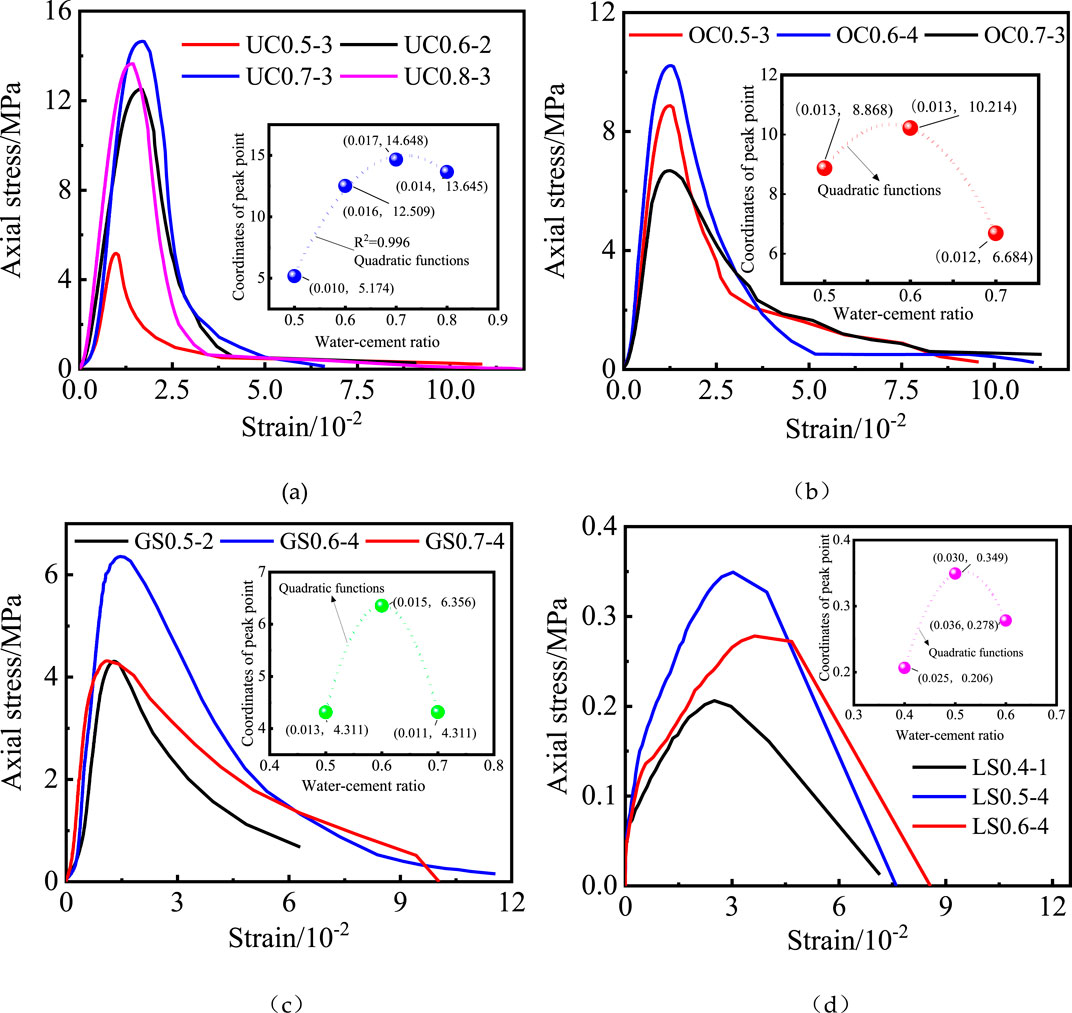
Figure 2. Stress–strain curves of four cementitious materials: (A) superfine cement; (B) ordinary cement; (C) gypsum; and (D) laterite.
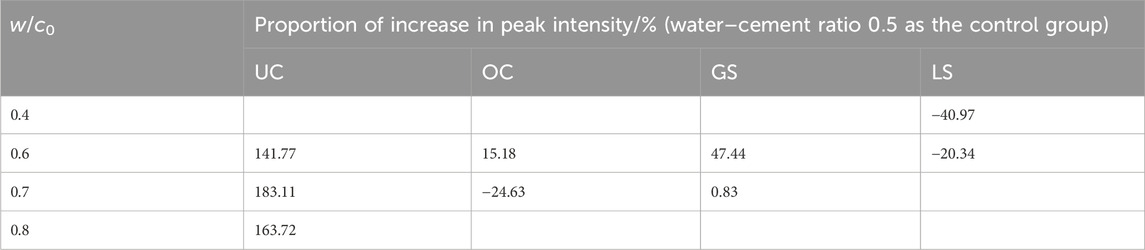
Table 2. Percentage increase in the peak strength of the rock mass under different water–cement ratios of four cementing materials.
3.1 Experimental analysis of ultrafine cements with varying water–cement ratios
According to the uniaxial compression test results of ultrafine cement specimens with different water–cement ratios, as shown in Figure 2A and Table 2, the fractured rock mass strength improves greatly in the interval of the water–cement ratio [0.5–0.8] of ultrafine cement. However, there is a peak, and the fractured rock mass strength is maximal when the water–cement ratio is 0.7. As a result, neither a higher nor a lower water–cement ratio consistently leads to a better cementing effect. If the water–cement ratio is too high, the cementing cycle of the broken rock mass becomes longer, with an increased risk of cementing material loss. Conversely, if the water–cement ratio is too low, it becomes difficult to bind the broken rock mass together. The percentage increase in the strain value when the specimen reaches the peak strength when the water–cement ratio increases from 0.5 to 0.8 is 60%, 70%, and 40%, respectively, indicating that the vertical deformation at the peak strength of the crushed rock increases, and the elastic properties are enhanced when the water–cement ratio of ultrafine cement increases in this range, but there are also peaks.
3.2 Experimental analysis of ordinary cements with varying water–cement ratios
The uniaxial compression test results of ordinary cement specimens with different water–cement ratios, shown in Figure 2B and Table 2, indicate that specimens with a water–cement ratio of 0.6 have the highest strength. The change in the strain value at the highest strength of specimens demonstrates that the varying water–cement ratios of conventional cement have only a small impact on the vertical deformation of the fractured rock mass after consolidation. When ordinary cement is used as a cementing material, the value of its water–cement ratio has a greater influence on the strength of the crushed rock but lesser influence on the vertical deformation at peak strength. The crushed rock achieves its highest strength and the best cementing effect when the water–cement ratio is controlled at 0.6.
3.3 Experimental analysis of gypsum with varying water–cement ratios
The uniaxial compression test results of gypsum specimens with different water–cement ratios, as shown in Figure 2C and Table 2, reveal that as the water–cement ratio of gypsum increases from 0.5 to 0.6, the peak strength and strain value of the specimen increase gradually, respectively. The change is not notable when it increases to 0.7, but the residual strength at the end of the curve is higher and lasts longer than with a water–cement ratio of 0.5, indicating a considerable improvement in bonding performance. As a result, when gypsum is used to cement crushed rock, the value of the gypsum water–cement ratio has a significant impact on the strength of the crushed rock. When the water–cement ratio is maintained at 0.6, the crushed rock has the highest peak and residual strength, the best cementing effect, and the longest resistance to deformation.
3.4 Experimental analysis of laterite with varying water–cement ratios
Because the laterite material is easy to soften when exposed to water when the water–cement ratio is 0.7, the degree of laterite softening is more significant, and the cementation capacity is low, resulting in a significant reduction in the strength of the cemented rock mass. The friction force within the coal gangue is not enough to support its stability. This group of solutions was eliminated because the laterite specimens could not be cemented into a form at a water–cement ratio of 0.7. The uniaxial compression test results of gypsum specimens with different water–cement ratios, as shown in Figure 2D and Table 2, reveal that the strength of specimens using laterite as the cementing material increases to varying degrees when the water–cement ratio is between 0.4 and 0.6, with the highest strength achieved at a ratio of 0.5. The percentage increase in the strain value at the highest strength of the specimen is 20% and 44%, showing that the greater the water–cement ratio during this period, the greater the vertical deformation at the peak strength of the specimen, and the stronger the elastic characteristics. As noted in the graph, there is a residual linear phase following the peak strength that also retains high resistance to deformation, and the specimen is quickly destroyed after this phase. As a result, when laterite is utilized as the crushed rock cementing material, the compressive and residual strength of the crushed rock is greatest when the water–cement ratio is 0.5.
In summary, the water–cement ratio of the four materials is not a simple positive and negative correlation with the peak strength of the rock mass but a quadratic function relationship. From the overall stress–strain curve, the cementation ability of ultrafine cement is the strongest, followed by ordinary cement, gypsum, and laterite. In addition, except for laterite, the other three cementing materials have a certain bearing capacity in the later stage of the stress peak, and there is an obvious residual strength stage, which is mainly borne by the friction force between the particles of the coal gangue. It shows that the recycled rock mass formed by the natural compaction of the broken rock mass in the goaf under the action of roof gravity has a certain bearing capacity and then carries the roof pressure.
4 Analysis of acoustic emission test results
4.1 Calculating the b-value of acoustic emission
Acoustic emission sensors convert mechanical vibrations caused by damage inside or on the surface of a rock into an electrical signal. If acoustic emission is regarded as a microseismic activity, the deformation damage characteristics of weakly cemented fractured rock masses under these four cemented material conditions can be analyzed using the value of the relevant parameter b in the seismic magnitude–frequency relationship equation formulated by B. Gutenberg and C. F. Richter (Song et al., 2019; Wu et al., 2023). The magnitude is replaced by the amplitude when calculating the value of parameter b in the G–R relationship (Liu et al., 2017):
where AdB is the maximum amplitude of the acoustic emission event in decibels, AdB = 20 lgAmax, Amax denotes the maximum amplitude of the acoustic emission event in microvolts, a is an empirical constant, and b denotes the b-value of the acoustic emission.
The pre-gain of the acoustic emission monitoring system in this article is 50 dB, the sampling frequency is 10 Msps, and the threshold value is 45 dB. According to the statistics of the number of acoustic emission events, the total number of events varies greatly between different cementitious materials. Therefore, when selecting the number of sample events, the samples are selected according to the total number of events of the specimen itself. The sample window is selected between 1/10 and 1/14 of the total number of samples, and the sample windows of superfine cement, ordinary cement, gypsum, and laterite specimens are 200, 70, 50, and 300, respectively. According to the findings of the literature analysis, the computation of b-values using the maximum likelihood technique has fewer and more stable errors than the least squares method, and the correction of the value of b in Equation 1 using the maximum likelihood method yields the following equation (Dong and Zhang, 2020; Zhao and Liu, 2021):
where
4.2 Analysis of the acoustic emission monitoring results of ultrafine cement
From the amplitude value of the acoustic emission test combined with Equation 2, the b value can be calculated. According to the variation in the AE cumulative number (∑G) and ringing count (∑N) during the loading process, it can be divided into four periods: crack compaction period, crack stable development period, crack unstable development period, and failure period. It can be observed from the energy accumulation and ringing count changes in ultrafine cement specimens given in Figure 3A. In the fissure compaction period, the energy accumulation number curve is approximately horizontal, and the ringing count tends to be 0. This is because the rock mass is in the elastic deformation stage, and no new cracks are generated inside the rock. This stage takes approximately 400 s, and the b-value of acoustic emission changes from a large decrease to a large increase. This shows that the pores inside the regenerated rock mass are gradually compacted at this stage. In the stable development period of cracks, damage began to appear inside the rock mass, cracks gradually increased, energy accumulation and ringing count curves increased, and cracks began to appear outside the rock mass. At this time, the b-value decreased, then increased, and then stabilized. This shows that the acoustic emission in this stage changes from a small event to a large event, the failure of regenerated rock mass changes from small crack failure to large crack failure, and finally, the crack develops stably. In the unstable development period of cracks, with the increase in load, the rock mass enters the plastic stage, the sliding friction between the broken rock masses increases, and the external cracks gradually expand. The occurrence of the acoustic emission “quiet period” in this stage does not mean that the energy and ringing count are absolute “0” but are similar to “0” relative to the higher count. This shows that the superfine cement is well cemented to the broken rock mass, and the tensile shear failure does not easily occur between the particles, resulting in a relatively small number of crack events in this stage. The b-value decreases first, then increases, and finally tends to be stable, indicating that the acoustic emission at this stage changes from a small event to a large event, the broken rock mass changes from small crack failure to large crack failure, and finally, the crack develops stably. In the failure period, the external crack expands rapidly, the deformation is gradually obvious, the degree of mutual friction and impact between rock blocks increases, the signal is enhanced, and the ringing count and energy accumulation count increase greatly. When the load exceeds the maximum friction between rock blocks, the specimen is destroyed quickly. In this stage, the b-value decreases, the regenerated structure is mainly the development of large cracks, and the energy accumulation and the vibration forest count suddenly increase greatly, indicating that the specimen will be completely destroyed.
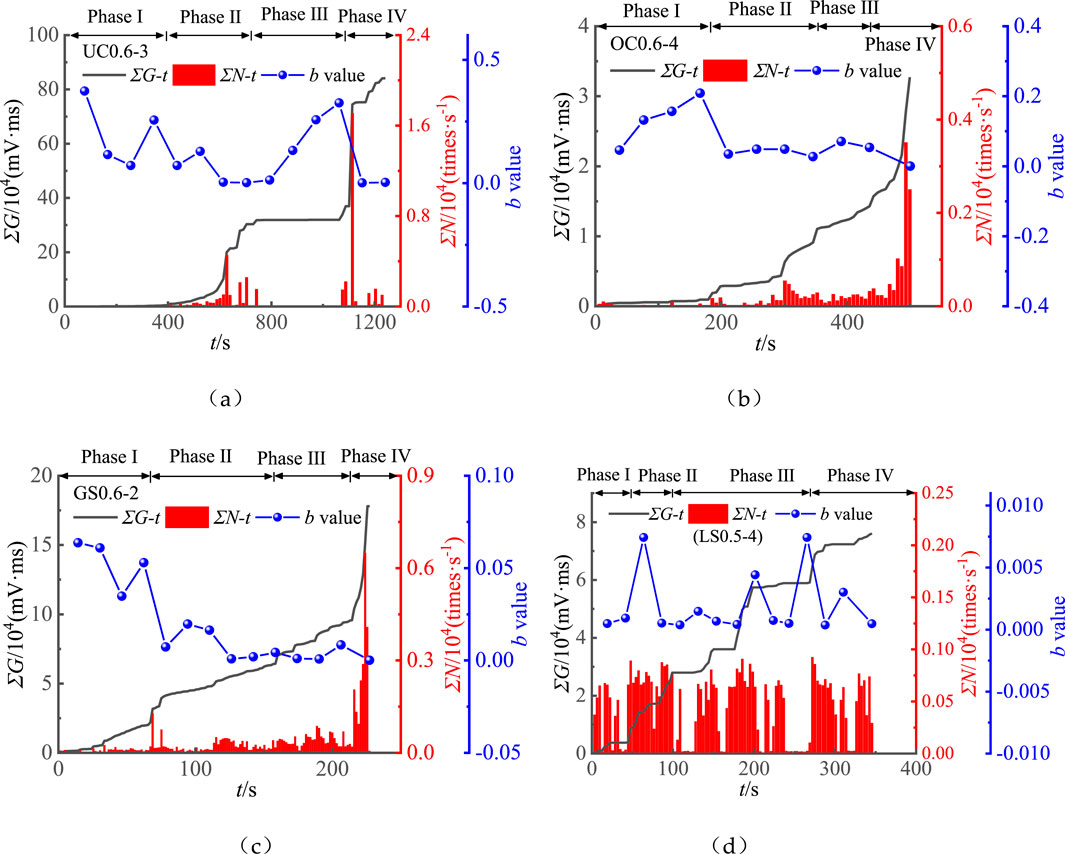
Figure 3. Acoustic emission test and b-value acoustic emission characteristics for four cementitious materials: (A) superfine cement; (B) ordinary cement; (C) gypsum; and (D) laterite.
4.3 Analysis of the acoustic emission monitoring results of ordinary cement
The energy accumulation and ringing count changes in ordinary cement specimens given in Figure 3B show that the time of 200 s in the compaction stage is about 1/2 of that of ultrafine cement specimens. This shows that the cementation ability of ordinary cement is not as good as that of ultrafine cement, which leads to the shortening of fracture compaction time, and the b-value of acoustic emission increases gradually at this stage, which is mainly dominated by micro-fracture expansion. The law of the crack stable development period is basically similar to that of ultrafine cement, and the energy and ringing count begin to increase, indicating that cracks begin to appear inside the rock mass at this stage. When entering the unstable development period of cracks, ordinary cement does not show the “quiet period” of acoustic emission but shows the unstable development of cracks. This is because the cementation ability of ordinary cement is weaker than that of ultrafine cement, the dispersion degree of broken rock mass is relatively high, and the amount of friction and impact between the particles/surfaces of coal gangue is higher. The b-value gradually decreases at this stage, indicating a transition from micro-fracture expansion to large fracture expansion. The behavior of the two materials in the failure period is basically the same, and the b-value decreases sharply, indicating that the regenerated rock mass at this stage experiences large crack expansion.
4.4 Analysis of the monitoring results of gypsum acoustic emission
The energy accumulation and ringing count changes in gypsum specimens given in Figure 3C show that the compaction stage lasts approximately 70 s, which is shorter than that of the first two materials. This shows that the cementation ability of gypsum is weaker than that of the first two materials, which leads to a decrease in crack compaction time, and cracks begin to appear inside the rock mass at this stage. In the last three stages, the changes in the acoustic emission and its b-value are basically the same as those of ordinary cement, and no analysis is done here.
4.5 Analysis of the acoustic emission monitoring results of laterite
The energy accumulation and ringing count changes in laterite specimens given in Figure 3D show that the compaction period lasts approximately 50 s, which is shorter than that of the first three cementing materials. This shows that the laterite cementation ability is the weakest, resulting in the shortest crack compaction period, and a large number of cracks are generated inside the rock mass at the initial stage. The change in the stable development period of the fracture is similar to that of the first three materials, which is not repeated here. In the unstable development period of cracks, there are multiple periods of the acoustic emission “quiet period,” consistent with ultrafine cement, which may be related to the displacement loading mode of laterite. Due to the weak cementation ability of laterite, the compressed broken rock mass is easy to loosen, and when the loading plate moves down at a constant speed, it takes a certain time for the loose broken rock mass to be compacted again. This time is the key reason for the “quiet period” of acoustic emission. Multiple “loose compactions” result in multiple “quiet periods” of acoustic emission. During the whole loading process, due to the weak consolidation of laterite, the sliding friction force between the particles/surfaces of broken rock mass is small, and the vibration signal is less, which leads to the lowest energy accumulation and event count of the laterite specimen compared with the other three materials. The failure stage is similar to that of the other three cementing materials, which is not described here.
In summary, the comparative analysis of the time of compaction period and the energy accumulation output to the outside world shows that the cementation ability of ultrafine cement is the strongest, followed by ordinary cement, gypsum, and laterite. The system’s input energy is lower, the rock mass breaks after loading, and the vibration signal produced by the release of mechanical energy is weaker because the cementation strength between the particles of the poorly cemented samples is not high. This is the cause of the low activity of the signal detected by acoustic emission. During the failure period, except for laterite, the acoustic emission energy accumulation and event count increased significantly, which reflected that laterite had the weakest consolidation ability among the four consolidation materials. In the late stage of the third stage, the b-value of the regenerated structure of superfine cement increased gradually, and the regenerated structure of laterite fluctuated in the middle stage, which was related to the “quiet period” of the acoustic emission signal. At this time, microcrack failure was the main failure mode. The decrease in the b-value in the failure period means that the load is about to exceed the sliding friction force between the particles/surfaces of broken rock mass, and the specimen is completely destroyed soon. The standard deviation of the b-value of acoustic emission is shown in Table 3. Table 3 shows that the b-value of the ultrafine cement sample fluctuates most in the positive direction, and the microcrack propagation of the specimen is the most stable.
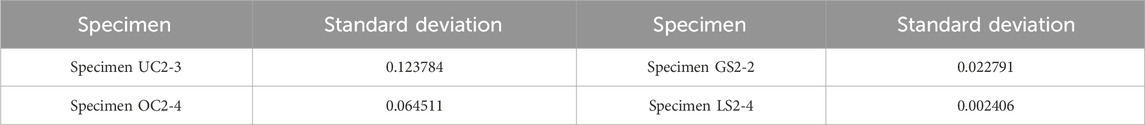
Table 3. Standard deviation of the acoustic emission b-value of different cemented specimens.
5 Analysis of the microstructure characteristics of the extremely weak cementation regeneration structure
The internal microstructure of the extremely weak cementation regeneration structure has a great influence on its strength. The microstructure near the cementation interface of the extremely weak cementation rock sample was tested using a SU3500 Hitachi new generation ultra-high-resolution tungsten filament scanning electron microscope, as shown in Figures 4–6. “UC,” “OC,” “GS,” and “0.7” in the diagram are consistent with those in Section 2. “FRM” denotes “fractured rock mass,” and “BI” denotes “bonding interface.” Because the regenerated structure of laterite cementation is very loose and difficult to sample, only the other three regenerated structures are sampled and tested, but this is enough to reflect the internal microstructure characteristics of the regenerated rock mass. On the whole, the cementation effect of the regenerated structure is poor. There is a clear gap at the junction of the broken rock sample and the cement, which is not completely filled. Under the action of external force, it is easy to produce the internal surface–surface sliding of the rock sample, resulting in structural instability and failure. This is the reason for the low strength of the extremely weakly cemented regenerated rock mass. It is also observed that there are many pores on the surface of the cement, the structure is loose, and the bearing capacity is low, which is why the acoustic emission takes a long time in the pore compaction stage.
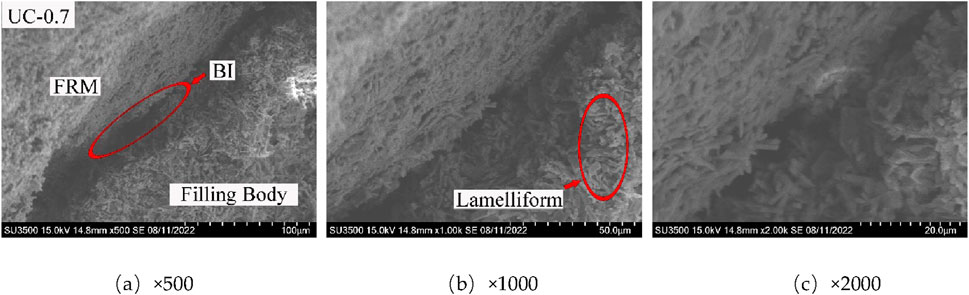
Figure 4. Electron microscope scanning test diagram of the ultrafine cement-bonded regeneration structure.
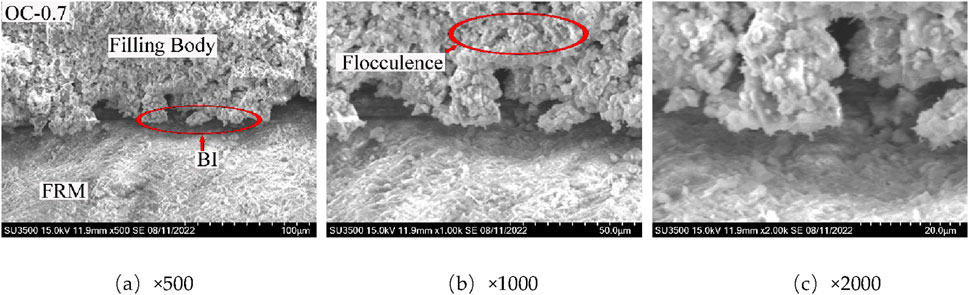
Figure 5. Electron microscope scanning test diagram of the ordinary cement-cemented regeneration structure.
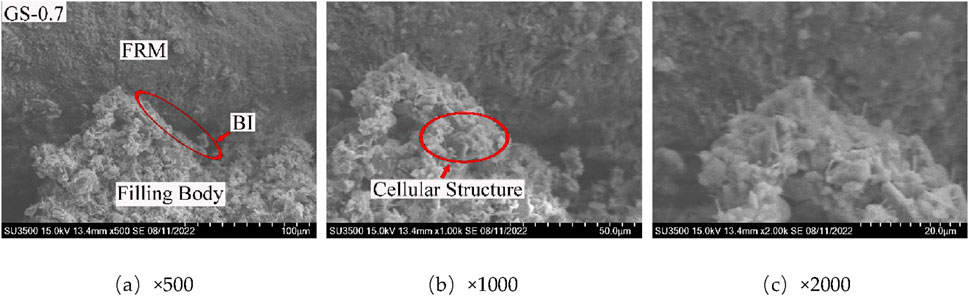
Figure 6. Electron microscope scanning test diagram of the gypsum cementation regeneration structure.
Figures 4A–C shows that the surface of the ultrafine cement filling is composed of some small particles and a thin sheet structure to form a large cementing body. The two substances are mixed and interwoven, resulting in a lamelliform structure. The pores are the gaps between the two substances that are not completely interwoven. It is also observed that the pores of the regenerated structure of ultrafine cement are small, and there are small gaps in the bonding interface. The surface of ordinary cement filling is composed of some small particles and large stones bonded to each other to form a cement body. The two particles are interconnected and intertwined, resulting in a flocculent structure, and the pores are distributed between the flocculent structures, as shown in Figures 5A–C. The gap between the pores of the ordinary cement regeneration structure and the cementation interface is obvious. Similar to ordinary cement, the surface of gypsum filling is composed of some small particles and large stones, which are bonded with each other to form a cementing body with a honeycomb structure, as shown in Figures 6A–C. Compared with the first two cellular structures, the gap between the pores on the surface of gypsum filling and the cementing interface is more obvious. The porosity of the filling and the cementation degree of the cementation interface have a great influence on the overall strength of the regenerated structure. The larger the orifice, the more the pores, and the larger the cementation interface gap. As a result, the regenerated structure is more likely to cause structural instability and failure under an external force. This further shows that the strength of the gypsum-cemented recycled rock mass tested in the laboratory is low, followed by ordinary and ultrafine cement.
In summary, there are many pores in the regenerated structure rock sample of the extremely weakly cemented rock mass, and the gap between the cementation interfaces is obvious, the structure is loose, and the cementation is very poor. Under the action of load, it is easy to produce the internal surface–surface sliding instability failure of the regenerated structure rock sample and the shear failure along the filling body area with more pores. Because of the poor filling of the regenerated structure, some broken rock masses fail to fill, so they may be destroyed first at the unfilled place.
6 Numerical simulation
6.1 Making a clump template and assigning parameters to it
In order to explore the stress and failure characteristics of the extremely weakly cemented regenerative rock mass, this paper uses PFC discrete element particle flow simulation to better understand the interior mechanical properties of the extremely weakly cemented regenerated rock mass and its damage forms. The particle flow model (PFC) includes the contact bond model (CBM) and parallel bond model (PBM). Some studies have shown that the PBM is more suitable for simulating the mechanical properties and failure characteristics of rock materials, and the PBM can be considered a set of springs with normal strength and tangential strength, uniformly distributed on the contact surface, and can transmit force and torque at the same time (Tang et al., 2020; Huang et al., 2017). Thus, the dispersion degree of weakly cemented rock mass, as well as the force and displacement rule of weakly cemented rock mass, is studied in this research using the particle flow linear PBM. It would be too idealized to replace fractured rock masses with spherical shapes based on their different shapes and uneven surfaces, which cannot reflect the real state of the angular and uneven rock masses and cannot realize the characteristics of the real fractured rock masses in the bearing process of occlusal friction and stress concentration. Given this, in this paper, the three-dimensional modeling method of a real scene is used to model the broken rock mass of four representative shapes, and then, the three-dimensional model is imported into numerical simulation software for numerical calculation. The specific operation is as follows: the four most representative shapes of fractured rock masses are photographed, scanned, and modeled using CC Software, and the scanned models are imported into Rhino software to generate and divide the mesh. The divided mesh is imported into ZB software for mesh closure before the surfaces are generated and combined into a body. Finally, the models are stored as stl files and imported into the PFC simulation program to build clump templates. Verification when the ratio = 0.1 and distance = 150 shows that clump templates can well restore the original look of the four types of blocks, as shown in Table 4. A “clump” is a stiff-cluster template that cannot be broken; in the primary state, broken rock is held together by cementation, which lies on adhesion and friction between the blocks. Since the cementation strength is extremely low, the block is not easily damaged.
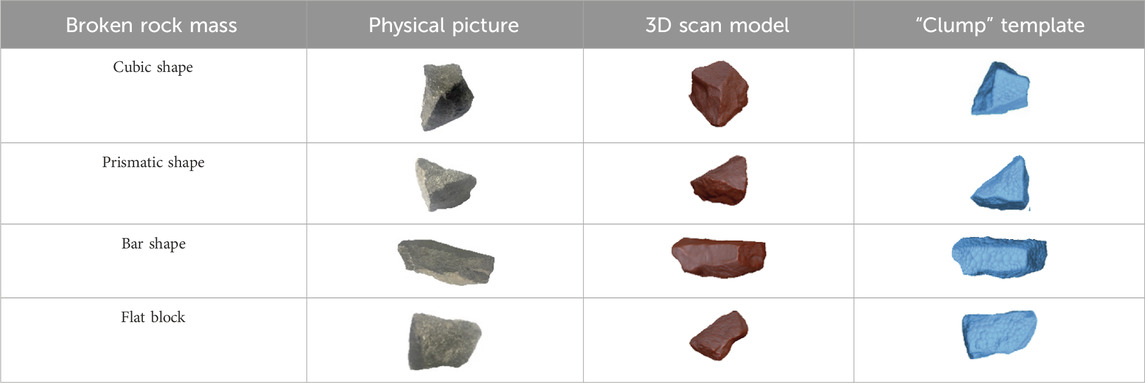
Table 4. Shape of the broken rock mass and its mesh are generated with the clump template.
Based on the stress–strain measured by uniaxial compression in Section 3 and the test results of standard samples of 50 mm × 100 mm prepared from four types of cementing materials, the meso-parameters of the particle flow numerical model are calibrated to simulate the stress and failure characteristics of four different cementing materials. The meso-parameter calibration results of the particles are shown in Table 5.
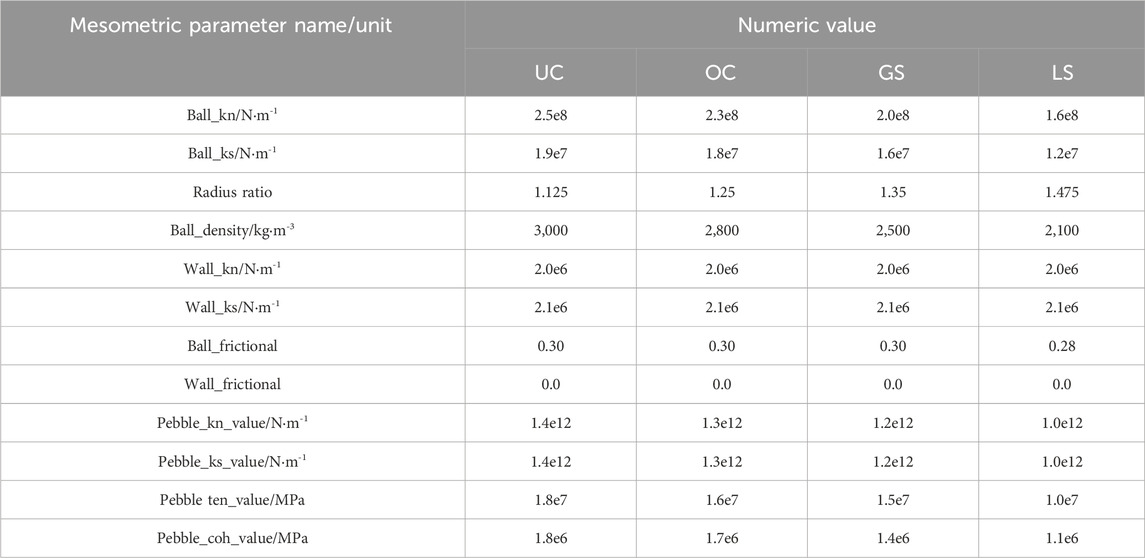
Table 5. Calibration results of the mesoscopic parameters of the broken gangue sample particle flow numerical model.
6.2 Displacement and skeletal force chain distribution properties of regenerated rock masses
The model is shown in Figure 7A and is based on a numerical model of particle flow of four representative types of shapes, namely, cubic, prismatic, bar, and flat block, as well as a random distribution of spherical particles filling the entire square box according to 20% of their respective volumes, where spherical particles are used for cementation. The fine-view properties of ultrafine cement particles were used to assign values to the model, and the loading mode of the model was adjusted to displacement loading. Figure 7B depicts the axial displacement characteristics of the regenerated rock mass. The displacement of the top and bottom ends of the model is large, while the displacement of the middle part is small, which is consistent with the loading effect. However, the particle distribution of the displacement occurring at the top and bottom ends of the model is not absolutely symmetrical due to the different displacement values of blocks of different shapes.
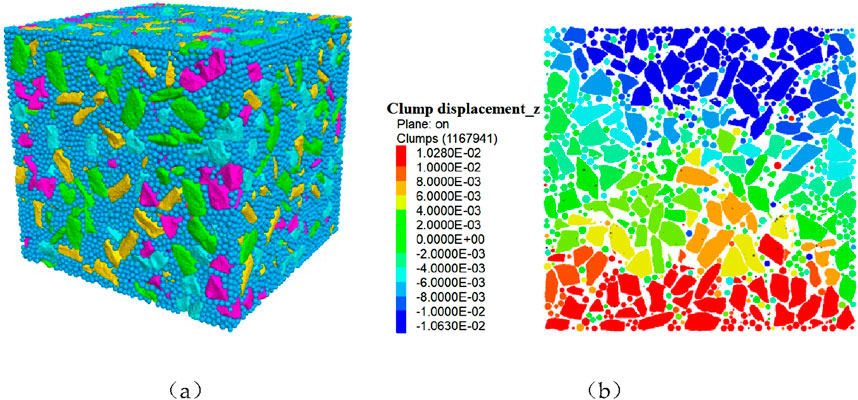
Figure 7. Model that was created and its axial displacement: (A) model of a very weakly cemented fractured rock mass and (B) axial displacement of the regenerated rock mass; its unit is mm.
A skeletal force chain is defined in a PFC aggregate as a chain-like structure composed of neighboring particles whose contact force is greater than the average contact force, and the stability of the skeletal force chain is bounded by the particles of the weak contact system surrounding it. As a result, the skeleton force chain bears the majority of the external load throughout the system’s compression phase. Figure 8 depicts the mechanical properties of the particle skeleton within the crushed rock. The amount of the contact force is represented by the darker color of the skeleton force chain and the thickness of the chain in the picture, and the darker the color, the thicker the chain, which indicates that the contact force at that position is bigger and vice versa. The skeleton force chain is not constant; as the external load increases, the skeleton force chain bearing the greater load will be the first to break due to stress concentration, resulting in a decrease in the skeleton force chain contact number. Finally, the skeleton structure bearing the load as a whole is destabilized and destroyed, which is the primary cause of damage within the broken rock mass. The skeletal force chain is densely distributed around the four corners and sparsely distributed in the center in the early stage of loading, indicating that stresses are mostly focused around the four corners at the early stage of loading, as shown in Figure 8A. Figure 8B shows that the number of skeletal force chain contacts increases before loading to peak strength, the contact force between the left and right sides increases, and the bearing capacity gradually improves, indicating that the crushed rock mass gradually shifts from carrying at the four corners to carrying at the left and right sides before entering the peak stress. When entering the peak loading period, the number of skeletal force chain contacts reaches a maximum, and the skeletal force chains on the left and right sides are thicker, darker, and more abundant, as shown in Figure 8C, indicating that the stresses during the peak strength period are primarily concentrated on the left and right sides. The bearing capacity of the rock mass reaches a maximum at this time. When entering the late peak period, the skeleton force chain contact number decreases, and the central part becomes thicker and darker, as shown in Figure 8D, indicating that when entering the late peak period due to the over-concentration of stress on the left and right sides, skeleton force chains undergo damage, the contact number decreases, the bearing capacity decreases, and the bearing on both sides gradually shifts to the central bearing.
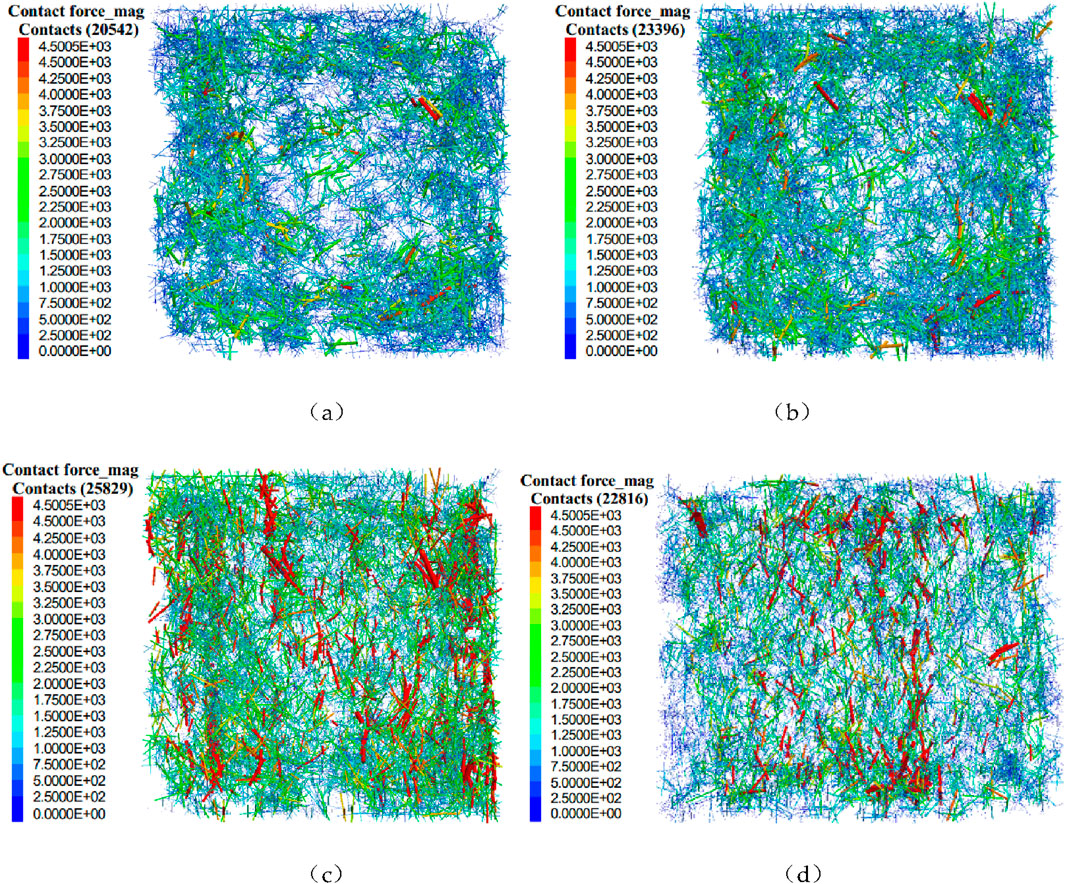
Figure 8. Distribution of the skeletal force chain throughout the regenerated rock mass for four distinct loading durations, and the unit of the skeletal force chain is N: (A) early loading phase; (B) pre-peak strength period; (C) peak strength period; and (D) late peak strength period.
In summary, the skeletal force chain’s thickness, number of contacts, contact force magnitude, and distribution characteristics vary with the loading duration, and the skeletal force chain carries the majority of the external load. The entire loading process can be divided into four periods based on the distribution characteristics of the skeleton force chain, namely, “early, peak strength, pre-peak strength, and late peak strength,” corresponding to the regenerated rock bearing changes of “four corners - four corners and two sides - two sides - central.”
6.3 Damage features of regenerated rock masses are simulated
In order to further explore the failure characteristics of extremely weakly cemented regenerated rock mass, the PBM is selected in this paper. The model size is 150 mm × 150 mm × 150 mm, and a radius of large particles of 0.005–0.007 is chosen to simulate the damage from inside the regenerated rock mass using a “clump” pentagon instead of the shape of the broken rock mass in the section to further investigate the damaged form of the regenerated rock mass. The data showed that the radius of ordinary cement is 2–4 times that of ultrafine cement; the particle size of gypsum and ultrafine cement is similar and in the range 10–20 µm. In ultrafine cement and gypsum cementing materials with small particles of 0.0002–0.0004 µm instead, the volume ratio of large and small particles is 0.60 and 0.40 and 0.65, and 0.35, respectively. Ordinary cement and laterite were substituted with particles with radii of 0.0005–0.0007, and the volume ratios of tiny and big particles were 0.50 and 0.50, and 0.55 and 0.45, respectively. All the particles created followed a random distribution with a porosity of 0.12. The number of particles for superfine cement, regular cement, gypsum, and laterite particles were 20,318; 15,016; 23,361; and 18,145, respectively.
The damage of the four cemented material specimens and PFC simulation results, as shown in Figures 9, 10, show that the four materials exhibit “X-”type tensile and shear damage, which is consistent with the bearing trend of the skeleton force chain “four corners - four corners and both sides - both sides - middle.”. The fractures sprout and develop from the left and right sides of the specimen at first, and the center of the specimen bears the majority of the burden following the damage on both sides. On one hand, this is due to the elastic–plastic material being readily destroyed by tensile–shear force, and on the other hand, the regenerated rock has poor cementation and extremely low bearing capacity, making it prone to tensile–shear rupture under load.
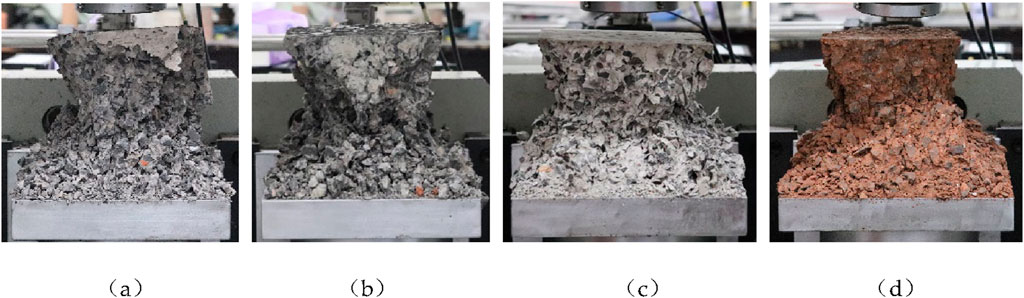
Figure 9. Specimen destruction diagram of different cemented materials: (A) superfine cement; (B) ordinary cement; (C) gypsum; and (D) laterite.
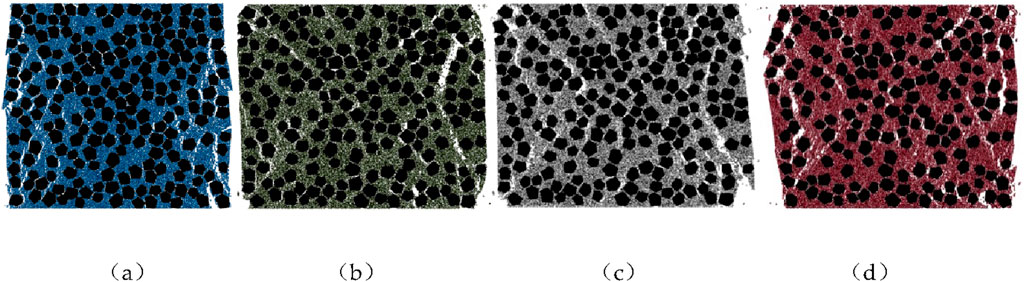
Figure 10. Simulated fracture failure plots for different cemented materials: (A) superfine cement; (B) ordinary cement; (C) gypsum; and (D) laterite.
The stress–strain curves while modeling the fracture damage of the regenerated rock are given in Figure 11. Based on the fine-view parameters of different cementing materials, the compressive strength of superfine cement is the highest, followed by conventional cement, gypsum, and laterite, and the peak stress and strain values at the peak are almost identical to the findings of indoor testing. As a result, the order of cementing material selection should be superfine cement, ordinary cement, gypsum, and laterite with corresponding water–cement ratios of 0.7, 0.6, 0.6, and 0.5, respectively, which serve as a reference for the cementing material selection and water–cement ratios for the broken roof of the mining void area of 5304 working face and the mining void area of 5306 working face in the Zhoujing Coal Mine.
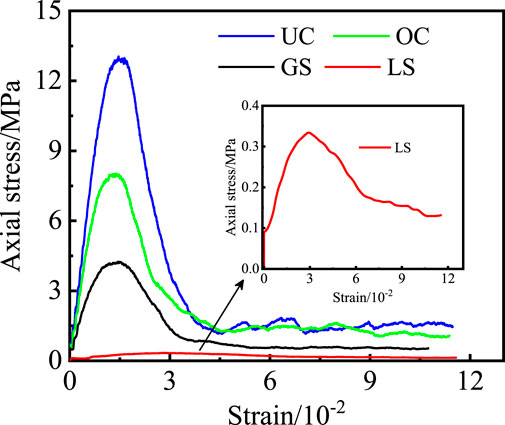
Figure 11. Simulation of failure stress–strain curves for different cemented materials.
7 Analysis of the strength characteristics of the regenerated rock mass
7.1 Analysis of the fracture of the regenerated rock mass
The analysis of electron microscope scanning results shows that the cementing material acts as a cementing medium so that the broken rock mass is bonded to form a bearing structure. However, due to the low filling rate of cementing material, more internal pores, and loose structure, the bearing capacity is weak, and the force is easy to be destroyed again (Wang et al., 2019b; Zhao et al., 2021; Wu et al., 2022). When combined with the PFC simulation of regenerated rock damage, the extremely weak cemented rock damage may be classified into three types: 1) cemented material pulling shear damage, as shown in Figure 12A (CM stands for cementing material); due to the small thickness of the cemented poor bearing capacity, the force is easily destroyed; 2) damage along the cementing surface of the cementing material and the broken rock, as shown in Figure 12B, due to the rough surface of the fractured rock and the poor filling rate of the cementing material, resulting in a limited cementing region prone to tensile–shear damage; and 3) damage along the unfilled area owing to very dense contact between the fractured rock masses, resulting in the failure to fill or extremely poor filling rate of the cementing material, which is sustained solely by static friction between the rock masses when subjected to stresses, as shown in Figure 12C.
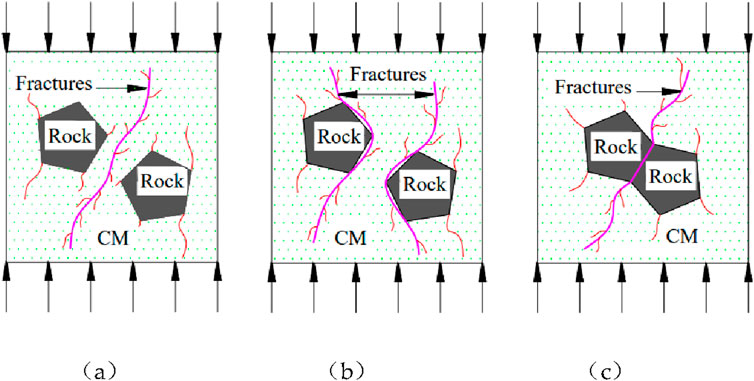
Figure 12. Three forms of destruction of regenerated rock masses: (A) rupture along the cementing material; (B) rupture along the cementing surface between the cementing material and the rock mass; and (C) rupture along the unfilled region between the rock masses.
7.2 Analysis of the bond strength of the recycled rock mass
The foregoing study shows that the peak strength of the regenerated rock mass is due to the cementation strength, cohesion between the filling material and the rock mass, and friction. The stress–strain curve given in Figure 2 shows that the residual strength values of the same material with different water–cement ratios are essentially similar in the post-peak stage, indicating that the cementing material has little influence on the residual strength and that the residual stage is primarily supported by the frictional effect between the rock blocks. Because the cementation thickness is so thin, the cementation effect is comparable to the cohesive effect of the filling material and the rock mass and is referred to collectively as the bond strength. As a result, the binding strength of the filler and the rock mass is defined as the peak strength minus the residual strength after the peak (He et al., 2018b), as shown in Equation 3:
where
where
where
According to Equation 7, the water–cement ratio of the four cementing ingredients and the compressive strength and bond strength of the regenerated rock mass have a quadratic function connection. The values of constants A, B, and D may be determined using Equation 4 and the test data on the four cementing materials from Section 2, and the results are given in Table 6.
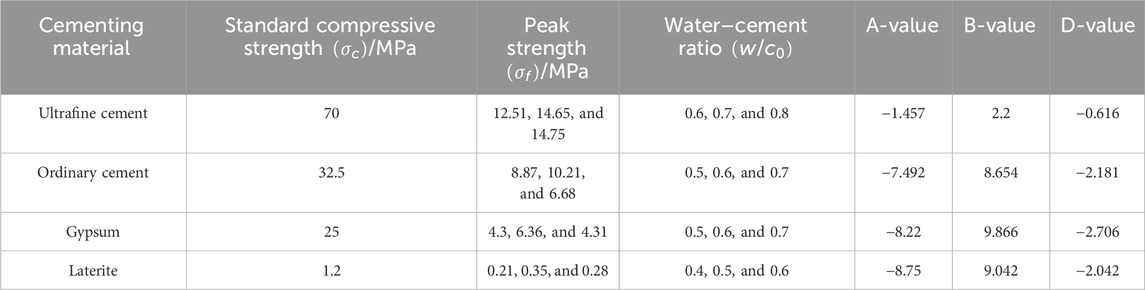
Table 6. Test parameter values for the four cemented materials.
The quadratic expression of the relationship between the different water–cement ratios of the four cementing materials and the compressive strength of the regenerated rock mass can be obtained from the data given in the above table, and when these values are input into Equation 7, the relationship between the bond strength of the four cementing materials and the water–cement ratio is derived as follows:
Ultrafine cement:
Ordinary cement:
Gypsum:
Laterite:
7.3 Discussions
Due to the low degree of cementation and filling rate of the fractured rock mass in this study, there are many pores inside and on the surface of the very weakly cemented rock mass. A large part of the mechanical vibration signal intensity emitted by cracks and collisions inside the rock mass under load is weakened by the pores, resulting in a low total number of events collected by acoustic emission. Based on this, when calculating the acoustic emission b-value, the sample window selection will be affected, and the low number of events selected in the sample window will lead to an increase in the error of the acoustic emission b-value. Due to the limitations of the test conditions, only one acoustic emission probe is used for data acquisition. If four acoustic emission probes are used, we may be able to avoid the above-mentioned situation of low total. The bond strength of the regenerated rock mass is analyzed in this paper based on the stress–strain curve and the variation characteristics of the peak strength, but it is unclear whether the lateral deformation of the regenerated rock mass is the same for different cementing materials or whether the lateral strain is related to the bond strength of the regenerated rock mass. Only 3–4 water–cement ratio data were used in the paper to fit a quadratic function to the peak strength, and the number of parameter samples was somewhat inadequate, affecting the applicability of the fitted equations but still reflecting the overall pattern of the effect on the peak strength of the regenerated rock mass based on the range of water–cement ratios used in this paper. Furthermore, as the number of water–cement ratio tests increases, whether there is a Gaussian distribution law for the peak strength of the regenerated rock masses with respect to the water–cement ratio merits further investigation.
8 Conclusion
(1) According to uniaxial compression tests performed on crushed rock from the four cementitious materials, superfine cement has the highest compressive strength and the best cementitious qualities, followed by conventional cement, gypsum, and laterite. There exists a quadratic function relationship between the variation characteristics of different water–cement ratios of the four cementing materials and the peak strength of the regenerated rock mass, and the Mohr–Coulomb criterion can be used to find the quadratic expressions of the bond strength and water–cement ratio between the filling and the fractured rock mass.
(2) Acoustic emission is an effective technology for monitoring crack activity and energy changes in rock mass. The initial compaction period of ultrafine cement is the longest, and the cumulative value of pre-peak energy is the largest, indicating that ultrafine cement has the most pre-peak energy storage and better elastic performance. The b-value of acoustic emission decreases sharply, indicating that the regenerated structure is completely destroyed soon, and the dynamic fluctuation in the overall increase in the b-value of acoustic emission of ultrafine cement specimens is the largest. The expansion of micro-cracks is the most stable.
(3) The cementation interface area of the regenerated structure of the extremely weakly cemented rock mass was tested by scanning electron microscopy. The results show that there are many pores in the regenerated structure rock sample of extremely weakly cemented rock mass, and the gap between the cementation interfaces is obvious, the structure is loose, and the cementation is very poor. Under the action of load, it is easy to produce the internal surface–surface sliding instability failure of the regenerative rock sample, and the shear failure occurs along the filling body area with more pores.
(4) The displacement of the top and bottom ends of the regenerated rock mass is substantial, while the displacement of the central section is minimal, as can be observed by the numerical simulation of four example shattered rock blocks. The “four corners—two sides—middle” force-bearing development is the cause of the “X-”shaped damage features of the regenerated rock mass. The regenerated rock mass had three different types of damage, which were confirmed through the electron microscope scanning test: 1) shear rupture along the cementing material; 2) rupture along the cementing interface between the cementing material and the rock mass; and 3) rupture along the unfilled area.
Data availability statement
The original contributions presented in the study are included in the article/Supplementary Material; further inquiries can be directed to the corresponding author.
Author contributions
PW: conceptualization, data curation, formal analysis, investigation, methodology, project administration, funding acquisition, resources, software, supervision, validation, visualization, writing–original draft, and writing–review and editing. YJ: conceptualization, data curation, formal analysis, investigation, methodology, project administration, software, visualization, and writing–original draft. LD: data curation, investigation, project administration, resources, and writing–review and editing. PL: data curation, formal analysis, investigation, resources, and writing–original draft. HW: data curation, investigation, methodology, resources, visualization, and writing–review and editing. ZZ: investigation, project administration, funding acquisition, resources, writing–original draft, and writing–review and editing. JZ: investigation, methodology, and writing–review and editing. XZ: investigation, resources, and writing–review and editing.
Funding
The author(s) declare that financial support was received for the research, authorship, and/or publication of this article. This research was supported by the National Natural Science Foundation of China (52174110), the Hunan Provincial Education Department Scientific Research Key Project (21A0313), and the Provincial and Ministerial Key Laboratory of Safe and Efficient Mining of Coal Mines by the Ministry of Education (JYBSYS2021203). This project was funded by Guizhou Provincial Science and Technology Support Project (Qian Science Support [2021] Normal 347).
Conflict of interest
Author LD was employed by Zhejiang Engineering Survey and Design Institute Group Co., Ltd. Author JZ was employed by Guizhou Panjiang Refined Coal Co., Ltd.
The remaining authors declare that the research was conducted in the absence of any commercial or financial relationships that could be construed as a potential conflict of interest.
Publisher’s note
All claims expressed in this article are solely those of the authors and do not necessarily represent those of their affiliated organizations, or those of the publisher, the editors, and the reviewers. Any product that may be evaluated in this article, or claim that may be made by its manufacturer, is not guaranteed or endorsed by the publisher.
References
Dong, L. J., and Zhang, L. Y. (2020). Error analysis of b-value of acoustic emission for rock fracture. J. Yangtze River Sci. Res. Inst. 37 (08), 75–81.
Gu, Q. H., Ru, W. K., Tan, Y. L., Ning, J. G., and Xu, Q. (2019). Mechanical analysis of weakly cemented roof of gob-side entry retaining in fully-mechanized top coal caving mining. Geotech. Geol. Eng. 37, 2977–2984. doi:10.1007/s10706-019-00816-1
Guo, S. R., Pu, H., Yang, M. S., Liu, D., Sha, Z. H., and Xu, Z. H. (2022). Study of the influence of clay minerals on the mechanical and percolation properties of weakly cemented rocks. Geofluids 2022, 1–15. doi:10.1155/2022/1712740
He, M. C., Gao, Y. B., Yang, J., Wang, J. W., Wang, Y. J., and Zhu, Z. (2018a). Engineering experimentation of gob-side entry retaining formed by roof cutting and pressure release in a thick-seam fast-extracted mining face. Rock Soil Mech. 39 (01), 254–264. doi:10.16285/j.rsm.2016.2329
He, P. F., Ma, W., Mu, Y. H., Mu, Y. H., Dong, J. H., and Huang, Y. T. (2018b). Study on freezing strength characteristics and formation mechanism of frozen soil-concrete interface. Trans. Chin. Soc. Agric. Eng. Trans. CSAE 34 (23), 127–133. doi:10.11975/j.issn.1002-6819.2018.23.015
Huang, Y. H., Yang, S. Q., Ranjith, P. G., and Zhao, J. (2017). Strength failure behavior and crack evolution mechanism of granite containing pre-existing non-coplanar holes: experimental study and particle flow modeling. Comput. Geotechnics 88 (2017), 182–198. ISSN 0266-352X. doi:10.1016/j.compgeo.2017.03.015
Kang, H. P., Xu, G., Wang, B. M., Wu, Y. Z., Jiang, P. F., Pan, J. F., et al. (2019). Forty years development and prospects of underground coal mining and strata control technologies in China. J. Min. Strata Control Eng. 1 (1), 013501. doi:10.13722/j.cnki.jrme.2020.0072
Liu, H. L., Zhang, D. S., Zhao, H. C., Chi, M. B., and Yu, W. (2019). Behavior of weakly cemented rock with different moisture contents under various tri-axial loading states. Energies 12, 1563. doi:10.3390/en12081563
Liu, X. L., Pan, M. C., Li, X. B., and Wang, J. P. (2017). Acoustic emission b-value characteristics of granite under dynamic loading and static loading. Chin. J. Rock Mech. Eng. 36 (S1), 3148–3155. doi:10.13722/j.cnki.jrme.2016.0272
Ma, W. Q., and Wang, T. X. (2019). Experimental study of shear strength features of regenerated rock mass compacted and consolidated by broken soft rocks. KSCE J. Civ. Eng. 23 (4), 1839–1848. doi:10.1007/s12205-019-1831-2
Ma, W. Q., Wang, Z. H., and Wang, T. G. (2020). Self-bearing characteristics and control strategy of a cataclastic regenerated rock mass in a roadway roof with top remains: a case study. Geotech. Geol. Eng. 38, 3853–3873. doi:10.1007/s10706-020-01262-0
Meng, L. D., Han, L. J., Zhu, H. X., Dong, W. L., and Li, W. (2022). Study of the effects of compaction and split grouting on the structural strengthening characteristics of weakly cemented argillaceous rock masses. KSCE J. Civ. Eng. 26 (4), 1754–1772. doi:10.1007/s12205-022-1534-y
Meng, Q. B. (2014) “Study on structure and mechanical properties and constitutive model of very weakly cemented rock,”. Xuzhou, China: China University of Mining and Technology. Ph.D. Thesis. doi:10.16285/j.rsm.2019.1520
Song, Z. Y., Ji, H. G., Liu, Z. Q., Zhang, Y. Z., Wang, H., and Tan, J. (2019). Experimental study on acoustic emission characteristics of weakly cemented granular rocks affected by dry-wet cycling process. J. Min. & Saf. Eng. 36 (04), 812–819. doi:10.13545/j.cnki.jmse.2019.04.021
Sun, L. H., Ji, H. G., Jiang, H., Zeng, P., and Yang, B. S. (2017). Experimental study on characteristics of broken caving and regularity of compaction deformation of rocks in caving zone in the weakly cemented strata. J. China Coal Soc. 42 (10), 2565–2572. doi:10.13225/j.cnki.jccs.2017.0051
Tang, J. Z., Yang, S. Q., Zhao, Y. L., and Tian, W. L. (2020). Experimental and numerical modeling of the shear behavior of filled rough joints. Comput. Geotechnics 121, 103479. doi:10.1016/j.compgeo.2020.103479
Wang, P., Feng, T., Zhu, Y. J., and Yu, W. J. (2019b). Experimental study on secondary bearing mechanism of weakly cemented broken rock mass. J. Vibroengineering 11 (Sl), 2228–2241. doi:10.21595/jve.2019.20624
Wang, P., Zhu, Y. J., Yu, W. J., Ren, H., and Huang, Z. (2019a). Experimental analysis on fractional compaction mechanical characteristics of soft and broken rock. Rock Soil Mech. 40 (07), 2703–2712. doi:10.16285/j.rsm.2018.0460
Wu, Q. H., Xie, C. L., Xie, Y. S., Zhao, Y. L., Li, X. F., Liu, J., et al. (2022). Extending application of asymmetric semi-circular bend specimen to investigate mixed mode I/II fracture behavior of granite. J. Central South Univ. 29, 1289–1304. doi:10.1007/s11771-022-4989-6
Wu, Q. H., Yang, Y., Zhang, K. X., Li, Y. J., Chen, W., and Liu, Z. F. (2023). Uniaxial compression mechanical properties and deterioration mechanism of sandstone under different humidity conditions. J. Central South Univ. 30, 4252–4267. doi:10.1007/s11771-023-5521-3
Yang, K., Chi, X. L., Liu, Q. J., Liu, W. J., and Liu, S. (2020). Cataclastic regenerated roof and instability mechanism of support in fully mechanized mining face of steeply dipping seam. J. China Coal Soc. 45 (9), 3045–3053. doi:10.13225/j.cnki.jccs.2019.0854
Yang, X. D., Sun, L. H., Song, J. L., Yang, B. S., Lan, C. G., and He, Q. F. (2022). Study on the effect of bond strength on the failure mode of coarse-grained sandstone in weakly cemented stratum. Minerals 12, 55. doi:10.3390/min12010055
Zhao, Y. L., Liu, Q., Liu, H., Liao, J., Chang, L., Tan, T., et al. (2021). Triaxial compression and acoustic emission tests on single cracked limestone and compression–shear fracture model under hydraulic-mechanical coupling action. J. China Coal Soc. 46 (12), 3855–3868. doi:10.13225/j.cnki.jccs.2021.0367
Zhao, Y. X., and Liu, B. (2021). Deformation field and acoustic emission characteristics of weakly cemented rock under brazilian splitting test. Nat. Resour. Res. 30 (2), 1925–1939. doi:10.1007/s11053-020-09809-x
Keywords: regenerated rock mass, cementing material, acoustic emission b-value, scanning electron microscope, numerical simulation
Citation: Wang P, Jiang Y, Ding L, Li P, Wu H, Zhou Z, Zhou J and Zhang X (2024) Mechanical property testing and damage assessment of the regenerated rock mass with very weakly bonded cement. Front. Built Environ. 10:1207832. doi: 10.3389/fbuil.2024.1207832
Received: 18 April 2023; Accepted: 29 August 2024;
Published: 24 September 2024.
Edited by:
Jie Han, University of Kansas, United StatesReviewed by:
Fan Feng, Shandong University of Science and Technology, ChinaWang Wei, Shijiazhuang Tiedao University, China
Copyright © 2024 Wang, Jiang, Ding, Li, Wu, Zhou, Zhou and Zhang. This is an open-access article distributed under the terms of the Creative Commons Attribution License (CC BY). The use, distribution or reproduction in other forums is permitted, provided the original author(s) and the copyright owner(s) are credited and that the original publication in this journal is cited, in accordance with accepted academic practice. No use, distribution or reproduction is permitted which does not comply with these terms.
*Correspondence: Yongzhi Jiang, MzY0MTA5ODU2QHFxLmNvbQ==
†ORCID: Yongzhi Jiang, orcid.org/0000-0002-7697-4886