 Horas Yosua
 Muhammad Syahril Badri Kusuma3
- 1Doctoral Program of Water Resources Engineering, Faculty of Civil and Environmental Engineering, Institut Teknologi Bandung, Bandung, Indonesia
- 2Water Resources Agency of Jakarta, Jakarta, Indonesia
- 3Water Resources Engineering Research Group, Faculty of Civil and Environmental Engineering, Institut Teknologi Bandung, Bandung, Indonesia
South Jakarta is a megapolitan city that is directly affected by Land Use Cover Change (LUCC). One of the impacts that arise is urban flooding, otherwise known as pluvial floods. More work is needed to evaluate the effect of LUCC on the increase of pluvial floods in South Jakarta. In this study, the runoff coefficient value (C) caused by LUCC is determined and the hazard risk of pluvial floods is evaluated. The analysis uses linear regression classification of LUCC using GIS software and carries out hazard and risk analysis based on Minister of Public Works Regulation Number 12 of 2014. Based on the rational method flood discharge formula, the higher C value result in the greater flow rate in a watershed. To simplify the calculation, the C equivalent value used is the C value that represent the watershed. The growth of the runoff coefficient (C) in South Jakarta is 1%–1.3% per year. It is found that the rate of increase in the runoff coefficient (C) is the same as the population growth rate of DKI Jakarta, which is around 1.3% per year. The increasing of runoff coefficient also increases the risk of pluvial flooding in locations that are prone to flooding. Furthermore, the hazard risk study found that there are 2 locations with a moderate level on the hazard risk index, namely, Ciledug Seskoal and Dharmawangsa Taman Gajah. This study can be used by government agencies as a basis to construct the spatial prioritization framework for pluvial flood mitigation.
Introduction
Land-use/cover change (LUCC) is an alteration in the way a certain area of land is being used or managed by humans and a change in certain continuous characteristics of the land (Patel et al., 2019). LUCC is closely related to urban growth. South Jakarta is a megapolitan city that is directly affected by LUCC. One of the impacts is urban flooding or what is known as pluvial floods.
Java Island, including Jakarta, is negatively correlated with the Dipole Mode Index, indicating high rainfall (Han, 2015). Jakarta experiences a monsoon type of rainfall pattern. Areas that have a very wide type of monsoon rainfall are found in Indonesia. These are areas that receive a high amount of rainfall in the monsoon season, frequently causing pluvial floods (Prasad Patraa et al., 2015). Pluvial floods are the main problem of flooding that occurs in Jakarta. Furthermore, LUCC is an inseparable part of the occurrence of pluvial floods in Jakarta. However, there has been no research regarding LUCC, which is related to the occurrence of pluvial floods in South Jakarta.
Jakarta is located in a tropical area. Tropical areas experience more heavy rain than high-latitude areas. The type of rain that occurs in Jakarta is convective rain. Cumulonimbus (Cb) clouds that occur generally cover a relatively small area so that heavy rains occur in a short time. The microphysical process of clouds is formed if at least three of the following conditions are met: the air contains sufficient water vapor; the presence of hygroscopic aerosols, which act as condensation nuclei; and lastly, updraft due to convection, orography, convergence, or fronts.
Research has been carried out to overcome the risk of pluvial flooding, including the implementation of sustainable drainage systems (SuDS) (Rubinato et al., 2020), the improvement of urban land planning and landscape design (Luo and Zhang, 2022), building a Pluvial Flood Index (PFI) (Pacetti et al., 2022), and unifying an early warning system and emergency response system (Yosua et al., 2023).
The ongoing urbanization, climate change, reductions in urban green space, and deteriorating urban water management infrastructure are further increasing pluvial flood risk (Pacetti et al., 2022). It should also be noted that stormwater flooding may occur from combined sewers and so actually be a mixture of stormwater and wastewater. Water quality will also begin to decline if more than 10% of the watershed area is impermeable (Farika et al., 2018).
The combination of a high proportion of impervious cover and routing of all storm runoff via a storm drainage network can lead to a much faster response and higher peak flows than would be caused by increases in impervious cover or change in land use alone (Miller et al., 2014). A study in the city of Rome evaluated how changes in land cover increase the vulnerability of the environment to rainwater runoff. To this end, three temporal scenarios (1954, 1967, and 2018) were analyzed in relation to land-cover evolution, and by applying hydrological–hydraulic models, flood maps were generated based on actual rainfall events, determining how flood risk changed as a result of increased urbanization (Recanatesi and Petroselli, 2020). For hydrological calculations, if extreme rainfall data are not obtained, daily data can be used to measure existing watershed discharges with the same period and pattern of rain distribution obtained from short-duration rainfall (Nonik Eko et al., 2018).
Another comparison regarding LUCC conducted in China shows that from 1977 to 2018, the impervious surface area of China’s impervious surfaces (IMPS) increased by 140.37%, of which 94.43% came from green spaces, 3% came from water bodies, and 2.57% came from urban vacant land (Luo and Zhang, 2022). In Bangladesh, it has been demonstrated that from 1990 to 2020 the highest LUCC classes were developed areas (31%) and cultivated lands (30,73%), while the most decreased LUCC was forest (26,88%) (Mehedi Hasan et al., 2023). This indicates that an increase in impervious surface occurs in all world cities.
The objective of this research was to determine the surface runoff coefficient value (C) caused by LUCC and the hazard risk of pluvial flooding in South Jakarta. Machine learning tools in GIS software were utilized to analyze LUCC and to determine the runoff coefficient value (C). Meanwhile, hazard risk analysis was conducted based on the guidelines from the Ministry of Public Works Regulation No. 12 of 2014.
Background
Jakarta has an area of 653.83 km2 with a population of 10,562,088 in 2020, according to the Jakarta Central Bureau of Statistics (BPS) data. The population growth rate in South Jakarta was attained based on the census from 2010 to 2018, which found that it was 1.00% per year (BPS DKI Jakarta, 2020). The population density in Jakarta has reached 15,906/km2, and the region consists of five administrative cities.
Figure 1 presents the frequency, depth, and duration of floods in Jakarta. Based on the pattern of the total frequency in Jakarta Province, the pattern of South Jakarta can represent the entirety of pluvial floods in Jakarta. In addition, the duration of inundation handling has been improved since the period of 2016–2021. The amount of annual rainfall (mm/year) is lower every year at Kemayoran station than at South Tangerang station. This result indicates that, atmospherically, the higher terrain in the southern part of Jakarta experiences more rainfall events compared to other areas located on lower terrains. The depth of the floods also follows the existing rainfall pattern; that is, a greater pluvial flood depth is observed when an area has higher rainfall.
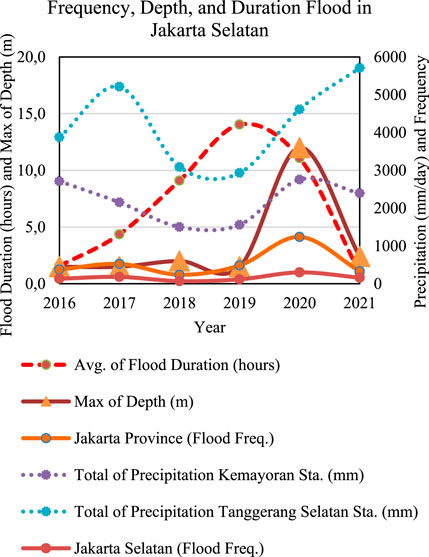
FIGURE 1. Frequency, depth, and duration of floods in Jakarta (2016–2022).
South Jakarta is a prospective economic area, government area, representative area of foreign countries, and transit-oriented development (TOD) area (Database Peraturan, 2014), meaning that it requires an inundation mitigation system. An inundation mitigation system is expected to be able to reduce flood heights and flood durations via both structural and non-structural approaches. One non-structural approach is to use a flood device; nevertheless, in order to enhance the flood device, the relationship between LUCC and the risk of pluvial flooding in South Jakarta should be determined.
Methodology
Figure 2 displays the research methodology for this study. The research methodology uses linear regression classification of LUCC using GIS software and carries out hazard and risk analysis using the guidelines from the Ministry of Public Works Regulation Number 12 of 2014. After gathering flood data dating from 2016 to 2021, the selected data of locations prone to pluvial flooding were analyzed for changes of land use and flood risk. The land-use data from the satellite Landsat 8 classified each type of land use. The run of coefficient (C) equivalent was the product of this analysis. Moreover, each of the 29 locations at risk of flooding was calculated; thus, every location was given a category index of risk. This category was plotted on a flood risk map. The correlation between these two analyses was found with one purpose, which is to reduce the pluvial flood risk in South Jakarta.
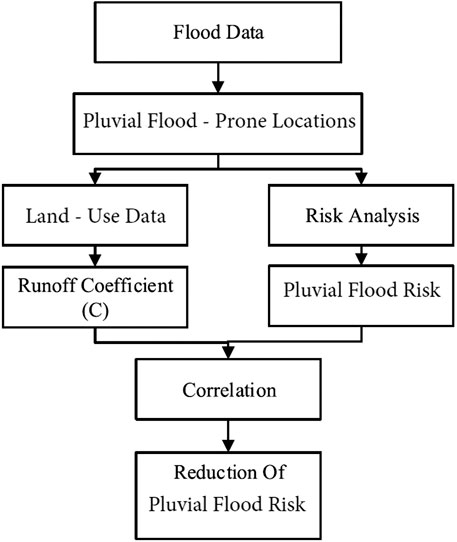
FIGURE 2. Research methodology.
There have been many studies supporting the development of the Jakarta flood prevention system, but there is not yet a proper alternative solution to solve the flood problems in Jakarta generated by sedimentation, solid waste, land subsidence, land-use change, and social problems (A Kesuma et al., 2021).
To determine the magnitude of the risk of pluvial flooding in an area, it is necessary to determine the flood discharge. Flood discharge estimation can be conducted via several methods, namely, the empirical method, the design flood hydrograph method, which is non-parametric, and the parametric statistical methods approach (Gadek et al., 2022). The empirical method was developed based on the characteristics of the watershed and the distribution of rain. There are several empirical methods, including the rational method, Mononobe, Weduwan, Haspers, and Melchior (Standar Nasional Indonesia, 2016). Compared to other methods, the rational method is a method that is very useful in hydrology, and it is specifically related to flows in urban areas (Peraturan Menteri Pekerjaan Umum Nomor 12/PRT/M/2014, 2014).
This study used the rational method and the synthesis unit hydrograph method for hydrological analysis prior to hydraulic analysis. The rational method mathematical equation is expressed in the form in this eq. (1):
where:
Q = Amount of maximum discharge (m3/s)
C = Runoff coefficient (0 ≤ C ≤ 1)
I = Rain intensity during TC (mm/hour)
A = Area of drainage area (km2)
Based on the rational method flood discharge formula, the higher the C value, the greater the flow rate flowing in a watershed. To simplify the calculation of a watershed, the C equivalent value was used, which is the C value that represents a watershed. The equivalent C value was obtained by multiplying the total C value by the area of a particular classification divided by the total watershed area, as shown in the following eq. (2):
Where:
A1 = land area with the type of ground cover I,
C1 = Coefficient of surface runoff type I soil cover,
N = Number of types of land cover.
A comprehensive evaluation or review of the capacity of the Jabodetabek flood management system was deemed to be required. The use of coupled hydrological and hydraulic models is considered one of the most widespread methodologies for mapping floods (Bruno et al., 2022). From this combination analysis, risk analysis can be approached.
The general basic formula for risk analysis (eq. 3) that was proposed in the Guidelines for Disaster Risk Mitigation Planning, which was prepared by the Indonesian National Disaster Management Agency (BNPB) (Regulation of the Head of BNPB Number 2 of 2012, 2012), is as follows:
where R is risk, H is hazard, V is vulnerability, and C is capacity.
Based on the results of the routing conducted in a study on the, it can be seen that the capacity of the reservoir is only able to accommodate floods due to 2-year and 5-year return period rains (Khamdani et al., 2020). The inability of micro-drainage to cover the incoming debit water appears to not only stem from the government’s traditional preference for engineered flood protection measures (Wannewitz and Garschagen, 2020). Meanwhile, flood hazards in several areas of Jakarta might be generated by the failure of hydraulic structures due to the increasing earthquake occurrence or strong solid waste drift (Sengara et al., 2008; Tri Nugraha et al., 2022). In most pilot areas, the existing measures could be assigned to the protection and prevention layers, while preparedness and recovery were less strongly developed (Karrasch et al., 2021).
One method to increase flood resilience is Flood Resilience Rose (Tri Nugraha et al., 2022). Flood Resilience Rose (FRR) is a management tool for promoting aligned action toward flood resilience in Europe and beyond. A flood risk map is the most relevant method for taking a decision on reducing the risk caused by past decisions on land-use planning. A flood risk map can prevent the increase of flood hazard risk as an implication of hazard awareness in land-use development, thus making it very important (Farid et al., 2020).
A flood risk map provides information in the form of the level of flood risk in an area. This map helps determine the appropriate steps and priorities for flood management in an area (Karrasch et al., 2021). For all of these potential improvements, there is a need for more lead time: time to prepare and disseminate more information; time for that information to be read and understood; time for support groups to mobilize and contact vulnerable people; and time for people to seek confirmatory information from multiple sources (Golding, 2009). Providing early warnings is an effective way to mitigate the negative impacts of flooding. When developing flood early warning systems (FEWS), a strong focus is generally put on the accuracy and reliability of the hydrological forecast (Kuller et al., 2021).
Another study discusses improving the FEWS by using rain predictions using the long short-term memory recurrent neural network (LSTM-RNN). The LSTM-RNN was utilized to predict discharge at the Dayeuhkolot hydrological station in the Upper Citarum River, West Java, Indonesia. This model could precisely forecast the discharge for the next two and 4 h with NSE and R2 more than 0.9 (Syahril Badri Kusuma et al., 2022).
Other research for technical aspects and non-technical aspects has shown that, for the technical aspect, the capacity system has the largest influence, with a determinant coefficient of 0.853, followed by puddle problems (0.127) and drainage patterns (0.07). For the non-technical aspects, socio-cultural and economic aspects have the greatest influence, with a determinant coefficient of 0.47, followed by flood losses (0.604), legal and regulatory aspects (0.306), institutional management (0.087), and public and private roles (0.0026) (Suprayogi et al., 2018).
Addressing the influence of LUCC on extreme river discharge in Indonesia has become common practice, as indicated by previous research (Kuntoro et al., 2017). To determine the development of LUCC in South Jakarta, the present research conducted an analysis of land cover change. One of the employed methods was the Environment for Visualizing Images (ENVI) software for 4-year and three-class image classification. Water, vegetation, and soil were analyzed to detect LUCC. The supervised maximum likelihood (MLH) method was used to classify the multispectral satellite images (Bhatti et al., 2019).
One type of problem that can be solved by applying machine learning is that of classification, which is used to identify the category to which an object belongs. With numerous data based on picture satellite data, machine learning will forecast whether it will rain or not in one area (Sodhi et al., 2019). A geographic information system (GIS) provides a flexible environment for collecting, storing, displaying, and analyzing the digital data necessary for LUCC detection (Bhatti et al., 2019).
Results and discussion
Previous research and reports were used in this study to categorize the causes of flooding in Jakarta. The categories can be divided into the following:
1. Lack of macro-channel capacity
The carrying capacity of the river is insufficient, especially in meandering segments (Indrawati et al., 2018).
2. Lack of micro-drainage capacity
The habitual inundation areas, due to the spillover of urban drainage channels, are distributed across 79 locations. A study with HECRAS 4.1.0 showed that the micro-drainage system in Kelapa Gading is not effective in accommodating the inflow (Kusumawardhani et al., 2019).
3. Bad Sloop
More than 70% of the effect of groundwater extraction leads to land subsidence. One of damages caused by land subsidence is infrastructure damage (Abidin et al., 2015). Water is trapped in the channel at an area of slope loss so that it cannot flow normally by gravity.
4. Garbage/Sedimentation/Utility network
Plastic debris has a fundamentally different behavior to rigid wooden sticks and poses an additional flood risk in urban areas (Honingh et al., 2020). Moreover, with the rapid development of a city, the utility network worsens the distribution of water in the micro-drainage.
5. Sea backwater (ROB)
Climate change phenomena contribute to the rise in sea level, causing sea backwater (ROB). In Jakarta bay, the inundation area increased by 29.68 km2 (7.1%), with a sea level rise of 0.6 m (Martin et al., 2019).
Table 1 summarizes the causes of floods in Jakarta Province from 2016 to 2021. Based on the collected data from the Water Resources Agency of Jakarta, 3,195 inundation events occurred from 2016 to 2021. The data were then selected for the floods that happened more frequently than three times a year at one flood location. In total, 129 flood locations were detected in Jakarta. Furthermore, each flood location was categorized according to five main causes, as explained in Table 1.
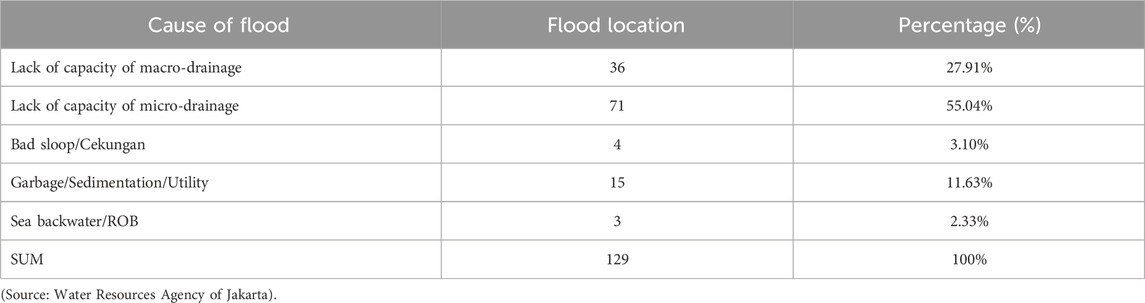
TABLE 1. Causes of floods in 2016–2021 in Jakarta Province.
From Table 1, it can be inferred that flooding is caused by the lack capacity of the micro-drainage system, which dominates in all five categories. With a total of 71 cases (55.43%) can be attributed to this cause. Thus, the issue of micro-drainage failure presents a new insight into pluvial flooding in Jakarta for future research.
In terms of location, pluvial floods generally occur in the middle of cities, in connection with urban land planning such as settlements, flyovers, underpasses, and infrastructure connected to small channels. This is different from fluvial floods, which occur along riverbanks. Pluvial flooding also occurs more frequently than fluvial flooding, which might lead to comparative or higher economic risk (Tanaka et al., 2020).
Pluvial flooding presents comparable economic risk to fluvial flooding. Indeed, flood risk within the central economic district was found to be much higher from pluvial flooding compared to fluvial flooding (Tanaka et al., 2020). Many cities consequently now rely on aging drainage systems built in the 19th and 20th centuries that are now, with an increasing urban landscape and a changing climate, incapable of managing the current urban pluvial flood risk (Hamdany et al., 2023).
The rapid onset or rapid rate of rise in level and discharge can therefore be considered the principal defining feature to distinguish from “normal” floods and can equally be applied to river floods as it is to surface water or pluvial floods (Adiguna et al., 2023). Risk mitigation by using an early warning system is very difficult to perform in pluvial floods, in contrast to the use of an early warning system in fluvial floods, which has been frequently achieved; this is due to the very rapid rise in flood water levels in urban areas (Golding, 2009).
Moreover, 29 flood event locations have been found in the South Jakarta area. These 29 flood locations are the focus of this research. It has been found that most of the pluvial floods in South Jakarta occurred in the Krukut River Basin (DAS).
Data analysis for changes in land use can be carried out by means of land-use classification using the ArcGIS software (Syarifudin et al., 2022). The processing of land-use classification entails using a comparison of two pieces of satellite imagery data at different times. In this study, two pieces of Landsat 8 satellite photo data capturing 13 September 2014 and 24 May 2020 were used on. The two satellite photos are displayed in Figure 3.
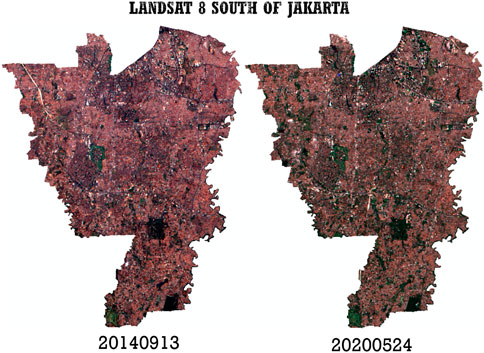
FIGURE 3. Map of South Jakarta using Landsat 8 satellite photo data on 13 September 2014 and 24 May 2020.
The land-use classification process is carried out using machine learning provided by ArcGIS (Hamdany et al., 2022). The machine learning used is supervised learning, so it requires data that need to be trained (data train) so that the software can classify unknown data by imitating examples of data entered in the data train. This study used 10 to 20 data trains for each land-use classification in South Jakarta, which has an area of 130 km2. The principle of using supervised learning is that the more train data are included, the more accurate the resulting linear regression will be.
Figure 4 shows land-use classifications in South Jakarta in 2014 and 2020. The linear regression relationship between 2014 and 2020 for land-cover classification in South Jakarta was analyzed to determine whether there were increases or decreases in the five types of land-use classifications, those being residential area, commercial area, streets, parks and cemeteries, and rivers and lakes. Data were taken from the five classifications and trained. As an example, for the classification of rivers and lakes from satellite images from 2014 to 2020, the area in the Ciliwung River water body was taken as an example; to 20 areas were used as train data. Then, via ArcGIS, machine learning methods were employed to train the data, using linear regression to obtain a total area that resembled a river. From the ArcGIS calculations, the percentage of area out of the total area of South Jakarta (130 ha) in 2014 in the rivers and lakes category was 3% (3.9 ha).
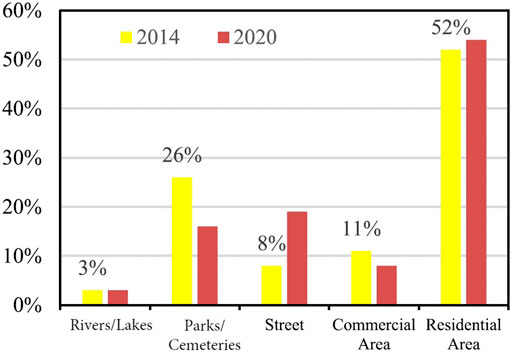
FIGURE 4. South Jakarta land-cover classification in 2014 and 2020.
Figure 5 display the comparison of land-use classification and Landsat 8 equivalent C values. As shown in Figure 5, there was an increase of residential areas from 7,538 ha in 2014–7,842 ha in 2020. This was followed by the decrease of rivers and lakes areas from 3,724 ha in 2014–2,256 ha in 2020. It also shows the calculation of the C equivalent value for both 2014 and 2020.
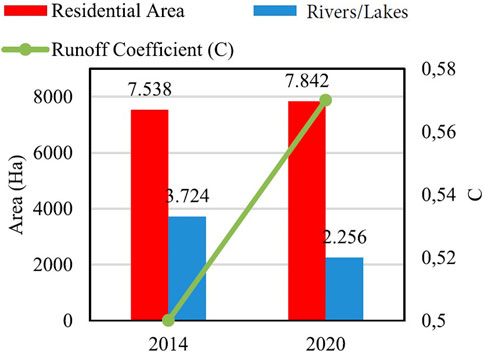
FIGURE 5. Graph of comparison of land-use classification and Landsat 8 equivalent C values.
Based on Figure 5, the percentage of built-up area and green land was calculated. The percentage of built-up land area is 81.87%, while the percentage of green land is 15.56%. However, as for the existence of open space, it still does not meet the regulatory standards, namely, 30%.
To validate the classification of the land-use data shown in Figure 5, land-use data obtained from the DKI Jakarta Provincial Citata Service were used. The secondary data obtained were the result of surveyor measurements in 2018 and 2021. Figure 6 shows the comparison of the land-use data in the 2 years.
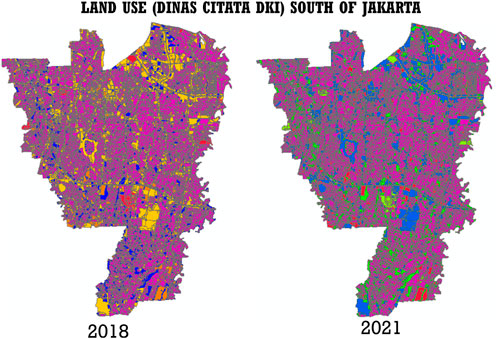
FIGURE 6. Map of South Jakarta land-use measurement data from the CITATA Prov. DKI Jakarta in 2018 and 2021.
For simplification in this study, only five types of classification were used: residential, special, socio-cultural, business, and other uses. The coefficients used were as described above regarding the classification using Landsat 8 satellite data. A comparison graph using this data is shown in Figure 7.
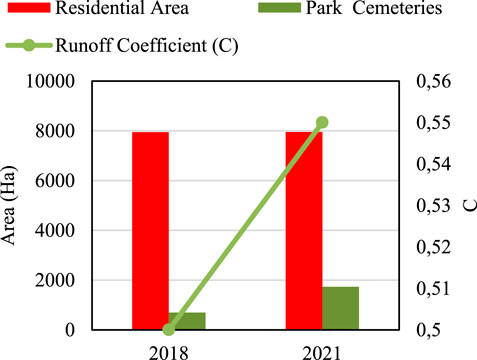
FIGURE 7. Graph of comparison of land-use classification and the value of C equivalent; CITATA Service Prov. DKI Jakarta.
Listed below are the main findings in this study after validation was carried out with data from the CITATA Prov. DKI Jakarta on LANDSAT 8 satellite imagery. These data show compatibility:
1. There was an increase in the C value of 1%–1.3% per year in the South Jakarta area.
2. The rate of increase in the surface runoff coefficient (C) was the same as the population growth rate of Jakarta, which was around 1.3% per year.
3. The South Jakarta C flow coefficient values were between 0.51 and 0.57.
The variables that affect risk include threat (hazard), vulnerability (vulnerability), and capacity (capacity). This study has only focused on the impact of pluvial hazard flooding on vehicles; it did not consider buildings and people. This is because in pluvial floods, the impact on vehicles—cars, buses, trucks, and motorbikes—is greater than the damage to buildings. The sub-variables in determining the risk index based on the hazard, according to the latest regulations (Peraturan Menteri Pekerjaan Umum Nomor 12/PRT/M/2014, 2014), are shown in Table 2.
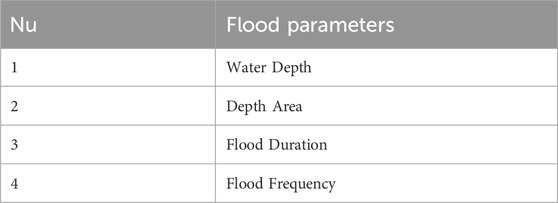
TABLE 2. Table of hazard index categories based on Permen PUPR 12 tahun 2014.
The second finding of this study was that two locations had moderate levels, according to hazard risk analysis, which are listed in Table 2. Meanwhile, the other area was at a low risk level. The two locations with moderate levels were Seskoal Ciledug and Dharmawangsa Taman Gajah. The risk map based on hazard risk is shown in Figure 8.
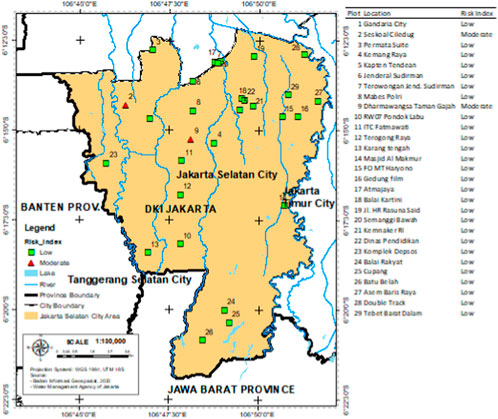
FIGURE 8. Hazard pluvial map in South Jakarta.
Conclusion
Pluvial floods in Jakarta dominate flood events in Jakarta, with a total of 29 pluvial flood locations detected in South Jakarta. The growth of the runoff coefficient (C) in South Jakarta is 1%–1.3% per year; thus, the increase rate in the surface runoff coefficient (C) is the same as the population growth rate of Jakarta, which is around 1.3% per year. The runoff coefficient (C) equivalent in South Jakarta is 0.57.
Two locations with a moderate level on the hazard risk index were found, namely, Ciledug Seskoal and Dharmawangsa Taman Gajah. Meanwhile, the other locations show a low risk to pluvial flooding hazard. The increasing runoff coefficient also increases the risk of pluvial flooding in locations that are prone to flooding. Further studies are needed to solve the pluvial flooding problem by means of countermeasures in urban planning. This study can be used by government agencies as a basis to construct a spatial prioritization framework for pluvial flood mitigation.
Data availability statement
The original contributions presented in the study are included in the article/Supplementary Material, further inquiries can be directed to the corresponding author.
Author contributions
HY: Writing–original draft. MB: Writing–review and editing. JN: Writing–review and editing.
Funding
The author(s) declare that no financial support was received for the research, authorship, and/or publication of this article.
Acknowledgments
This study aims to determine the runoff coefficient value (C) caused by LUCC and the hazard risk of pluvial flooding in South Jakarta using inundation data dated to 2016–2021. The authors would like to thank the Water Resources Agency of Jakarta regarding the data collection required for this article. Furthermore, the authors would also like to express their gratitude to the Water Resources Engineering Research Group of the Faculty of Civil and Environmental Engineering, Institut Teknologi Bandung, for supporting this publication.
Conflict of interest
The authors declare that the research was conducted in the absence of any commercial or financial relationships that could be construed as a potential conflict of interest.
Publisher’s note
All claims expressed in this article are solely those of the authors and do not necessarily represent those of their affiliated organizations, or those of the publisher, the editors and the reviewers. Any product that may be evaluated in this article, or claim that may be made by its manufacturer, is not guaranteed or endorsed by the publisher.
References
Abidin, H. Z., Andreas, H., Gumilar, I., and Brinkman, J. J. (2015). Study on the risk and impacts of land subsidence in Jakarta. Int. Assoc. Hydrological Sci. 372, 115–120. doi:10.5194/piahs-372-115-2015
Adiguna, G. A., Wijaya, M., Rahardjo, P. P., Sugianto, A., Satyanaga, A., and Hamdany, A. H. (2023). Practical approach for assessing wetting-induced slope failure. Appl. Sci. 13 (3), 1811. doi:10.3390/app13031811
A Kesuma, T. N., Farid, M., Kusuma, M. S. B., and Kuntoro, A. A. (2021). Contribution of Manggarai gate improvement to flood in Manggarai Village based on recorded flood event. IOP Conf. Ser. Earth Environ. Sci. 737, 012027. doi:10.1088/1755-1315/737/1/012027
Bhatti, N. B., Ali Siyal, A., Abdul Latif, Q., and Imtiaz, A. B. (2019). Land covers change after small dam’s construction based on the satellite data. Civ. Eng. J. doi:10.28991/cej-2019-03091290
BPS DKI Jakarta (2020). Perkembangan jumlah penduduk menurut jenis kelamin dan kabupaten kota di Provinsi DKI Jakarta hasil sensus penduduk (jiwa), 2000-2020. Available at: https://jakarta.bps.go.id/indicator/12/1279/1/perkembangan-jumlah-penduduk-menurut-jenis-kelamin-dan-kabupaten-kota-di-provinsi-dki-jakarta-hasil-sensus-penduduk.html.
Bruno, L. S., Souza Mattos, T., Tarso Sanches Oliveira, P., Bicca Rodrigues, D. B., and Rodrigues, D. B. B. (2022). Hydrological and hydraulic modeling applied to flash flood events in a small urban stream. Hydrology 9, 223. doi:10.3390/hydrology9120223
Database Peraturan (2014). DKI Jakarta provincial regulation number 1 of 2014, “detailed spatial planning and zoning regulations (rencana detail tata ruang dan peraturan zonasi)”.
Farid, M., Gunawan, B., Badri Kusuma, M. S., Habibi, S. A., and Yahya, A. (2020). Assessment of flood risk reduction in bengawan solo river: a case study of sragen regency. Int. J. GEOMATE 18 (70), 229–234. doi:10.21660/2020.70.18010
Farika, N., Sutjiningsih, D., and Anggraheni, E. (2018). Influence of impervious cover determination method of upper Ciliwung watershed on flood warning system level change in Katulampa weir. Matec Web Conf. 192, 02053. doi:10.1051/matecconf/201819202053
Gadek, W., Baziak, B., Tokarczyk, T., and Szalinska, W. (2022). A novel method of design flood hydrographs estimation for flood hazard mapping. Water. doi:10.3390/w14121856
Golding, B. W. (2009). Long lead time flood warnings: reality or fantasy. Meteorol. Appl. 16, 3–12. doi:10.1002/met.123
Hamdany, A. H., Shen, Y., Satyanaga, A., Rahardjo, H., Lee, T. T. D., and Nong, X. (2022). Field instrumentation for real-time measurement of soil-water characteristic curve. Int. Soil Water Conservation Res. 10 (4), 586–596. doi:10.1016/j.iswcr.2022.01.007
Hamdany, A. H., Wijaya, M., Satyanaga, A., Rahardjo, H., Zhai, Q., Lim, A., et al. (2023). Numerical simulation on the effect of infiltration and evapotranspiration on the residual slope. Sustainability 15 (11), 8653. doi:10.3390/su15118653
Han, S. L. (2015). General rainfall patterns in Indonesia and the potential impacts of local seas on rainfall intensity. Water 7, 1751–1768. doi:10.3390/w7041751
Honingh, D., Tim van Emmerik, , Uijttewaal, W., Kardhana, H., Olivier, H., and Nick van de Giesen, (2020). Urban River water level increase through plastic waste accumulation at a rack structure. Frontiers 8. doi:10.3389/feart.2020.00028
Indrawati, D., Hadihardaja, I. K., Bagus Adityawan, M., Pahrizal, S. F., and Taufik, F. (2018). Diversion canal to decrease flooding (case study: kebon JatiKalibata segment, Ciliwung River Basin). MATEC Web Conf. 147, 03006. doi:10.1051/matecconf/201814703006
Karrasch, L., von Ossietzky, C., and Klenke, T. (2021). The “Flood Resilience Rose”: a management tool to promote transformation towards flood resilience. J. Flood Risk Manag. 14, e12726. doi:10.1111/jfr3.12726
Khamdani, R., Sutjiningsih, D., and Anggraheni, E. (2020). Effectivity of micro drainage system as part of macro drainage system: a case study of Kelapa Gading, North Jakarta. Earth Environ. Sci. 426, 012011. doi:10.1088/1755-1315/426/1/012011
Kuller, M., Schoenholzer, K., and Lienert, J. (2021). Creating effective flood warnings: a framework from a critical review. J. Hydrology 602, 126708. doi:10.1016/j.jhydrol.2021.126708
Kuntoro, A. A., Putro, A. W., Kusuma, M. S. B., and Natasaputra, S. (2017). The effect of land use change to maximum and minimum discharge in Cikapundung river basin. AIP Conf. Proc., 100011–100017. doi:10.1063/1.5011621
Kusumawardhani, A., Sutjiningsih, D., and Anggraheni, E. (2019). Effectivity of micro drainage system as part of macro drainage system: a case study of Kelapa Gading, North Jakarta. MATEC Web Conf. 276, 04021. doi:10.1051/matecconf/201927604021
Luo, K., and Zhang, X. (2022). Increasing urban flood risk in China over recent 40 years induced by LUCC. Landsc. Urban Plan. 219, 104317. doi:10.1016/j.landurbplan.2021.104317
Martin, Y., He, Z., Xia, Y., and Li, L. (2019). Impacts of sea level rise and river discharge on the hydrodynamic. Water. doi:10.3390/w11071384
Mehedi Hasan, Md, Nilay, Md S. M., Hossain Jibon, N., and Rahman, R. M. (2023). LULC changes to riverine flooding: a case study on the Jamuna River, Bangladesh using the multilayer perceptron model. Results Eng. 18, 101079. doi:10.1016/j.rineng.2023.101079
Miller, J. D., Kim, H., Kjeldsen, T. R., Packman, J., Grebby, S., and Dearden, R. (2014). Assessing the impact of urbanization on storm runoff in a peri-urban catchment using historical change in impervious cover. J. Hydrology” 515, 59–70. doi:10.1016/j.jhydrol.2014.04.011
Nonik Eko, W. T., Sutjiningsih, D., and Anggraheni, E. (2018). The influence of land use change and spatial discretizationof middle - lower Ciliwung sub-watershed on flood hydrograph at manggarai weir: a preliminary. Int. J. Eng. Technol. doi:10.14419/ijet.v7i2.8.10492
Pacetti, T., Cioli, S., Castelli, G., Bresci, E., Pampaloni, M., Pileggi, T., et al. (2022). Planning Nature Based Solutions against urban pluvial flooding in heritage cities: a spatial multi criteria approach for the city of Florence (Italy). J. Hydology 41, 101081. doi:10.1016/j.ejrh.2022.101081
Patel, S. K., Verma, P., and Singh, G. S. (2019). Agricultural growth and land use land cover change in peri-urban India. Environ. Monit. Assess. 191, 600. doi:10.1007/s10661-019-7736-1
Peraturan Menteri Pekerjaan Umum Nomor 12/PRT/M/2014 (2014). Penyelenggaraan sistem drainase perkotaan.
Prasad Patraa, J., Kumara, R., and Maniba, P. (2015). Combined fluvial and pluvial flood inundation modelling for a project site. Procedia Technol. doi:10.1016/j.protcy.2016.05.014
Recanatesi, F., and Petroselli, A. (2020). Land cover change and flood risk in a peri-urban environment of the metropolitan area of Rome (Italy). Water Resour. Manag. 34, 4399–4413. doi:10.1007/s11269-020-02567-8
Regulation of the Head of BNPB Number 2 of 2012 (2012). General guidelines for disaster risk assessment (pedoman Umum pengkajian resiko bencana).
Rubinato, M., Craig, L., and Goerke, M. (2020). “Advances in experimental modelling of urban flooding,” in Water-wise cities and sustainable water systems: concepts, technologies, and applications (London, England: IWA Publishing), 235–257.
Sengara, I. W., Latief, H., and Kusuma, S. B. (2008). Probabilistic seismic and tsunami hazard analysis for design criteria and disaster mitigation in rehabilitation and reconstruction of a coastal area in city of Banda Aceh, 224–230. doi:10.1007/978-3-540-79846-0_19
Sodhi, P., Awasthi, N., and Sharmac, V. (2019). “Introduction to machine learning and its basic application in Python,” in Proceedings of 10th International Conference on Digital Strategies for Organizational Success, Gwalior, Madhya Pradesh, January, 2019. doi:10.2139/ssrn.3323796
Suprayogi, H., Bisri, M., Limantara, L. M., and Andawayanti, U. (2018). Service index modeling of urban drainage network. Int. J. GEOMATE 15 (50), 95–100. doi:10.21660/2018.50.04204
Syahril Badri Kusuma, M., Kardhana, H., Suryadi, Y., and Wira Rohmat, F. I. (2022). Hourly discharge prediction using long short – term memory recurrent neural network (LSTM-RNN) in the upper Citarum River. Int. J. GEOMATE 23 (98), 147–154. doi:10.21660/2022.98.3462
Syarifudin, A., Satyanaga, A., Wijaya, M., Moon, S.-W., and Kim, J. (2022). Sediment transport patterns of channels on tidal lowland. Fluids 7 (8), 277. doi:10.3390/fluids7080277
Tanaka, T., Kiyohara, K., and Tachikawa, Y. (2020). Comparison of fluvial and pluvial flood risk curves in urban cities derived from a large ensemble climate simulation dataset: a case study in Nagoya, Japan. J. Hydrology 584, 124706. doi:10.1016/j.jhydrol.2020.124706
Tri Nugraha, A. K., Muhammad Syahril, B. K., Farid, M., Arno, A. K., and Rahayu, H. P. (2022). An assessment of flood hazards due to the breach of the manggarai flood gate. Int. J. GEOMATE 23 (95), 104–111. doi:10.21660/2022.95.3055
Wannewitz, M., and Garschagen, M. (2020). Interactive comment on Mapping the adaptation solution space – lessons from Jakarta for other coastal cities. Nat. Hazards Earth Syst. Sci. Discuss. doi:10.5194/nhess-2020-370
Keywords: pluvial floods, South Jakarta, land use cover change, runoff coefficient, hazard risk
Citation: Yosua H, Kusuma MSB and Nugroho J (2024) An assessment of pluvial hazard in South Jakarta based on land-use/cover change from 2016 to 2022. Front. Built Environ. 9:1345894. doi: 10.3389/fbuil.2023.1345894
Received: 28 November 2023; Accepted: 18 December 2023;
Published: 15 January 2024.
Edited by:
Alfrendo Satyanaga, Nazarbayev University, KazakhstanReviewed by:
Martin Wijaya, Parahyangan Catholic University, IndonesiaAbdul Halim Hamdany, University of Indonesia, Indonesia
Copyright © 2024 Yosua, Kusuma and Nugroho. This is an open-access article distributed under the terms of the Creative Commons Attribution License (CC BY). The use, distribution or reproduction in other forums is permitted, provided the original author(s) and the copyright owner(s) are credited and that the original publication in this journal is cited, in accordance with accepted academic practice. No use, distribution or reproduction is permitted which does not comply with these terms.
*Correspondence: Horas Yosua, aG9yYXN5b3N1YTg1QGdtYWlsLmNvbQ==