 A. C. Bradley
 M. B. Jaksa*
- School of Civil, Environmental and Mining Engineering, University of Adelaide, Adelaide, SA, Australia
Rolling dynamic compaction (RDC) technology utilises a heavy non-circular module (impact roller) to compact the underlying soil dynamically. The stresses imparted to the soil through this technique and the resulting vibrations, have been the subject of investigation in the field. A finite element (FE) model predicting the settlement and densification of a coarse-grained fill material subject to RDC with a BH-1300 4-sided 8 tonne impact roller has been shown to provide good agreement with that observed in the field. This paper presents estimates using the developed FE model for the peak particle velocity and acceleration, and the maximum stresses applied through each impact upon a coarse-grained soil. Distributions of the results and their empirical formulae are presented herein.
1 Introduction
Rolling dynamic compaction (RDC) technology involves the use of a heavy non-cylindrical rolling module incorporating 3, 4 or 5 sides. The module is typically towed at a speed of 10–12 km/h. The module consequently pivots about its corners to impact the soil along its face. Through this technique, a substantial amount of energy is delivered to the ground with each impact. Imparting stress and vibration, RDC can be utilised to improve the bearing capacity of underlying soils at depth for a specified number of passes
Within the literature, the maximum vertical stress applied, and the in-situ vibration of the soil, have been modestly investigated in the field. These were carried out with the use of Earth pressure cells (EPCs) and in-situ accelerometers, as summarised in Table 1.
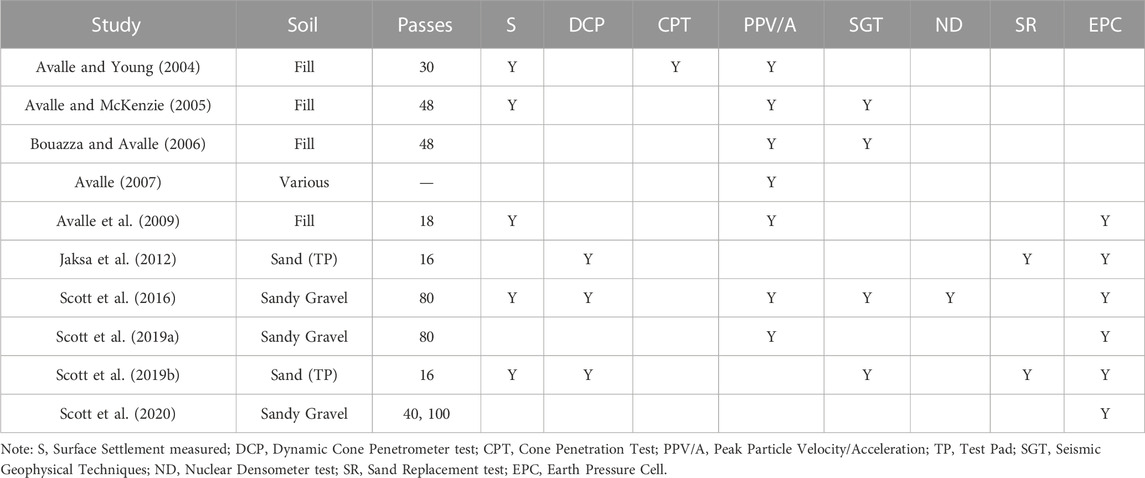
TABLE 1. Studies of 4-sided impact roller reporting PPA, PPV, and in-situ stress history.
In their field investigations using EPCs at 0.7 and 1.1 m depth, respectively, Scott et al. (2016) and Scott et al. (2019a) reported a significant range of estimates for the peak vertical stress less the initial overburden, and the PPA at depth, as summarised in Table 2. The significant variability of the stress and PPA measured by Scott et al. (2016) and Scott et al. (2019a) is likely borne from a combination of factors, including but not limited to: sampling frequency and resolution, and the kinematic behaviour of the roller whereby the roller may engage in erratic “skipping motion.” Further, the first 50 passes appear to be markedly lower, inferring that the response is, understandably, dependent on the progression of the densification of the subsoil.
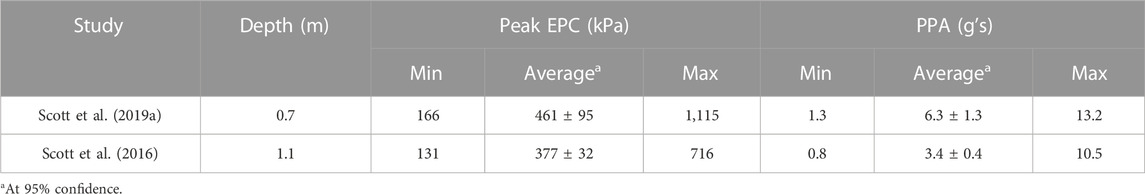
TABLE 2. Summary of peak ground response study per pass by Scott et al. (2016) and Scott et al. (2019a).
Research on the ground vibrations along the surface due to RDC is exclusive to that presented by Avalle (2007), as shown in Figure 1, where the surface vibration with respect to distance, across a variety of site conditions and literature, is presented. Moreover, Avalle (2007) presented the results with reference to “safe” levels of vibration as specified by the BS 7385-2: 1993 (British Standards, 1993) and DIN 4150-3: 1999 (Deutsche Norm, 1999) standards.
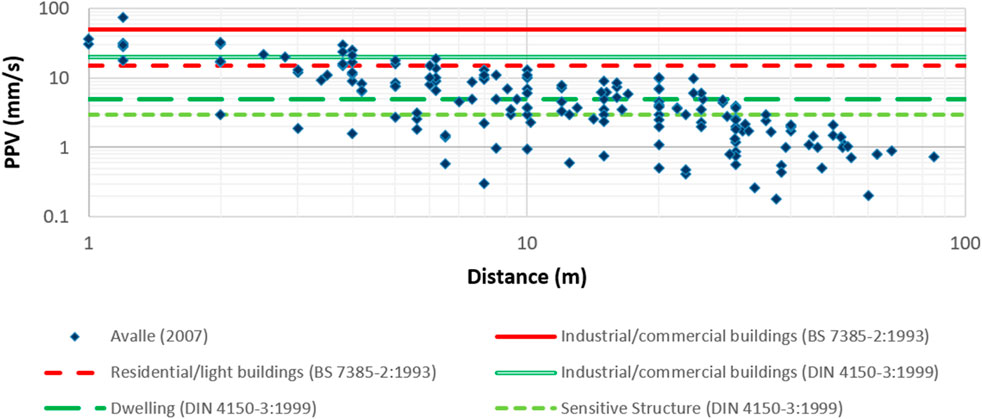
FIGURE 1. Vibration results for 25 case study sites (after Avalle, 2007).
Subject to initial conditions and limitations, a finite element (FE) model can provide insight to the distribution and magnitude of the effectiveness of RDC on an underlying soil. In their effort to investigate the effectiveness of RDC, with a BH-1300 4-sided 8-tonne impact roller, Bradley et al. (2023) developed a FE model, using LS-DYNA (LSTC, 2015), that reproduced, with good agreement, the settlement and densification of a coarse-grained soil. Following their methodology, the kinematics and energy of the roller are representative of typical motion as observed in the field by Bradley et al. (2019).
This paper aims to explore the peak ground response of RDC of the BH-1300 4-sided 8-tonne impact roller using the FE model presented by Bradley et al. (2023). Firstly, estimates for the peak cartesian stresses, and mean pressure are presented, including the horizontal distribution of the peak vertical stress. Secondly, the PPA and PPV are examined, initially with respect to depth, and then for along the soil surface. The model predictions are benchmarked against field measurements available within the literature.
2 Methodology
A FE analysis is performed, using LS-DYNA, involving the 4-sided 8-tonne impact roller undertaking
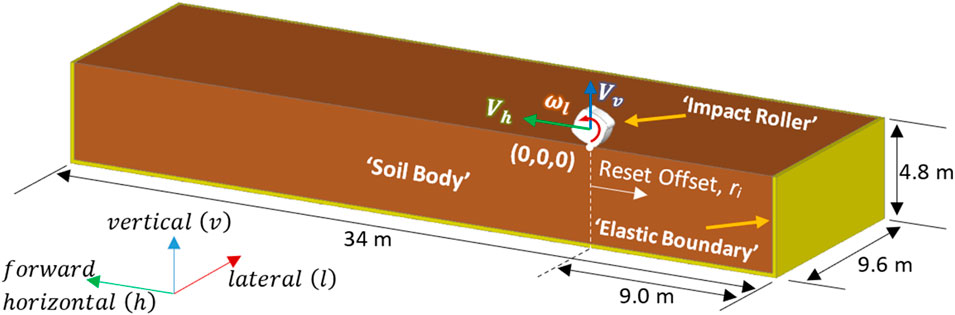
FIGURE 2. Global model layout in LS-DYNA (Bradley et al., 2023).
Bradley et al. (2023) examined the numerical efficacy of two FE mesh resolutions, namely,
As explained by Bradley et al. (2023), at the beginning of each subsequent pass, the module is returned to the start of the lane, with respect to the initial position of the roller in Figure 2. To distribute the disturbance of the surface soils upon dropping of the module during the resetting phase, and to simulate the somewhat random positioning of the roller that occurs in the field, a variable reset offset
As also explained by Bradley et al. (2023), a constant downward vertical loading (
The characteristics of the soil adopted in the FE model is identical to that specified by Bradley et al. (2023), from their field trial, reproduced in Table 3; however, in order to model a coarse-grained soil with no fines content, i.e., a cohesionless material, effective cohesion
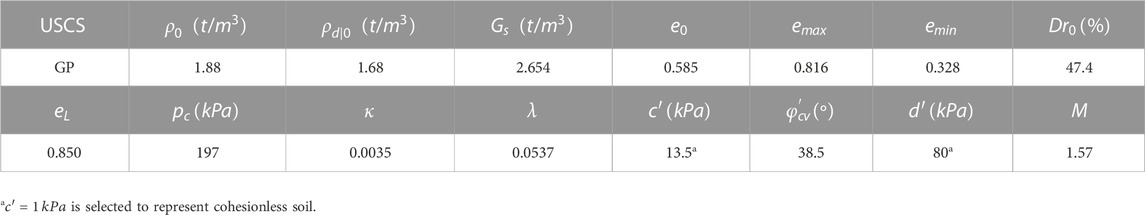
TABLE 3. Summary of geotechnical parameters for fill material (Bradley et al., 2023).
3 Results
A multiple pass scenario for
In the sub-sections that follow, firstly, results of the in-situ peak cartesian stresses are presented in Section 3.1 against field observations available in the literature. Subsequently, in Section 3.2, the resulting ground vibration at depth, in terms of the PPV and PPA, are examined. Finally, in Section 3.3, the ground vibration along the soil surface is assessed with respect to lateral distance from the centreline of the target lane
3.1 Peak applied in-situ stress
The peak applied in-situ stress is the peak stress less the initial stress at rest. The resulting peak applied vertical stress
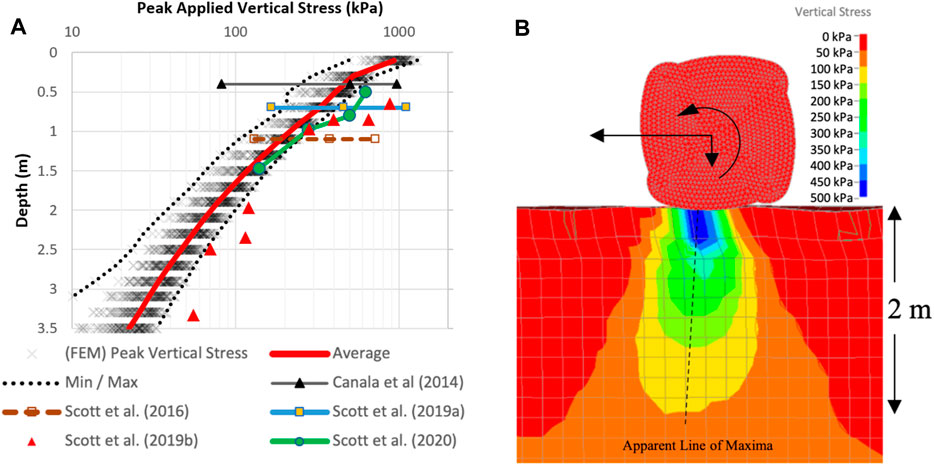
FIGURE 3. Peak vertical stresses: (A) Applied vertical stress
The average of
Additionally,
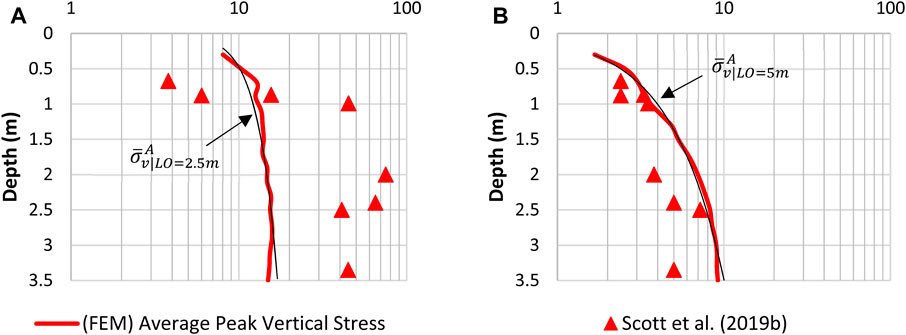
FIGURE 4. Peak applied vertical stress
The distribution of
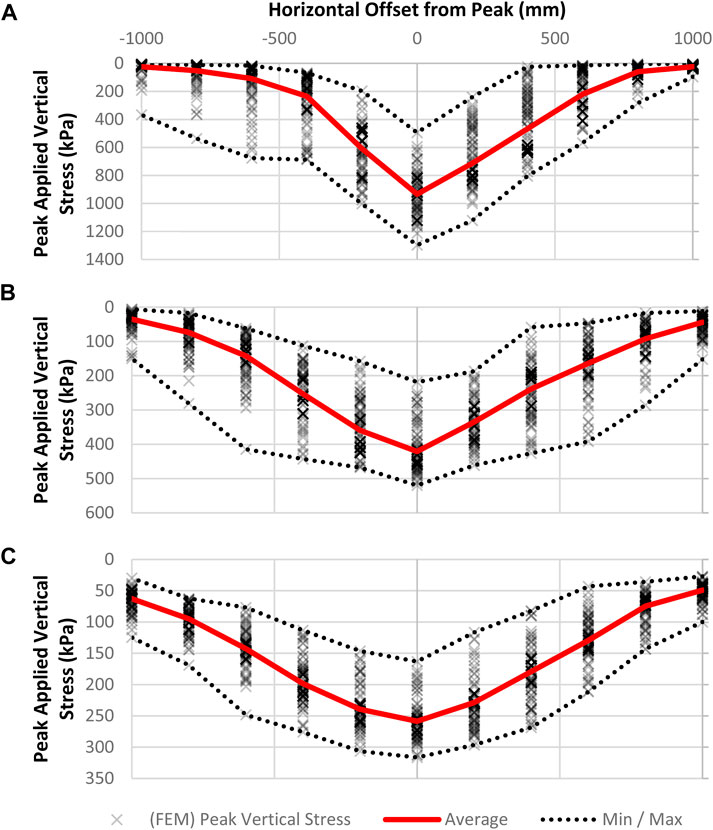
FIGURE 5. Horizontal distribution of peak in-situ applied vertical stress with each impact: (A) 0.1 m depth; (B) 0.5 m depth; and (C) 0.9 m depth.
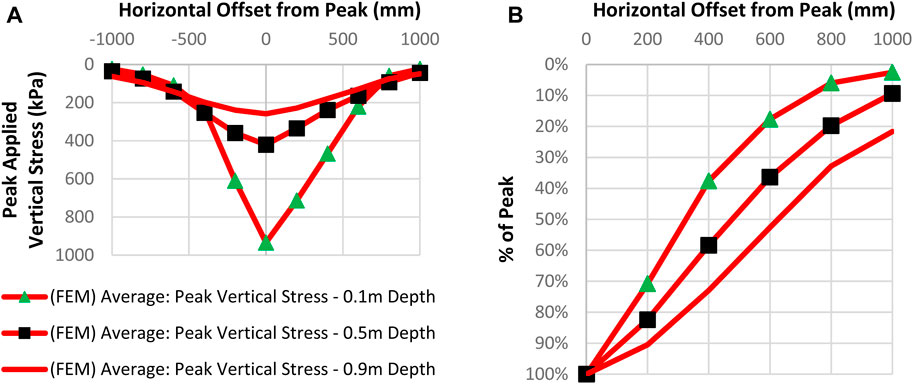
FIGURE 6. Distribution of average peak applied vertical stress: (A) Along the horizontal; and (B) Along the horizontal with respect to horizontal offset from the peak.
Although
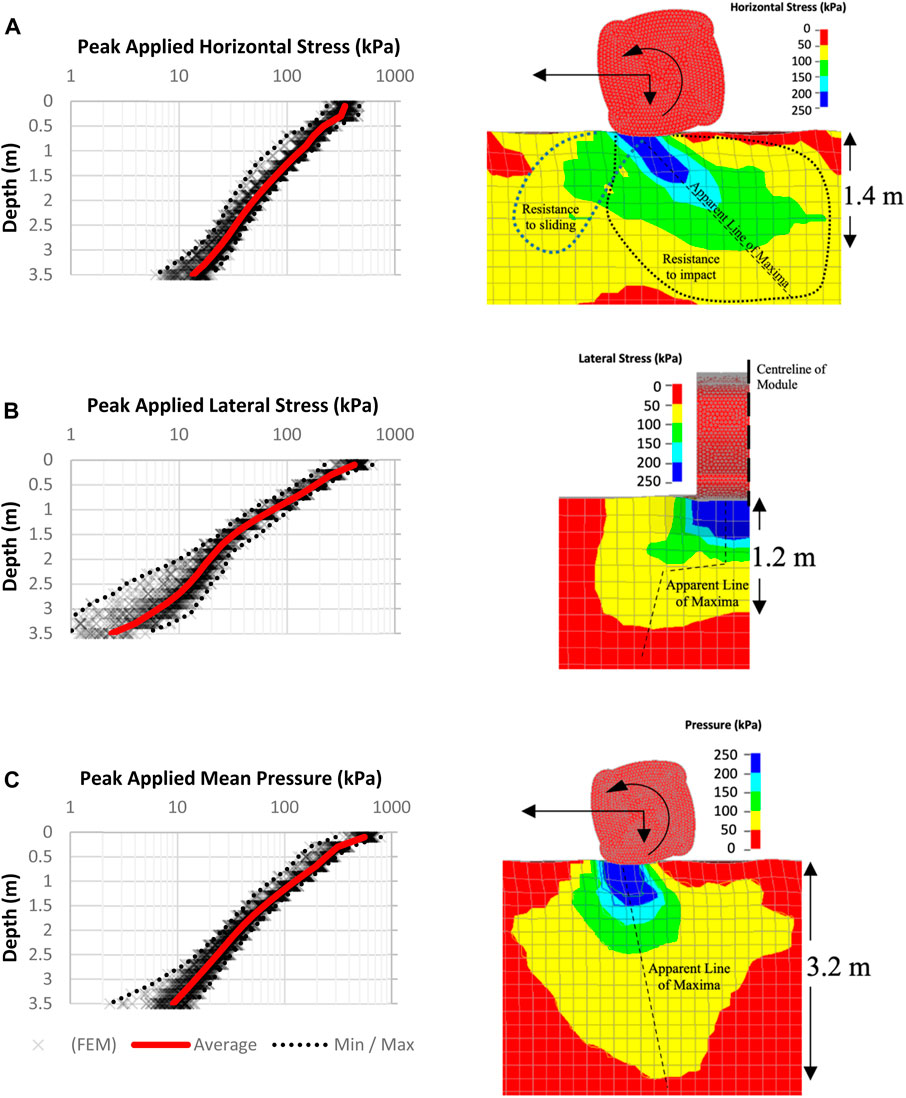
FIGURE 7. Summary of peak in-situ applied stresses and their typical distributions during impact: (A)
A feature of RDC is the disturbance of the near surface soils as the roller shears and dilates the surface material. Namely, this is a product of the magnitude of the shear stress applied through each impact exceeding the capacity of the soil to resist. Figure 8 presents the typical distribution of the maximum principal deviatoric stress through each impact.
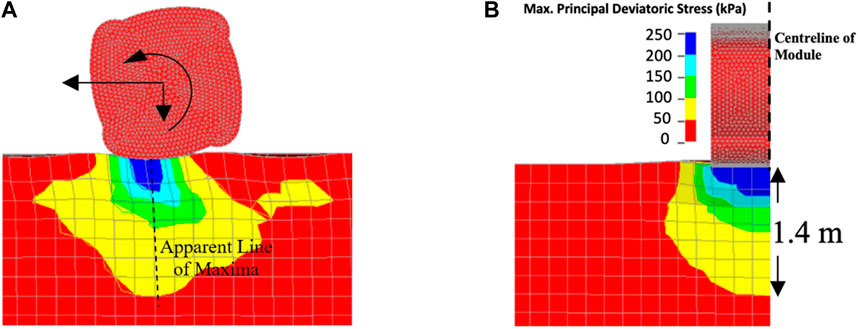
FIGURE 8. Typical distributions of maximum principal deviatoric stresses during impact: (A) horizontal; and (B) lateral.
3.2 Vibration at depth
Figure 9 presents the PPA and PPV values obtained at the nodes, for each impact across all 30 passes for
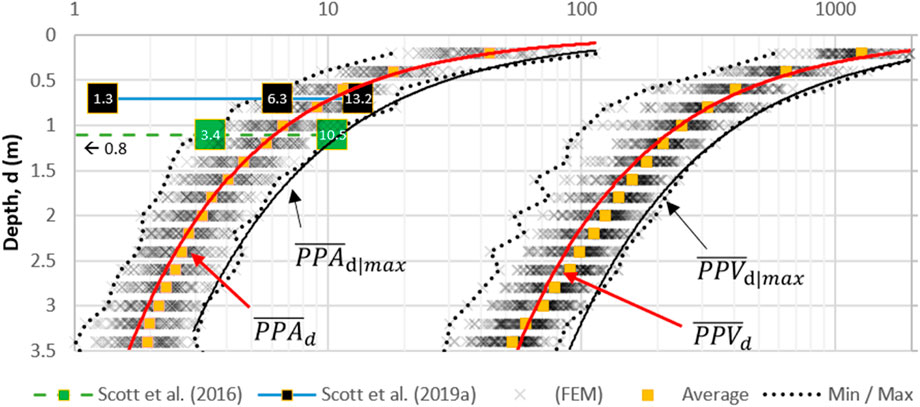
FIGURE 9. Summary of at depth PPA (in g); and PPV (in mm/s).
3.3 Surface vibration
In the previous section, the PPAs and PPVs with respect to depth were reported. In this section, the PPA and PPV along the ground surface with respect to the lateral distance (D) to the centreline of the lane subject to RDC are reported and presented in Figure 10. As can be seen, and as expected, the results suitably envelope the field data obtained by Avalle (2007). The idealisation of representing the soil in a FE simulation removes the imperfections and discontinuities that would otherwise retard, mitigate or reduce the PPA and PPV in the field. Nonetheless, the trends presented ought to provide a conservative upper estimate for PPA and PPV along the ground surface.
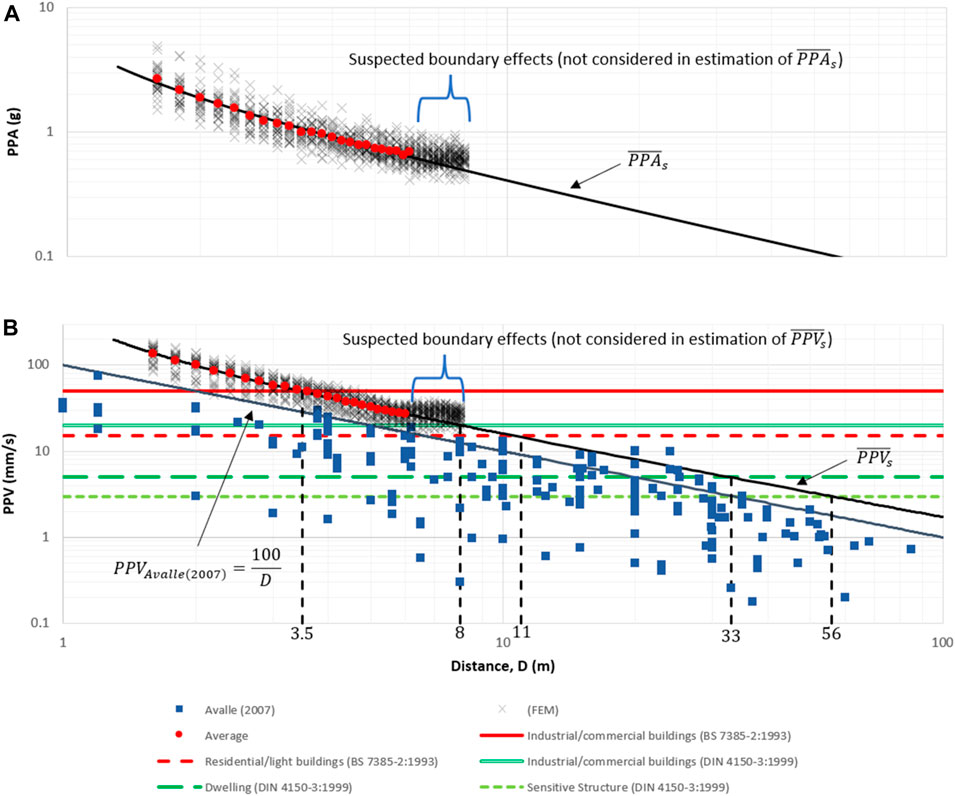
FIGURE 10. Surface peak particle: (A) acceleration; and (B) velocity.
Upon further inspection, estimates at
In maintaining a conservative approach with respect to erroneous disturbance resulting from RDC and the suspected presence of boundary effects, the trends for PPA and PPV are considered to be best estimated within the region
4 Conclusion
This paper presented results of a FE simulation of RDC performed by a Broons BH-1300 4-sided 8-tonne impact roller on coarse-grained soil subjected up to 30 passes, using the formulation as presented by Bradley et al. (2023). These results have reasonably reproduced field observations available within the literature by use of the FE simulation approach. A greater understanding of the extent RDC has on the ground response is achievable with the use of FE simulations. Distributions and trends for the in-situ stresses were presented. Further, the PPA and PPV for at depth and along the surface were also presented.
However, there are limitations to consider when utilising the FE simulation approach. In the field, the imperfections, discontinuities, layering, and heterogeneity of soils are likely to impact the results by typically reducing the PPA and PPV at depth and along the surface. The idealisation of representing the soil in a FE simulation removes these imperfections. Therefore, trends presented herein, and any potential parametric studies utilising the FE simulation, are ought to provide a conservative upper estimate for PPA and PPV.
Another limitation is that the FE simulation considered the roller running along a single lane. In the field, RCD is undertaken with adjacent lanes, modifying the ground conditions lateral to each lane. The impact of the inclusion of adjacent lanes on the results is non-trivial and may be an area of future study. It is presumed the additional effective confinement of the soil due to compactive action in adjacent lanes would attribute to a larger applied stress and ergo performance. This may provide an explanation as to why the peak applied vertical stress in the upper 1 m below the roller and at the intermediate lateral offset of 2.5 m was not necessarily reproduced, Figure 3 and Figure 4. Nevertheless, the FE simulation presents a reasonable reproduction of the average stresses as observed in the field. However, the peak values of stress in the upper 1 m are likely underestimated and may require to be increased by a factor of 2.
The results presented herein are reflective of the use of the course
Ideally with a field or scale-model investigation, future studies would be served well by a robust investigation utilising the FE simulation approach with respect to varying soil conditions. Further, there is room to improve upon Bradley et al. (2023)’s model formulation. Multiple distinct layers, in place of a homogenous soil mass, each with their own geotechnical characteristics and behaviour, as is typically the case in the field, is one such consideration.
Data availability statement
The original contributions presented in the study are included in the article/Supplementary Material, further inquiries can be directed to the corresponding authors.
Author contributions
AB: Conceptualization, Data curation, Formal Analysis, Investigation, Methodology, Software, Writing–original draft. MJ: Supervision, Writing–review and editing. YK: Supervision, Writing–review and editing.
Funding
The author(s) declare that no financial support was received for the research, authorship, and/or publication of this article.
Acknowledgments
The authors appreciate the assistance of Dr. Brendan Scott and Mr. Mark Innes at the University of Adelaide. The authors are grateful for the support team for the Phoenix High Performance Computing services at the University of Adelaide.
Conflict of interest
The authors declare that the research was conducted in the absence of any commercial or financial relationships that could be construed as a potential conflict of interest.
Publisher’s note
All claims expressed in this article are solely those of the authors and do not necessarily represent those of their affiliated organizations, or those of the publisher, the editors and the reviewers. Any product that may be evaluated in this article, or claim that may be made by its manufacturer, is not guaranteed or endorsed by the publisher.
References
Avalle, D. L. (2007). “Ground vibrations during impact rolling,” in Common Ground Proceedings 10th Australia New Zealand Conference on Geomechanics, Brisbane, Australia, 21-24 October 2007.
Avalle, D. L., Jaksa, M., and Scott, B. (2009). “Ground energy and impact of rolling dynamic compaction - results from research test site,” in 17th International Conference on Soil Mechanics and Geotechnical Engineering, Alexandria, Egypt, 5-9 October 2009 (IOS Press). doi:10.3233/978-1-60750-031-5-2228
Avalle, D. L., and McKenzie, R. W. (2005). Ground improvement of landfill site using the "square" impact roller. Aust. Geomech. 40 (4), 15–21.
Avalle, D. L., and Young, G. (2004). “Trial programme and recent use of the impact roller in sydney,” in In earthworks seminar (Adelaide, Australia: Australian Geomechnics Society), 1–5.
Bouazza, A., and Avalle, D. L. (2006). Verification of the effects of rolling dynamic compaction using a continuous surface wave system. Aust. Geomech. 41 (2), 101–108.
Bradley, A. C., Jaksa, M. B., and Kuo, Y. L. (2019). Examining the kinematics and energy of the four-sided impact roller. Proc. Institution Civ. Eng. - Ground Improv. 172 (4), 297–304. doi:10.1680/jgrim.18.00124
Bradley, A. C., Jaksa, M. B., and Kuo, Y. L. (2023). Finite element modelling of rolling dynamic compaction. Comput. Geotechnics 157, 105275. doi:10.1016/j.compgeo.2023.105275
British Standards (1993). BS 7385 Evaluation and measurement for vibration in buildings. Part 2: guide to damage levels from groundborne vibration. UK: BSI.
Canala, G. S., Gauro, C. A., March, J. C., and Strapps, R. W. (2014). Final Research Project Report: quantifying the effectiveness of the four-sided impact roller with operating speed. Adelaide, Australia: University of Adelaide.
Chung, O. Y., Scott, B. T., Jaksa, M. B., and Kuo, Y. L. (2017). “Physical modeling of rolling dynamic compaction,” in Proc. of 19th Internation Conference on Soil Mechanics and Geotechnical Engineering, Seoul, South Korea, 17-22 September 2017, 905–908.
Deutsche Norm (1999). DIN 4150 Structural vibration. Part 3: effects of vibration on structures. Germany.
Jaksa, M. B., Scott, B. T., Mentha, N. L., Symons, A. T., Pointon, S. M., Wrightson, P. T., et al. (2012). “Quantifying the zone of influence of the impact roller,” in International Symposium on Ground Improvement (pp. II-41 to II-52). Brussels: ISSMGE, Brussels, BELGIUM, 31 May – 1 June 2012.
LSTC (2015). LS-DYNA keyword USER'S manual. Livermore, California: Livermore Software Technology Corporation.
Scott, B. T., Jaksa, M. B., and Kuo, Y. L. (2012). “Use of proctor compaction testing for deep fill construction using impact rollers,” in Proceedings of international conference on ground improvement & ground control. Editor C. R. Buddhima Indraratna (Wollongong, Australia: Research Publishing Services), 1107–1112.
Scott, B. T., Jaksa, M. B., and Mitchell, P. (2019a). Ground response to rolling dynamic compaction. Géotechnique Lett. 9 (2), 99–105. doi:10.1680/jgele.18.00208
Scott, B. T., Jaksa, M. B., and Mitchell, P. (2019b). “Depth of influence of rolling dynamic compaction,” in Proceedings of the institution of civil engineers - ground improvement.
Scott, B. T., Jaksa, M. B., and Mitchell, P. (2020). Influence of towing speed on effectiveness of rolling dynamic compaction. J. Rock Mech. Geotechnical Eng. 12 (1), 126–134. doi:10.1016/j.jrmge.2019.10.003
Scott, B. T., Jaksa, M. B., and Syamsuddin, E. (2016). “Verification of an impact rolling compaction trial using various in situ testing methods,” in Proceedings of the 5th International Conference on Geotechnical and Geophysical Site Characterisation, Sydney, Australia, 5-9 September 2016 (Australian Geomechanics Society), 735–740.
Standards Australia (1997). AS 1289.6.3.2: methods of testing soils for engineering purposes Soil strength and consolidation tests - determination of the penetration resistance of a soil - 9 kg dynamic cone penetrometer test. Standards Australia.
Standards Australia (1998). AS 1289.5.5.1: methods of testing soils for engineering purposes Soil compaction and density tests - determination of the minimum and maximum dry density of a cohesionless material - standard method (Reconfirmed 2016). Standards Australia.
Standards Australia (2006). AS 1289.3.5.1: methods of testing soils for engineering purposes Soil classification tests - determination of the soil particle density of a soil - standard method. Standards Australia.
Standards Australia (2007). AS 1289.5.8.1: methods of testing soils for engineering purposes Soil compaction and density tests - determination of field density and field moisture content of a soil using a nuclear surface moisture-Density gauge - direct transmission mode. Standards Australia.
Standards Australia (2009). AS 1289.3.6.1: methods of testing soils for engineering purposes Soil classification tests - determination of the particle size distribution of a soil - standard method of analysis by sieving. Standards Australia.
Standards Australia (2016). AS 1289.6.4.2: methods of testing soils for engineering purposes Soil strength and consolidation tests - determination of compressive strength of a soil - compressive strength of a saturated specimen tested in undrained triaxial compression with measureme. Standards Australia.
Standards Australia (2017). AS 1289.5.2.1: methods of testing soils for engineering purposes Soil compaction and density tests - determination of the dry density/moisture content relation of a soil using modified compactive effort. Standards Australia.
Standards Australia (2020). AS 1289.6.6.1: methods of testing soils for engineering purposes Soil strength and consolidation tests - Determination of the one-dimensional consolidation properties of a soil - Standard method. Standards Australia.
Nomenclature

Keywords: rolling dynamic compaction, impact roller, granular materials, vibration, finite element
Citation: Bradley AC, Jaksa MB and Kuo YL (2024) Ground response of rolling dynamic compaction—a finite element modelling approach. Front. Built Environ. 9:1334090. doi: 10.3389/fbuil.2023.1334090
Received: 06 November 2023; Accepted: 18 December 2023;
Published: 08 January 2024.
Edited by:
Hoang Bao Khoi Nguyen, University of South Australia, AustraliaReviewed by:
Md. Rajibul Karim, University of South Australia, AustraliaM. M. Younus Ali, RMIT University, Australia
Copyright © 2024 Bradley, Jaksa and Kuo. This is an open-access article distributed under the terms of the Creative Commons Attribution License (CC BY). The use, distribution or reproduction in other forums is permitted, provided the original author(s) and the copyright owner(s) are credited and that the original publication in this journal is cited, in accordance with accepted academic practice. No use, distribution or reproduction is permitted which does not comply with these terms.
*Correspondence: A. C. Bradley, YW5kcmV3LmJyYWRsZXlAYWRlbGFpZGUuZWR1LmF1; M. B. Jaksa, bWFyay5qYWtzYUBhZGVsYWlkZS5lZHUuYXU=