 Emmanuel Kabundu
 Sijekula Mbanga1†
- 1Department of Building and Human Settlements, Nelson Mandela University, Gqeberha, South Africa
- 2Department of Construction Management, Nelson Mandela University, Gqeberha, South Africa
Introduction: South Africa is ranked among the 20 highest greenhouse gas (GHG) emitters worldwide, mainly due to its heavy reliance on coal for energy. The residential building industry can play a significant role towards the minimization of both GHG emissions and energy consumption. This research assesses the beneficial impacts of utilizing wall envelope insulation measures using five insulation materials, for a detached residential building, within the seven energy zones of South Africa in accordance with the South African National code for Building energy efficiency (SANS10400-XA).
Methods: Lifecycle analysis (for 50 years), regression methods and sequential search techniques of building energy modelling were used to determine both the energy saving implications of adopting the insulation materials (at various levels of thickness), and their corresponding energy payback periods. The study area consisted of eight selected locations representing all the seven energy zones in South Africa (Welkom, Witbank, Thohoyandou, Cape Town, Pretoria, Ixopo, Sutherland, and Fraserburg).
Results: Sutherland (zone 6), Cape Town (zone 4) and Fraserburg (zone 7) benefitted most from energy savings due to application of insulation measures. Witbank (Zone 2), Thohoyandou (zone 3) and Pretoria (zone 5) never benefitted from application of wall envelope insulation (in terms of energy savings). Cellulose and straw yielded the lowest payback periods. Generally, polyurethane yielded the highest net energy savings at lower insulation thickness levels, while cellulose was preferable at higher insulation thickness levels in Welkom (zone1) Cape Town (zone 4), Ixopo (zone 5H), Sutherland (zone 6) and Fraserburg (zone 7).
Discussion: Lower optimal wall envelope insulation thicknesses (that maximized energy savings) appeared to correspond to locations with higher annual temperature ranges. Higher temperature ranges (hence, higher degree days) would ensure that more energy is saved in order to keep the indoor temperatures within the acceptable comfort limits, due to application of insulation. However, the selection of insulation material is also influenced by other factors such as resistance to insect and mould attack (which easily affect bio-insulation materials), fire retardancy, durability (which affects cellulose), sound proofing, structural strength, and resistance to water vapour.
1 Introduction
1.1 Background
South Africa had the 13th highest CO2 emissions per capita in 2020 (worldpopulationreview, 2023). According to the International Energy Agency (IEA), in 2022, building energy consumption accounted for 30% of total energy consumption globally, while embodied and operational building carbon emissions also accounted for approximately 30% of the total global emissions (IEA, 2022). The use of the right innovative materials in buildings may significantly contribute to the reduction of both national and global building energy consumption and CO2 emissions. According to Statistics South Africa [STATSA, 2021], in 2021, 69.7% of dwellings in South Africa consisted of a house or brick/concrete block structure located on a separate stand or farm, making it the most popular form of dwelling by choice. Traditional dwellings from traditional materials accounted for 4.2%, while flats or apartments accounted for 3.6%.
This paper applies the methodology of lifecycle analysis (LCA) and EnergyPlus simulations to comparatively evaluate the relative benefits of adding insulation materials in a residential building, with respect to each of the seven SANS 10400-XA energy zones in South Africa. As a result, the increase in embodied energy (and CO2 emissions) due to the use of insulation materials is compared to the realized benefits in the form of savings in operational energy and emissions to evaluate the payback periods. A clay brick cavity wall (with a minimum air gap of 50 mm) was used as the basis of the analysis subject to the SANS 10400-XA building energy efficiency criteria.
The paper adds value to previous research by providing a detailed insight into the benefits and disadvantages of using various insulation materials within South Africa as building measures with respect to the identified energy zones, according to the new SANS 10400-XA building energy efficiency regulations. This would directly contribute toward the goal of implementing net-zero energy-efficient buildings based on the national standards. Since the thermal conductivity of materials varies with changes in temperatures and moisture content, there are limitations to the results of the research since point estimates of thermal conductivity were used (Tariku et al., 2023).
This paper is divided into six sections. Section ii) reviews previous studies and other relevant literature on the subject. Section iii) deals with the methodology. Section iv) presents the analyzed results. In Section v), the results are discussed. In Section vi), both the summary and contribution to existing knowledge are made.
1.2 The building lifecycle stages and system boundaries
1.2.1 Lifecycle stages
There are four building lifecycle stages used in the LCA, as defined under the BS EN 15978: 2011, and they are shown in Figure 1 (Royal Institute of Chartered Surveyors [RICS, 2017]). These are the production (A1–A3), construction (A4–A5), use (B1–B7), and end-of-life (C1–C4) stages. The last stage (D), outside the system boundaries, is optional but may play a significant role in the reduction of embodied energy and CO2 emissions through reuse, recovery, or recycling of materials.
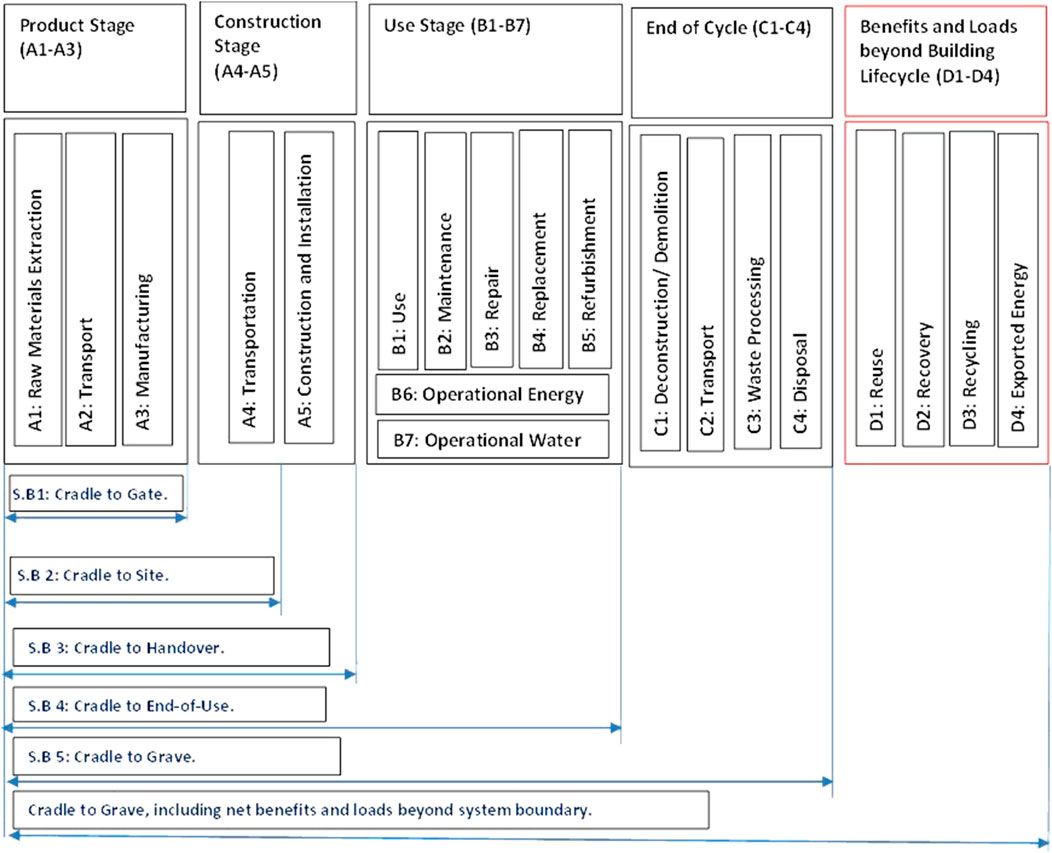
FIGURE 1. Life cycle stages for buildings (RICS, 2017).
1.2.2 System boundaries
There are five possible boundaries that arise from the building lifecycle stages, as shown in Figure 1. System boundary 1 (S.B 1) or cradle to gate includes only the production of the construction materials that will be used in the building construction (A1–A3). The second system boundary (S.B 2) or cradle to site includes both cradle to gate and transportation of the building materials to the site where the building is to be constructed (A1–A4). The third system boundary (S.B 3) or cradle to handover includes cradle-to-site and all the construction and assembly processes that are performed on the building site to completion of building construction (A1–A5). The fourth boundary (S.B 4) is called the cradle to end-of-use (A1–B5) and includes cradle to handover and any operational, replacement and maintenance, repair, and refurbishment operations that constitute the recurrent energy and emissions. The building’s first use concludes with this boundary. The fifth system boundary (S.B 5) is called cradle to grave (A1–C4) or cradle to end of life and includes the cradle to end of use and the processes involved at the building’s end-of-life stage, such as demolition, transportation of waste away from the site, waste treatment, and disposal. It is preferable to perform the LCA analysis using the fifth system boundary (S.B 5). The analysis can be extended to include the benefits of recycling or reuse beyond the cradle-to-grave phase (D1–D1). Stages D1–D4 are beyond the scope of this research.
The research will concentrate on system boundaries A1–C4 but will exclude phases B1–B3 and B5–B7. This implies that under the use stage, only the replacement process will be modeled.
1.3 Factors that influence embodied carbon and energy
The following is a brief summary of the factors that influence embodied carbon and energy.
1.3.1 System boundaries and lifespan
To ensure uniformity and ease of comparison of research, several studies have pointed out the need to specify the system boundary and the building lifespan used in the LCA because they have a significant impact on the embodied energy and emissions (Chastas et al., 2018; Abouhamad and Abu-Hamd, 2021). The standard building lifespan usually recommended in these studies is 50 years. Abouhamad and Abu-hamd (2021) carried out an LCA analysis for three buildings over 50 years and found out that the production process (A1–A3) accounted for 5.8%–12.0% of the total emissions, the end-of-cycle emissions (C1–C4) accounted for 2.65%–4.3% of the total emissions, and the construction stage (A4–A5) accounted for 2.9%–4.4% of the total emissions. Zhang et al. (2020) found that material production (A1–A3) was 10.7%–11.9% of the total emissions, while end-of-life emissions (C1–C4) were 1.5% of the total emissions, and the construction (A4–A5) stage was 2.0%–2.5% of the total emissions. The operational phase (B6–B7) contributed most significantly to embodied energy consumption and emissions. The total emissions were 82.5%–84.5% (Abouhamad and Abu-hamd, 2021) and 91.3%–94.3% (Zhang et al., 2020). The total energy was 46.6%–48.3% (Abouhamad and Abu-hamd, 2021). Chastas et al. (2018) used the LCA for buildings over 50 years to analyze the relationship between operational and embodied energy in conventional, passive, and low-energy buildings. Their analysis showed that operational energy accounted for 45.4%–48.5% of the total energy in conventional buildings, 42.9%–47.4% of the total energy in passive buildings, and 38.9%–44.3% of the total energy in low-energy buildings. In summary, the building operational phase generally tended to account for most CO2 emissions, ranging from 50% to 94% of the total emissions. However, the most likely range was 82%–94% of the total emissions. When it comes to energy consumption, the building operational phase generally accounted for 45.4%–48.5% of the total energy for conventional buildings. If all buildings are considered (including passive and low-energy buildings), then the range for operational phase energy consumption was 38.9%–48.5% of the total energy.
1.3.2 Frequency of replacement of components
At the building material component level, the ARUP (2022) report showed that while external blinds emitted more CO2 than internal blinds for system boundary A1–A3, the results were reversed when the boundaries were extended from A to C. This was due to the need for more frequent replacement of external fins over the lifespan of the façade (60 years) compared to the external fins which have no need for replacement. This trend can be applied to other building components. The need for more frequent replacements versus the lifecycle analysis period may significantly alter the carbon footprint and embodied energy results. The results published by the Carbon Leadership Forum (2017) indicated that embodied carbon for single-family residential units within the same gross floor area range and the LCA analysis period differed in carbon footprints due to differences in system boundaries (A; A–B; A–D). Some units based on boundaries A–D had a lower carbon footprint compared to those based on boundary A only, implying that a wider system boundary does not necessarily correspond to higher embodied energy and emissions. These results were in agreement with those of the ARUP (2022) study.
1.3.3 Energy mix
The embodied energy and emissions will also vary depending on the energy mix used to manufacture building products (Alla et al., 2020). This is also clearly highlighted in the EDGE (2016) methodology used to generate the EDGE energy coefficient database for building materials. Since most countries, including South Africa, have unique energy mix content, which may also change as they transit into cleaner forms of energy, the emission coefficients (unlike energy coefficients) must also be updated. Bhorkar et al. (2021) identified the manufacturing of construction materials and the use of main grid electricity as the two most important factors contributing to the carbon footprint during the building construction phase. They recommend the use of building materials made from waste material (recycling), renewable energy, and prefabricated construction materials and the use of low-emission construction equipment and vehicles to reduce the carbon footprint in the construction industry. In 2021, the South African energy mix consisted of 70.93% coal, 20.91% oil, 2.79% natural gas, 1.89% nuclear, and 3.48% renewables (Energy Institute, 2022).
1.3.4 Building typology
The building typology can influence the embodied carbon. The ARUP (2022), for example, states that glass not only comes second to aluminum in terms of the significance of the contribution of embodied carbon but also varies in the percentage contribution of embodied carbon for a wall façade (ranging from 26% to 60%) based on façade typology (and hence, front, back, left, and right window-to-wall ratios or WWR). In turn, facades have differing thermal and solar performances, thus significantly influencing operational energy and CO2 emissions. The results of the Carbon Leadership Forum (2017) also show that the embodied carbon per square meter significantly varied based on building typology (commercial office, commercial mixed-use, commercial other, and residential multi-family and residential single-family). Kosir et al. (2018) investigated the interconnectedness of building form, building orientation, and window-to-area ratio in regard to energy consumption for heating and cooling of a generic building in Central Europe. The results showed that an elongated building form was more suitable than a compact one because it allowed larger window areas and, thus, more efficient solar energy harvesting. Though this was advantageous for the heating period, it necessitated the use of appropriate shading during the cooling season for the Central European climate.
1.3.5 Building technology, year of construction, and energy efficiency standards
The building technology used has an effect on embodied and operational energy and emissions. Li et al. (2021) show that the operational energy per square meter of the floor area in Australia for new housing reduced over time because of the use of new building technologies and adherence to the government’s energy-saving requirements (energy efficiency standards). Therefore, the proportion of embodied energy in the residential buildings’ lifecycle increased from 9%–35% (for old dwellings) to 66%–71% for dwellings built after 2011. However, operational energy contributed most to the total energy (79%) compared to the embodied energy (21%) on a regional scale (in Victoria, Australia). In South Africa, the national building energy efficiency standards are also linked to the seven major energy zones (SANS 10400-XA, 2022).
Gervasio et al. (2018) report from several studies that the building structural types (steel, reinforced concrete, wood, masonry, and steel and concrete), influenced by the building technology, had a great impact on the embodied carbon and energy of the residential buildings per square meter of the net floor area. The system boundaries were from cradle to gate. Steel ranged from 241 to 354 Kg CO2/m2; reinforced concrete ranged from 332 to 433 Kg CO2/m2; and wood ranged from 108 to 288 Kg CO2/m2. There was no data for residential buildings with steel and concrete.
1.3.6 Inventory database accuracy
The accuracy of the inventory database for the emissions and energy coefficients can influence the quality of the energy and emissions lifecycle computations. Although South Africa does not have a standard database of energy and emission coefficients, there are various databases available worldwide that can be used to evaluate relative energy consumption and emissions (Hugo et al., 2014). However, the absolute energy and emission values will change based on a particular country’s production process for a particular building material and its level of efficiency (Alla et al., 2020). The Inventory of Carbon and Energy (ICE) database (Circular Ecology, 2023) and the EDGE database (EDGE, 2016) are some examples of databases that can be used for relative comparison purposes.
1.3.7 Computation method used
The emissions and energy consumption values may also differ due to the computation method used. The two methods usually used are the LCA method and the input–output (IO) methods (IEA, 2016; Zhang et al., 2020; Hasegawa et al., 2015). In their study, Zhang et al. (2020) show that the two methods may yield significantly differing energy and emission amounts.
1.3.8 Major building components under consideration
The major building components, such as foundations and superstructures, also influence the outcome of LCA computations. Abouhamad and Abu-hamd (2021) carried out an LCA analysis for three buildings that were over 50 years old. They showed that the building superstructure accounted for 77.3%–55.3% of the total embodied emissions and 63.45%–82.25% of the total embodied energy. In Europe, Gervasio et al. (2018) carried out an LCA analysis spanning 50 years on 76 buildings. According to their findings, the substructure of the building accounted for 34.2% of embodied emissions of individual residential buildings and 40.7% of embodied emissions of office buildings. This means that the superstructure accounted for 65.8% of embodied emissions of individual residential buildings and 59.3% of embodied emissions of office buildings. On the other hand, the substructure accounted for 29.1% of embodied energy for individual residential buildings and 40.8% of embodied energy for office buildings. The superstructure accounted for the remaining proportions of respective embodied energy for individual residential and office buildings. From these studies, it is evident that the substructure of residential buildings generally accounted for 22%–45% of embodied emissions (the superstructure accounted for 55%–78% of embodied emissions) and 18%–37% of the embodied energy (the superstructure accounted for 63%–82% of embodied energy).
1.3.9 Building measures
The addition, removal, or change in types of building measures such as insulation, shading, and load schedules can influence either the embodied carbon and energy footprints of the buildings or the operational carbon and energy footprints of buildings or both. A negative effect on the embodied quantities may be followed by a positive effect on the operational phase quantities, and vice versa. On the other hand, a positive effect on the embodied quantities (such as a net embodied carbon sequestration) may be followed by a positive effect on operational phase quantities (such as a net positive operational carbon savings), and vice versa. Therefore, we need to carry out research to determine to what degree the negative effects at the embodied stage are offset by the positive effects at the operational phase and vice versa due to the application of certain measures. Alla et al. (2020) assessed the embodied energy impact related to envelope insulation and evaluated the energy and carbon payback of the energy efficiency measures based on a study in 10 Italian cities. Their results indicate a deep dependence of envelope insulation on climatic zones. The results show that it is very relevant to insulate the building envelopes in Northern Italian cities because the resulting energy and carbon payback periods are short (approximately 3 years), unlike the insulation of building envelopes in the southern parts of Italy (the energy and carbon payback periods are approximately 84 years for the southern city of Palermo).
1.4 The wall technologies and insulation materials
The innovation building wall technology (IBWT) used was influenced by the SANS 10400-XA energy efficiency standard. Since the floor area of the building was greater than 80 square meters (105.4 m2), the building walls had either to be collar-jointed walls or cavity walls (with a minimum air gap thickness of 50 mm). The leaf structural materials were made of fired clay bricks (Clay Brick Association, 2019). The insulation materials included fiberglass, polyurethane, expanded polystyrene, cellulose (loose-fill), and straw.
1.4.1 Straw
Previous studies on straw insulation indicate the straw bale envelope’s strong ability to maintain a stable indoor temperature (the maximum indoor air temperature fluctuation was 4°C) despite wide fluctuations in external temperatures (Douzane et al., 2016; Gallegos-Ortega et al., 2017). Apart from straw, the wall envelope in these cases also consisted of either a 25-mm-thick earth plaster supported by wooden frames or lime mortar/gypsum plasterboard/oriented straw boards. This ability to stabilize indoor temperatures is due in part to the straw contributing a high time lag (thermal delay), which, according to some research studies, was 12 h for a 200-mm-thick straw but reached as high as 32.5 h for a 500-mm-thick straw (Marques et al., 2020). It is possible to fuse straw into boards without adhesives to form panels that have good sound-absorbing properties. In some cases, it is possible to use straw to make structurally insulated panels (SIP) for walls, which results in more energy-efficient, airtight, high structural strength, and quieter homes (US Department of Energy, 2023). Straw belongs to a class of insulation materials called bio-insulation materials, which have organic components. As a result, their durability, insect resistance, corrosion resistance, and flame retardancy are uncertain and may need further research (Dong et al., 2023).
1.4.2 Cellulose
Cellulose insulation is mainly composed of recycled paper products, such as newsprint, and therefore has a very high content of recycled material of approximately 82%–85%. The research on cellulose insulation points to its unique characteristics. However, it is necessary to add inorganic additives to cellulose insulation to prevent mold growth and to increase fire resistance. Apart from cellulose fiber having lower embodied energy than most conventional and unconventional insulation materials (except straw), it can also be used in buildings for maintaining steady indoor air humidity levels. Cellulose fiber also has low thermal diffusivity. This means that it will perform better under both static and dynamic heat transfer conditions when compared to other insulation materials like polyurethane (Pal et al., 2021). In addition, cellulose is also recyclable, environmentally friendly, and has good sound-absorbing properties. However, its durability is low when compared to that of EPS and XPS (Dong et al., 2023). Other research studies point out some reasons for the non-wide use of cellulose in the building industry to be due to the lack of expertise in its application and properties (Hurtado et al., 2016); however, the research also provides information about proper cellulose installation in buildings.
1.4.3 Polystyrene and expanded polystyrene (EPS)
Polystyrene is a colorless, transparent thermoplastic that is commonly used to make foam board or beadboard insulation, concrete block insulation, and loose-fill insulation consisting of small beads of polystyrene (US Department of Energy, 2023). The material is recyclable according to research (Reynoso et al., 2021; Netsch et al., 2022). Polystyrene can be installed as loose-fill, as foam board, or as bead insulation. Extruded polystyrene (XPS) is installed usually as foam board, while expanded polystyrene (EPS) is installed as bead insulation (US Department of Energy, 2023). EPS is a lightweight, rigid, closed-cell insulation with high strength. Its closed-cell structure ensures minimal water absorption and low vapor permanence. It is considered dimensionally stable, chemically inert, and resistant to the growth of bacteria and decay over time. EPS does not contain chlorofluorocarbons or hydrochlorofluorocarbons (therefore green) but possesses no advantageous acoustic properties (Dong et al., 2023). Due to its low levels of fire resistance, it requires additives to increase its fire resistance (Insulation Company of America, 2023).
1.4.4 Polyurethane
Polyurethane is a thermoset foam insulation material that has a low-conductivity gas within its cells (as open- or closed-cell formats). If the gas filling is air, then it is called an open cell and has a lower R-value. If the gas filling is not air, then the R-value is higher but tends to decrease (thermal drift) mostly within the first 2 years after installation (US Department of Energy, 2023). Research reports that polyurethane foam boards tend to have low fire resistance, and yet most fire resistance additives tend to compromise thermal performance (Tao et al., 2023). Tao et al. (2023) recommend the use of P/Cu-hybrid silica aerogels which improve flame retardancy, smoke suppression, and reinforcement of polyurethane foam boards without compromising the thermal insulation properties. Another research proposes the use of polyols to decrease fire resistance to as low as 8.3% and increase the compressive strength to as high as 41.8% (Li et al., 2023). The thermal conductivity is affected by changes in temperature, moisture content, and density. Higher moisture content increases its conductivity, lowering the thermal resistivity. The material is known for its good structural strength. Polyurethane poses no health risks when in normal use, except when it is burnt and releases highly toxic hydrogen cyanide. However, it has low flame retardancy and a low recycling rate (Dong et al., 2023).
1.4.5 Fiberglass
Fiberglass insulation consists of extremely fine glass fibers and is made from molten glass that is formed into fibers, mostly using recycled glass content of 40%–60% (US Department of Energy, 2023). Fiberglass insulation is easy to install, does not shrink, has low flammability, is mold- and mildew-resistant, is not prone to insects, improves indoor air quality, is recyclable, and is an environmentally friendly material. However, the insulation settles and sags, leading to the R-value decreasing over time. It may also cause health hazards such as lung diseases and needs protective gear when being installed (Solar365, 2023).
2 Materials and methods
2.1 Overview of the methodology used
Figure 2 shows the summary and logical flow of the methodology followed by the research.

FIGURE 2. Diagrammatic overview of the methodology used (source: authors).
The methodology consisted of first using Climate Consultant (Society of Building Science Educators, 2023) and weather data to obtain the best building design strategies for each of the climatic zones in South Africa based on the adaptive comfort model and ASHRAE 55 model. The nature of the design will affect the computed embodied energy and emissions. Therefore, the energy efficiency standards and passive design strategies were used as a standard against which the design would be based. The second stage involved obtaining the optimum window-to-wall ratios (WWRs) through the performance of relative energy simulations, regression modeling, and optimization based on the evolutionary algorithm. The WWRs will affect the net wall area (excluding the window area and door area) and hence the embodied carbon emissions and energy of the walls. The third step involved updating the building design using the optimum WWRs and SANS 10400 energy efficiency guidelines, the computation of the increase in embodied energy (due to the application of insulation in the wall envelope), and the performance of energy simulations to evaluate the annual energy savings that arise due to the use of the insulation materials. The payback periods and net energy savings for a 50-year period were evaluated.
2.2 Data
Part of the data used consisted of weather file data (Climate OneBuilding Org, 2023) and secondary data from energy and emissions coefficient databases such as the ICE database (Circular Ecology, 2023). The weather file data has been also included as part of Supplementary Material. The other data were directly generated from the design specifications and material quantities corresponding to the building design and materials used. The material quantities were influenced by the SANS 10400 energy efficiency guidelines (SANS 10400-XA, 2022), net floor area, and wall heights.
2.3 Architectural design and bills of materials
Climate Consultant (Society of Building Science Educators, 2023) was used to obtain some of the basic energy-efficient, thermally comfortable design recommendations for the 105.4 m2 net floor area design of the residential unit.
Some of the quantities computed for the wall envelope to ensure compliance included the thermal resistance (R-value), thermal capacitance, and CR-value. The CR-value of the wall is the product of thermal resistance and thermal capacitance (SANS 10400-XA, 2022). Wall assembly materials and their thicknesses affect the R-value and CR-value of the assembly, based on their properties. The guidelines on the methodology of computing the R-value, CR-value, fenestration-specific heat gain coefficients, and U-value are outlined in the SANS 10400-XA document. Bills of materials for the walls were generated from the building designs with the help of Microsoft Excel. The ICE database was used as the basis for embodied computations. Its coefficients corresponded to system boundaries A1–A3. Missing coefficients were obtained from available environmental product declarations (EPDs). Emissions based on later system boundaries were obtained through further mathematical modeling. Figure 3 illustrates the model.
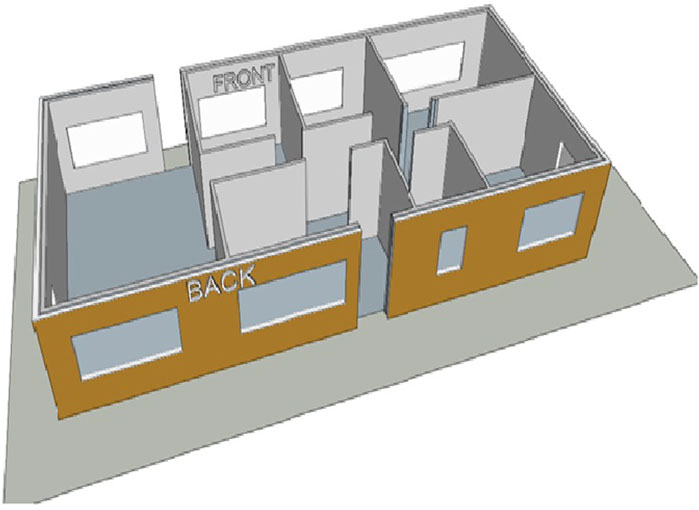
FIGURE 3. Diagrammatic representation of the model (the wall envelope and proposed inner partitions) (source: author).
The window-to-wall ratios were carefully selected to ensure the energy efficiency of the model in its passive form. Further design guidelines that influenced the model design are provided later using the results from the Climate Consultant.
2.3.1 Thermal properties of building materials
The thermal properties of materials were obtained from sources like the ICE database, Thermtest Instruments (2023), and Intelligent Communities Lifecycle (2023). These properties included density, specific heat capacity, and thermal conductivity.
2.3.2 South African energy efficiency standards and surface density
The South African National Standard on the energy efficiency of buildings (SANS10400-XA, 2022) recommends buildings in all seven energy zones (except zone 5H) face northward. Most of the window area should be in the north-facing and south-facing walls in that order. Buildings that have greater length than width will, therefore, allow more cross-ventilation as a form of passive cooling during summer.
2.3.2.1 Walls
Buildings with a floor area less than or equal to 80 square meters are classified as “category 1” buildings according to the SANS10400-XA (2022). The minimum masonry wall requirement of “category 1” buildings is a single-leaf masonry wall with a minimum thickness of 140 mm. When the floor area is greater than 80 square meters (non-category 1 buildings), then the masonry wall system must either be collar-joint (energy zones 3, 5, and 5H) or a cavity wall with a minimum air gap thickness of 50 mm (energy zones 1, 2, 4, 6, and 7). Based on the South African energy efficiency standards, the floor area can affect the nature of wall construction, which in turn affects the embodied carbon and energy footprints (by influencing the thicknesses of walls) and the annual operational carbon and energy footprints of a building (by influencing the minimum R-values of walls).
According to the energy efficiency standards in South Africa, the minimum nominal R-value for the collar-joint wall assembly is 0.4 m2.K/W if the surface density is greater than or equal to 270 kg/m2. The minimum nominal R-value for a cavity wall is 0.6 m2.K/W if the surface density is greater than or equal to 270 kg/m2. If the surface density is less than 270 kg/m2, then the minimum R-value for both collar-joint and cavity walls in energy zones 1, 2, 6, and 7 is 2.2 m2.K/W; the minimum R-value in energy zones 3, 4, 5, and 5H is 1.9 m2.K/W (SANS10400-XA, 2022). Therefore, the energy efficiency standards influence the nature of wall construction, the minimum R-values, and hence the minimum energy and carbon footprints of buildings per square meter of the net floor area, based on the energy zones in South Africa. Similarly, the minimum CR-values would need to be 80 or 100 hours, depending on the energy zone where the analysis is being done.
2.3.2.2 Shading constants
The SANS 10400-XA standard specifies the minimum shading constants to use, which are dependent on the latitude of the location. The values are 0.33 for latitudes less than or equal to 22°; 0.36 for latitudes above 22° and up to 24°; 0.40 for latitudes above 24° and up to 26°; 0.42 for latitudes above 26° and up to 28°; 0.46 for latitudes above 28° and up to 30°; 0.50 for latitudes above 30° and up to 32°; and 0.54 for latitudes above 32° (SANS 10400-XA, 2022). The minimum length by which the shading device extends beyond the window width on either side is equal to the shading depth according to the SANS 10400-XA standards. The shading depths were evaluated by multiplying the relevant shading constant by the vertical distance between the base of the glazing element and the shadow-creating edge of the window overhang.
2.3.3 Optimum window-to-wall ratios
The embodied carbon emissions and operational energy (and hence operational carbon emissions) are affected by the window-to-wall ratios (WWRs) for the front wall, the back wall, the right wall, and the left wall. The WWRs affect the indoor environment, thermal comfort, and hence energy usage and carbon emissions at the operational phase. Using one of the masonry technologies for the walling system (concrete blocks), operational energy consumption was evaluated for various combinations of WWRs using the EnergyPlus software application. Multiple regression analysis was carried out on the results using the WWRs (front, back, left, and right) as independent variables and the energy consumption output as the dependent variable. The F-tests and T-tests were carried out on the overall results and the individual regression coefficients, respectively. The F test indicates if the linear regression model provides a better fit to the data than the model containing no regression variables (the WWRs). The level of significance used was 5%. R-square values were also evaluated. The R-square values indicate the proportion of variance in the consumed energy (dependent variable) that is explained by the front, back, left, and right WWRs (independent variables). Optimization using the evolutionary algorithm and the regression models was then performed to evaluate the best WWRs that yield the lowest values of energy, subject to certain constraints. It was ensured that the combined (overall) WWR for the entire building was greater than or equal to 0.2. The optimum WWRs were input into EnergyPlus to evaluate the annual source energy outputs for comparison purposes with the optimization and regression estimated results. The building design was adjusted using the optimum WWRs that were applied in each climatic zone (zone 4 for Cape Town; zone 2 for Pretoria; zone 1 for Welkom; zone 3 for Nelspruit; zone 5 for Mthatha; zone 5H for Ixopo; zone 6 for Kimberley, and zone 7 for Fraserburg) before evaluating the embodied carbon of the building.
2.3.4 Optimum insulation thicknesses
The usual masonry unit thicknesses used in South Africa are 90, 100, 140, 190, and 230 mm. The minimum standard for wall envelopes for buildings whose floor area is greater than 80 square meters is that they must either be collar-joint walls (in energy zones 3, 5, and 5H) or cavity walls with a minimum air gap thickness of 50 mm (energy zones 1, 2, 4, 6, and 7) according to the SANS 10400-XA standards. The research used cavity walls as the minimum basis for analysis in all energy zones, with each clay brick masonry leaf being 110 mm thick and various levels of insulation thickness being applied as building measures (0, 50, 75, 100, and 500 mm). For all cases, the minimum R-values, where applicable, had to be met before any energy simulations or embodied quantity computations were carried out (SANS10400-XA, 2022). Since the clay brick masonry units were used, the wall surface density was greater than the 270 kg/m2 threshold of the SANS10400-XA guidelines due to the high density of clay bricks. It was assumed that although the application of more insulation as a building measure would lead to more embodied emissions and energy, it may also lead to annual site energy savings at the operational level. As a result, it was necessary to evaluate how the payback periods for embodied energy and emissions with respect to the annual site energy savings would vary with the insulation material used and the energy zone under consideration. The research also evaluated the optimum insulation thicknesses for polyurethane, where the net energy savings per square meter (for a period of 50 years) were highest.
2.4 Estimation of IBT embodied energy and emissions
The following equation was used to estimate the embodied energy of the building models. The embodied CO2 emissions are evaluated by replacing the embodied energy coefficients (cradle to gate) with the embodied carbon coefficients (cradle to gate).
Equation 1 shows the estimated embodied energy for a residential building consisting of k building materials. The emission coefficients correspond to the cradle-to-gate system boundaries. Equation 1 shows their use for the evaluation of cradle-to-end-of-life (A1-C4) embodied energy. Though stages B3, B5, B6, and B7 are excluded from embodied quantity computations, stage B6 is later used during energy modeling.
The term (ni) refers to the number of times any building material (i) will be replaced due to repair and maintenance during the analysis period. The term Ckgi refers to the cradle-to-gate embodied energy coefficient of building material (i). The quantity qbi refers to the initial quantity of building material (i) that was used in constructing the building. The term w is a percentage expressing the amount of the material wasted. The term fk represents the fuel in kilograms that is burnt per kilometer. This term varies depending on the type of vehicle used to transport the materials and the fuel type used by the vehicle (petrol, diesel, electric vehicle, and others). The term Ekg represents the energy produced by this fuel in kWh per kg of fuel, while the term Ckwh represents the emissions in kg of CO2 for this fuel type per kWh of energy generated, if the equation aims to evaluate embodied CO2 emissions. The term Ckwh is equal to 1 if the equation is computing embodied energy. The term dbi is the average distance from the factory gate to the building site for this material, and dwi is the average distance from the building site to the dumping site for this material. The term T is the total embodied energy (or emissions) for the building. The term “v” is an estimated rate of CO2 emission per square meter of the net floor area being deconstructed or demolished if the equation computes embodied CO2. Otherwise, “v” represents the rate of energy consumption per square meter of the net floor area being deconstructed or demolished if the equation evaluates embodied energy. The term Qbi refers to the maximum legal weight that can be carried by the vehicle that will be used to transport building materials to the site of the landfill (IEA, 2016; Liu et al., 2020). The embodied energy due to the use of wall insulation material at a certain level of thickness would then be the difference between the embodied energy of the building when the insulation was applied in the cavity wall (with an air gap of 50 mm) and the embodied energy of the building when the cavity wall had no insulation. The same methodology also applies to the embodied CO2 emissions due to the application of insulation (at a certain level of thickness) to the cavity wall.
2.5 Saved energy saved emissions and payback periods
The system boundaries over which embodied energy and CO2 emissions were evaluated are A1–A5, B4, and C1–C4. The period of analysis was 50 years. The difference in embodied energy and emissions of the building due to the application of insulation at various levels of thicknesses was evaluated. By using the building model at the different levels of wall insulation thicknesses, the annual energy consumption was evaluated for each of the scenarios. The differences between annual building energy consumption when insulation was used and annual building energy consumption without insulation were evaluated. They represented the possible annual operational site energy savings at the given level of insulation thickness.
2.5.1 Saved energy and emissions after 50 years
The saved energy after 50 years (the period for evaluating embodied quantities) is given by Equation 2:
The saved CO2 emissions after 50 years are given by Equation 3.
The terms EEn and CEn refer to the estimated increase in embodied energy and emissions of the building due to the application of the wall envelope insulation measure at a certain level of thickness (over a lifecycle period of 50 years), respectively. The terms OES and OCS refer to the estimated annual savings in operational site energy and operational site emissions due to the application of wall envelope insulation at a certain level of thickness, respectively. The terms ESn and CSn refer to the estimated net saved energy and emissions per square meter of the net floor area (AF) that are accumulated over a period of n years (50 years in this case) due to the application of the envelope wall insulation at a certain level of thickness, respectively. Larger values of ESn and CSn at a certain level of envelope wall thickness indicate that higher benefits are accrued due to the application of the wall insulation.
2.5.2 Energy and carbon payback periods
The payback periods due to the increase in operational energy and increase in embodied energy (over 50 years) because of the application of the envelope wall insulation were also evaluated at different levels of insulation thicknesses. The annual operational source energy savings corresponding to the use of wall insulation at the same level of thickness that resulted in the increase in embodied quantities were first evaluated. Equations 4, 5 show how the energy payback period (PBE) and carbon emissions payback period (PBC) were evaluated.
2.5.3 Validation of the building energy model
The building energy models used were validated using the SANS 10400-XA, 2022 validation standards, which state the maximum allowable annual energy consumption per square meter of the net floor area for residential buildings classified as H3 and H4 for each of the seven energy zones. The SANS 10400-XA regulations also recommend occupancy and utilization rate schedules that are all greater than 0 over 24 h of the day. This means that the residential buildings are assumed to be at least partly occupied at any time of the day, throughout the week. Therefore, the SANS 10400-XA regulations require that when the simulations are run, the results should be such that at least 95% of the 8,760 annual hours are between the recommended building indoor temperatures of 19°C (66.2oF) and 25°C (77oF) inclusive (SANS10400-XA, 2022). Therefore, before simulations, the heating and cooling set point schedules were set to align with the indoor comfort temperatures recommended by the SANS10400-XA regulations. After the simulations were performed, the annual cooling and heating loads that were not met (in the form of hours outside the comfort range) were obtained and summed up. The percentage of total loads not met annually was evaluated and compared with the maximum figure of 5% allowed by the SANS 10400-XA.
Therefore, the model validation is partly achieved by comparing the annual energy consumption of the models to the maximum allowable limit as per the SANS10400-XA for the applicable occupation type (residential: H3 or H4). EnergyPlus computes both site energy and source energy. Site energy corresponds to the amount of energy consumed by the building, as reflected on the utility bills. Source energy, on the other hand, is the energy consumed by utilities and other entities in order to supply the energy consumed by the building. The model never used any solar, natural gas, oil, or other alternative forms of energy, other than electricity from the grid. According to the SANS 10400-XA, the annual consumption per net floor area (in square meters) of the building is based on the sum of the monthly consumption of 12 consecutive months (SANS10400-XA, 2022). The net floor area, according to the SANS10400-XA, 2022, is defined as the floor area within a building envelope, including the area occupied by vertical elements such as internal walls, lift wells, enclosed stairs, storage areas, and rooms. Therefore, this annual energy consumption directly corresponds to the building’s site energy rather than source energy. The research used site energy as the basis for model validation and for evaluating the impact of the measures.
3 Results
3.1 Climatic recommendations and SANS10400-XA test results
3.1.1 Climate Consultant results
Figure 4 shows the results based on the adaptive comfort model and the ASHRAE standard 55 model.
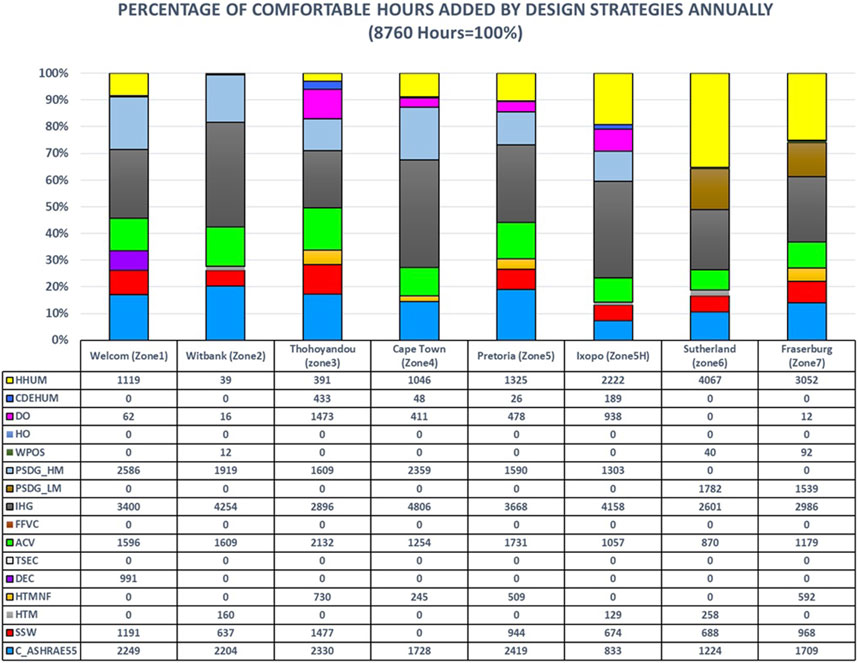
FIGURE 4. Best design strategies and the added hours of thermal comfort (zone 1 to zone 6). (source: author). Interpretation of symbols for Figure 4. SSW: sun shading of windows; C_ASHRAE55: adaptive comfort model in the ASHRAE standard 55; HTM: envelope with a high thermal mass; HTMNF: high thermal mass, night flush; DEC: direct evaporative cooling; TSEC: two-stage evaporative cooling; ACV: adaptive comfort ventilation; FFVC: fan forced ventilation cooling; IHG: internal heat gains; PSDG_LM: passive solar direct gain, low mass; PSDG_HM: passive solar direct gain, high mass; WPOS: wind protection of outdoor spaces; HO: humidification only; DO: dehumidification only; CDEHUM: cooling, add dehumidification if needed; HHUM: heating, add humidification if needed.
Figure 4 shows that internal heat gains were the major contributors to annual hours of comfort in all zones or locations except Fraserburg in zone 7 and Sutherland in zone 6 (the lowest was 33.1% in Thohoyandou, and the highest was 54.9% in Cape Town). In Fraserburg (zone 7) and Sutherland (zone 6), heating with humidification was the highest contributor to annual hours of comfort (34.8% and 46.4%, respectively), followed by internal heat gains (34.1% and 29.7%, respectively). The passive direct solar gain (high mass) was the second most important strategy in Welkom (zone 1) and Cape Town (zone 4), with 29.5% and 26.9% of annual hours of comfort added, respectively. Comfort under the ASHRAE 55 assumption was the second most important strategy in Witbank (zone 2), Thohoyandou (zone 3), and Pretoria (zone 5) with 25.2%, 26.6%, and 27.6% of annual hours of comfort, respectively. However, heating with humidification was the second most important in Ixopo (zone 5H), with 25.4% of annual hours of comfort. Sutherland (zone 6) required the highest number of heating hours, followed by Fraserburg (zone 7) and Ixopo (zone 5) with 46.4%, 34.8%, and 25.4%, respectively). Witbank (zone 2) required the least annual hours of heating (0.4%), followed by Thohoyandou (4.5%). In terms of cooling, Thohoyandou (zone 3) required the highest annual hours of cooling (4.9%), followed by Ixopo (zone 5H). Welkom (zone 1), Witbank (zone 2), Sutherland (zone 6), and Fraserburg (zone 7) required the least number of annual hours of cooling (0.0% or no cooling).
Minimizing the energy spent on heating and cooling would lower the total operational energy and emissions, which can account for as much as 94% and 48.5% of total lifecycle energy and CO2 emissions, respectively (Chastas et al., 2018; Abouhamad and Abu-hamd, 2021). A rectangular building floor plan would benefit all zones due to cross-ventilation benefits. Facing the house northward and using low-pitched roofs with wide overhangs benefit all zones. The SANS 10400-XA-recommended indoor temperature comfort range values were 19–25°C.
Table 1 shows some of the design parameters of the building model.
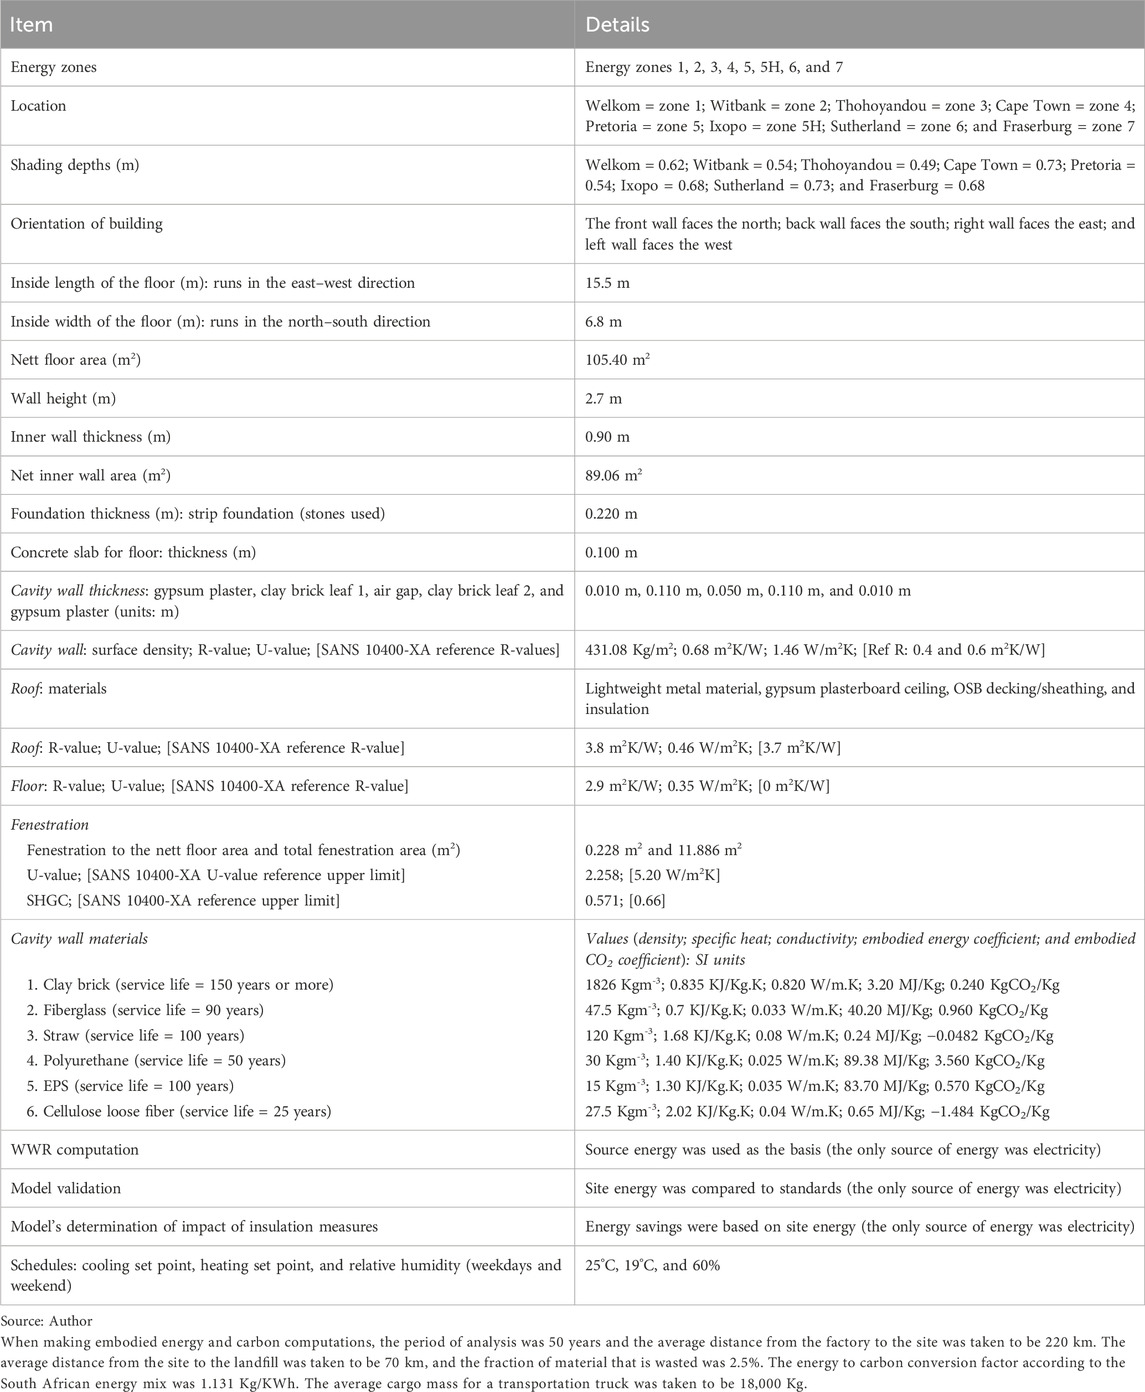
TABLE 1. Other details from the design.
3.2 Optimum window-to-wall ratios
Based on the building model design, energy consumption in each of the six zones was evaluated using the EnergyPlus application, based on a set of generated WWRs. The same masonry wall, roof, and floor materials were assumed for each of the seven energy zones. The goal was to evaluate relative values of energy consumption within each zone based on varying WWRs. The building effectively had its front side facing northward. The regression results for the WWR analysis on annual energy consumption are presented in Table 2. Eight regression models were generated to evaluate the relative degree of influence of the left, right, front, and back WWRs on energy consumption. Each model corresponds to its respective climatic zone. The stargazer package in R was used to generate the models (Hlavac, 2022).
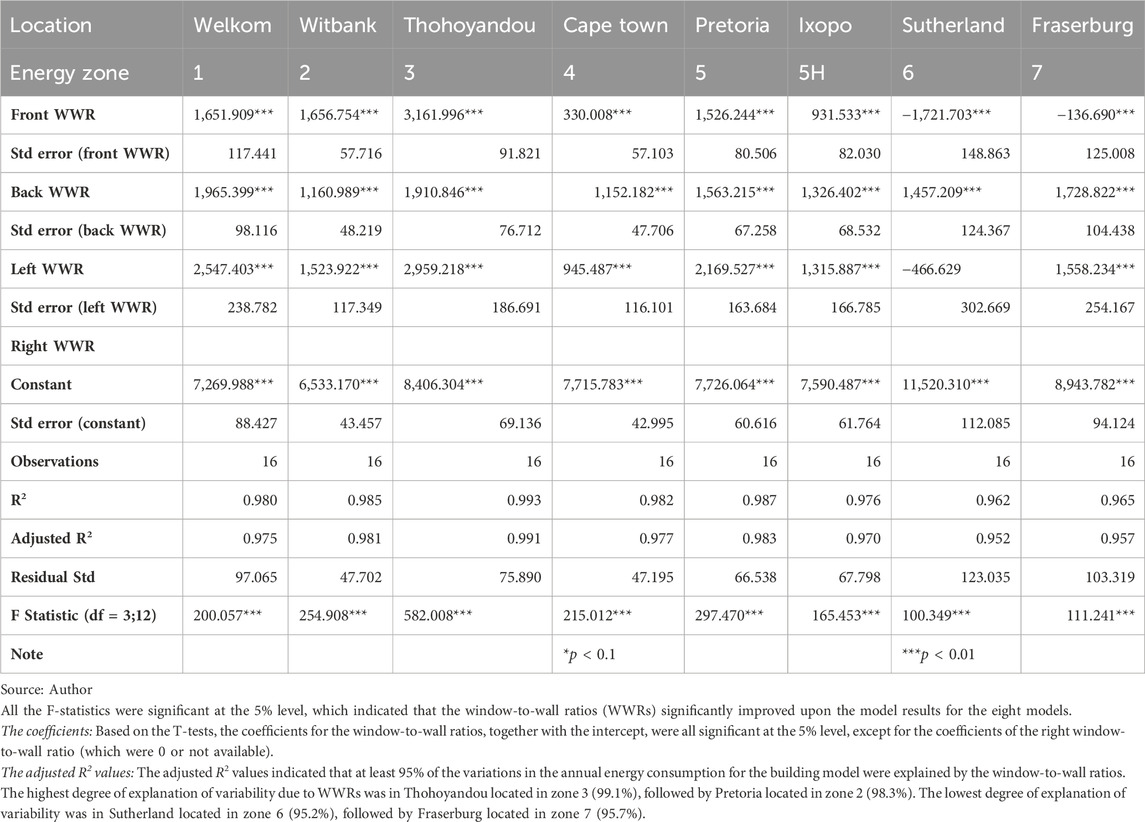
TABLE 2. ANOVA results and coefficients.
3.2.2 ANOVA tests, coefficients, and adjusted R2 values
The ANOVA tables were generated to test if the dependent variables (WWRs) improved upon the models for each zone when compared to an “intercept-only” model. The level of significance used was 5%. Table 2 shows the results.
3.2.3 Optimum WWRs
The WWRs will influence the amount of wall envelope insulation used, but they may also contribute to savings on energy consumption through passive means, such as cross-ventilation. The Microsoft Excel solver add-in was used for optimization, using the eight sets of regression model coefficients and some default window-to-wall ratios. The evolutionary algorithm for the solver was used for the optimization (minimization) of energy consumption by altering the values of the WWRs based on the underlying regression models that were generated (Table 2). The solutions converged. The solver produced the optimum energy values in both zones and the corresponding WWRs. These WWRs were entered into EnergyPlus, and the annual energy consumption for each climatic zone was computed for comparison with the solver-generated minimum energy values. All the optimization scenarios were subject to a minimum overall WWR of 0.2, in addition to the further scenario-specific constraints. Three scenarios were created. In scenario 1, the front WWR and back WWR were between 0.24 and 0.30, while the left WWR and right WWR were between 0.05 and 0.10, respectively. In scenario 2, the front WWR and back WWR were between 0.24 and 0.30, while the left WWR was between 0.05 and 0.10, but the right WWR was equal to 0.05. In scenario 3, the lower and upper bounds of the WWRs were 0 and 0.8, respectively. Table 3 shows the results for scenario 2, which was adopted.
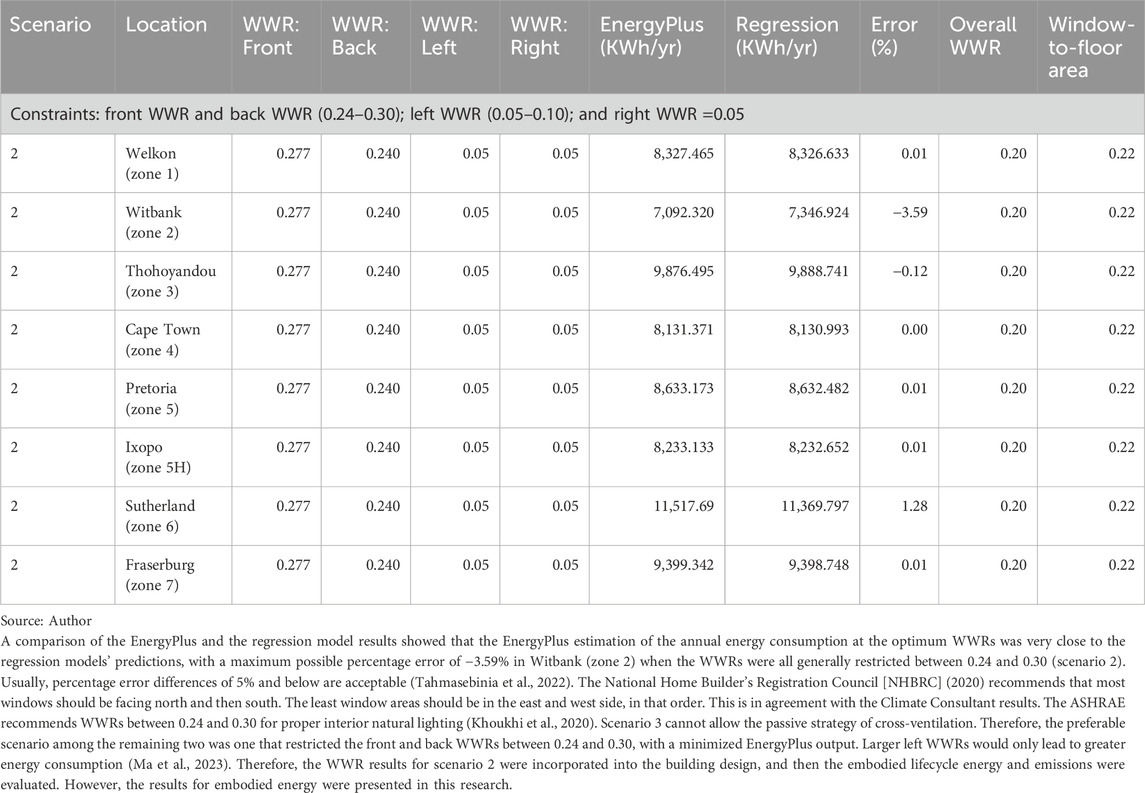
TABLE 3. Optimized WWRs (using the solver evolutionary algorithm) and their predicted source energy consumption errors (scenario 2).
3.3 Energy savings model validation
Using the adopted WWRs and recommended SANS 10400-XA load schedules, modifications were made to the building design and energy model before running the energy simulations to determine the impact of insulation measures. The model validation consisted of two components. The first consisted of the evaluation and comparison of site energy consumption per square meter of the net floor area, with the maximum allowable according to the SANS10400-XA. The second consisted of the evaluation of unmet heating and cooling loads annually and comparing them to the maximum allowable SANS10400-XA limit of 5%.
3.3.1 Site energy consumption per square meter floor area
Table 4 shows the summarized site energy (and source energy in brackets) consumption statistics (according to energy zones) per net floor area and the corresponding SANS 10400-XA maximum site energy limits.
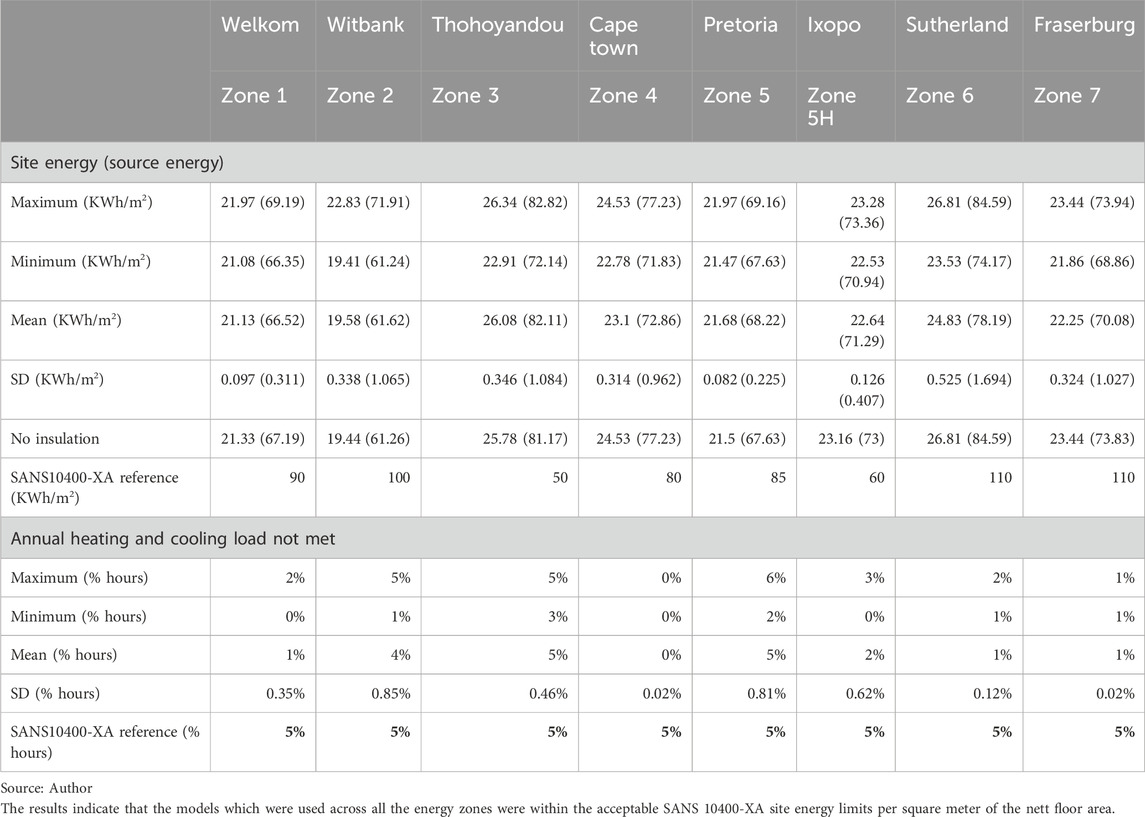
TABLE 4. Maximum, minimum, and mean annual site energy consumption per nett floor area and loads not met (hours).
The percentages of hours annually where the heating and cooling loads were not met (for indoor comfort temperature (range of 19°C–25°C), according to the SANS 10400-XA, were computed. Table 4 also shows the results of the loads not met annually (in hours as percentages). The results show that the maximum loads not met annually were all equal to or less than 5%, except for Pretoria (zone 5), where the loads not met were from 2% to 6% (or more accurately, 2.09%–5.75%). Further investigation in Pretoria (zone 5) shows that using polyurethane thicknesses above 225 mm, cellulose thicknesses above 350 mm, fiberglass thicknesses above 275 mm, and EPS thicknesses above 300 mm will all yield annual hours of no comfort above the 5% threshold. Generally, keeping all insulation thicknesses below 225 mm will ensure that the SANS 10400-XA indoor comfort requirements are met in Pretoria (zone 5). The highest loads not met appeared to occur in Pretoria, Thohoyandou, and Witbank (energy zones 5, 3, and 2), while the least occurred in Fraserburg, Sutherland, and Welkom (energy zones 7, 6, and 1). The results in Table 4 show that the used models fulfilled the requirements of the SANS 10400-XA standards, as a basis for their validation, except for some scenarios in Witbank (zone 2).
3.3.2 Embodied energy of the building
The evaluated embodied energy of the building (for 50 years) without using insulation in the wall envelope was 487,720.4 MJ or 4,627.3 MJ/m2 (of net floor area). The embodied energy due to the walls (wall envelope and inner walls) was 173,311.1 MJ or 1,644.3 MJ/m2 (of net floor area). The results could only be compared to those of research done in other countries. For example, if compared to the work done by Crawford (2019) in Australia, there is a high likelihood of a strong agreement, although Crawford used the input–output analysis method for the evaluation of embodied quantities. While Crawford (2019) used reflective foil, this research did not. This research also took into consideration that it is possible to use mortarless brick walls. However, the increase in embodied energy due to the application of the insulation material is what this research was interested in. This increase in embodied energy was dependent on insulation thickness and WWRs. It was compared to the annual saved site energy obtained from EnergyPlus modeling to get the payback periods.
3.4 Energy payback periods
The energy payback periods were evaluated using Equation 4. Figures 5, 6 illustrate the results.
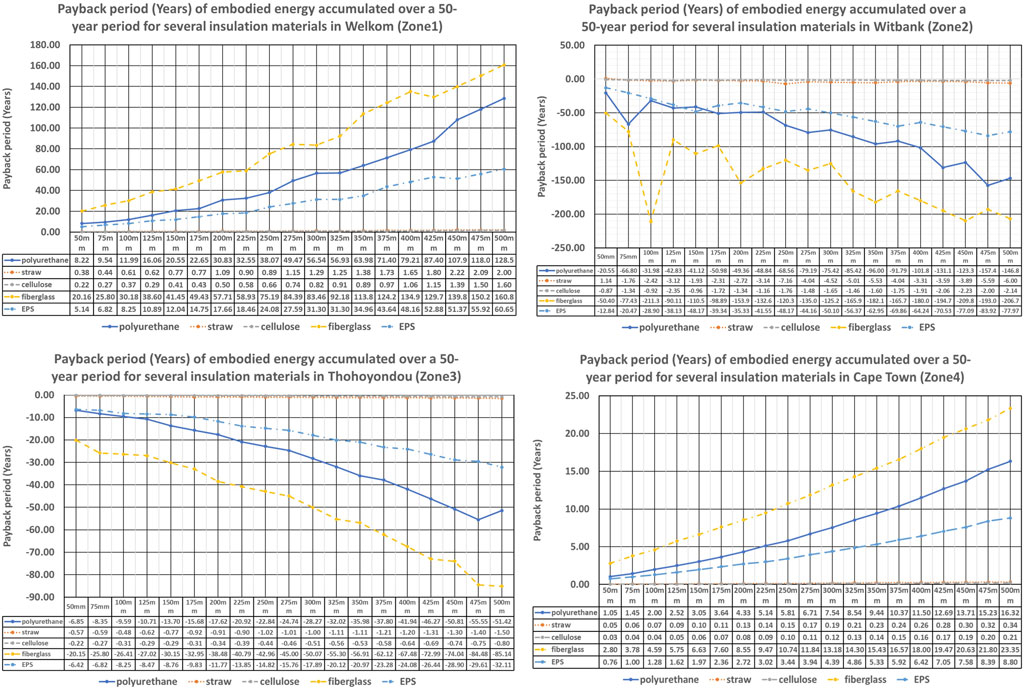
FIGURE 5. Energy payback period for Welkom (zone 1), Witbank (zone 2), Thohoyandou (zone 3), and Cape Town (zone 4) at different levels of insulation (50 mm to 500 mm). Source: author.
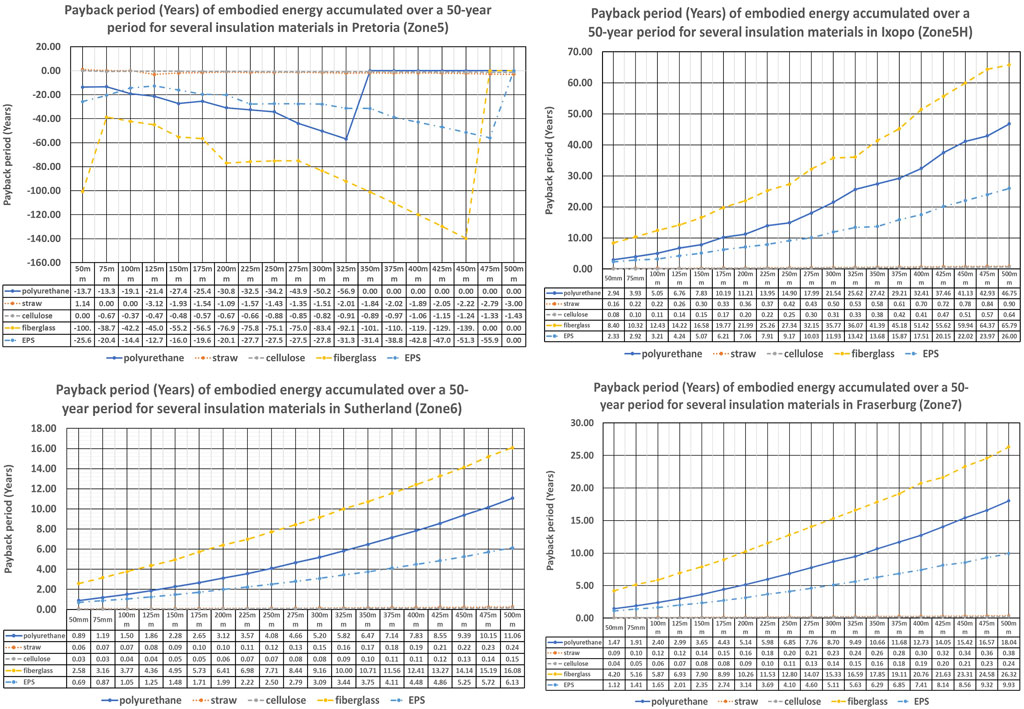
FIGURE 6. Energy payback periods for Pretoria (zone 5), Ixopo (zone 5H), Sutherland (zone 6), and Fraserburg (zone 7) at different levels of insulation (50 to 500 mm). Source: author.
Figures 5, 6 show that using wall insulation in Witbank (zone 2), Thohoyandou (zone 3), and Pretoria (zone 5) does not lead to energy savings, but rather leads to more energy consumption. Therefore, it is inadvisable to use any of these five insulation materials in cavity walls for Witbank (zone 2), Thohoyandou (zone 3), and Pretoria (zone 5) for this type of building typology. Welkom (zone 1) (shown in Figure 6) corresponded to the highest payback periods. Apart from cellulose and straw and the lower thickness levels of EPS and polyurethane, Welkom (zone 1) yields very high payback periods for fiberglass, polyurethane, and EPS. Therefore, apart from straw, cellulose, and low thicknesses for EPS and polyurethane, it would not be advisable to use these insulations (fiberglass, polyurethane, and EPS) in Welkom (zone 1).
Generally, Sutherland (zone 6) had the lowest positive payback periods (maximum of 16.08 years), followed by Cape Town in zone 4 (maximum of 23.35 years), Fraserburg in zone 7 (26.32 years), Ixopo in zone 5H (maximum of 65.79 years), and Welkom in zone 1 (maximum of 160.8 years). The maximum energy payback periods generally occurred with fiberglass. The payback period, generally, increased with insulation thickness for Welkom, Cape Town, Ixopo, Sutherland, and Fraserburg (zones 1, 4, 5H, 6, and 7). The thicker insulation material consumed more embodied energy and, therefore, required a longer period to balance the embodied energy consumed (through operational energy savings).
Cellulose and straw had the lowest payback periods and could easily be used in all zones, except in Witbank (zone 2), Thohoyandou (zone 3), and Pretoria (zone 5). They were followed by EPS, polyurethane, and fiberglass, in that order.
3.5 Net saved energy after 50 years
3.5.1 General results of analysis based on insulation
Equation 2 was used to evaluate the net saved energy after 50 years. Only the results for cellulose, polyurethane, fiberglass, and straw are presented as shown in Figure 7.
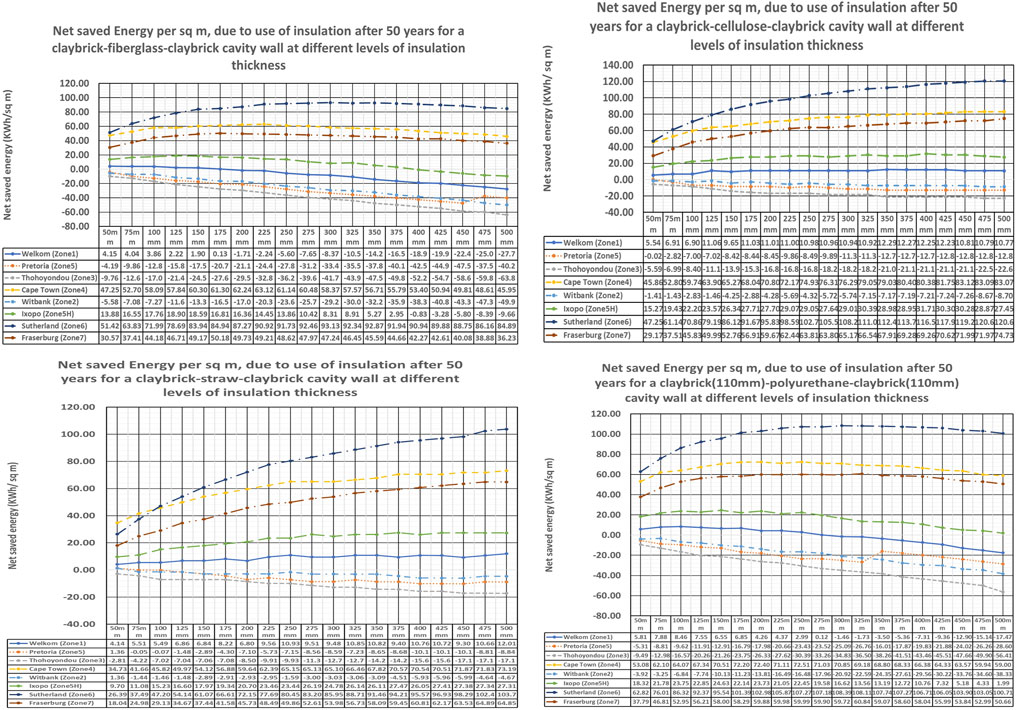
FIGURE 7. Net saved energy after 50 years for cellulose, polyurethane, fiberglass, and straw. Source: author.
The line graph for each zone (where the net saved energy values are positive throughout) is curved, with the gradient being higher at lower insulation thickness levels. The graph line tends to flatten (and in some cases, like polyurethane, it begins to dip) as the insulation thickness is increased. This implies that the net saved energy per millimeter of added insulation is higher when the insulation thickness is low. The positive net energy savings returns due to an increase in insulation thickness tend to reduce as the insulation thickness is increased. Except for Witbank (zone 2), Thohoyandou (zone 3), and Pretoria (zone 5), there is an optimum insulation thickness for each zone that yields the highest net energy savings returns. Sutherland (zone 6), Cape Town (zone 4), and Fraserburg (zone 7) benefit most from insulation through positive net energy savings, in that order. The positive net energy savings of Sutherland (zone 6), Fraserburg (zone 7), or Cape Town (zone 5) are more than twice the savings in Ixopo (zone 5H). On the other hand, the positive net energy savings for Ixopo (zone 5H) are more than twice those in Welkom (zone 1).
The optimum thickness for polyurethane in the different energy zones can also be estimated from Figure 7. For zone 1 (Welkom), it is approximately 100 mm; for zone 4 (Cape Town), it is approximately 250 mm; for zone 5H (Ixopo), it is approximately 150 mm; for zone 6 (Sutherland), it is approximately 300 mm; and for zone 7 (Fraserburg), it is approximately 325 mm. This pattern agrees with Dong et al. (2023), which states that optimal R-values of materials considerably reduce where the temperature range between summer and winter increases. The temperature ranges in winter and summer for places like Welkom tend to be higher than the temperature ranges in Cape Town and Fraserburg. These low optimal R-values will correspond to low insulation thickness levels, and hence shorter payback periods (Figures 5, 6). Beyond the thickness of 325 mm, polyurethane cannot be used in Pretoria because it leads to annual hours of no comfort exceeding the 5% maximum limit. The sudden kinky-shaped appearance after 325 mm, followed by a straight-line slope, indicates that thicknesses above 325 mm in Pretoria do not meet the comfort requirements as per SANS 10400-XA.
Table 5 shows the minimum and maximum net energy saving per square meter of the net floor area after 50 years for the insulation materials and the energy zones.
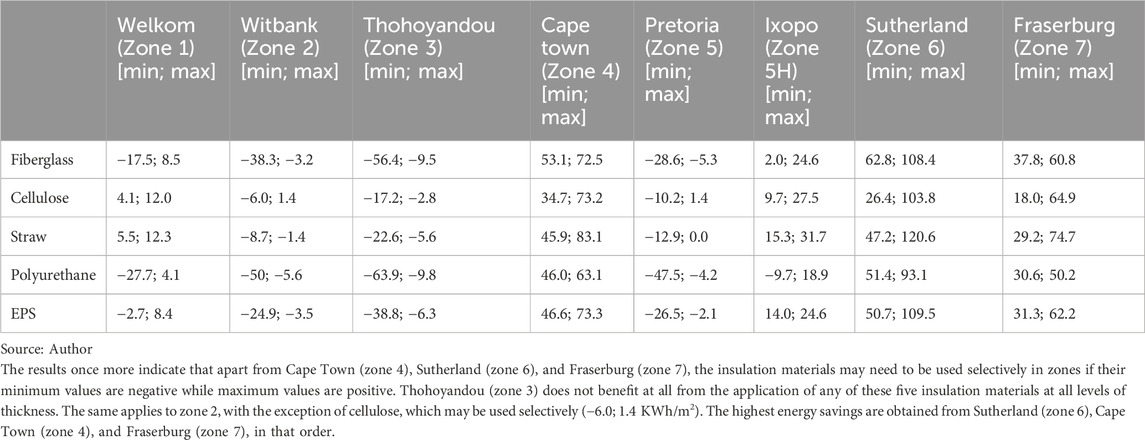
TABLE 5. Minimum and maximum net energy savings per square meter of the nett floor area (KWh/m2) after 50 years.
3.5.2 General results for the net saved energy after 50 years based on zones
Eight tables were created, with each table corresponding to a particular zone. The net energy savings per square meter of the net floor area for the insulation materials at the different levels of insulation thicknesses were evaluated and given in each table. This provided an insight into the insulation preferences for each zone at various levels of thickness. Figures 8, 9 illustrate this information. The results show that the choice of the best insulation material based on the highest net saved energy per square meter (after 50 years) may keep changing based on the zone and the insulation thickness levels. The details are presented below.
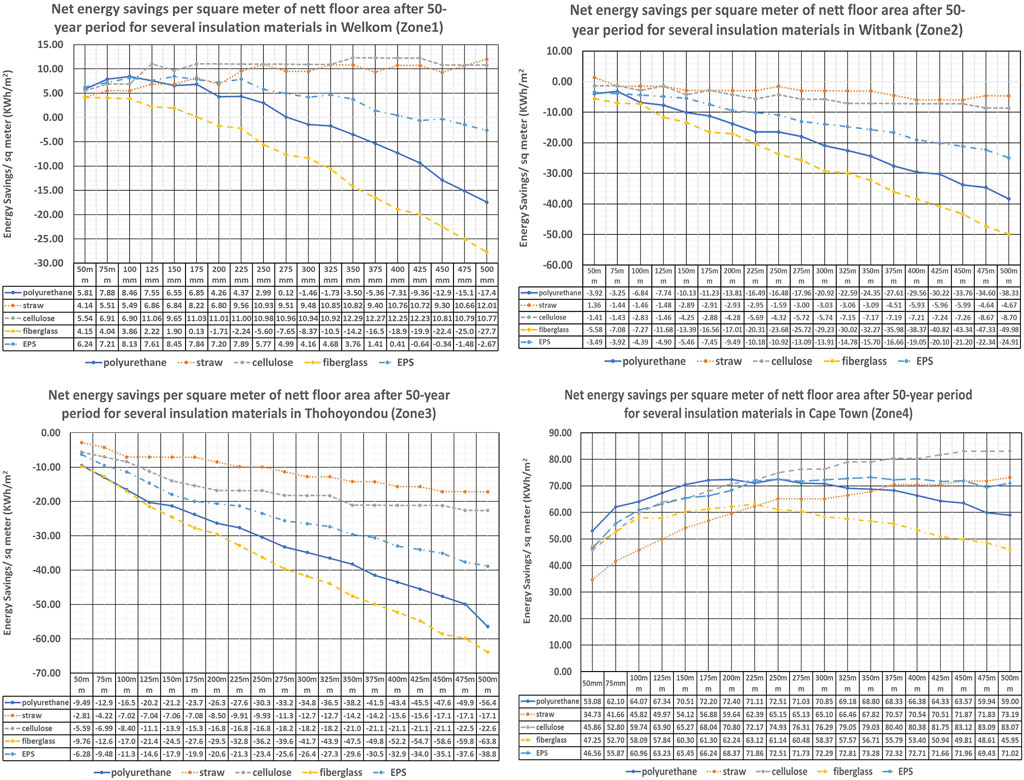
FIGURE 8. Net saved energy after 50 years in Welkom (zone 1), Witbank (zone 2), Thohoyandou (zone 3), and Cape Town (zone 4). Source: author.
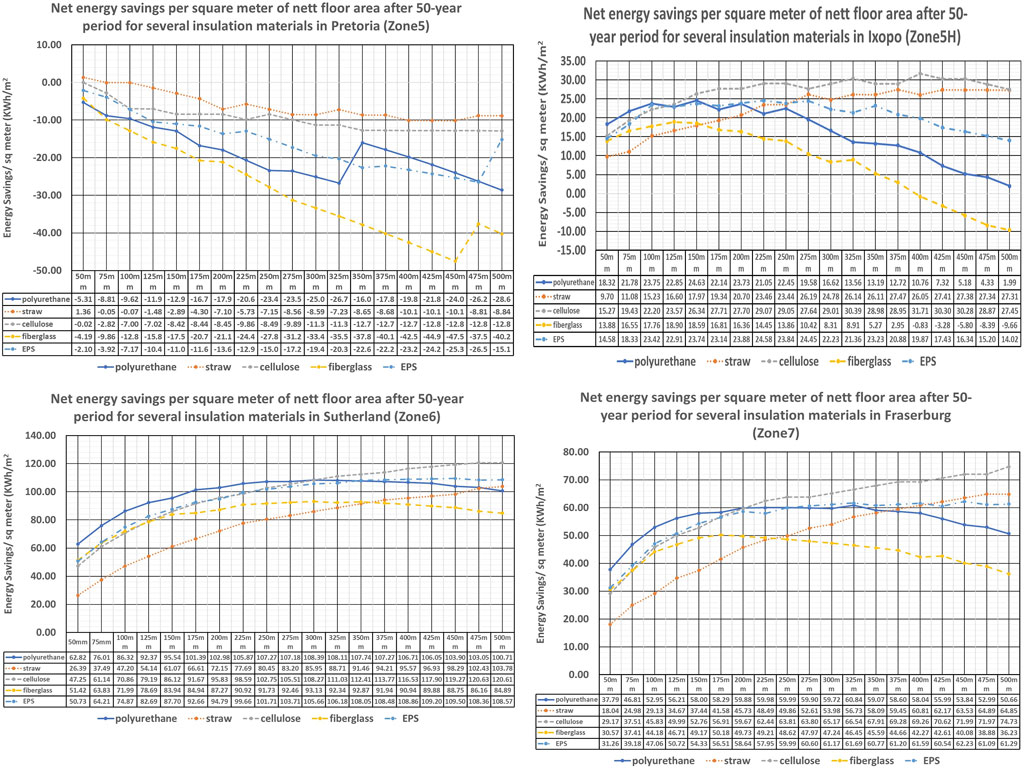
FIGURE 9. Net saved energy after 50 years in Pretoria (zone 5), Ixopo (zone 5H), Sutherland (zone 6), and Fraserburg (zone 7). Source: author.
3.5.2.1 Welkom (zone 1)
In zone 1, polyurethane was the best choice for insulation thicknesses between 50 and 100 mm. Cellulose insulation was the best choice when the thickness was between 100 and 475 mm. After cellulose, straw came in as the second-best insulator for thickness levels between 100 and 475 mm. While straw and cellulose tended to improve in performance as the thickness was increased, EPS, polyurethane, and fiberglass decreased in performance.
3.5.2.2 Witbank (zone 2)
Although straw was the best choice, followed by cellulose, there were no positive net energy savings for all insulation materials in zone 2 (except for straw below 50 mm). Their performances worsened with an increase in insulation thickness.
3.5.2.3 Thohoyandou (zone 3)
Although straw was the best choice, followed by cellulose, there were no positive net energy savings for all insulation materials in zone 3. Their performances also worsened with an increase in insulation thickness. Just as in Witbank (zone 2) and Welkom (zone 1), fiberglass had the worst performance in zone 3. Just as in Witbank and Welkom, the annual heating and cooling loads (hours) that were not met never exceeded the 5% limit of SANS 10400-XA standards.
3.5.2.4 Cape Town (zone 4)
In Cape Town (zone 4), polyurethane was the best choice for insulation thicknesses between 50 and 200 mm, followed by straw and EPS. Cellulose was the best choice for thicknesses between 325 and 500 mm, followed by EPS and later by straw. All the insulation materials except fiberglass (at higher thickness levels), polyurethane (at higher thickness levels), and EPS (at higher thickness levels) tended to significantly increase in performance (and therefore had higher net energy savings) as the insulation thickness was increased. Straw was the worst performer for insulation thicknesses of up to 225 mm. For insulation thicknesses greater than 225 mm, fiberglass had the worst performance.
Figure 9 shows the net energy savings per square meter of the net area in Pretoria (zone 5), Ixopo (zone 5H), Sutherland (zone 6), and Fraserburg (zone 7).
3.5.2.5 Pretoria (zone 5)
In Pretoria, although straw and cellulose were the best performers, it was not beneficial to use any of these five insulation materials in zone 5 because all of them yield negative net energy savings. In addition, if more than 325 mm thickness of fiberglass is used, it would lead to annual hours outside the comfort limits (19°C–25°C) being exceeded. This explains the kinky-shaped changes in the graphs at 325 mm for polyurethane, at 450 mm for fiberglass, and at 475 mm for EPS.
3.5.2.6 Ixopo (zone 5H)
In Ixopo, polyurethane was the best choice for insulation thicknesses of 50–100 mm. Cellulose performed the best for thicknesses between 100 and 500 mm, followed by straw, EPS, and polyurethane. Polyurethane and fiberglass significantly decreased in performance as the insulation thickness was increased.
3.5.2.7 Sutherland (zone 6)
In Sutherland, polyurethane was generally the best choice for insulation thicknesses of 50–275 mm. Cellulose insulation generally performed the best for thicknesses between 275 mm and 500 mm, followed by cellulose, EPS, polyurethane, and straw. There was a general increase in performance (higher net energy savings) as the insulation thickness was increased.
3.5.2.8 Zone 7
In zone 7, polyurethane was the best choice for insulation thicknesses between 50 mm and 200 mm. Cellulose was the best choice for insulation thicknesses between 200 and 500 mm, followed by polyurethane, EPS, or straw as the thickness increased. Just like in zone 4, all the insulation materials (except polyurethane and fiberglass) tended to significantly increase in performance (higher net energy savings) as the insulation thickness was increased. Straw was the worst performer for insulation thicknesses of up to 225 mm. Above 225 mm, fiberglass showed the worst performance.
Figures 8, 9 show that for low insulation thicknesses, polyurethane leads to the highest net energy savings after 50 years for Welkom, Cape Town, Ixopo, Sutherland, and Fraserburg (zones 1, 4, 5H, 6, and 7). Cellulose is preferable with an increase in insulation thickness.
3.6 Carbon payback periods and carbon emission savings after 50 years
Equations 3 and 5 were used to evaluate the savings on carbon emissions and the carbon emissions payback periods. There was a generally low sensitivity in the carbon payback periods compared to energy payback periods. Therefore, the results for the net saved energy and energy payback periods were used as the basis for selecting suitable insulation since energy analysis displayed greater sensitivity in payback periods.
4 Discussion
This study considered whether it was beneficial to use each of the five insulation materials (straw, cellulose, fiberglass, polyurethane, and EPS) for a cavity wall (with an air gap thickness of 50 mm) clay brick masonry residential building whose net floor area was 105.4 m2, within several locations located in the seven energy zones for South Africa. The study endeavored to first implement an energy-efficient design as much as possible using the passive design strategy recommendations from the Climate Consultant and the SANS 10400-XA building energy efficiency standards before evaluating the embodied and operational site energy and emissions. The SANS 10400-XA shading multipliers were applied to obtain minimum applicable shading depths of 0.62 (Welkom), 0.68 (Fraserburg and Ixopo), 0.54 (Pretoria and Witbank), 0.73 (Cape Town and Sutherland), and 0.49 (Thohoyandou).
Wall envelope insulation benefits in the energy zones: The addition of wall insulation materials as measures did not lead to operational site energy savings in Witbank (zone 2), Thohoyandou (zone 3), and Pretoria (zone 5). These results indicate that thermal insulation is not necessarily beneficial for all climatic conditions for certain building typologies in zones such as zone 5 (Pretoria), zone 2 (Witbank), and zone 3 (Thohoyandou). This agrees with those of previous research done elsewhere in South America, which showed that the use of thermal insulation can increase integrated annual thermal load, especially in hot climates (Melo et al., 2015). Similarly, research carried out in Japan showed that there was no need to use insulation in Japanese climate zone VI, which had the lowest optimal thermal resistance values (Dong et al., 2023). Climatic zone VI for Japan incidentally had the highest cooling degree days and the lowest heating degree days compared to other Japanese zones.
Energy payback periods: Straw and cellulose insulation materials had the lowest energy payback periods (less than 3 years for all zones), while fiberglass had the highest energy payback periods (the highest value being greater than 160 years in Welkom or zone 1). Although insulation materials could be used in energy zone 1 (Welkom) due to some positive annual site energy savings, the high values of energy payback periods meant that only cellulose and straw insulation could be used at all levels of insulation thickness considered (50–500 mm) in Welkom. Polyurethane and EPS could only be used at low insulation thickness levels in Welkom. The preference according to lowest energy payback periods was Sutherland in zone 6, Cape Town in zone 4, Fraserburg in zone 7, Ixopo in zone 5H, and Welkom in zone 1. This preference corresponded also to the preference according to the highest net energy savings, which occurred either with the use of polyurethane or cellulose. The remaining three locations, namely, Witbank (zone 2), Thohoyandou (zone 3), and Pretoria (zone 5), never benefitted from the wall envelope insulation measures. The order of preference of insulation materials (with reference to the energy payback period) was cellulose, straw, EPS, polyurethane, and then fiberglass. Dong et al., 2023 showed that the optimal thermal insulation R-value (and therefore optimal thickness) considerably decreased in climatic zones where the temperature ranges between summer and winter were higher. This may, in part, explain the short payback periods for Sutherland (zone 6), Cape Town (zone 4), and Fraserburg (zone 2).
Net saved energy after 50 years: If the energy savings were considered over the entire lifecycle of 50 years (rather than annually, when computing payback periods), then, contrary to the payback period results, it was preferable to use polyurethane over low insulation thickness levels and to use cellulose at higher insulation level thicknesses for Sutherland (zone 6), Cape Town (zone 4), Fraserburg (zone 7), Ixopo (zone 5H), and Welkom (zone 1). While straw and cellulose had the smallest (and therefore the best) energy payback periods, it was characteristic for either polyurethane (at lower levels of thickness) or cellulose (at higher levels of thickness) to be associated with the highest energy savings after 50 years for Welkom (zone 1), Cape Town (zone 4), Ixopo (zone 5H), Sutherland (zone 6), and Fraserburg (zone 7). On the other hand, straw (at lower levels of thickness) and fiberglass (at higher levels of thickness) were associated with the lowest energy savings after 50 years in the same five locations.
Since straw is a bio-insulation material, concerns over its durability, insect resistance, corrosion resistance, and flame retardancy exist, despite it being eco-friendly (Dong et al., 2023). Straw needs also to be protected against water logging to maintain its full service life. Though cellulose is environmentally friendly and recyclable, it is necessary to add inorganic additives to it to prevent mold growth and increase fire resistance. However, cellulose fiber has the added advantage of assisting in maintaining a steady humidity value in the indoor air of buildings (Pal et al., 2021). The service life (durability) of cellulose is significantly lower than that of other insulation materials. Polyurethane has low fire resistance, and most resistance additives compromise the thermal performance. Proposals have been made to use silica aerogels or polyols, which tend to be more effective (Tao et al., 2023). Though a higher moisture content lowers its thermal resistivity, polyurethane has good structural strength and is environmentally friendly, if it is not burnt. Overall, cellulose insulation was more consistent in terms of low energy payback periods and high net energy savings per net floor area over 50 years (at higher levels of insulation thickness). However, polyurethane could also be used at lower insulation thicknesses whose payback periods (in years) do not exceed the lifecycle analysis period used (50 years).
Summary: Wall envelope insulation materials behave differently in the seven energy zones of South Africa. However, the behavior is consistent with general research findings elsewhere. Polyurethane tended to perform well over short insulation thicknesses, while cellulose tended to perform well over higher thickness levels for the cavity wall envelope corresponding to the detached building typology. The locations that benefited most from wall envelope thermal insulation were Sutherland (zone 6), Cape Town (zone 4), Fraserburg (zone 7), Ixopo (zone 5H), and Welkom (zone 1). Since the thermal conductivity of materials varies with changes in temperature and moisture content, there are limitations to the results of this research (Tariku et al., 2023). The results are also limited to residential buildings with cavity wall envelopes and the derived window-to-wall ratios for the front (0.277), back (0.240), left (0.05), and right (0.05) envelope wall facades. The results are also limited to the eight locations (Welkom, Witbank, Thohoyandou, Cape Town, Pretoria, Ixopo, Sutherland, and Fraserburg) in each of the seven energy zones of South Africa (zones 1, 2, 3, 4. 5, 5H, 6, and 7) and their minimum derived shading depths according to the SANS 10400-XA standard. The service lives used for the insulation materials also are based on the assumption that they are installed and cared for well according to the guidelines. For example, straw will not reach a service life of 100 years if it is allowed to become waterlogged. Further research can consider the application of newer insulation materials within the confines of the SANS 10400-XA standards. Such materials include phase-change materials (PCMs), other bio-insulation materials (such as oil palm wood, hemp, glue, and bamboo fibers), agricultural waste materials, and recycled insulation materials (such as recycled plastic and polystyrene). It is also important to consider the influence of shading depths on the relative performance of insulation materials.
Data availability statement
The datasets presented in this study can be found in online repositories. The names of the repository/repositories and accession number(s) can be found in the article/Supplementary Material.
Author contributions
EK: conceptualization, data curation, formal analysis, investigation, methodology, software, supervision, validation, writing–original draft, and writing–review and editing. SM: conceptualization, methodology, project administration, and writing–review and editing. BB: conceptualization, project administration, supervision, and writing–review and editing. EA-K: formal analysis, visualization, and writing–review and editing.
Funding
The author(s) declare that no financial support was received for the research, authorship, and/or publication of this article.
Acknowledgments
We acknowledge support from Nelson Mandela University (NMU) and the South African Bureau of Standards (SABS).
Conflict of interest
The authors declare that the research was conducted in the absence of any commercial or financial relationships that could be construed as a potential conflict of interest.
Publisher’s note
All claims expressed in this article are solely those of the authors and do not necessarily represent those of their affiliated organizations, or those of the publisher, the editors, and the reviewers. Any product that may be evaluated in this article, or claim that may be made by its manufacturer, is not guaranteed or endorsed by the publisher.
Author disclaimer
The views expressed in this article belong to the author (s) only. The views are not an official position of either the institution to which the authors are affiliated or the funder (s) of the research.
Supplementary material
The Supplementary Material for this article can be found online at: https://www.frontiersin.org/articles/10.3389/fbuil.2023.1305029/full#supplementary-material
References
Abouhamad, M., and Abu-Hamd, M. (2021). Life cycle assessment framework for embodied environmental impacts of building construction systems. Sustainability 13 (2021), 461. doi:10.3390/su13020461
Alla, S. A., Bianco, V., Tagliafico, L. A., and Federico, S. (2020). Life-cycle approach to the estimation of energy efficiency measures in the buildings sector. Appl. Energy 264, 114745. doi:10.1016/j.apenergy.2020.114745
ARUP (2022). Carbon footprint of façades: significance of glass. Findings from the life cycle assessment of 16 façade typologies and 18,000 design simulation. [pdf] Available at: https://www.shareyourgreendesign.com/wp-content/uploads/2022/08/texto-3.pdf (Accessed July 15, 2023).
Bhorkar, M. P., Choudhary, P., Chawhan, A., Bijwe, A., and Devgade, K. (2021). “Carbon footprint of a multi-storied residential building during the construction process,” in International Conference on Advances in Civil Engineering (ICACE 2021). IOP Conf. Series: Materials Science and Engineering 1197, Guntur, India, 25th-26th June 2021. doi:10.1088/1757-899X/1197/1/012022
Black Hills Professional Home Inspections (2023). Building materials life expectancy chart. 20123 Available at : https://www.bhhomeinspections.com/building-materials-life-expectancy-chart/ (Accessed June 22, 2023).
Carbon Leadership Forum (2017). Embodied carbon benchmark study LCA for low carbon construction: Part One. [pdf] Available at : https://carbonleadershipforum.org/wp-content/uploads/2017/02/CLF-Embodied-Carbon-Benchmark-Study.pdf (Accessed on July 22, 2023).
Chastas, P., Theodosiou, T., Kontoleon, K. J., and Bikas, D. (2018). Normalising and assessing carbon emissions in the building sector: a review on the embodied CO2 emissions of residential buildings. Build. Environ. 130, 212–226. doi:10.1016/j.buildenv.2017.12.032
Circular Ecology (2023). Inventory for carbon and energy database. Available at: https://circularecology.com/embodied-carbon-footprint-database.html (Accessed May 26, 2023).
Climate OneBuilding Org (2023). Repository of free climate data for building performance simulation. Available at: https://climate.onebuilding.org/ (Accessed on June 15, 2023).
Crawford, R. H. (2019). Embodied energy of common construction assemblies (Version 1.0). Melbourne: The University of Melbourne.
Dong, Y., Kong, J., Mousavi, S., Rismanchi, B., and Yap, P. (2023). Wall insulation materials in different climate zones: a review on challenges and opportunities of available alternatives. Thermo 3 (2023), 38–65. doi:10.3390/thermo3010003
Douzane, O., Promis, G., Roucoult, J. M., Tran Le, A. D., and Langlet, T. (2016). Hygrothermal performance of a straw bale building: in situ and laboratory investigations. J. Build. Eng. 8, 91–98. doi:10.1016/j.jobe.2016.10.002
EDGE (2016). EDGE materials embodied energy. [pdf] Available at: https://edgebuildings.com/wp-content/uploads/2022/04/201005-EDGE-Materials-methodology-report-v2.2.pdf (Accessed July 11, 2022).
Energy Institute (2022). Resources and data downloads. Available at: https://www.energyinst.org/statistical-review/resources-and-data-downloads (Accessed July 20, 2023).
Gallegos-Ortega, R., Magaña-Guzmán, T., Reyes-López, J. A., and Romero-Hernández, M. S. (2017). Thermal behavior of a straw bale building from data obtained in situ. a case in northwestern méxico. Build. Environ. 124, 336–341. doi:10.1016/j.buildenv.2017.08.015
Gervasio, H., Dimova, S., and Pinto, A. (2018). Benchmarking the life-cycle environmental performance of buildings. Sustainability 10, 1454. doi:10.3390/su10051454
Hlavac, M. (2022). Stargazer: well-formatted regression and summary statistics tables. R package version 5.2.3. Available at: https://CRAN.R-project.org/package=stargazer.
Hugo, J., Barker, A., and Hennie Stoffberg, H. (2014). The carbon footprint and embodied energy of construction material: a comparative analysis of South African BRT stations. Acta Structilia 21 (1), 45–78. doi:10.38140/as.v21i1.146
Hurtado, P. L., Rouilly, A., Vandenbossche, V., and Raynaud, C. (2016). A review on the properties of cellulose fibre insulation. Build. Environ. 96 (2016), pp170–177. doi:10.1016/j.buildenv.2015.09.031
IEA (2016). Basics for the assessment of embodied energy and embodied GHG emissions for building construction. Guideline for designers and consultants – Part 1. [pdf] Available at: http://www.iea-ebc.org/Data/publications/EBC_Annex_57_Guideline_for_Designers_Part_1.pdf (Accessed January 10, 2022).
IEA (INTERNATIONAL ENERGY AGENCY) (2022). World energy outlook 2022 [pdf]. Available at: https://iea.blob.core.windows.net/assets/830fe099-5530-48f2-a7c1-11f35d510983/WorldEnergyOutlook2022.pdf (Accessed May 09, 2023).
Insulation Company of America (2023). Expanded Polystyrene (EPS): a lightweight closed-cell insulation with endless applications. Available at: https://insulationcorp.com/eps/[Accessed July 23 2023].
Intelligent Communities Lifecycle (2023). Table 6: thermal conductivity, specific heat capacity and density. Available at: https://help.iesve.com/ve2021/table_6_thermal_conductivity__specific_heat_capacity_and_density.htm (Accessed May 12, 2022).
Khoukhi, M., Darsaleh, A. F., and Ali, S. (2020). Retrofitting an existing office building in the UAE: towards achieving low-energy building. Sustainability 12 (2020), 2573. doi:10.3390/su12062573
Kosir, M., Gostisa, T., and Kristl, Z. (2018). Influence of architectural building envelope characteristics on energy performance in Central European climatic conditions. J. Build. Eng. 15, 278–288. doi:10.1016/j.jobe.2017.11.023
Li, S., Foliente, G., Seo, S., Rismanchi, B., and Aye, L. (2021). Multi-scale life cycle energy analysis of residential buildings in Victoria, Australia – a typology perspective. Build. Environ. 195 (2021), 107723. doi:10.1016/j.buildenv.2021.107723
Li, Y., Hu, W., Hu, S., Li, Y., Zhu, D., and Wang, D. (2023). Fabrication of intrinsic flame-retarding rigid polyurethane foam with enhanced compressive strength and good thermal insulation. Polym. Degrad. Stab. 215 (2023), 110463. doi:10.1016/j.polymdegradstab.2023.110463
Liu, H., Li, J., Sun, Y., Wang, Y., and Zhao, H. (2020). Estimation method of carbon emissions in the embodied phase of low carbon buildings. Adv. Civ. Eng. 1 (2020), 1–9. doi:10.1155/2020/8853536
Ma, R., Ma, R., and Long, E. (2023). Analysis of the rule of window-to-wall ratio on energy demand of residential buildings in different locations in China. Heliyon 9, e12803. doi:10.1016/j.heliyon.2023.e12803
Marques, B., Tadeu, A., Almeida, J. A., António, J., and de Brito, J. (2020). Characterisation of sustainable building walls made from rice straw bales. J. Build. Eng. 28 (2020), 101041. doi:10.1016/j.jobe.2019.101041
Melo, A. P., Lamberts, R., Versage, R. S., and Zhang, Y. (2015). “Is thermal insulation always beneficial in hot climate?,” in Proceedings of BS2015: 14th Conference of International Building Performance Simulation Association, Hyderabad, India, December 7-9, 2015.
Netsch, N., Simons, M., Feil, A., Leibold, H., Richter, F., Slama, J., et al. (2022). Recycling of polystyrene-based external thermal insulation composite systems – application of combined mechanical and chemical recycling. Waste Manag. 150 (2022), 141–150. doi:10.1016/j.wasman.2022.07.001
Pal, R. K., Goyaz, P., and Sehgal, S. (2021). Effect of cellulose fibre-based insulation on thermal performance of buildings. Mater. Today Proc. 45 (2021), 5778–5781. doi:10.1016/j.matpr.2021.02.749
Reynoso, L. E., Romero, A. B. C., Viegas, G. M., and San Juan, G. A. (2021). Characterization of an alternative thermal insulation material using recycled expanded polystyrene. Constr. Build. Mater. 301, 124058. doi:10.1016/j.conbuildmat.2021.124058
RICS (2017). Whole life carbon assessment for the built environment. London: RICS Professional Statement. RICS. [pdf] Available at: https://www.rics.org/content/dam/ricsglobal/documents/standards/Whole_life_carbon_assessment_PS_Sept23.pdf (Accessed on August 17, 2023).
SABS0400 (1990). South African standard code of practice for the application of the national building regulations [pdf]. Available at: https://sans10400.co.za/wp-content/uploads/2012/12/SANS10400A.pdf (Accessed May 12, 2023).
SANS10400-XA (2022). The application of the National BuildingRegulationsPart X: environmental sustainability Part XA: energy usage in buildings. Pretoria, South Africa: SABS Standards Division. Available at: https://www.spectechonline.com/10400-xa (Accessed March 13, 2022).
Society of Building Science Educators (2023). Climate cosultant. Available at: https://www.sbse.org/resources/climate-consultant (Accessed July 15, 2023).
Solar365 (2023). Fiberglass insulation pros and cons. Available at: https://www.solar365.com/green-homes/insulation/fiberglass-insulation-pros-cons (Accessed July 26, 2023).
STATSA (2021). General household survey, 2020. Available at: https://www.datafirst.uct.ac.za/dataportal/index.php/catalog/887 (Accessed April 20, 2023).
Tahmasebinia, F., Jiang, R., Sepasgozar, S., Wei, J., Ding, Y., and Ma, H. (2022). Implementation of bim energy analysis and Monte Carlo simulation for estimating building energy performance based on regression approach: a case study. Buildings 12, 449. doi:10.3390/buildings12040449
Tao, J., Yang, F., Wu, T., Shi, J., Zhao, H., and Rao, W. (2023). Thermal insulation, flame retardancy, smoke suppression, and reinforcement of rigid polyurethane foam enabled by incorporating a P/Cu-hybrid silica aerogel. Chem. Eng. J. 461 (2023), 142061. doi:10.1016/j.cej.2023.142061
Tariku, F., Shang, Y., and Molleti, S. (2023). Thermal performance of flat roof insulation materials: a review of temperature, moisture and aging effects. J. Build. Eng. 76 (2023), 107142. doi:10.1016/j.jobe.2023.107142
Thermtest Instruments (2023). Materials thermal properties database. Available at: https://thermtest.com/thermal-resources/materials-database (Accessed July 02, 2023).
US Department of Energy (2023). Insulation materials. Available at https://www.energy.gov/energysaver/insulation-materials (Accessed July 10, 2023).
Worldpopulationreview (2023). Carbon footprint by country 2023. Available at: https://worldpopulationreview.com/country-rankings/carbon-footprint-by-country (Accessed May 10, 2023).
Zhang, L., Zhang, L., and Wang, Y. (2016). Shape optimization of free-form buildings based on solar radiation gain and space efficiency using a multi-objective genetic algorithm in the severe cold zones of China. Sol. Energy 132, 38–50. doi:10.1016/j.solener.2016.02.053
Keywords: energy efficiency, lifecycle analysis (LCA), embodied emissions, embodied energy, source energy, site energy, energy savings, energy payback
Citation: Kabundu E, Mbanga S, Botha B and Ayesu-Koranteng E (2024) Relative comparison of the benefits of wall envelope insulation materials in the South African energy zones, subject to the new national building energy efficiency standards. Front. Built Environ. 9:1305029. doi: 10.3389/fbuil.2023.1305029
Received: 30 September 2023; Accepted: 26 December 2023;
Published: 24 January 2024.
Edited by:
Rania Rushdy Moussa, British University in Egypt, EgyptReviewed by:
Hasim Altan, Prince Mohammad Bin Fahd University, Saudi ArabiaMarianne Nabil Guirguis, British University in Egypt, Egypt
Copyright © 2024 Kabundu, Mbanga, Botha and Ayesu-Koranteng. This is an open-access article distributed under the terms of the Creative Commons Attribution License (CC BY). The use, distribution or reproduction in other forums is permitted, provided the original author(s) and the copyright owner(s) are credited and that the original publication in this journal is cited, in accordance with accepted academic practice. No use, distribution or reproduction is permitted which does not comply with these terms.
*Correspondence: Emmanuel Kabundu, a2FidW5kdWVtbWFudWVsQGdtYWlsLmNvbQ==
†ORCID: Emmanuel Kabundu, orcid.org/0000-0001-6201-465X; Sijekula Mbanga, orcid.org/0000-0001-9439-7552; Brink Botha, orcid.org/0000-0001-9497-7872; Emma Ayesu-Koranteng, orcid.org/0000-0001-8140-7053