- 1Civil Engineering, Bandung Institute of Technology, Bandung, Indonesia
- 2Indonesian Geotechnical Inztitute, Yogyakarta, Indonesia
- 3Civil Engineering, Institut Teknologi Indonesia, Tangerang, Indonesia
Basin presence is believed to affect the ground surface response due to earthquakes, particularly in areas around the basin edge. Previous studies showed that 1-D and 2-D wave propagation analyses resulted in significant differences in amplification at the basin edge. However, the link between 1-D and 2-D responses has not been studied for engineering practices. In practical application, seismic studies were commonly performed using 1-D analysis, for example, to develop a city micro-zonation map. Based on practical considerations, it is necessary to estimate the scaling factor for the 1-D analysis by considering the basin presence, particularly for one containing soft soil. There are three stages carried out in this study. The first stage: collecting data on some basin geometries for the 2-D modeling references and then defining selected site class and input motions. The second stage: modeling 1-D and 2-D wave propagation using D-MOD and Fast Lagrangian Analysis of Continua (FLAC), respectively. The third stage: comparing spectral acceleration resulting from the 1-D and 2-D analyses to obtain the scaling factors. This research studied and reported the relationship between PGA values varied as 0.2 g, 0.3 g, 0.4 g, and 0.5 g, basin geometry (e.g., the angle was set to 5°, 10°, 15°, 30°, and 45°, with depth and width variations of 0.0125, 0.025, 0.05, 0.075, 0.1, 0.2, and 0.4, while the basin width was adjusted to 500 m, 1 km, 2 km, and 4 km), and the spectral acceleration in several observation points on the ground surface. Based on this evaluation, a series of scaling factors are proposed. These factors can be used for spectral acceleration from available hazard maps, commonly developed based on 1-D analysis. The application example of this scaling factor is presented in this study, using the Bandung Basin case.
1 Introduction
Body waves propagate from an earthquake source at fault in a bedrock to all directions. At the interface between soil or rock layers, the waves can be forwarded or reflected (Figure 1A). The waves eventually reach the surface and introduce ground surface motion. The presence of the basin results in complexity in wave propagation, particularly from the bedrock to the surface around the basin edge (Figure 1B).
The presence of the basin introduces a combination of entrapment and reverberation of seismic waves on the soft sedimentary deposits above the bedrock basin surface (Ayoubi, 2018). Mexico City, which is located above a soft soil sedimentary basin, experienced significant damages associated with the 1985 Michoacán earthquake. It is believed that this 8.1 Mw earthquake resulted in a relatively large amplification of seismic waves and a long duration of ground motion in a sedimentary basin of Mexico City. The bowl-like shape of the basin containing soft alluvial soil can trap body waves, causing some of the incoming body waves to propagate through the soil as surface waves (Kramer, 1996). These surface waves produce stronger and longer shocks than body waves.
The effect of basin geometry on ground response acceleration has been investigated using the 1-D, 2-D, and 3-D wave propagation analysis methods. Bard and Gariel (1986) studied the basin effect on ground motion by comparing amplification at the edge and the center of the basin resulting from the 1-D and 2-D methods. They reported significant differences in the amplification from these methods, particularly in the long period.
Bakir et al. (2002) compared 1-D and 2-D methods for evaluating the presence of the basin using the 1995 Dinar earthquake in Turkey. They described the possible explanation about effects of the basin edge on spectral acceleration using 1-D and 2-D analyses. The results showed that the 1-D analysis did not predict the spectral response in heavily damaged areas, located at the basin edge. They proposed the 2-D and 3-D methods to eliminate the shortcomings of the 1-D method, particularly at the basin edge. The amplification from the 1-D analysis needs to be adjusted or scaled using that of the 2-D and 3-D analyses.
The 2-D and 3-D methods are commonly more suitable for the basin area than the 1-D method. Nevertheless, the 1-D method is more popular in the engineering practice community due to several reasons. This method requires less computational resources and calculation time than the 2-D and 3-D methods. Additionally, the 1-D method is more readily available than the others. This method has been extensively used for developing micro-zonation maps for various cities in Indonesia. The current Indonesian micro-zonation maps should be used cautiously if it is implemented in the basin area.
In this study, the 1-D and 2-D methods were applied to a basin area containing site Class E soft soil. The effects of PGA, basin inclination or angle, and basin depth to width ratio on the ground surface acceleration response, particularly around the basin edge, were assessed using these methods. The amplification results from these methods were compared and evaluated to propose scaling factors. These scaling factors can be used to facilitate engineering practice to evaluate the ground response located around the basin, where the 1-D method is immediately available, but 2-D and 3-D methods are not accessible. Examples of scaling factor application in a 1-D-based micro-zonation map of Bandung, Indonesia, which is located on a basin, are presented in this study.
2 Basin effect on ground acceleration response
2.1 Ground response analysis
Ground surface response analysis is commonly used to solve many geotechnical earthquake engineering problems. For instance, it can be used to develop a design spectral response. Additionally, it is applied to assess liquefaction potential. This analysis is also important to evaluate the stability of soil embankments and retaining wall structures during an earthquake. Ground surface response analysis can be performed using a simple 1-D method or even more complex approaches, such as the 2-D and 3-D methods. To assist with the calculation, a variety of free and commercial license computer programs are available.
In this study, the 1-D analysis was performed using D-MOD 2000 (Matasovic and Ordonez, 2007), a non-linear effective stress ground response computer program. Soil non-linear response is expressed by a backbone curve with an inelastic behavior following the unloading–reloading of extended Masing rules (Pyke, 1979). This program can evaluate time-dependent pore water pressure and its effect on soil stiffness during earthquakes. Pore water pressure for sand and clay is regulated by semi-empirical models developed by Vucetic and Dobry (1988) and Matasovic and Vucetic (1995), respectively.
Although the 1-D site response method is widely used in geotechnical engineering practice, not all cases can be analyzed using the 1-D method. Complicated cases, including the presence of inclined/irregular ground surfaces, embedded structures, walls, and tunnels, demand 2-D or even 3-D methods. Ground response analysis around a basin edge also generally requires 2-D or 3-D methods (e.g., Bakir et al., 2002).
In this study, 2-D ground response analysis was conducted using the Fast Lagrangian Analysis of Continua (FLAC) computer program (Itasca, 2008). FLAC analyzes soil behavior based on explicit finite differences. The soil is modeled as a collection of discrete elements. Each element is defined by nodal points. The soil response is represented by nodal points. The behavior of each element follows linear or non-linear stress–strain laws defined in response to boundary conditions or to applied forces.
2.2 Previous studies
The effect of basin geometry on ground response has been studied by King and Tucker (1984). They measured ground motion along the transverse and longitudinal profiles across the Chushul Valley near the borders of Afghanistan and the former Soviet Union. Interpretation of the small earthquake response showed that 1-D site response analysis could well predict the ground response around the center of the valley. Nevertheless, the 1-D site response poorly predicted the ground response around the edges of the valley.
Bard and Gariel (1986) used an analytical approach to evaluate the 1-D and 2-D site responses of shallow and deep alluvial valleys. The amplification at the center of the valley for 1-D and 2-D methods was quite similar. However, the amplification at the edge of the valley for 1-D and 2-D cases was very different. The fit between the 1-D and 2-D amplification at the center of the valley is much better than that at the edges. It shows that 1-D analysis could not be used for the location around the basin edge.
Romo and Seed (1986) evaluated the spectral response from two different sites, namely, Universidad Nacional Autonoma de Mexico (UNAM) and the Secretary of Communication and Transportation (SCT). Although the magnitude of the 1985 Michoacán earthquake was large, the acceleration recorded at the UNAM site was only 0.03 g–0.04 g. However, acceleration time history at the SCT site showed that the peak acceleration was up to five times larger than that at the UNAM site. At a period of 2 seconds, the spectral acceleration reached a maximum value at the SCT site with a value 10 times more than that at the UNAM site. This indicates that a basin area containing soft soil yielded a greater amplification than that containing hard soil. Additionally, the spectral acceleration peaking around 2 s suggested that the earthquake possessed a high risk to buildings with 5–20 floors.
Further study about the basin effect was conducted by T. H. Seligman et al. (1989) to investigate the earthquake response of what they called an open-ended 2-D sediment-filled valley after the 1985 September 19 earthquake that devastated downtown Mexico City.
Kawase and Aki (1989) investigated the responses of two types of soft basins for incident SH, SV, P, and Rayleigh waves in a 2-D elastic half-space by using strong motions observed in Mexico City during the Michoacan, Mexico, earthquake of 1985. They showed the difficulty for simple 1-D models in reproducing the later part of the accelerogram observed in Mexico City.
To comprehensively study the site effects in the Mexico City basin for the 1985 Michoacan earthquake, Chavez-Garcia and Bard (1994) conducted 1-D and 2-D model analysis of wave propagation. They pointed out some conclusions about the possibility of doing the experiments and the new data required to find a truly satisfactory explanation of strong ground motion at the Mexico City basin.
Movahedasl and Ghayamghamian (2015) conducted extensive parametrical studies about the effects of 2-D small-scale sedimentary basins on strong ground motion characteristics. They provided numerical and field evidence on the 2-D effects of small basins and gave some recommendations for design codes. Cruz-Atienza et al. (2016) studied ground response acceleration in the Mexican basin. This basin consists of lake beds, transitional areas consisting of alluvial deposits, and hard rock areas. This study indicated that at a frequency of 0.5 Hz, large amplification values were found at the basin edge.
Several 1-D ground response studies on soft soil deposits located at basin areas have also been conducted in the Southeast Asian region. For example, Qodri et al. (2021) conducted a non-linear site response analysis of the Bangkok subsoils triggered by the Three Pagodas Fault. Then, Somantri et al. (2022) conducted a 1-D ground response study in Bandung, Indonesia. However, there is no basin effect that was considered in their analysis.
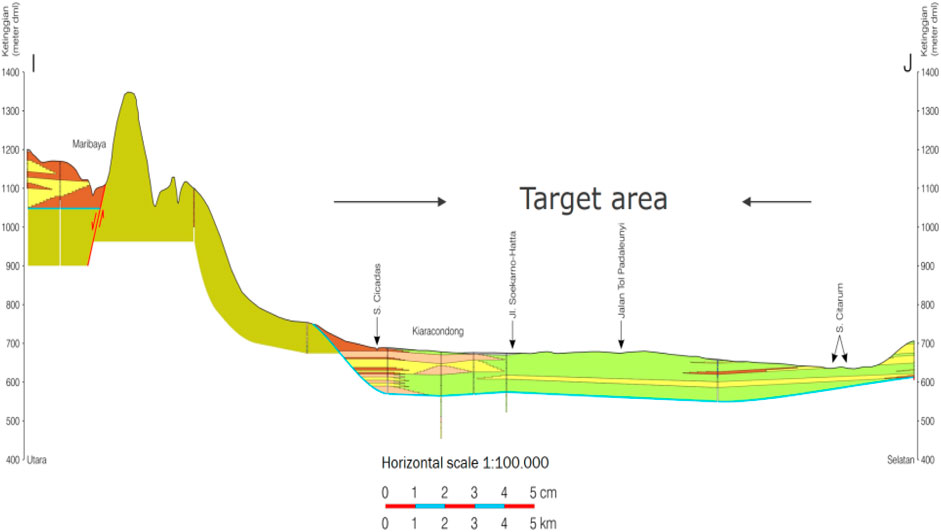
Sengara et al. (2011) studied the basin effect on the ground response acceleration in Bandung, Indonesia, to estimate peak ground surface acceleration and the amplification factor using 2-D finite element analysis. The Bandung Basin area is approximately 13 km wide and 200 km deep, extending from Cicadas to Citarum (Figure 2). Based on the geological map, the Bandung Basin is a floodplain deposit over a lake deposit. The lake deposit can be classified as lacustrine deposits. In the center of the basin, supposedly, a thick layer of soft or organic clays is found and is classified as alluvial and volcanic deposits with various compositions and textures.
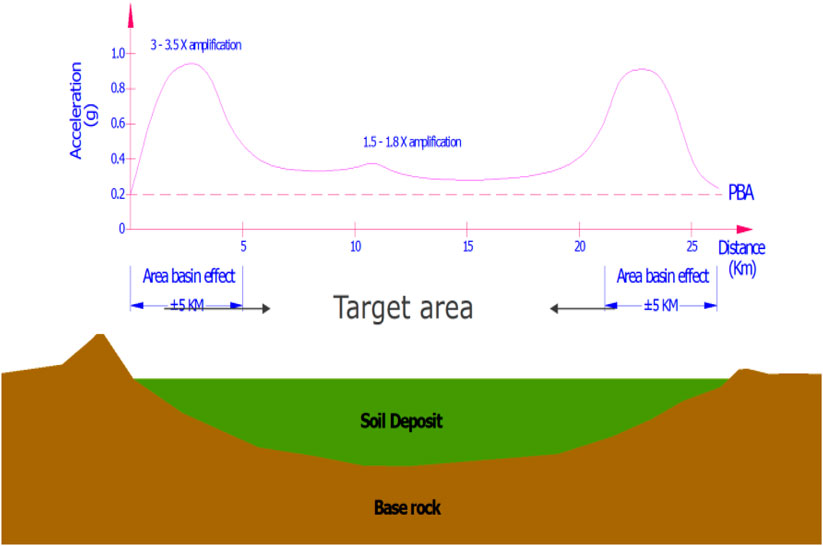
It is shown that the area affected by the basin, which is from the basin edge to 5 km, has a greater amplification factor value than the farther locations. As shown in Figure 3, the acceleration value on the edges also shows a greater value than that of the basin center, which is approximately 0.4 g–0.7 g.
All the previous studies clearly show that the presence of the basin affects the ground surface response due to the earthquake, particularly in areas around the basin edge. However, the link between 1-D and 2-D responses has not been studied for engineering practices. Based on practical considerations, it is necessary to estimate the scaling factor for the 1-D analysis by considering the basin presence, particularly for that containing soft soil. These scaling factors can be used to facilitate engineering practice to evaluate the ground response located around the basin, where the 1-D method is immediately available, but 2-D and 3-D methods are not accessible. These are a novelty of the study.
3 Research methodology
This research focused on proposing scaling factors for the 1-D wave propagation analysis. These factors were proposed based on the results of 2-D wave propagation analysis modeling at the basin using FLAC.
Some basin geometries were collected for the 2-D modeling references, as shown in Table 1. The site classes above this basin are also presented in this table. Modeling was carried out using a variety of parameters, such as PGA values, basin angle or inclination (θ), and the ratio of basin depth to basin width (D/W). In this study, the PGA value was varied as 0.2 g, 0.3 g, 0.4 g, and 0.5 g. The basin angle was set to 5°, 10°, 15°, 30°, and 45°. Depth/width variations were 0.0125, 0.025, 0.05, 0.075, 0.1, 0.2, and 0.4. The basin width was adjusted to 500 m, 1 km, 2 km, and 4 km.
3.1 Soil parameters and input motion
The 1-D and 2-D wave propagation analyses were carried out using the undrained total parameters, which are relevant to fast earthquake loading mechanisms. In this study, the shear wave velocity (Vs) value of the soft clay soil (SE site class) was set to 100 m/s. The corresponding standard penetration test value (N) of 2 was evaluated using Ohta and&Goto (1978), as presented in the following equation:
The undrained shear strength (cu) value was estimated using Terzaghi and Peck (1967), as shown in Eq. 2.
Based on the standard penetration test value (N) of 2, the undrained shear strength is 12 kPa.
The shear modulus (G) was evaluated using the relationship between Vs and density (ρ) in the following equation:
Given the density (ρ) value of 1,600 kg/m2 and shear wave velocity (Vs) of 100 m/s, the shear modulus (G) value is 16,000 kPa.
Assuming a Poisson’s ratio (ν) value of 0.4 for soft clay soil (Das, 2006), the bulk modulus (K) value was estimated using Eq. 6:
Given the G value of 1,600 kg/m2, the bulk modulus (K) value is 74,000 kPa.
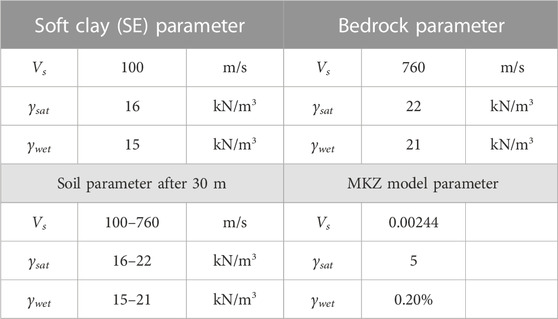
Initial soil parameters, including total unit weight (γ), can be seen in Table 2.
The 1989 Loma Prieta earthquake was used as an input motion (Figure 4). The mechanism of this earthquake was a strike–slip on the San Andreas Fault. This movement was attributed to the North American tectonic plate that shifted toward the north, while the large Pacific plate shifted southward with a magnitude of 6.9 and a maximum acceleration of 0.4 g.
3.2 1-D modeling
The 1-D wave propagation modeling was conducted using D-MOD 2000. This program requires several soil parameters, namely, shear modulus, maximum shear modulus (Gmax), shear wave velocity, and unit weight. In addition, for defining the bedrock, the D-MOD 2000 needs Vs and γ. This program applies the MKZ non-linear stress–strain model. The MKZ model relates initial shear stress (τmo) and initial shear modulus (Gmo) based on the reference shear strain (γr) of 2.44 × 10⁻³, as shown in the following equation:
Equation 1 shows the MKZ non-linear stress–strain model (Matasovic and Vucetic, 1995). In this equation, normalized shear stress (τ*) is a function of curve-fitting parameters of the non-linear hysteretic MKZ model (β and s), normalized initial shear modulus (G*mo), and normalized initial shear stress (τ*mo). Each superscript asterisk (*) indicates that the corresponding parameter is normalized by initial vertical effective stress (σ’vc). The example of D-MOD 2000 input parameters for the MKZ model is shown in Eq. 9:
The β and s parameters can be evaluated by performing manual trial–error or using curve fitting based on the refereed G/Gmax and damping ratio curves.
The Rayleigh damping coefficients are expressed by mass damping constant (αr) and stiffness damping constant (βr). These coefficients are a function of the soil’s natural period (T), a constant (n), and viscous damping (ξ in %). The T value is a function of soil layer thickness and Vs. In this study, n and ξ were taken as 5% and 0.2%, respectively.
The soil parameters, including saturated unit weight of soil (γsat) and moist unit weight of soil (γwet), in D-MOD 2000 are summarized in Table 3.
3.3 2-D modeling
The 2-D wave propagation modeling was carried out using FLAC. This program allows input motion of acceleration time histories or stress-time histories depending on the base rock assumption (i.e., rigid and flexible bases). A rigid base demands an input motion of acceleration time history, whereas a flexible base requires an input motion of stress time history. A rigid base stipulates that the waves are completely reflected from the base and no waves are absorbed by the base. Thus, a quiet boundary is not needed in the rigid base model. In contrast, the flexible base demands that half of the waves are absorbed by the base, so a quiet boundary is needed at the flexible base model.
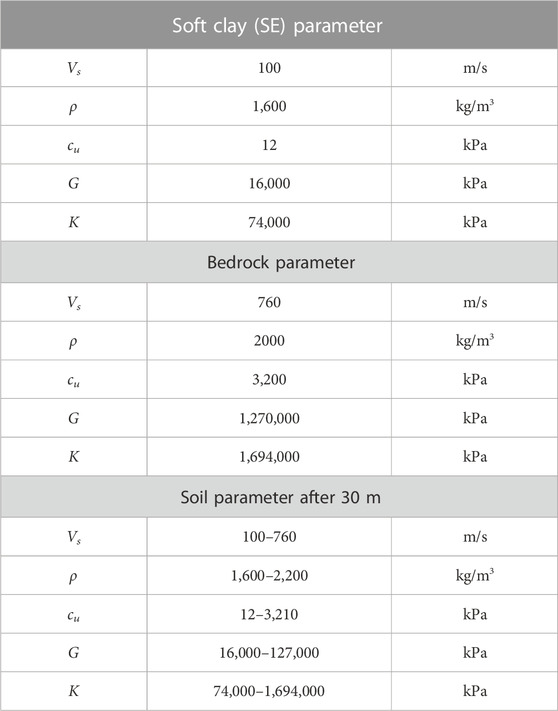
Table 4 presents ground parameters, such as Vs, G, ρ, cu, and K, in FLAC 2-D modeling for base rock and soft soil (site class SE) based on the Mohr–Coulomb soil model.
The FLAC 2-D also requires additional input parameters. These parameters include Rayleigh damping coefficients, grid dimensions, and computational time steps.
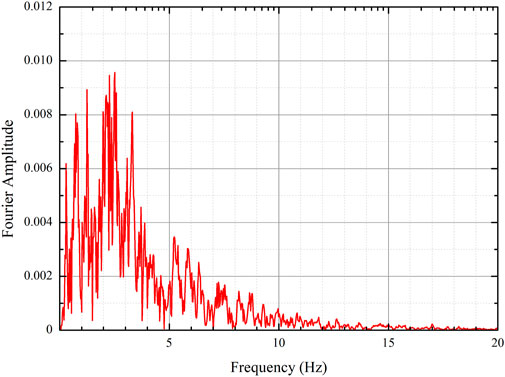
The Rayleigh damping is used to dampen the natural oscillations of the model similar to the 1-D analysis. Fourier amplitude shows that the maximum amplitude occurs at a frequency of 2.51 Hz (Figure 5). This maximum value was selected as the Rayleigh βr parameter. The Rayleigh αr parameter of 0.02 was taken based on a recommended value by FLAC 2-D.
Hysteretic damping was also used in FLAC 2-D based on a sigmoidal model with three parameters (Sig3 models). The Sig3 model is presented in Eq. 7:
where
Ms represents the secant modulus;
L represents the logarithmic strain;
a is 1.014;
b is −0.4792; and
x0 is −1.249.
a, b, and x0 values were selected based on Sun et al. (1988).
Maximum grid dimension (Δlmax) is required by FLAC 2-D to yield a convergent solution. The maximum grid dimension was calculated using Vs of the medium and the maximum wave frequency (fmax), as shown in Eq. 8:
Timestep calculation was carried out according to the corresponding mesh dimensions. The maximum timestep (Δtcrit) was calculated using Eq. 9:
where
Az represents the mesh zone area;
Ld represents the logarithmic strain.
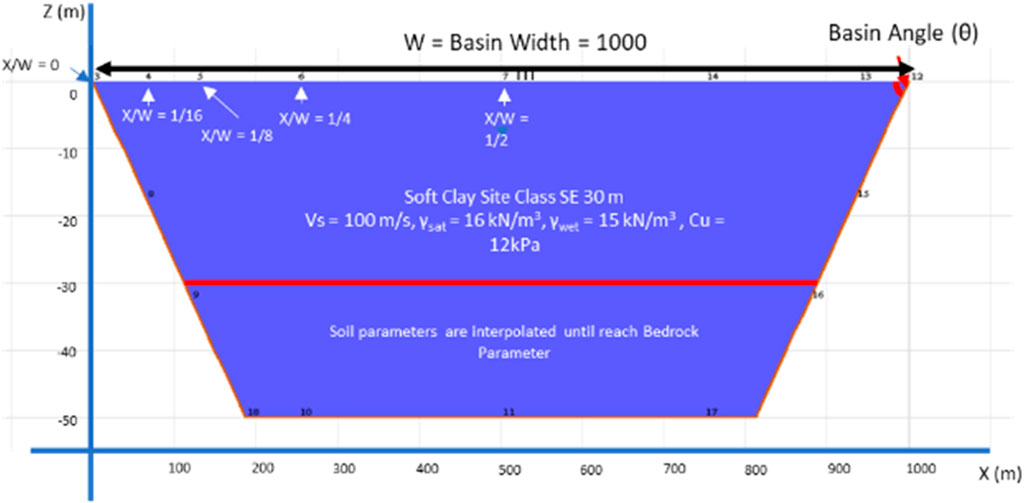
In the 1-D and 2-D models, the first 30 m was set as soft soil. At a greater depth to the base rock elevation, interpolated soil data from soft soils and base rock were used, as shown in Figure 6.
4 Result and discussion
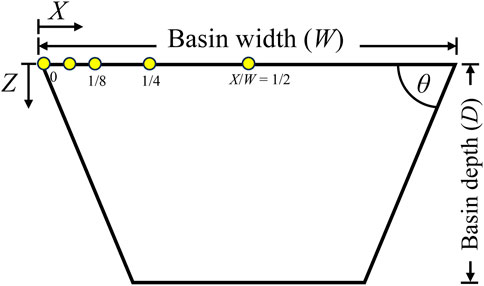
Spectral acceleration values for both 1-D and 2-D methods at several points were evaluated. These observation points were a function of location X relative to basin edge and basin width (W), namely, X/W of 0, 1/16, 1/8, 1/4, and 1/2. The basin geometry and observation points can be seen in Figure 7. In this model, a basin width of 1,000 m was used. To evaluate the effect of basin width on the spectral acceleration values, W of 500 m, 2,000 m, and 4,000 was also used.
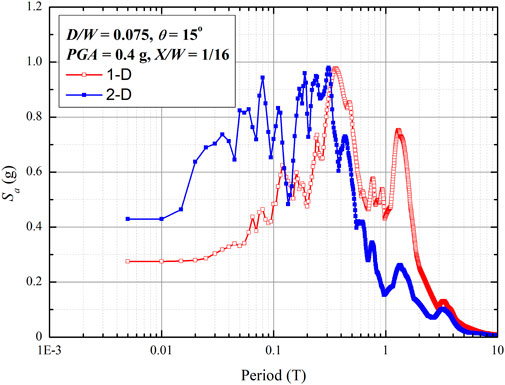
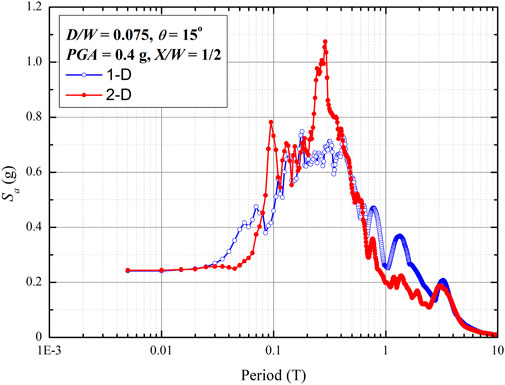
Figure 8 presents spectral acceleration values based on 1-D and 2-D methods at the basin edge or X/W = 1/16. A comparison of the 1-D and 2-D spectral acceleration values shows significant differences, particularly at periods below 0.1 s and 0.6 s–3 s. Figure 9 shows the spectral acceleration values from the 1-D and 2-D methods at the central part of the basin (i.e., X/W = 1/2). The spectral acceleration values from both methods are quite similar. These results confirmed (Bard and Gariel, 1986) that 1-D and 2-D methods resulted in similar spectral acceleration values at the basin center, whereas they yielded different spectral acceleration values at the basin edge.
The spectral acceleration values of the 1-D and 2-D methods at a period near 0 s were compared to estimate the scaling factors. The scaling factor describes a multiplier that can be implemented to the 1-D spectral acceleration so that it is equivalent to that of the 2-D method. A variety of parameters, such as PGA values, D/W, θ, and W, were evaluated to propose the corresponding scaling factors.
4.1 Scaling factor due to PGA (Fg)
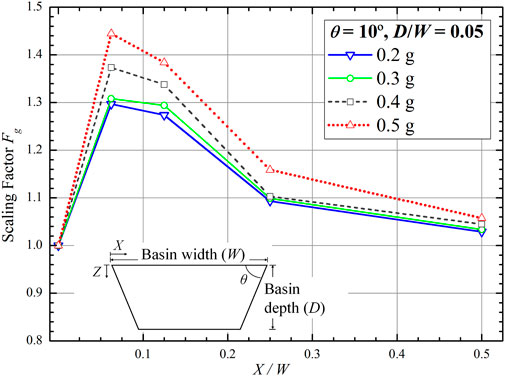
Variations in the PGA affect the scaling factor, particularly at the basin edge (X/W = 1/16). The greater the PGA value, the greater the scaling factor is. For example, in a basin with θ = 10°, D/W = 0.05, and X/W = 1/16, the Fg values are 1.44, 1.29 for PGA of 0.5 g, and 0.2 g, respectively. It is observed that if the X/W value moves from the edge to the center, the Fg becomes closer to 1 (Figure 10). This pattern was also found in the other θ and D/W values (Table 5).
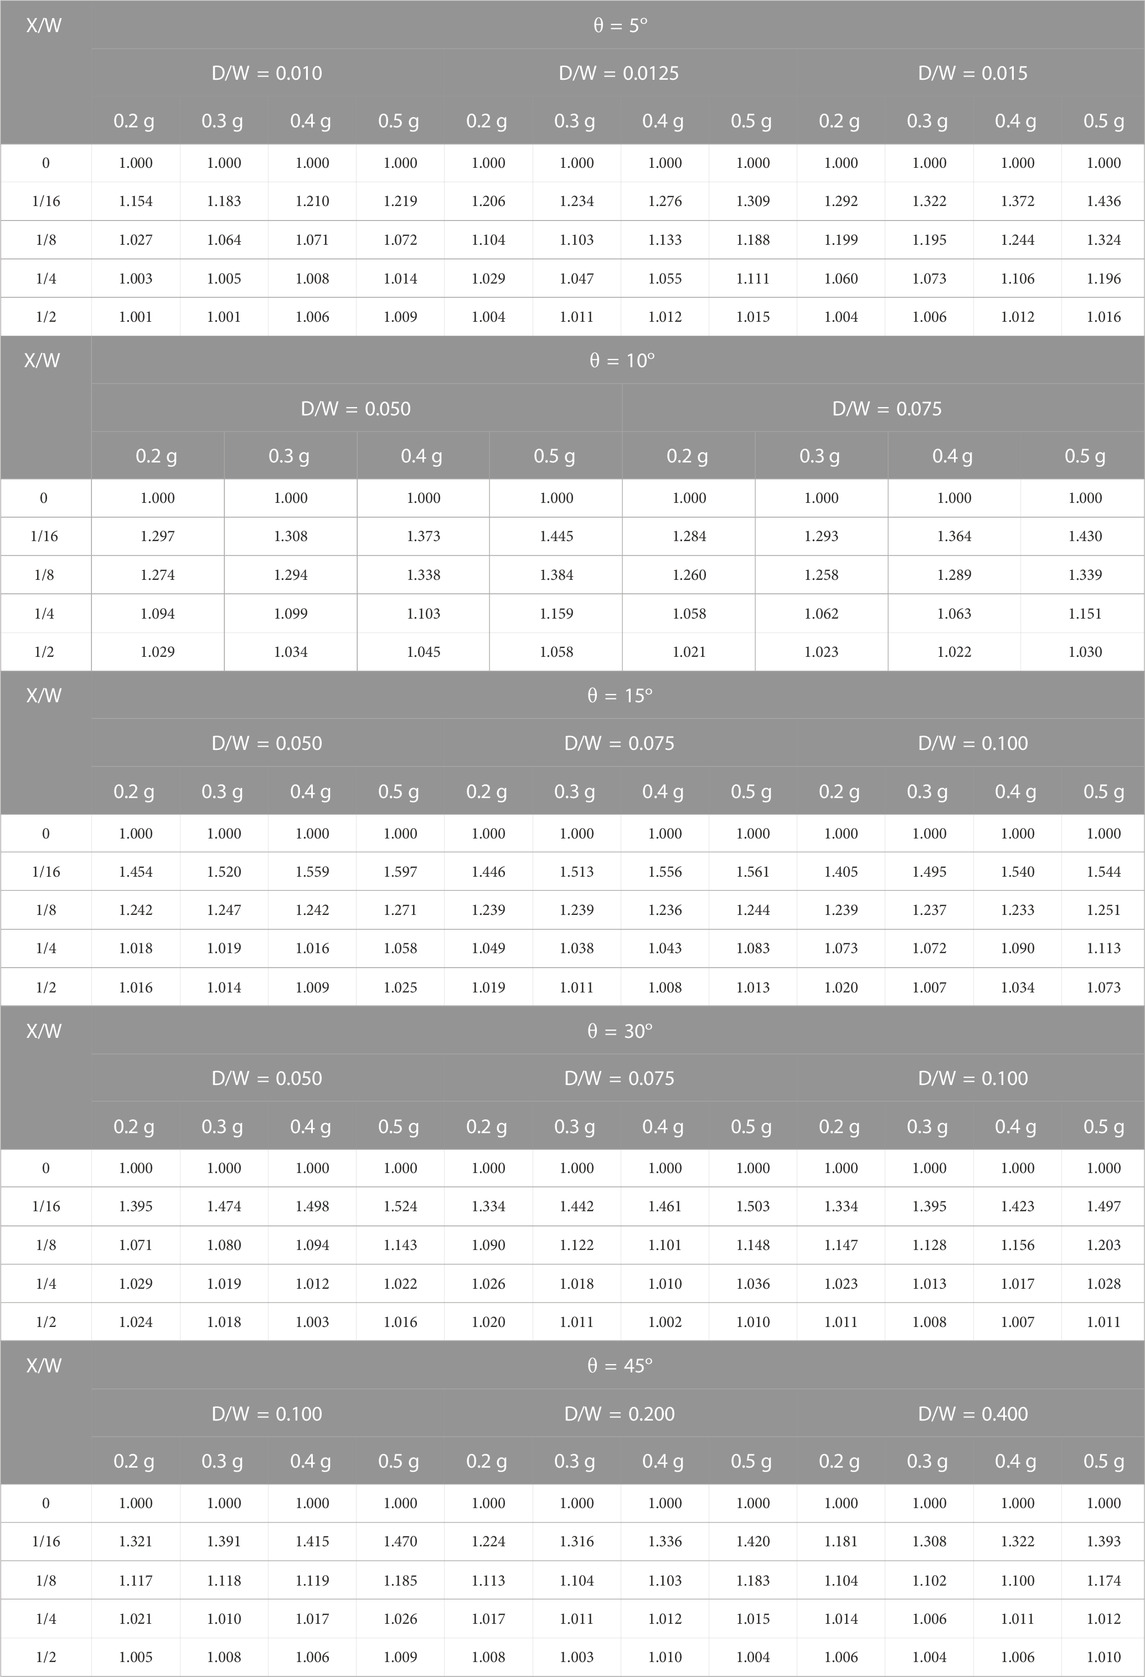
TABLE 5. Scaling factor Fg for θ = 5°, θ = 10°, θ = 15°, θ = 30°, and θ = 45° with varying D/W and PGA.
4.2 Scaling factor due to D/W (FDW)
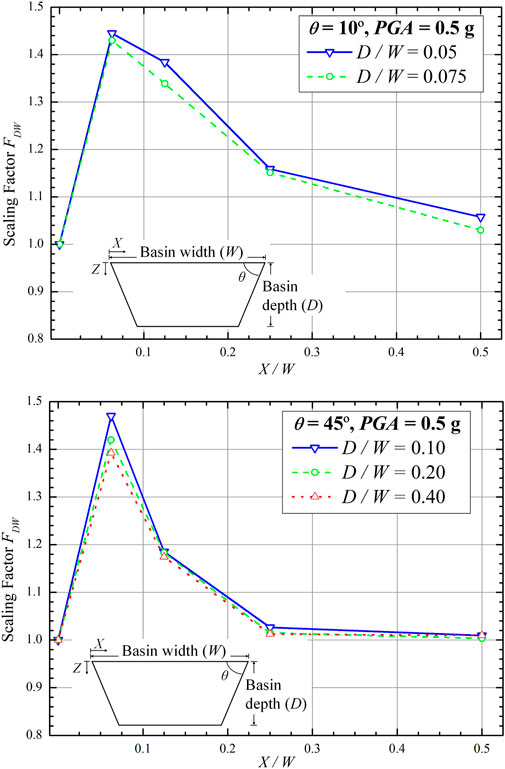
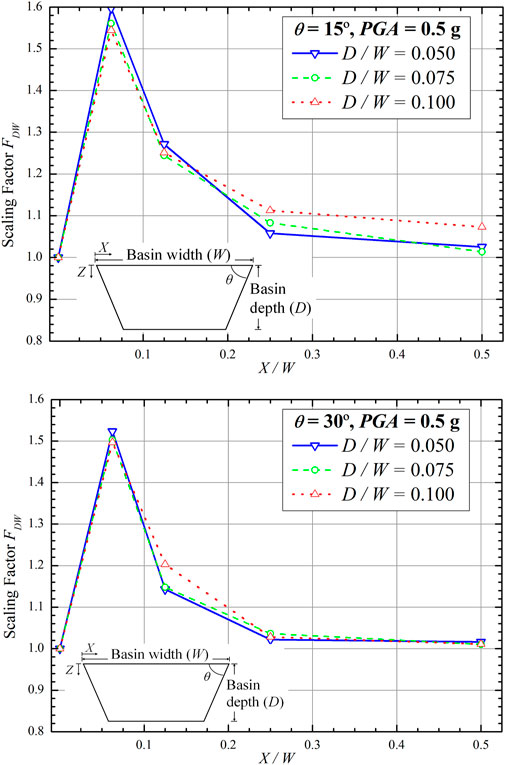
Variation in the D/W value also impacts the scaling factor. The smaller the D/W value, the greater the FDW at the same X/W is. This is observed in basins with θ of 10° and 45° (Figure 11). However, a comparison between D/W = 0.075 and D/W = 0.1, at θ of 15° and X/W of 1/4, showed that D/W increased with FDW (Figure 12). This occurrence may be attributed to the fact that FDW is still affected by the θ at X/W = 1/4. For the same D/W = 0.075 and 0.1, similar findings were also found at θ of 30° and X/W = 1/8. Nevertheless, at D/W = 0.05, the effect of the basin slope to the FDW is reduced. Based on parametric studies on D/W, FDW is still affected by certain θ (i.e., 15° and 30°), particularly at X/W between the edge and the middle of the basin, resulting in a scaling factor that increases with D/W. The study results of the effect of D/W on the scaling factor FDW are summarized in Table 6.
4.3 Scaling factor due to θ (Fθ)
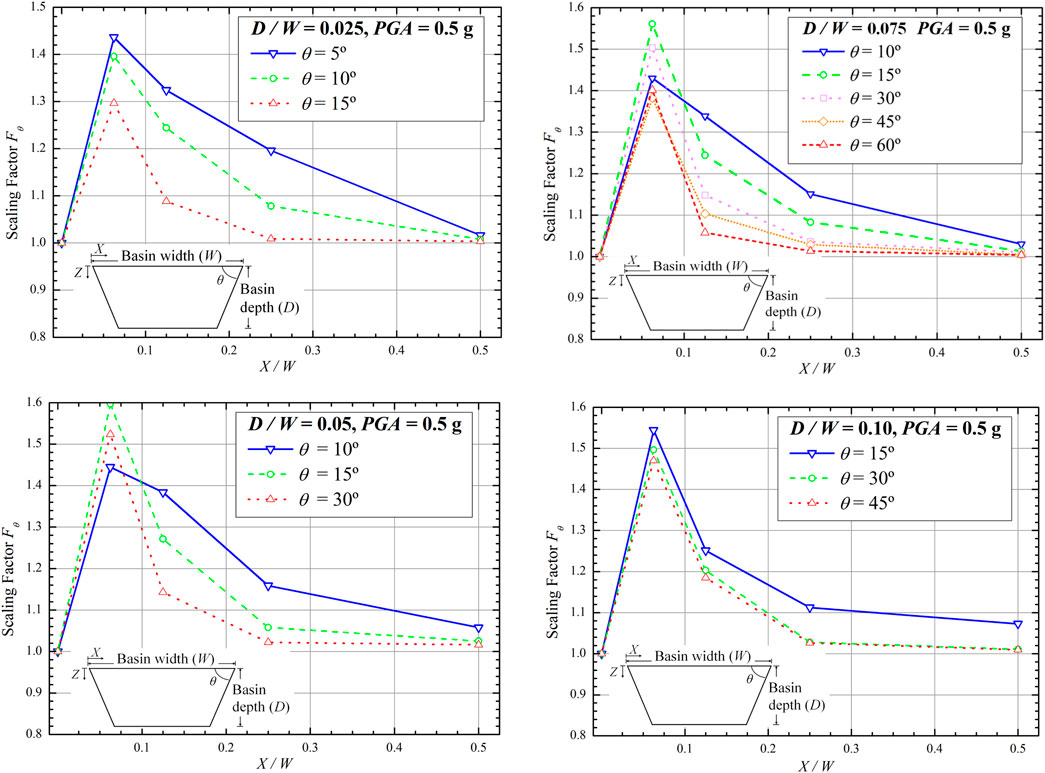
The scaling factor is also affected by the basin angle. Figure 13 shows the relationship of θ with scaling factor Fθ with various X/W for D/W = 0.025, 0.05, 0.075 and 0.1. Observations at the basin edge (X/W = 1/16) indicate that a smaller θ yielded a lower scaling factor than that of larger θ. However, observations at a point farther from the basin edge (e.g., X/W = 1/8) showed that smaller θ resulted in a higher scaling factor. These figures also show that a smaller θ yielded a higher scaling factor. Table 7 summarizes the study results of the effect of θ on the scaling factor F θ.
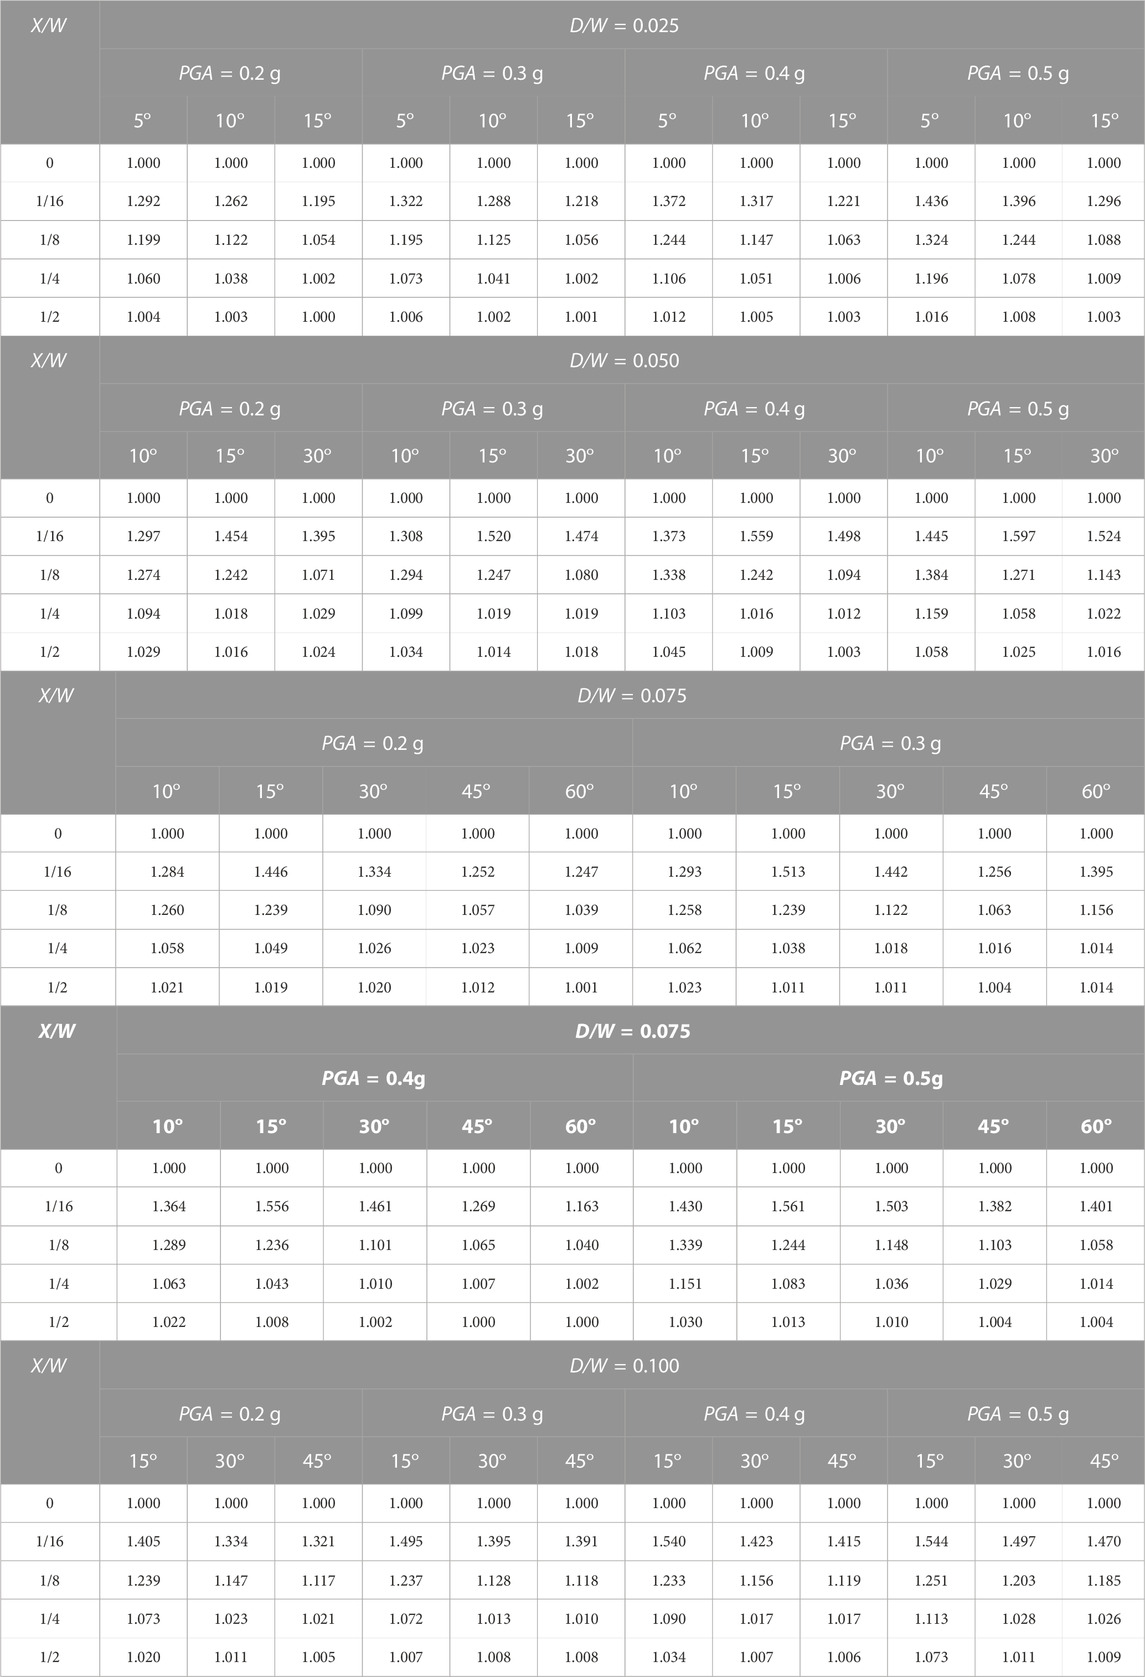
TABLE 7. Scaling factor Fθ for D/W = 0.025, D/W = 0.05, D/W = 0.075, and D/W = 0.1 with varying PGA and θ.
4.4 Scaling factor due to W (FW)
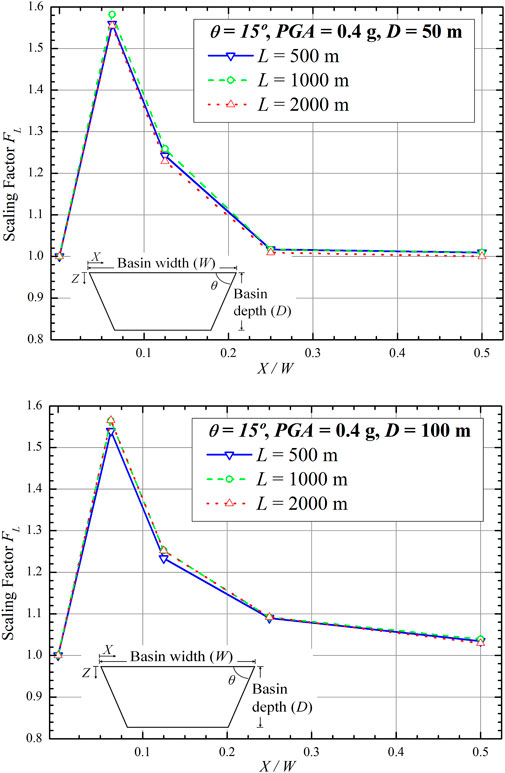
The effect of basin width on the scaling factor was also evaluated. For this purpose, a study was performed by varying basin widths to 500 m, 1 km, and 2 km, whereas the other basin geometry parameters were fixed (i.e., θ = 150, D = 50 m or 100 m).
Figure 14 presents the variation in Fw with X where θ = 15°, D = 50 m, and D = 100 m. For θ = 15° and D = 50 m, this figure shows that, around the basin edge, between X = 62.5 m and 125 m, variations in basin width yield relatively small differences in FW, only up to 1.5%. In addition, for θ = 15° and D = 100 m, this figure shows a variation of B from 500 m, 1 km, and 2 km. This figure shows that around the basin edge, between X = 62.5 m and 125 m, a relatively small difference was observed in Fw up to 1.7% with varying W.
4.5 Bandung Basin
An example of the application of the proposed scaling factors is demonstrated using the Bandung Basin case. This basin is 13 km wide, 200 m deep, θ = 5°, and D/W = 0.015. The selected locations of interest are Cicadas and Soekarno–Hatta, as shown in Figure 2. Cicadas, as observation point 1, has an X value of 1 km or X/W = 0.08. Soekarno–Hatta, as observation point 2, has an X = 5 km and X/W value of 0.4.
Scaling factors for Cicadas and Soekarno–Hatta can be found in Table 5 (i.e., D/W = 0.0125). This table shows the scaling factor values for observation points 1 and 2 of 1.275 and 1.05, respectively. These scaling factors are multiplied to the acceleration value on the surface obtained from the Indonesian national hazard map. Based on this map, the surface acceleration (SPGA) in the Bandung Basin area is 0.478 g. Thus, the surface accelerations on observation points 1 and 2, which consider the effect of the Bandung Basin on the spectral acceleration, are as follows:
• Scaled PGA at Cicadas = Fg·SPGA = 1.275 · 0.478 g = 0.609 g
• Scaled PGA at Soekarno–Hatta = Fg·SPGA = 1.05 · 0.478 g = 0.502 g
5 Summary and conclusion
A basin containing soft soil is known to influence the ground surface response due to earthquakes, particularly in areas around the basin edge. This study shows and also confirms the previous studies’ results, that is,
• 1-D and 2-D wave propagation analyses yielded substantial amplification differences at the basin edge.
• The 1-D analysis, which is popular in practical applications, may not capture the effect of the basin on the spectral acceleration.
• The 2-D method is better than the 1-D method in considering basin geometry.
However, the link between 1-D and 2-D responses has not been studied for engineering practices. Based on practical considerations, it is necessary to estimate the scaling factor for the 1-D analysis by considering the basin presence, particularly for that containing soft soil. These scaling factors can be used to facilitate engineering practice to evaluate the ground response located around the basin, where the 1-D method is immediately available, but 2-D and 3-D methods are not accessible. These are a novelty of the study.
Furthermore, a series of 1-D and 2-D analyses were conducted to evaluate the spectral amplification differences between these two methods and to conclude the scaling factors. This study investigates the relationship between PGA, basin angle, basin depth, and basin width to the spectral acceleration in several observation points on the ground surface. Moreover, this parametric study also shows that
• The farther from the basin edge, the closer the scaling factor is to 1.
• At the basin edge, the scaling factor is larger than 1.
• At the basin edge, the greater the input motion PGA, the greater the scaling factor is.
• At the basin edge, the smaller the basin angle, the greater the scaling factor is, except for the basin angle of 10°.
• The smaller the basin angle, the higher the scaling factor is at the observation point away from the basin edge.
• The smaller the D/W, the larger the scaling factor for the basin angles of 10° and 45°.
• In between X/W = 1/8 and X/W = ¼ at the angle range of 15°–30°, the greater the D/W value, the greater the scaling factor is.
• The basin width, particularly at the basin edge, has relatively little effect on the scaling factor at the same observation point.
Finally, the proposed scaling factors can be used to introduce the effect of basin geometry on ground spectral acceleration. Examples of the application of this scaling factor have been demonstrated using two sites located on the Bandung Basin.
Data availability statement
The original contributions presented in the study are included in the article/Supplementary Material; further inquiries can be directed to the corresponding author.
Author contributions
DA: conceptualization, methodology, supervision, writing–original draft, and writing–review and editing. AM: software and writing–original draft. AS: writing–review and editing. YB: visualization, supervision, and writing–review and editing. WS: visualization, supervision, and writing–review and editing. AH: visualization and writing–review and editing.
Funding
The author(s) declare financial support was received for the research, authorship, and/or publication of this article. This work was supported by FTSL ITB - P2MI Research Grant under Contract Number: P.03/IT1.C06.5.2/P2MI.FTSL.PUBLIKASI/2021. The authors would like to express their sincere appreciation for the grant.
Conflict of interest
The authors declare that the research was conducted in the absence of any commercial or financial relationships that could be construed as a potential conflict of interest.
Publisher’s note
All claims expressed in this article are solely those of the authors and do not necessarily represent those of their affiliated organizations, or those of the publisher, the editors, and the reviewers. Any product that may be evaluated in this article, or claim that may be made by its manufacturer, is not guaranteed or endorsed by the publisher.
References
Adams, B., Davis, R., Berrill, J., and Taber, J. (1999). Two-dimensional site effects in wellington and the hutt valley – similarities to kobe. Christchurch, NZ: Civil Engineering Research Report. University of Canterbury.
Ayoubi, P., Asimaki, D., and Mohammdi, K. (2018). Basin effect in strong ground motion: case study from the 2015 gorkha, Nepal earthquake. Austin: Geotechnical Earthquake Engineering and Soil Dynamic V. ASCE.
Bakir, B. S., Ozkan, M. Y., and Ciliz, S. (2002). Effects of basin edge on the distribution of damage in 1995 Dinar, Turkey earthquake. Soil Dyn. Earthq. Eng. 22, 335–345. doi:10.1016/s0267-7261(02)00015-5
Bard, P. Y., and Gariel, J. C. (1986). The seismic response of two-dimensional sedimentary deposits with large vertical velocity gradient. Bull. Seismol. Soc. if Am. 76, 343–356.
Bielak, J., Xu, J., and Ghattas, O. (1999). Earthquake ground motion and structural response in alluvial valleys. J. Geotechnical Geoenvironmental Eng. 125 (5), 413–423. doi:10.1061/(asce)1090-0241(1999)125:5(413)
Chavez-Garcia, F. J., and Bars, P. Y. (1994). Site effects in Mexico City eight years after the september 1985 michoacan earthquakes. Soil Dyn. Earthq. Eng. 13, 229–247. doi:10.1016/0267-7261(94)90028-0
Cipta, A., Cummins, P., Irsyam, M., and Hidayati, S. (2018). Basin resonance and seismic hazard in jakarta, Indonesia. Geosciences 8 (4), 128. doi:10.3390/geosciences8040128
Cruz-Atienza, V. M., Tago, J., Sanabria-Gómez, J. D., Chaljub, E., Etienne, V., Virieux, J., et al. (2016). Long duration of ground motion in the paradigmatic valley of Mexico. Nature 6, 38807. doi:10.1038/srep38807
Hatayama, K., Matsunami, K., Iwata, T., and Irikura, K. (1995). Basin-induced love waves in the eastern part of the osaka Basin. J. Phys. Earth 43 (2), 131–155. doi:10.4294/jpe1952.43.131
Itasca (2008). Fast Lagrangian analysis of Continua. Version 7.0. United States: Itasca Consulting Group, Inc.
Kawase, H., and Aki, K. (1989). A study on the response of A soft basin for incident S, P and Rayleigh waves with special reference to the long duration observed in Mexico city. Bull. Seismol. Soc. Am. 79 (5), 1361–1382.
Khanbabazadeh, H., Iyisan, R., Ansal, A., and Hasal, M. E. (2016). 2D non-linear seismic response of the dinar basin, Turkey. Soil Dyn. Earthq. Eng. 89, 5–11. doi:10.1016/j.soildyn.2016.07.021
King, J. L., and Tucker, B. E. (1984). Dependence of sediment-filled valley response on input amplitude and valley properties. Bull. Seismol. Soc. if Am. 74, 153–165. doi:10.1785/bssa0740010153
Krisnandi, A., Mase, L. Z., Susanto, A., Gunadi, R., and Febriansya, A. (2022). Analysis of ground response of Bandung region Subsoils due to predicted earthquake triggered by lembang fault, west java province, Indonesia. Geotechnical Geol. Eng. 41 (2), 1155–1181. doi:10.1007/s10706-022-02328-x
Lai, S. S., and Seed, H. B. (1985). Dynamic response of long valley dam in the mammoth lake earthquake series of may 25 – 27, 1980. Berkeley: Earthquake Engineering Research Center University of California.
Matasovic, N., and Ordinez, G. A. (2007). D-MOD2000 – a computer program package for seismic response analysis of horizontally layered soil deposits, earthfill dams, and solid waste landfills. Lacey, Washington: User’s Manual, GeoMotions, LLC, 182. Available at: http://www.geomotions.com.
Matasovic, N., and Vucetic, M. (1995). Generalized cyclic degradation-pore pressure generation model for clays. ASCE J. Geotech. Eng. 121 (1), 33–42. doi:10.1061/(asce)0733-9410(1995)121:1(33)
Movahedasl, R., and Ghayamghamian, M. R. (2015). Effects of 2D small-scale sedimentary basins on strong ground motion characteristics. J. Geophys. Eng. 12, 535–551. doi:10.1088/1742-2132/12/4/535
Ohta, Y., and Goto, N. (1978). Empirical shear wave velocity equations in terms of characteristic soil indexes. Earthq. Eng. Struct. Dyn. 6, 167–187. doi:10.1002/eqe.4290060205
Özalaybey, S., Zor, E., Ergintav, S., and Tapırdamaz, M. C. (2011). Investigation of 3-D basin structures in the İzmit Bay area (Turkey) by single-station microtremor and gravimetric methods: 3-D basin structures of the İzmit Bay area. Geophys. J. Int. 186 (2), 883–894. doi:10.1111/j.1365-246x.2011.05085.x
Pitarka, A., Irikura, K., Iwata, T., and Sekiguchi, H. (1998). Three-dimensional simulation of the near-fault ground motion for the 1995 Hyogo-Ken Nanbu (Kobe), Japan, earthquake. Bull. Seismol. Soc. Am. 88 (2), 428–440. doi:10.1785/bssa0880020428
Pyke, R. M. (1979). Nonlinear soil models for irregular cyclic loadings. J. Geotech. Eng. Div. ASCE 105, 715–726. GT6. doi:10.1061/ajgeb6.0000820
Qodri, M. F., Mase, L. Z., and Likitlersuang, S. (2021). Non-linear site response analysis of Bangkok Subsoils due to earthquakes triggered by three Pagodas Fault. Eng. J. 25 (1), 43–52. doi:10.4186/ej.2021.25.1.43
Romo, M. P., and Seed, H. B. (1986). “Analytical modelling of dynamic soil response in Mexico earthquake of september 19th 1985,” in Proceedings, International Conf. on the 1985 Mexico Earthquake, Mexico City, September 19th 1985, 148–162.
Sánchez-Sesma, F., Chávez-Pérez, S., Suárez, M., Bravo, M. A., and Pérez-Rocha, L. E. (1988). The Mexico earthquake of september 19, 1985 – on the seismic response of the valley of Mexico. Earthq. Spectra 4 (3), 569–589. doi:10.1193/1.1585491
Schmitz, M., and Audemard, F. A. (2005). Sediment thickness and A west-east geologic cross section in the caracas valley sediment thickness and A west-east geologic cross section in the caracas valley. Rev. Fac. Ing. 20 (4), 43–56.
Seligman, T. H., Alvarez-Tostado, J. M., Mateos, J. L., Flores, J., and Novaro, O. (1989). Resonant response models for the Valley of Mexico-I; the elastic inclusion approach. Geophys. J. Int. 99, 789–799. doi:10.1111/j.1365-246x.1989.tb02058.x
Semblat, J. F., Dangla, P., Kham, M., and Duval, A. M. (2002). Seismic site effects for shallow and deep alluvial basins: in-depth motion and focusing effect. Soil Dyn. Earthq. Eng. 22 (9-12), 849–854. doi:10.1016/s0267-7261(02)00107-0
Sengara, I. W., Apriadi, D., and Sumiartha, P. (2011). “Numerical simulation of seismic site effect in A deep sedimentary Bandung Basin,” in The Second International Conference on Earthquake Engineering and Disaster Mitigation (ICEEDM-2), Surabaya, Indonesia, 19-20 July 2011.
Sun, J. I., Golesorkhi, R., and Seed, H. B. (1988). Dynamic moduli and damping ratios for cohesive soils. Berkeley: Earthquake Engineering Research Center, University of California, 42. Report No. UCB/EERC-88/15.
Vucetic, M., and Dobry, R. (1988). “Cyclic triaxial strain controlled testing of liquefiable sands,” in Advanced triaxial testing of soil and rock, ASTM STP 977 (Philadelphia: American Society for Testing and Materials), 475–485.
Zor, E., Özalaybey, S., Karaaslan, A., Tapırdamaz, M. C., Özalaybey, S. Ç., Tarancıoğlu, A., et al. (2010). Shear wave velocity structure of the İzmit Bay area (Turkey) estimated from active-passive array surface wave and single-station microtremor methods: shear velocity structure of the İzmit area. Geophys. J. Int. 182 (3), 1603–1618. doi:10.1111/j.1365-246x.2010.04710.x
Keywords: basin, basin edge, D-MOD 2000, earthquake response, FLAC, scaling factor, spectral acceleration
Citation: Apriadi D, Mandhany A, Sahadewa A, Basarah YI, Sengara W and Hakim AM (2024) Scaling factors for 1-D ground response amplification in a soft soil basin. Front. Built Environ. 9:1275425. doi: 10.3389/fbuil.2023.1275425
Received: 10 August 2023; Accepted: 29 November 2023;
Published: 05 January 2024.
Edited by:
Emilio Bilotta, University of Naples Federico II, ItalyReviewed by:
Lindung Zalbuin Mase, University of Bengkulu, IndonesiaIzuru Takewaki, Kyoto Arts and Crafts University, Japan
Copyright © 2024 Apriadi, Mandhany, Sahadewa, Basarah, Sengara and Hakim. This is an open-access article distributed under the terms of the Creative Commons Attribution License (CC BY). The use, distribution or reproduction in other forums is permitted, provided the original author(s) and the copyright owner(s) are credited and that the original publication in this journal is cited, in accordance with accepted academic practice. No use, distribution or reproduction is permitted which does not comply with these terms.
*Correspondence: Dedi Apriadi, ZGVkaWFAaXRiLmFjLmlk
 Dedi Apriadi
 Anggariano Mandhany2
 Yuamar I. Basarah
