 Bassel Habeeb
 Emilio Bastidas-Arteaga
94% of researchers rate our articles as excellent or good
Learn more about the work of our research integrity team to safeguard the quality of each article we publish.
Find out more
ORIGINAL RESEARCH article
Front. Built Environ., 29 September 2023
Sec. Bridge Engineering
Volume 9 - 2023 | https://doi.org/10.3389/fbuil.2023.1268304
This article is part of the Research TopicImproving Bridge Performance Subjected to Aging and Natural DisastersView all 4 articles
Climate change has the potential to significantly impact transportation infrastructure performance. Bridges crossing rivers are designed to withstand a maximum flood level (design flood) considering the expected frequencies and magnitudes of floods in the area. The design flood level ensures the safety of the bridge without being damaged against historical flooding levels. However, flood magnitude and/or frequency are expected to increase in some regions due to climate change, and therefore, bridges may not be able to maintain their serviceability and safety, resulting in significant risk to users and economic losses. This problem is approached in this paper by investigating the effects of flooding and climate change on bridges crossing rivers and surrounding areas. The input of the proposed methodology is the river flow for various climate change scenarios as well as the topography and bridge characteristics. Flood frequency analysis is used to provide information about the magnitude and frequency of annual maximum river discharges under a changing climate. Afterwards, several risk assessment indicators are computed for the bridge and its surrounding area. In addition, stochastic Poisson process is integrated to account for the randomness of floods arrivals and to investigate stochastically the probability of exceeding the design flood level. The proposed methodology is illustrated with a case study in the United Kingdom. The results indicate that the risk of flooding, and associated consequences, would increase for the case study when considering more pessimistic climate change scenarios. Findings from this study can be used to inform decision making for improving bridges’ resilience.
Floods are one of the most destructive and frequent natural disasters due to intense rainfall, melting snow, and overflowing rivers and streams. Floods can have a significant impact on the economy and environment, disrupting livelihoods around the world. Floods often inundate floodplains and adjacent lands and might cause river channel shifting, leading to tremendous losses in terms of property, agricultural lands, infrastructure assets, and lives. The force of strong currents can sweep people away or drown them in the rising water level. In a study in the United States for assessing the vulnerability of structures and residential communities to coastal flooding, results indicate that the most damage caused to the communities is due to dune erosion (Hatzikyriakou and Lin, 2018).
The recent technical knowledge associated with bridge engineering is based on the past mechanisms of bridges’ failures that have occurred due to various causes, in which each cause of failure has its unique features. The common causes of failures are categorized as natural factors (earthquake, flood, wind, and landslide) and human factors (collision, traffic overloading, fire, lack of inspection and maintenance, improper design) those factors impact the stability of bridges and cause different types of failures (partial failure, total failure, and unserviceability of a structure), in which each type of failure corresponds to the degree of damage on the structure (Zhang et al., 2022). Coastal communities around the world are facing increased coastal flooding and shoreline erosion, this highlights the need for integrated and robust monitoring plans for mitigation plans after implementation (Palinkas et al., 2022). By the end of the 21st century, the sea level rise alone can claim more than 50% of Tarawa, the capital of the Republic of Kiribati, and pose risk to over 60% of the population under the most pessimistic climate change scenario (Sabūnas et al., 2021). Flooding represents the cause of almost of bridge failures over rivers due to a range of factors, scouring, hydrodynamic loads and pressures on the deck and piers, overtopping, and debris accumulation (Davidson et al., 2013; Shen et al., 2017; Mondoro and Frangopol, 2018). In the 20th century, floods were responsible for 6.8 million deaths from natural disasters across the world (Doocy et al., 2013). Globally, 2.82 trillion people were affected by floods between 1980 and 2009. In Europe, the number of people affected by floods was 1.41 million in 2013. In the United Kingdom, nearly 350,000 people were affected by floods in 2008 (Hannah et al., 2022).
The lifespan of infrastructure assets significantly varies depending on the type of infrastructure, environment, materials of construction, degree of maintenance, degradation factors, and extreme events, e.g., temperature, humidity, corrosion, floods, etc. For example, bridges can last up to 100 years or more, such as the Abraham Lincoln Bridge in the United States (Brad et al., 2019). However, bridges located in areas with extreme weather conditions may have a shorter lifespan (TRID, 2017). For example, the average life expectancy of bridges in the United States has been drastically cut to around 50 years as a result of floods in the 1990s (Crawford, 2023). Bridges could suffer a loss in their reliability over time due to progressive deterioration (corrosion, fatigue, creep, etc.) (Bastidas-Arteaga et al., 2020; Truong et al., 2022). When bridges are crossing rivers, they also might suffer a sudden loss in their reliability due to shock-based deterioration (floods, collisions, earthquakes, etc.) and their reliability depends on the severity of the shock size (Sánchez-Silva and Klutke, 2016). Therefore, inspections and maintenance are essential after the occurrence of any shock-based deterioration to ensure bridge structural safety (Collins, 1989).
In the case of flooding, the impact of unpredictable intense flows on the reliability of bridges and surrounding areas might be catastrophic. In addition, the effect of compound flooding is more severe on bridges due to the short time period between two or more events. Compound flooding is more frequent during winter/autumn than summer/spring (Robins et al., 2021). Therefore, engineers must be able to design the bridges to withstand the forces of pre-evaluated shock sizes and consider urban planning by identifying areas that are at risk of flooding, and then developing strategies to reduce the risk of flooding in those areas. In this context, natural features have been used as protection for infrastructures to reduce the risk of flooding, their application has grown steadily in recent years to adapt to the changing climate (Bridges et al., 2022). In addition, railway engineers should adopt different mitigation methods for different failure scenarios under a changing climate (Setsobhonkul et al., 2017). As a result, recovery planning strategies should be implemented to conduct an assessment of the flooded road network performance throughout the recovery stage to provide the policymakers with several scenarios, this aims to improve the recovery process (Serdar and Al-Ghamdi, 2023).
Bridges over rivers are designed to sustain a design flood level determined by the hydrological flood frequency analysis (Bailey, 1989; Alexander, 1995; Stedinger and Griffis, 2008; Black and Fadipe, 2009; Watson and Biedenharn, 2011; Bridge Scour Manual, 2019; England et al., 2019). This analysis interprets the historical flood events to evaluate the likelihood of future occurrences, estimate the frequencies of floods (recurrence intervals), and determine the magnitudes of these floods for bridge design purposes. This analysis can be used to assess the risk of flooding, identify areas that are more prone to flooding, inform decisions about flood management, and develop strategies for flood risk mitigation. Hydrologic flood frequency analysis is commonly used to determine the magnitude of the design flood level of a 200-year return period which represents the probability of 0.5% of a flood occurring in a given area based on the historical annual maximum river flow discharge values (Benn, 2013).
Over time, the climate has changed over the earth due to natural processes (Plate tectonics, volcanic activity, variations in the Earth’s orbit, and solar variability). In the last century, the increase in the emissions of greenhouse gases have caused global warming (IPCC, 2014). Uncertainties of climate change are due to incomplete understanding of the interaction between the Earth’s climate systems, natural variability of the Earth’s climate system, and variability of the climate models (Reilly et al., 2001; Shepherd, 2014; Kundzewicz et al., 2018). Climate models are used to simulate the complex interactions between the Earth’s climate system and provide predictions of climate indicators based on the degree of changing planetary processes, e.g., land use and emissions. However, their predictions are uncertain due to climate models’ variability, forcing factors, aerosols, jet stream impact, resolution, etc. (van Vuuren et al., 2011).
Under a changing climate, the river discharge values in some areas are expected to increase in intensity and frequency due to a wide range of natural processes causing long-term shifts in temperature and weather patterns leading to more volatile precipitation patterns (Habeeb and Bastidas-Arteaga, 2022). Developing an assessment for flood frequency analysis methods under a changing climate is essential for effectively implementing flood risk assessment and management directives. For example, the European Parliament and the Council of the European Union recommended a comprehensive European assessment of different flood frequency analysis methods under varying climatologic and geographic conditions to ensure robust flood risk management strategies (THE EUROPEAN PARLIAMENT AND THE COUNCIL OF THE EUROPEAN UNION, 2007). This assessment should consider the potential of adaptation and mitigation strategies to reduce the impacts of climate change on the reliability of bridges across rivers. Subsequently, the design flood level of a bridge is expected to be affected in terms of the flood magnitude and probability of occurrence. In this context, the Intergovernmental Panel on Climate Change (IPCC) mentioned that currently the intensity and frequency of floods in some regions caused the 100-year design flood level to occur every 2–5 years (Parry, 2007). Therefore, the design flood level of a bridge may need to be adjusted to account for higher values and more frequent floods to inform future decisions about flood management and future strategies for flood risk mitigations.
Economic losses in Europe under a changing climate increased by almost 2% per year between 2010 and 2020, Europe has lost around €145 billion in the last decade due to climate change-related events according to Eurostat (Eurostat, 2022). The devastating impacts of climate change on infrastructure resilience due to flooding in Europe are expected to rise between €14 Billion to €21.5 Billion by the end of this century (Ciscar, 2012). In the United Kingdom, the impact of climate change has already cost an average of over £50 million each year and this value is expected to increase due to the increased risk of failure of bridges (Dikanski et al., 2017).
The nature of most hydrological events, such as floods is random and varies with time and space, it is possible to estimate return periods by utilizing different probability distributions (Singh and Yadava, 2003). Flood frequency analysis (Todd, 1957) estimates the frequency of occurrence of a hydrological event, such as floods, and relates the magnitude of extreme events to their frequency of occurrence through the use of probability distributions (Stedinger and Cohn, 1986; Te Chow et al., 1988). This analysis can be approached using theoretical techniques based on probability distributions and applied research techniques, such as regionalization and floodplains-simulating software (Hamed and Rao, 2019). Floodplains should be generated using models that consider fluid dynamics to account for the impact of flood velocity on the extents (Marsooli and Wang, 2020). Theoretical techniques analyze the past annual peak flow discharge data in a certain location to calculate statistical information, such as mean values, standard deviations, and skewness. The analysis fits statistical distributions to the data, such as Log-Pearson Type III, Gumbel, Log Normal, Weibull, and Generalized Extreme Value (Cunnane and Singh, 1987) by using methods to estimate the parameters; then a flood with a specified probability of exceedance can be inferred from the distributions to provide frequency distributions, which are graphical representations that indicate the likelihood of different discharge levels occurring and relating the peak discharge values to their recurrence interval or exceedance probability. Parameters of the distributions can be estimated from data using estimation methods, such as the method of moments, maximum likelihood, and L-moments (Arnell, 2002). In particular, the method of moments is recommended by Bulletin 17B to fit the log-Pearson Type III (Tim, 1982). To ensure the performance of the methodology presented by Bulletin 17B, an investigation using Monte Carlo simulations indicated the consistency of the method (Griffis and Stedinger, 2007).
The objective of this paper is to propose a framework to assess the serviceability and safety of a bridge and its surrounding area prone to flooding under a changing climate. Several distributions of flood frequency analysis are investigated and the selection of the best fit involves goodness of fit tests and accuracy indicators to determine the flood levels for specific return periods, annual exceedance probability, and return period under a changing climate. Then risk assessment indicators assess the bridge performance and its surrounding areas under a changing climate. In addition, the serviceability of the bridge being out of service due to flooding events under a changing climate is investigated stochastically using a Poisson process in which the rate of the bridge being out of service is determined based on the number of exceedances of the design flood level.
This paper is organized as follows. Section 2.1 presents a general description of the methodology proposed to analyze the effects of flooding events and climate change for bridges performance. Section 2.2 presents the flood frequency analysis distribution used in this paper. Section 2.3 provides the applied risk assessment approaches. Section 3 presents the case study and the database used in the analysis. Section 4 presents a comprehensive analysis of the potential impacts of climate change on the serviceability of a bridge in UK when subjected to flooding events. In addition, this section presents the impact of climate change on floodplain mapping.
This paper investigates the evolution of the annual probability of exceedance and peak discharge values under a changing climate, assesses accordingly the risk on the surrounding area of the bridge (road/inhabitant areas), and investigates stochastically the probability of exceeding the design flood level. The structural failure is beyond the scope of this paper.
Figure 1 presents the procedure used in this study. The main input is a database containing river flow predictions for several climate change scenarios. This database serves to fit the best flood frequency distribution that is then used to determine the flood levels for specific return periods and their annual probability of exceedance under a changing climate. Afterwards, risk assessment indicators are computed to assess the impact of exceeding the design flood level of the bridge on its surrounding area under a changing climate as follows. The bridge and its surrounding area are categorized into flood zones (Section 2.3.1) by considering the annual probability of exceedance. Hydrological risk of design (Section 2.3.2) presents the probability of a flood level that a structure can withstand without suffering damage during its design life. Flood hazard rating (Section 2.3.3) is based on the evolution of the floodplain and flood velocity; this indicator is used to indicate the flood degree which presents the degree of danger that floods can pose to people. In addition, the probability of the bridge being out of service (Section 2.4) is approached by a stochastic Poisson process with the bridge’s rate being out of service determined by the peak annual discharge values from climate change scenarios exceeding the design flood level of the bridge since the bridge was designed to maintain its performance in the face of scour with a 200-year return period for a design flood level value of 114.19
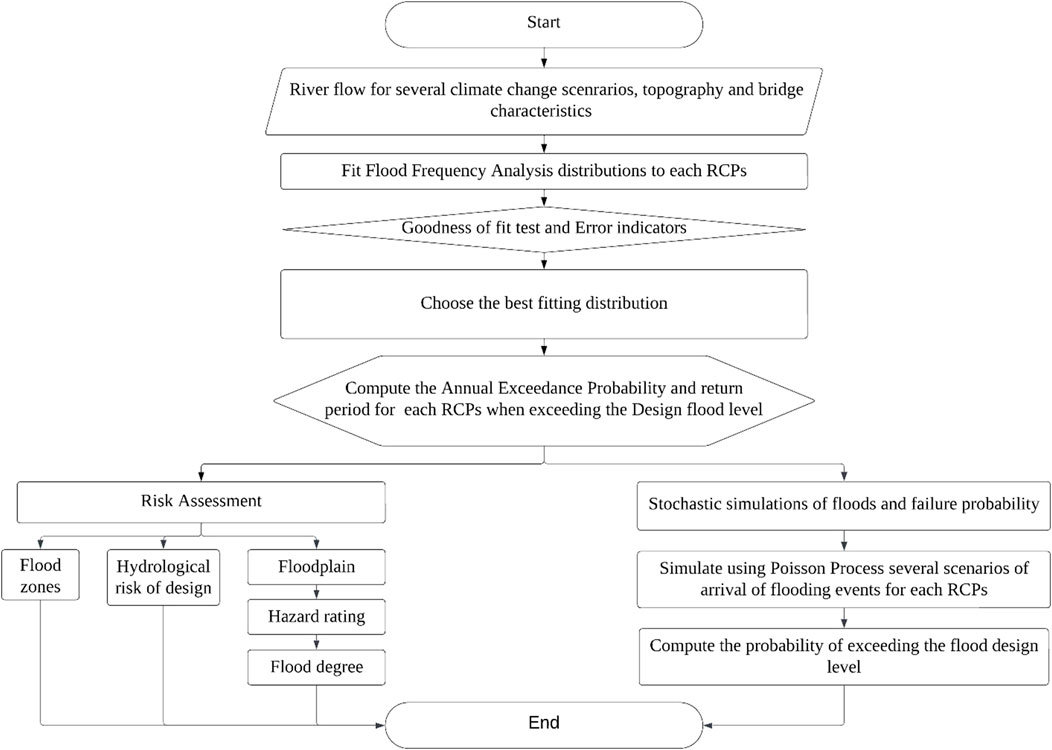
FIGURE 1. Flowchart of the proposed methodology.
Gumbel distribution which is also known as the Extreme-Value Type I distribution is based on a double exponential distribution (Gumbel, 1941). This distribution in generally used to estimate the peak discharge values and probability of exceedance for return periods of extreme hydrological events, such as floods. The probability of flood event exceedance
where
The annual peak discharge of a flood
where
The annual peak discharge value in (Eq. 3) is based on the mean value and standard deviation of several projection scenarios of climate models, in which the projections are uncertain due to climate models’ variability, forcing factors, aerosols, jet stream impact, resolution, etc. Therefore, confidence intervals (
where
This section presents the impact of climate change on the serviceability of the bridge and its surrounding areas by determining the following indicators under a changing climate, i.e., flood zone categories, hydrologic risk of design, flood hazard rating, and degree of flood.
Flood zones are geographical areas that are designed according to the risk of flooding. This indicator can be used to determine the flood insurance rates and regulations for buildings in flood-prone areas. Table 1 describes and categorizes the flood zones based on the annual probability of flooding in (Eq. 1) (Flood Risk Assessment Guidance, 2017).
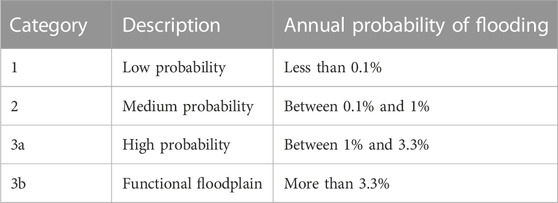
TABLE 1. Flood zones [Adapted from Table D.1 in (Development and flood risk, 2006)].
When hydrologists perform a design based on the
There is a general agreement on the degree of danger that floods can pose to people. In this context, flood hazard rating is affected by the severity of floods and is used to measure the risk of flooding in flood-prone areas to people. The flood hazard rating
where
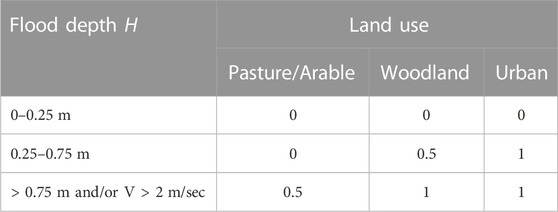
TABLE 2. Debris factor [Source Table 3.1 in (Wallingford, 2006)].
Table 3 presents the degree of the flood hazard and its impact on people based on the hazard rating value
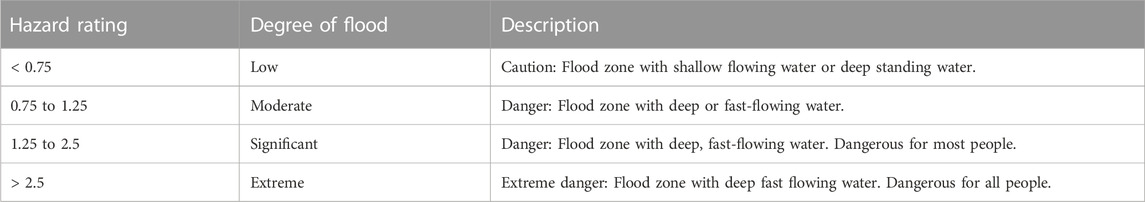
TABLE 3. Degree of a flood [Source Table 3.2 in (Wallingford, 2006)].
A stochastic Poisson process is used to simulate various scenarios of flood occurrences exceeding the design flood level. The number of floods
where
The case study bridge used in this study is located over the Cherwell River in Oxfordshire, United Kingdom. The railway bridge is a dual-span bridge with a steel deck, one pier of 2 m width, and a bed-to-soffit height of around 4.5 m. The bridge is designed to maintain its performance due to the impact of scour with a 200-year return period for a design flood level value of 114.19
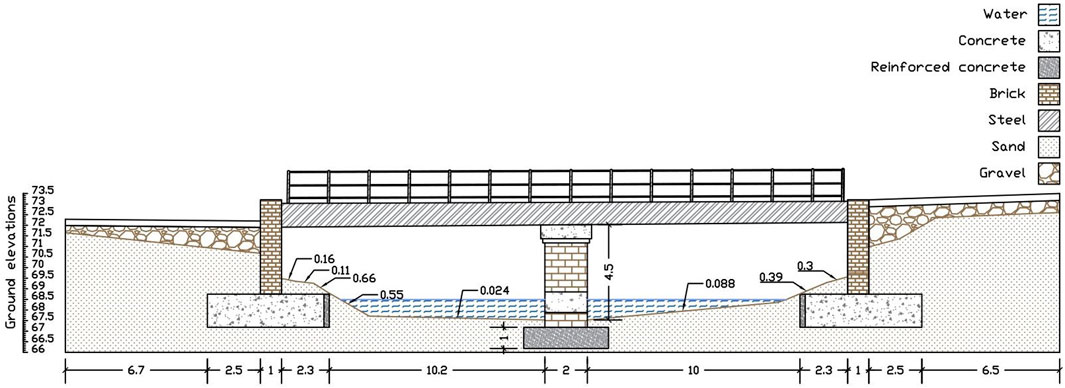
FIGURE 2. Case study bridge [Units(m)].
The impact of climate change is considered in this study to assess the risk of the bridge subjected to flooding events caused by various annual maximum river discharge values from three projections scenarios (RCPs 2.6, RCPs 4.5, and RCPs 8.5) from 2011 to 2095, which are representative concentration pathways scenarios of greenhouse gases concentration that are labelled after a possible range of radiative forcing values (2.6, 4.5, and 8.5 Watts/
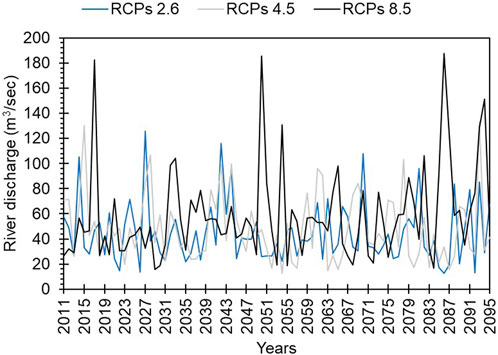
FIGURE 3. Annual river discharge values from 2011 to 2095.
The main objective of this section is to investigate the evolution of the annual exceedance probability and peak discharge values under a changing climate. This analysis is useful to evaluate the degree to which such events are expected to affect people in the future. In addition, this section presents the floodplain mapping scenarios under a changing climate and investigates stochastically the probability of exceeding the design flood level under a changing climate.
The river discharge values are expected to increase for some regions in mean and variance under a changing climate. Figure 3 presents the river discharge values for RCPs 2.6, RCPs 4.5, and RCPs 8.5 from 2011 to 2095 for the considered river. The observations indicate a higher river discharge values for RCPs 8.5, while the differences between RCPs 2.6 and RCPs 4.5 are not significant.
Table 4 presents the mean value and standard deviation of the river discharge for each RCPs. Higher mean and standard deviation values are observed for more pessimistic scenarios, while the differences between RCPs 2.6 and RCPs 4.5 are not statistically significant. These values are used in the flood frequency analysis to fit the distributions which will control the shift (location) and the spread (skewness) of the distributions, thereby affecting its ability to present extreme river discharge values.
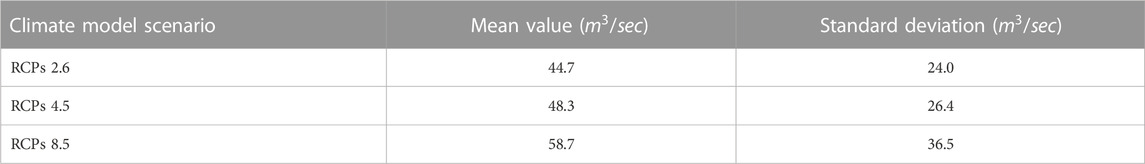
TABLE 4. Statistical information of the river discharge values.
This section justifies first the choice of the best-fit distribution for several distributions including the commonly used distributions, i.e., Generalized Extreme Value, Extreme Value Type I, Extreme Value Type III, Pearson Type III, Log-Pearson Type III, and Log-Normal distributions to determine which distribution fits better. The selection of the best fit involves goodness of fit tests and error indicators to determine the flood levels for specific return periods and their annual exceedance probability under a changing climate. As in (Hodson, 2022), the root mean square error (RMSE) and the mean error (ME) are used in this study. Furthermore, this section presents the relation between the peak discharge of flooding events and their frequency of occurrence.
Figure 4 presents the fit of the distributions under a changing climate. The observations indicate that Generalized Pareto, Generalized Logistic, Logistic, and Weibull distributions show the highest variations for each RCPs when compared to the other distributions.
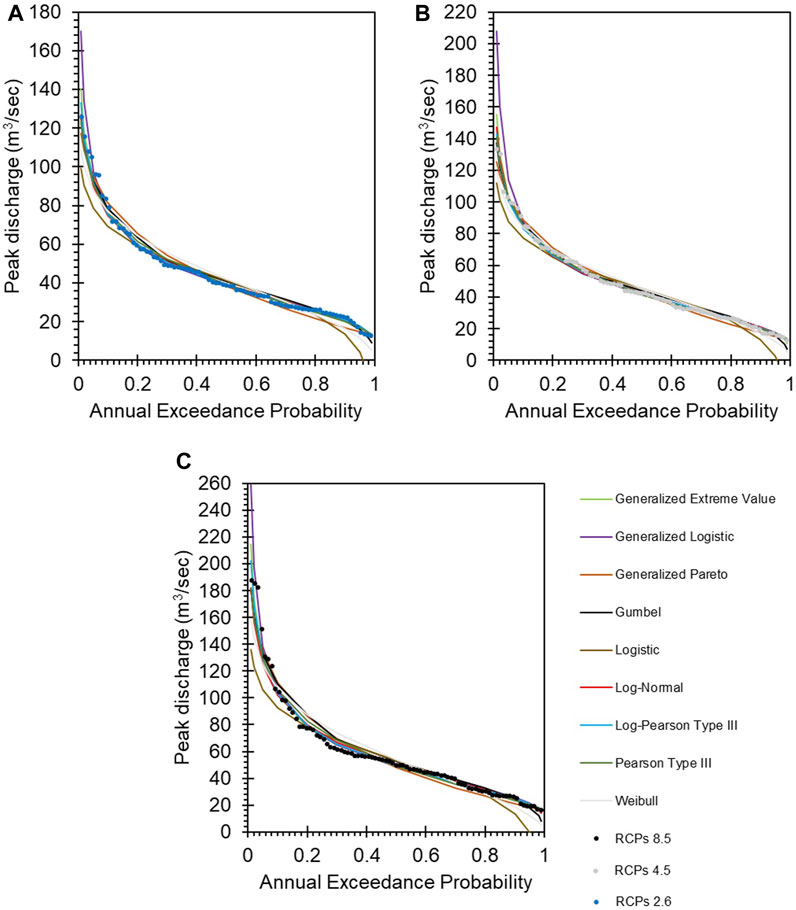
FIGURE 4. Distributions fitting under a changing climate. (A) RCPs 2.6, (B) RCPs 4.5, and (C) RCPs 8.5.
The Kolmogorov-Smirnov goodness of fit test is first used in this study to investigate whether there is sufficient evidence that the distributions fit each RCPs. The results for all the distributions present a p-value > 0.05, and therefore, no rejection of any of the distributions was found for this goodness of fit test. Further investigation should be conducted using the error indicators to choose the best-fitting distribution. Consequently, the error indicators of the fitted distributions for RCPs 2.6, 4.5 and 8.5 are presented in Table 5 to determine the best-fitting distribution. The results indicate that the best-fitting distribution for all RCPs is the Gumbel distribution confirming the suitability of this kind of distribution for flood frequency analysis in this specific study case when considering climate change. Gumbel distribution is then used in this study to determine the flood levels for specific return periods and their annual exceedance probability under a changing climate. This is illustrated in Figure 5 by presenting the relation between the peak discharge values with their return period and annual exceedance probability for the Upper Limit
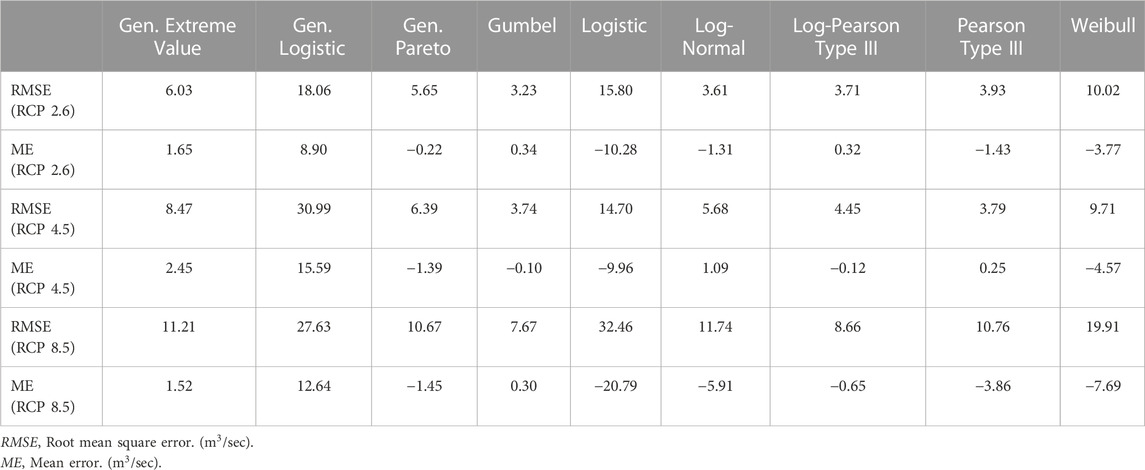
TABLE 5. Error indicators of the flood frequency analysis distributions.
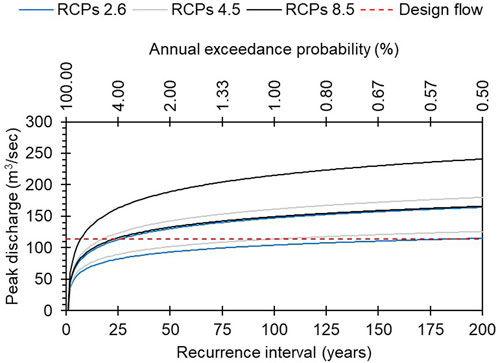
FIGURE 5. Flood frequency analysis with 95%
Table 6 presents the change in the flood design level of a 200-year return period under a changing climate and also provides the change in the annual exceedance probability due to the decrease in the recurrence intervals as a result of the increase in peak discharge values. The results indicate that higher peak discharge values are found for a higher probability of exceedance for RCPs 8.5, RCPs 4.5, and RCPs 2.6, respectively, in which the peak discharge values and the annual exceedance probability for the 200-year return period are exceeded under a changing climate which may impact the serviceability of the bridge.
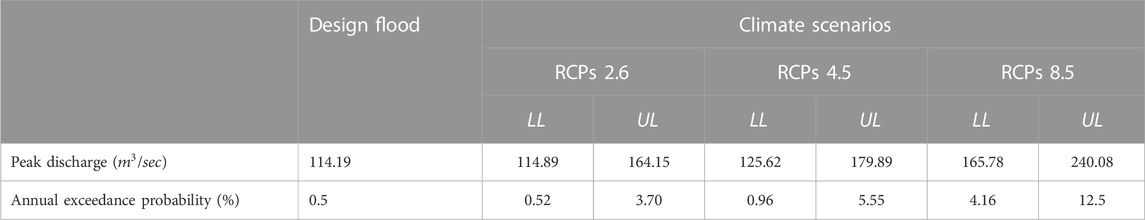
TABLE 6. Flood frequency analysis with a 95%
This section studies the impact of climate change on the risk of the bridge and surrounding areas by analyzing the flood zone categories, hydrological risks, flood hazard rating, and degree of flood.
Table 7 presents the expected flood zone categorization as defined according to the classification given in Table 1 under a changing climate. The results indicate the design flood level is categorized as a medium floodplain. When investigating the potential impacts of flood risk under a changing climate, it is evident that RCPs 2.6 and RCPs 4.5 exhibit similar flood zone categories, ranging from medium to functional floodplain. On the other hand, the flood zone category for both
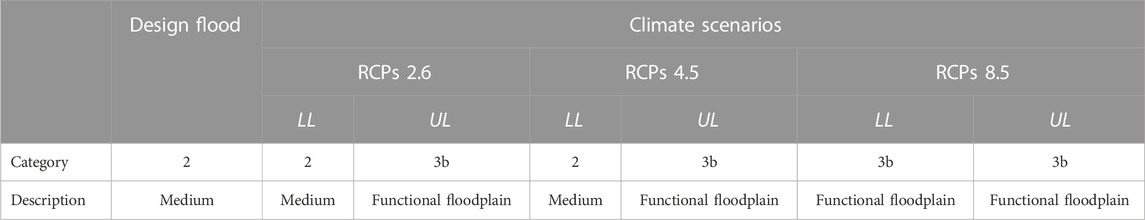
TABLE 7. Flood zone category under a changing climate.
Table 8 presents the impact of climate change on the hydrological risk of a 200-year return period design flood level according to (Eq. 8). The results indicate that the hydrological risk associated with a changing climate increases for more pessimistic climate scenarios. The hydrological risk values for the
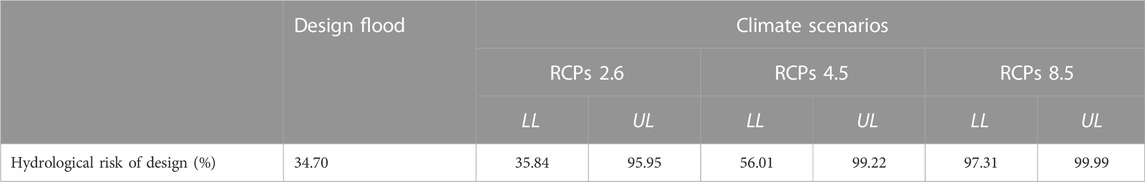
TABLE 8. Hydrological risk.
Flood hazard rating requires an assessment of the flow depths for the different climate change scenarios (Eq. 9). Therefore, it is necessary to assess the impact of climate change on the floodplain. This analysis uses the InfraWorks 3D design engineering software to generate the topographical mapping of the surrounding area of the bridge. The River and Flood Analysis Module for Civil 3D is used to simulate flooding scenarios by considering the peak discharge values of the design flood, RCPs 2.6, RCPs 4.5, and RCPs 8.5. This analysis assesses the impact of climate change on the floodplain and hazard rating on the two banks of the river, as well as determining which scenarios can affect the road crossing the river.
Figure 6 presents the topographical mapping and satellite image of the surrounding area of the bridge. The observations of the topographical view indicate that the right bank of the river is higher in elevation compared to the left bank of the river. In addition, the upper part of the satellite image shows that there are residential areas on the two banks of the river close to the bridge.
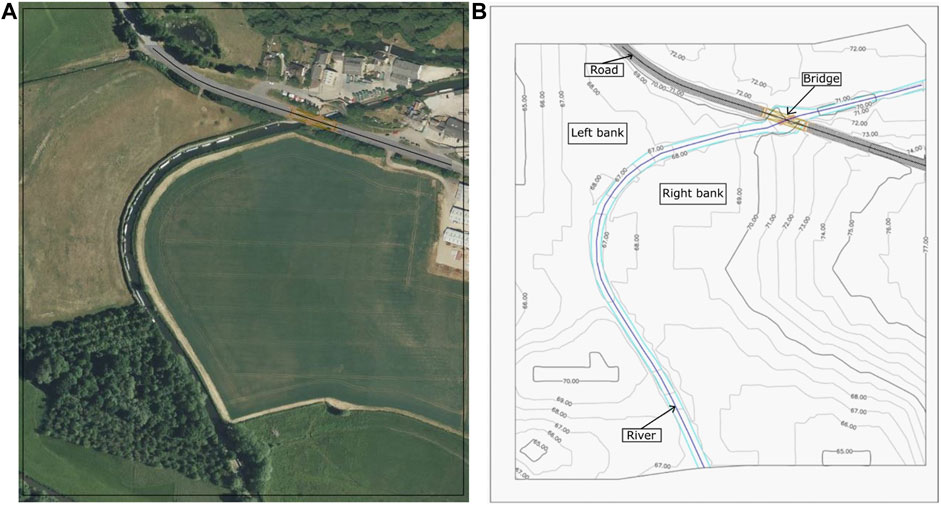
FIGURE 6. Area of study. (A) Satellite image, (B) Topographical view.
It is interesting to investigate the evolution of the floodplains for different flooding events and their impact on the case study bridge and its surrounding area. The floodplain is presented using the peak discharge value related to a 200-year return period. The peak discharge value of a 200-year return period for the design flood is 114.19
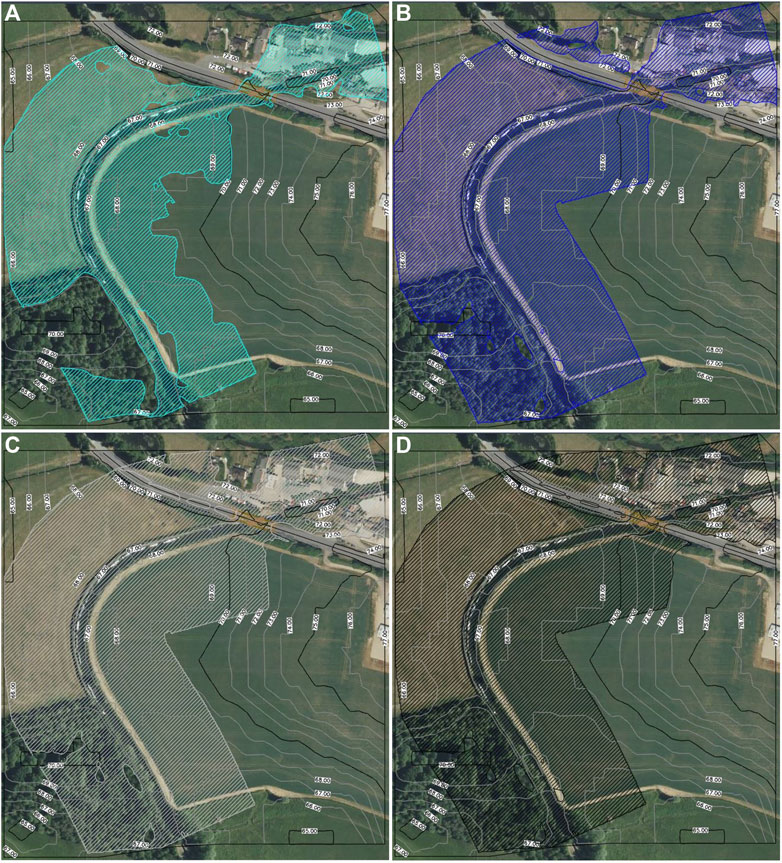
FIGURE 7. Floodplain using satellite imagery for the design flood level and several climate change scenarios. (A) Design flood, (B) RCPs 2.6, (C) RCPs 4.5, and (D) RCPs 8.5.
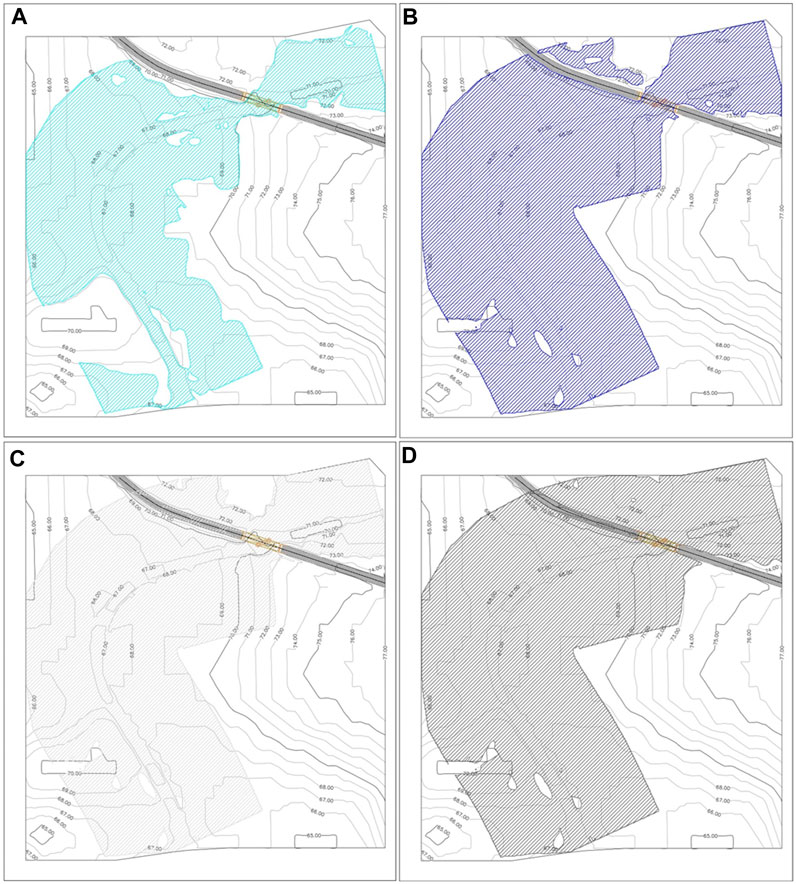
FIGURE 8. Floodplain using topographical view for the design flood level and several climate change scenarios. (A) Design flood, (B) RCPs 2.6, (C) RCPs 4.5, and (D) RCPs 8.5.
The hazard rating using (Eq. 9) assesses the degree of danger posed by floods to people and is controlled by the flood level, flow velocity, and topographic terrain according to Table 3. As the topographic terrain on both banks of the river varies, the assessment of the degree of danger posed by floods on both banks is expected to be more severe on the left bank of the river due to its lower land elevation, which puts buildings inhabited by people at greater risk on the left bank of the river. Table 9, presents the impact of climate change on the degree of floods. The results indicate that for each scenario, the left bank of the river is expected to face a higher impact on people in comparison to the right bank of the river due to the topographic terrain of the area. Furthermore, a higher degree of floods is expected for more pessimistic climate scenarios. For the
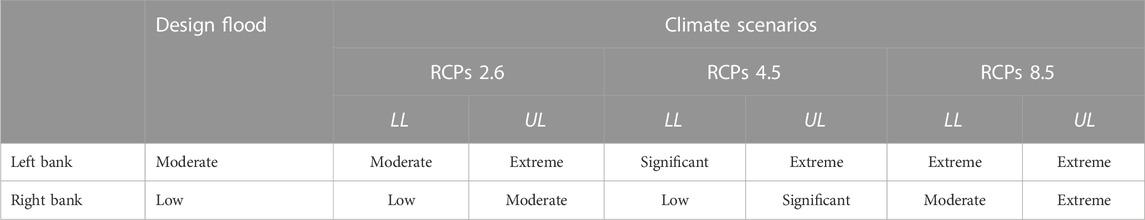
TABLE 9. Degree of floods under a changing climate.
Stochastic assessment of the bridge and its surrounding area involves the concept of the rate of floods under a changing climate exceeding the value of the design flood level (114.19
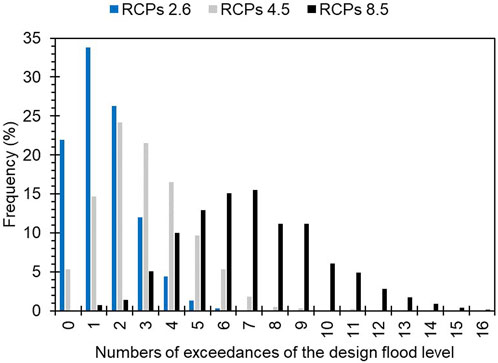
FIGURE 9. Histogram of the numbers of exceedances of the design flood level.
Table 10 presents the

TABLE 10. Expected number of exceeding the design flood level under a changing climate.
Figure 10 investigates the probability of the bridge being out of service (Eq. 10) under a changing climate from 2011 to 2095 using a stochastic Poisson process. In accordance with previous results, Figure 10 indicates that there is a higher probability of the bridge being out of service under a changing climate when considering more pessimistic climate scenarios. A more refined analysis is required to estimate the probability of structural failure of the bridge at network and asset levels (Argyroudis and Mitoulis, 2021; Loli et al., 2022) but this point is beyond the scope of this paper.
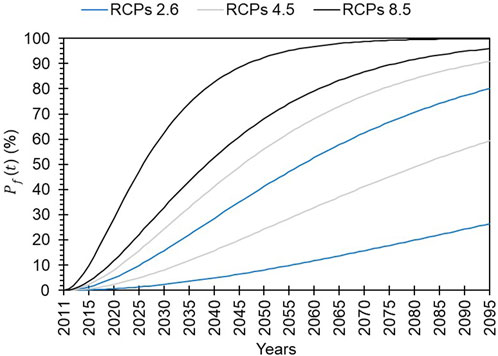
FIGURE 10. Probability of exceeding the design flood level.
This paper proposes a framework to assess the impact of climate change on the bridge’s serviceability in the face of flooding events that combines river flow predictions for climate change scenarios, flood frequency analysis, risk assessment indicators, and a stochastic process. The approach is applied to the analysis of the case study bridge. The main conclusions are summarized as follows:
• The proposed framework presented an interesting set of methods for investigating the impact of flooding events on the probability of bridges being out of service and their impact on the surrounding areas of bridges, in addition to evaluating the degree to which such events are expected to affect people in the future under a changing climate. This framework requires the knowledge of the design flood level of the bridge and does not consider structural failure.
• An investigation of the distributions of flood frequency analysis is mandatory to determine the best-fitting distribution under a changing climate based on a regional basis. The results of the investigation concluded that the Generalized logistic is no longer suitable to describe the flood growth in all regions in the United Kingdom under a changing climate as recommended in the (Flood Estimation Handbook) (Robson and Reed, 2008). In this study, the Gumbel distribution provided the best fit to the annual maximum river discharge values of the Cherwell River in the United Kingdom for all climate change scenarios when compared with other flood frequency analysis distributions.
• The stochastic Poisson process is suitable for assessing the serviceability of bridges subjected to floods to account for the randomness of floods’ arrivals. In this study, a higher likelihood of the case study bridge being out of service (exceeding the design flood level) is expected when considering more pessimistic climate change scenarios.
• The flooded areas are expected to increase in regions where river discharge values are expected to increase when considering more pessimistic climate change scenarios. The following conclusions are based on the effects of the flooded areas under a changing climate in this study.
o The serviceability of the road is not expected to be affected when considering the design level and RCPs 2.6 flood scenarios. However, the road on the left bank of the river is expected to be out of service when considering flooding scenarios of RCPs 4.5 and RCPs 8.5.
o The left bank of the river is expected to face a higher impact on people under a changing climate in comparison to the right bank of the river due to the topographic terrain of the area.
• The risk assessment of bridges and their surrounding areas under a changing climate concluded the following:
o The annual exceedance probability of the 200-year return period flood is expected to increase in regions where river discharge values are expected to increase under a changing climate. In this study, the annual exceedance probability of the 200-year return period flood for the Cherwell River in the United Kingdom has increased when considering more pessimistic climate change scenarios. This indicates that bridges crossing the Cherwell River are expected to face more severe flooding events in the future.
o The risk of flooding indicated by flood zones becomes more severe in some regions under a changing climate. The case study was categorized as a medium probability zone by considering the design flood level. The flood annual exceedance probability becomes more severe under a changing climate, and therefore, the risk of flooding indicated by flood zones becomes more severe under a changing climate, in which a functional floodplain zone is found for each RCPs Upper Limit
o A higher degree of floods is expected in regions where river discharge values are expected to increase when considering more pessimistic climate change scenarios. In this study, the bridge and its surrounding area are categorized extremely dangerous flood zones with deep fast-flowing water which is dangerous for all people when considering RCPs 8.5.
o The impact of floods on road accessibility is expected to increase in some regions under a changing climate. Facilities and services such as, hospitals and working facilities are indirectly affected by floods due to inaccessibility of roads. Detecting the affected roads under a changing climate can help transportation administrators to prioritize their urban planning development in the future.
• Future research should consider the proposed framework to assess the risks posed by floods regionally, provide flood risk maps to inform decisions about flood management and develop strategies for flood risk mitigation. The author suggests presenting a complete framework to assess the impact of flooding events by also investigating the structural failure of bridges due to several damage states, such as the impact of local scour on the stability of bridges and the resulting impacts of hydrodynamic loads and pressures on the deck and piers.
The raw data supporting the conclusion of this article will be made available by the authors, without undue reservation.
BH: Visualization, Writing–original draft, Writing–review and editing, Conceptualization, Data curation, Formal Analysis, Investigation, Methodology, Software, Validation. EB-A: Conceptualization, Formal Analysis, Funding acquisition, Investigation, Resources, Supervision, Validation, Writing–review and editing.
The authors declare financial support was received for the research, authorship, and/or publication of this article. This paper was carried out in the framework of the Strengthening the Territory’s Resilience to Risks of Natural, Climate and Human Origin (SIRMA) project, which is financed by the European Regional Development Fund (ERDF) through INTERREG Atlantic Area Program.
The authors declare that the research was conducted in the absence of any commercial or financial relationships that could be construed as a potential conflict of interest.
The authors declared that they were an editorial board member of Frontiers, at the time of submission. This had no impact on the peer review process and the final decision
All claims expressed in this article are solely those of the authors and do not necessarily represent those of their affiliated organizations, or those of the publisher, the editors and the reviewers. Any product that may be evaluated in this article, or claim that may be made by its manufacturer, is not guaranteed or endorsed by the publisher.
The content of this publication does not necessarily reflect the opinion of the European Union. Neither the INTERREG Europe program authorities nor the authors are responsible for any use that may be made of the information contained therein. In addition, neither the Licensor nor ECMWF can provide any guarantees that Copernicus products are free from errors or omissions, or that any such errors or omissions can be corrected.
Alexander, T. W. (1995). Technique for estimating the 2-to 500-year flood discharges on unregulated streams in rural Missouri. Virginia, United States: US Department of the Interior, US Geological Survey.
Argyroudis, S. A., and Mitoulis, S. A. (2021). Vulnerability of bridges to individual and multiple hazards-floods and earthquakes. Reliab. Eng. Syst. Saf. 210, 107564. doi:10.1016/j.ress.2021.107564
Arnell, N. (2002). Hydrology and global environmental change. London, United Kingdom: Pearson Education.
Bailey, J. F. (1989). Estimation of flood-frequency characteristics and the effects of urbanization for streams in the Philadelphia, Pennsylvania area. Virginia: Department of the Interior, US Geological Survey.
Bastidas-Arteaga, E., El Soueidy, C., Amiri, O., and Nguyen, P. T. (2020). Polynomial chaos expansion for lifetime assessment and sensitivity analysis of reinforced concrete structures subjected to chloride ingress and climate change. Struct. Concr. 21, 1396–1407. doi:10.1002/suco.201900398
Benn, J. (2013). Railway bridge failure during flooding in the UK and Ireland. Proc. Inst. Civ. Eng. - Forensic Eng. 166, 163–170. doi:10.1680/feng.2013.166.4.163
Black, A. R., and Fadipe, D. (2009). Use of historic water level records for re-assessing flood frequency: case study of the spey catchment. Water Environ. J. 23, 23–31. doi:10.1111/j.1747-6593.2007.00105.x
Brad, J., Mia, L., Fatemeh, A., and Anne-Marie, L. (2019). Service life design for bridges. Second Strategic Highw. Res. Program.
Bridges, T. S., Smith, J. M., King, J. K., Simm, J. D., Dillard, M., deVries, J., et al. (2022). Coastal natural and nature-based features: international guidelines for flood risk management. Front. Built Environ. 8, 904483. doi:10.3389/fbuil.2022.904483
Ciscar, J.-C. (2012). The impacts of climate change in Europe (the PESETA research project). Clim. Change. 112, 1–6. doi:10.1007/s10584-011-0336-x
Collins, Engineers (1989). “Underwater inspection of bridges,”. Report No. FHWA-DP-80-1 (Washington, D.C.: U.S. Department of Transportation Federal Highway Administration).
Crawford, K. C. (2023). “Bridge deterioration and failures,” in Fail. Anal. Work. Title (London, UK: IntechOpen). doi:10.5772/intechopen.109927
Cunnane, C. (1987). “Review of statistical models for flood frequency estimation,” in Hydrol. Freq. Model. Editor V. P. Singh (Dordrecht: Springer Netherlands), 49–95. doi:10.1007/978-94-009-3953-0_4
Davidson, M. T., Consolazio, G. R., Getter, D. J., and Shah, F. D. (2013). Probability of collapse expression for bridges subject to barge collision. J. Bridge Eng. 18, 287–296. doi:10.1061/(asce)be.1943-5592.0000376
Development and flood risk, (2006). Planning policy statement 25: Development and flood risk. United Kingdom: TSO.
Dikanski, H., Hagen-Zanker, A., Imam, B., and Avery, K. (2017). Climate change impacts on railway structures: bridge scour. Proc. Inst. Civ. Eng. - Eng. Sustain. 170, 237–248. doi:10.1680/jensu.15.00021
Doocy, S., Daniels, A., Murray, S., and Kirsch, T. D. (2013). The human impact of floods: A historical review of events 1980-2009 and systematic literature review. PLoS Curr. 5. doi:10.1371/currents.dis.f4deb457904936b07c09daa98ee8171a
England, J. F., Cohn, T. A., Faber, B. A., Stedinger, J. R., Thomas, W. O., Veilleux, A. G., et al. (2019). Guidelines for determining flood flow frequency—Bulletin 17C. Virginia, United States: US Geological Survey.
Eurostat, (2022). Climate related economic losses. Boston, United States: Compiling agency: Eurostat, the statistical office of the European Union.
Greuell, W., Andersson, J. C. M., Donnelly, C., Feyen, L., Gerten, D., Ludwig, F., et al. (2015). Evaluation of five hydrological models across Europe and their suitability for making projections under climate change. Glob. hydrology/Modelling approaches. doi:10.5194/hessd-12-10289-2015
Griffis, V. W., and Stedinger, J. R. (2007). Log-pearson type 3 distribution and its application in flood frequency analysis. II: parameter estimation methods. J. Hydrol. Eng. 12, 492–500. doi:10.1061/(asce)1084-0699(2007)12:5(492)
Gumbel, E. J. (1941). The return period of flood flows. Ann. Math. Stat. 12, 163–190. doi:10.1214/aoms/1177731747
Habeeb, B., and Bastidas-Arteaga, E. (2022). Climate change indicators dataset for coastal locations of the European Atlantic area. Data Brief. 43, 108339. doi:10.1016/j.dib.2022.108339
Hannah, R., Pablo, R., and Max, R. (2022). Natural disasters. Available at: https://ourworldindata.org/natural-disasters.
Hatzikyriakou, A., and Lin, N. (2018). Assessing the vulnerability of structures and residential communities to storm surge: an analysis of flood impact during hurricane sandy. Front. Built Environ. 4, 4. doi:10.3389/fbuil.2018.00004
Helen, C., David, R., Bernard, D., Steven, W., Silvia, S. D., Valerie, B., et al. (2005). Framework and guidance for assessing and managing flood risk for new development – full documentation and tools.
Hodson, T. O. (2022). Root mean square error (RMSE) or mean absolute error (MAE): when to use them or not. Clim. Earth Syst. Model. doi:10.5194/gmd-2022-64
HR Wallingford,Flood Risks to People (2006). Phase 2. FD2321/TR1, defra/environment agency flood and coastal defence R&D Programme, flood hazard research centre. London, England: Middlesex University.
Hyndman, R. J., and Fan, Y. (1996). Sample quantiles in statistical packages. Am. Stat. 50, 361–365. doi:10.1080/00031305.1996.10473566
Ipcc, (2014). Climate change 2014 synthesis report summary chapter for policymakers. Geneva, Switzerland: Ipcc, 31. doi:10.1017/CBO9781107415324
Kundzewicz, Z. W., Krysanova, V., Benestad, R. E., Hov, Ø., Piniewski, M., and Otto, I. M. (2018). Uncertainty in climate change impacts on water resources. Environ. Sci. Policy. 79, 1–8. doi:10.1016/j.envsci.2017.10.008
Loli, M., Kefalas, G., Dafis, S., Mitoulis, S. A., and Schmidt, F. (2022). Bridge-specific flood risk assessment of transport networks using GIS and remotely sensed data. Sci. Total Environ. 850, 157976. doi:10.1016/j.scitotenv.2022.157976
Marsooli, R., and Wang, Y. (2020). Quantifying tidal phase effects on coastal flooding induced by hurricane sandy in manhattan, New York using a micro-scale hydrodynamic model. Front. Built Environ. 6, 149. doi:10.3389/fbuil.2020.00149
Matthew, L. (2013). Western route scour assessment Programme, network rail – western route western house. North Yorkshire, United kingdom: JBA Consulting.
Mondoro, A., and Frangopol, D. M. (2018). Risk-based cost-benefit analysis for the retrofit of bridges exposed to extreme hydrologic events considering multiple failure modes. Eng. Struct. 159, 310–319. doi:10.1016/j.engstruct.2017.12.029
Onni, S., Salim, S., and PFJ, (2007). Flood frequency analysis for sarawak using weibull, gringorten and l-moments formula. Institution Eng. 68, 43–52.
Palinkas, C. M., Orton, P., Hummel, M. A., Nardin, W., Sutton-Grier, A. E., Harris, L., et al. (2022). Innovations in coastline management with natural and nature-based features (NNBF): lessons learned from three case studies. Front. Built Environ. 8, 814180. doi:10.3389/fbuil.2022.814180
Parry, M. L. (2007). Climate change 2007: Impacts, adaptation and vulnerability: Contribution of working group II to the fourth assessment report of the intergovernmental Panel on climate change. Cambridge, U.K. ; New York: Cambridge University Press.Intergovernmental Panel on climate change
Phien, H. N. (1987). A review of methods of parameter estimation for the extreme value type-1 distribution. J. Hydrol. 90, 251–268. doi:10.1016/0022-1694(87)90070-9
Ponce, V. M. (1989). Engineering hydrology: Principles and practices. Englewood Cliffs, N.J: Prentice Hall.
Pörtner, H.-O., Roberts, D. C., Adams, H., Adler, C., Aldunce, P., Ali, E., et al. (2022). IPCC, 2022: Climate change 2022: Impacts, adaptation and vulnerability. Contribution of working group II to the sixth assessment report of the intergovernmental Panel on climate change. Cambridge, UK and New York, USA.: Cambridge University Press.
Reilly, J., Stone, P. H., Forest, C. E., Webster, M. D., Jacoby, H. D., and Prinn, R. G. (2001). Uncertainty and climate change assessments. Washington, United States: American Association for the Advancement of Science.
Robins, P. E., Lewis, M. J., Elnahrawi, M., Lyddon, C., Dickson, N., and Coulthard, T. J. (2021). Compound flooding: dependence at sub-daily scales between extreme storm surge and fluvial flow. Front. Built Environ. 7, 727294. doi:10.3389/fbuil.2021.727294
Robson, A., and Reed, D. (2008). Statistical procedures for flood frequency estimation. Wallingford: Centre for Ecology and Hydrology.
Sabūnas, A., Miyashita, T., Fukui, N., Shimura, T., and Mori, N. (2021). Impact assessment of storm surge and climate change-enhanced sea level rise on atoll nations: A case study of the Tarawa atoll, Kiribati. Front. Built Environ. 7, 752599. doi:10.3389/fbuil.2021.752599
Sánchez-Silva, M., and Klutke, G.-A. (2016). Reliability and life-cycle analysis of deteriorating systems. Cham: Springer International Publishing. doi:10.1007/978-3-319-20946-3
Serdar, M. Z., and Al-Ghamdi, S. G. (2023). Resilience-oriented recovery of flooded road networks during mega-sport events: A novel framework. Front. Built Environ. 9, 1216919. doi:10.3389/fbuil.2023.1216919
Setsobhonkul, S., Kaewunruen, S., and Sussman, J. M. (2017). Lifecycle assessments of railway bridge transitions exposed to extreme climate events. Front. Built Environ. 3, 35. doi:10.3389/fbuil.2017.00035
Shen, Y., Goodall, J. L., and Chase, S. B. (2017). Method for rapidly assessing the overtopping risk of bridges due to flooding over a large geographic region. JAWRA J. Am. Water Resour. Assoc. 53, 1437–1452. doi:10.1111/1752-1688.12583
Shepherd, T. G. (2014). Atmospheric circulation as a source of uncertainty in climate change projections. Nat. Geosci. 7, 703–708. doi:10.1038/ngeo2253
Singh, V. P., and Yadava, R. N. (2003). Watershed hydrology: Proceedings of the international conference on water and environment. New Delhi: Allied Publishers.
Stedinger, J. R., and Cohn, T. A. (1986). Flood frequency analysis with historical and paleoflood information. Water Resour. Res. 22, 785–793. doi:10.1029/wr022i005p00785
Stedinger, J. R., and Griffis, V. W. (2008). Flood frequency analysis in the United States: Time to update. Virginia, United States: American Society of Civil Engineers.
Te Chow, V., Maidment, D. R., and Mays, L. W. (1988). Applied hydrology. San Diego: San Diego State University.
The European Parliament And The Council Of The European Union, (2007). Directive 2007/60/EC of the EUROPEAN PARLIAMENT and of the COUNCIL on the assessment and mahagement of flood risks.
Tim, C. (1982). Guidelines for determining flood flow frequency- Bulletin 17-B. Virginia: US Department of the Interior, US Geological Survey, USGS Office of Surface Water.
Todd, D. K. (1957). Frequency analysis of streamflow data. J. Hydraul. Div. 83. doi:10.1061/JYCEAJ.0000060
Trid, (2017). AASHTO LRFD bridge design specifications. 8. Washington, DC: American Association of State Highway and Transportation Officials.
Truong, Q. C., El Soueidy, C.-P., Li, Y., and Bastidas-Arteaga, E. (2022). Probability-based maintenance modeling and planning for reinforced concrete assets subjected to chloride ingress. J. Build. Eng. 54, 104675. doi:10.1016/j.jobe.2022.104675
van Vuuren, D. P., Edmonds, J., Kainuma, M., Riahi, K., Thomson, A., Hibbard, K., et al. (2011). The representative concentration pathways: an overview. Clim. Change. 109, 5–31. doi:10.1007/s10584-011-0148-z
Vogel, R. M., and Castellarin, A. (2017). Handb. Appl. Hydrol. NY, USA: McGraw-Hill Educ. 2nd Edpp 781-7810.Risk, reliability, and return periods and hydrologic design
Wallingford, H. R. (2006). The flood risks to people methodology. United Kingdom: Defra/Environment Agency Flood and Coastal Defence R&D Programme.
Watson, C. C., and Biedenharn, D. S. (2011). “Comparison of flood management strategies,” in Inland flood hazards hum (Riparian Aquat. Communities), 381–393.
Zhang, G., Liu, Y., Liu, J., Lan, S., and Yang, J. (2022). Causes and statistical characteristics of bridge failures: A review. J. Traffic Transp. Eng. Engl. Ed. 9, 388–406. doi:10.1016/j.jtte.2021.12.003
Keywords: climate change, bridges, stochastic Poisson process, risk assessment, flooding, floodplain mapping
Citation: Habeeb B and Bastidas-Arteaga E (2023) Assessment of the impact of climate change and flooding on bridges and surrounding area. Front. Built Environ. 9:1268304. doi: 10.3389/fbuil.2023.1268304
Received: 27 July 2023; Accepted: 15 September 2023;
Published: 29 September 2023.
Edited by:
Francesco Petrini, Sapienza University of Rome, ItalyReviewed by:
Luca Sgambi, Université Catholique de Louvain, BelgiumCopyright © 2023 Habeeb and Bastidas-Arteaga. This is an open-access article distributed under the terms of the Creative Commons Attribution License (CC BY). The use, distribution or reproduction in other forums is permitted, provided the original author(s) and the copyright owner(s) are credited and that the original publication in this journal is cited, in accordance with accepted academic practice. No use, distribution or reproduction is permitted which does not comply with these terms.
*Correspondence: Emilio Bastidas-Arteaga, ZWJhc3RpZGFAdW5pdi1sci5mcg==
Disclaimer: All claims expressed in this article are solely those of the authors and do not necessarily represent those of their affiliated organizations, or those of the publisher, the editors and the reviewers. Any product that may be evaluated in this article or claim that may be made by its manufacturer is not guaranteed or endorsed by the publisher.
Research integrity at Frontiers
Learn more about the work of our research integrity team to safeguard the quality of each article we publish.