 Chunguang Li1
 Yan Han
94% of researchers rate our articles as excellent or good
Learn more about the work of our research integrity team to safeguard the quality of each article we publish.
Find out more
ORIGINAL RESEARCH article
Front. Built Environ., 03 October 2023
Sec. Bridge Engineering
Volume 9 - 2023 | https://doi.org/10.3389/fbuil.2023.1264996
This article is part of the Research TopicImproving Bridge Performance Subjected to Aging and Natural DisastersView all 4 articles
To study the influence of maintenance track on the vortex-induced vibration (VIV) performance of main girder, the VIV response and time history of surface pressure data of a section model were obtained by wind tunnel vibration and pressure measurements for a large-span steel box girder suspension bridge. The VIV performance of the main girder was tested at ±5° attack angles of various maintenance track positions, including 1, 2.5, and 5 m away from the outer edge of the girder bottom plate. The mean values, root variances and amplitude spectra of vortex-induced force and the correlation and contribution coefficients of local aerodynamic force to overall aerodynamic force were analyzed. The results show that when the maintenance track is 1 m away from the outer edge of the bottom plate, the main girder exhibits the worst VIV performance with a maximum amplitude of 0.457 m, far beyond the allowable value of the specification. The VIV performance of the main girder was greatly improved by moving the maintenance track inward. The pressure analysis indicates that the large pressure fluctuation at the front and rear parts of the upper surface is attributed to the strong VIV of the main girder. In this sense, the improved VIV performance is mainly contributed by the weakening of pressure fluctuation in these two areas and the reduced local aerodynamic force. When the distance between the maintenance track and bottom plate is adjusted to 2.5 m, a 3.5 m wind barrier with a ventilation rate of 30% effectively inhibits the VIV of the box girder. The main reason for the suppression is that the elimination of pressure fluctuation on the upper surface of the girder disturbs the correlation between local aerodynamic force and overall aerodynamic force, consequently diminishing the contribution of local aerodynamic force to the vortex-induced force.
Vortex-induced vibration (VIV) is a common form of wind-induced vibration in long-span bridges. Specifically, the wind flows through the main girder roll up the boundary layer of the main girder and the flow separation generates vortex shedding. VIV will occur when the vortex shedding frequency is close to the natural vibration frequency of the girder (Gao et al., 2021; Ge et al., 2022), and noticeable cases have been observed over some large-span bridges (Battista et al., 2000; Fujino and Yoshida, 2002; Li et al., 2014). Vertical VIV often arises over large-span bridges under the frequent low wind speed since the vertical bending frequency of the bridges is usually lower than the torsional frequency (Li et al., 2014; Zhao et al., 2022). Large-scale vertical VIV is prone to affect driving safety; in particular, its high tendency to induce public panic has been widely concerned by society (Liu et al., 2022). In this sense, research on wind resistance has concentrated on the VIV over long-span bridges.
Vortex shedding is generally related to the aerodynamic shape of the girder, wind attack angle, incoming wind speed, etc., and the VIV performance over long-span bridges is also affected by mass-damping parameters. Scholars have investigated VIV and its suppression over long-span bridges. The main research methods include wind tunnel tests (Xu et al., 2016), numerical simulations (Nguyen et al., 2018) and theoretical modeling (Zhu et al., 2017; Xu K. et al., 2020). Based on these studies, aerodynamic measures such as deflectors, stabilizer plates, guide vanes and separators are widely used in bridges. Ancillary facilities, involving railings and maintenance tracks, affect the VIV performance of the main girder. For example, adding railings leads to the poorer VIV performance of the main girder compared with the bare girder. Nagao et al. (1997) pointed out that the VIV performance was influenced by detailed modification of the main girder. Li M. et al. (2018) conducted wind tunnel tests to study the influence of the position of the maintenance track and the wind barrier permeability on the vortex-induced vibration performance of a streamlined box girder. They found that the maximum suppression effect of moving maintenance track position can be 30.1%, and the wind barrier with a 41.0% permeability can reduce the heaving VIV amplitude by 45.3%. In summary, changes in the auxiliary component position and ventilation rate of railings or wind barriers can improve the VIV performance of the main girder.
Optimizing the fairing shape can improve the VIV performance of the main girder of box girder bridges. Considerable experimental studies have concluded that the sharper fairing showed a better VIV performance of the main girder (Larsen, 2008; Wang, 2013; Li YL. et al., 2018). A simplified rectangular structure with fairings at both ends is favorable for examining the VIV mechanism of the box girder (He et al., 2017; Montoya et al., 2018) by studying the flow field around it. The most ideal method to explore the inherent mechanism of VIV is to conduct flow field tests in a wind tunnel, such as PIV (Chen et al., 2019). However, due to the limitations of experimental conditions, obtaining flow field information mainly relies on wind tunnel pressure measurements and numerical simulations (Xu et al., 2016; Hu et al., 2018; Zhang et al., 2022). On-site measurement data is precious to researchers, but on-site testing is constrained by many factors, and only a few research institutions have the conditions for that (Zhao et al., 2022). It is worth mentioning that Xu F. et al. (2020) proposed a new method, which is a large-scale aeroelastic model test in natural wind. This method may compensate for the shortcomings of on-site measurements. Zhang et al. (2022) revealed the unstable flow mode of streamlined box girder at Re = 4 × 10⁴ through the numerical simulation, pointed out two primary streamwise vortex-induced shedding modes, namely, the impinging leading-edge vortex shedding and the trailing-edge vortex shedding and investigated their interaction in the near wake. This finding explains that the locking regions in the main girder are caused by the impinging leading-edge vortex shedding instability. Hu et al. (2018) analyzed the evolution law of aerodynamic forces of streamlined box girders through surface pressure measurements. They proposed that the VIV at the attack angle of +3° was mainly due to the contribution of aerodynamic forces near the downstream of the upper surface to the vortex-induced aerodynamic force. Xu et al. (2016) compared the VIV performances of the box girder under uniform and turbulent flow conditions. Using a deflector successfully controlled the torsional VIV, and the VIV performance was reduced using the guide vane. The exploration of pressure fluctuation variations shows that the vortex on the upper surface of the girder can be eradicated by the deflector and is free from the impact of aerodynamic shape optimization of the lower surface. Hu et al. (2019) studied the mechanism of VIV suppression of the box girder by adding small-scale components to the bridge, but they did not consider the maintenance track location.
The research object of this paper is a streamlined steel box girder with a large width-to-height ratio. The vortices caused by leading edge separation and the new vortices formed at the trailing edge may lead to VIV. This study aims to explore the impact of the location of the lower-surface ancillary facilities (maintenance track) on the VIV performance of the main girder. Considering aesthetic factors, the commonly-used deflector was substituted with a wind barrier to analyze its impact on the VIV performance of the main girder and explore the flow field changes of the main girder through surface pressure measurements. The distribution of average pressure and pressure fluctuation, vortex-induced aerodynamic characteristics and local aerodynamic force contribution to the overall aerodynamic force were revealed. The vortex shedding mechanism of the box girder was studied, and the generation and internal mechanism of the vortex were analyzed in combination with the vibration suppression measures. The summarized findings can provide references for VIV suppression over similar bridges.
The investigated large-span suspension bridge is built in China with a main span of 808 m, as shown in Figure 1. The rise-span ratio of the main cable is 1:10, and the main girder section is a streamlined steel box girder section. The stiffening beam is 39.6 m wide and 3.0 m high with a width-to-height ratio of 13.2. The bridge deck is equipped with four anti-collision guardrails, and two maintenance tracks are symmetrically arranged on the bottom plate of the main girder. The elevation of the bridge and standard cross-section of the main girder are shown in Figures 1, 2.

FIGURE 1. The elevation of the bridge (unit: m).
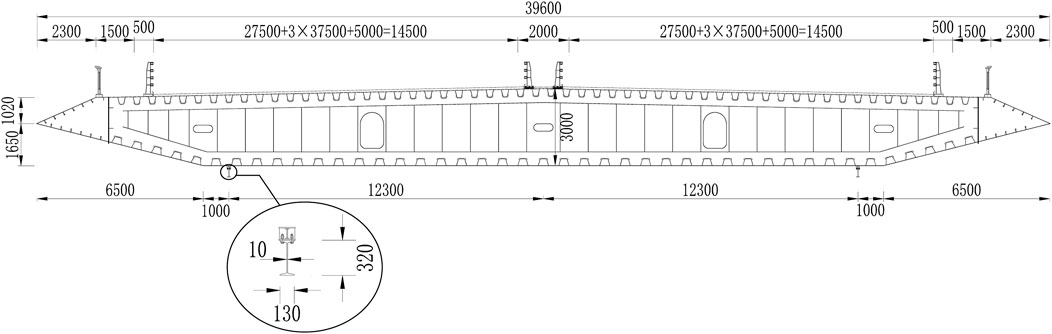
FIGURE 2. Standard cross-section of the main girder (unit: mm).
The girder section model was tested in the high-speed section of the wind tunnel laboratory at Changsha University of Science and Technology. The test section is 21.0 m (length) × 4.0 m (wide) × 3.0 m (high). The wind speed was continuously adjusted from 1.0 to 45.0 m/s.
The main girder model measures 1.55 m (length) × 0.792 m (width) × 0.06 m (height) with a scale ratio of 1:50. The blocking rate of the main girder model test is lower than 3%, in agreement with the specifications of wind resistance. The skeleton of the main girder model is made of square stainless-steel pipes and coated with high-quality wood to ensure a consistent geometric shape. The wind barrier is 3.5 m high, with an air permeability of 30%. To verify the binary characteristics of airflow near the main girder, acrylonitrile butadiene styrene plates were used at both ends of the model. The processing materials for the rest components and end plates were identical. The present investigation guaranteed the geometric consistency of ancillary facilities and considered the railing ventilation rate. The main experimental parameters of the section model are shown in Table 1. The local layout of the maintenance track for wind tunnel tests and the testing cases are shown in Figures 3, 4 respectively.
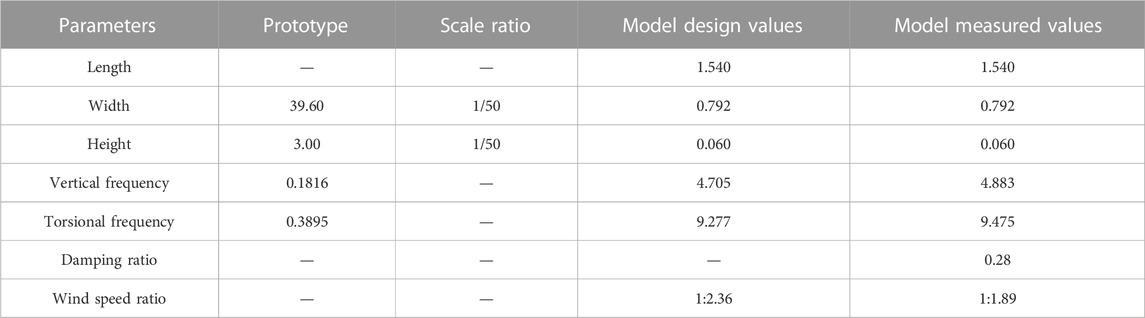
TABLE 1. Experimental parameters of girder section model.
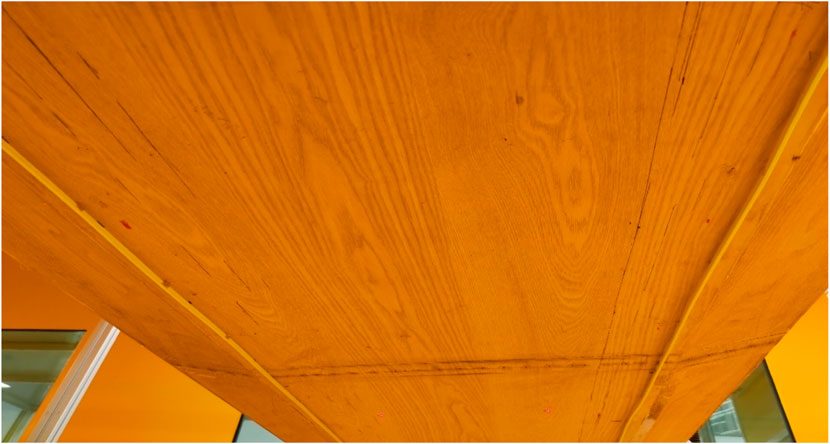
FIGURE 3. The local layout of the maintenance track for wind tunnel tests.
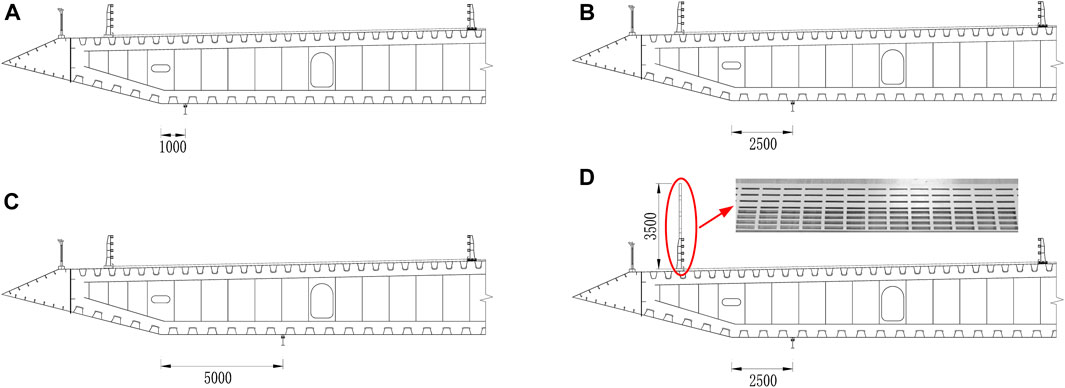
FIGURE 4. Schematic diagram of the testing cases: maintenance track spacing of (A) 1 m, (B) 2.5 m, (C) 5 m, (D) 2.5 m + a wind barrier with a 30% ventilation rate (unit: mm).
A total of 57 pressure measuring points were arranged at the center of the section model with a dense layout at the wind field featured by dramatic changes (Figure 5) to obtain the pressure fluctuation data on the model surface. The pressure time history of each measuring point was synchronously collected through the PSI electronic pressure scanning valve with model 16TC/DTC. The sampling frequency and duration were 330 Hz and 60.60 s, respectively. A total of 20,000 data were collected from each measuring point and corrected using the frequency response function of the pressure measuring pipeline. The displacement signal was obtained through two laser displacement meters symmetrically placed on the beam bottom plate. The sampling frequency and time were 500 Hz and 40 s, respectively. The incoming wind speed was monitored by a cobra anemometer in front of the model.
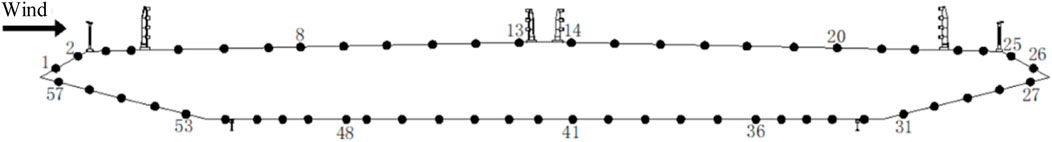
FIGURE 5. Layout of pressure measuring points on the section.
Wind tunnel tests were carried out in a uniform flow field, and the VIV performance under ±5° angles of attack were tested. Given that the strong vertical VIV occurred at a +5° angle of attack, the subsequent research was completed at this angle of attack.
Figures 6, 7 show the curves of the vertical displacement of the main girder changing with the wind speed over the actual bridge with a wind barrier at different maintenance track locations. It can be seen from Figure 6 that when the maintenance track is 1 m away from the outside, the girder section has an extremely strong vertical VIV in two wind speed intervals with amplitudes and corresponding wind speed ranges of 0.14 and 0.457 m and 6.41–8.13 and 11.77–17.47 m/s, respectively. According to the Chinese wind resistant specification (JTG/T3360-01-2018) (China’s Ministry of Transportation, 2018), the amplitude limit of the vertical VIV is (hv) = 0.04/fv = 0.22 m. The root mean square (RMS) form is adopted in this paper, so the allowable value is 0.155 m. The amplitude during the second wind speed interval is about 2.93 times higher than the allowable value. With the maintenance track moving inward, the VIV amplitude in both wind speed intervals decreases significantly with a shortened range of wind speed. Specifically, the wind speed ranges are 6.41–7.8 and 12.23–16.91 m/s at the distance of 2.5 m and 6.41–7.8 and 12.82–15.50 m/s at a spacing of 5 m. The maximum amplitude is reduced to 0.205 m, about 1.315 times the allowable value of the specification, and it is reduced by about 55% compared to the original section. The observations indicate that the VIV of the box girder is sensitive to the location of the maintenance track, and the track with a longer distance away from the outside of the bottom plate exhibits a more significant controlling effect on VIV. Figure 7 displays that when the maintenance track is 2.5 m away outside the bottom plate, the wind barrier with a 30% ventilation rate has an excellent inhibitory effect on the VIV of the main girder, and the additional wind barrier adequately controls the VIV of the bridge. The amplitude well meets the specification requirements. Subsequently, we tested the VIV performance of the main girder at other angles of attack and found that no vibration occurred.
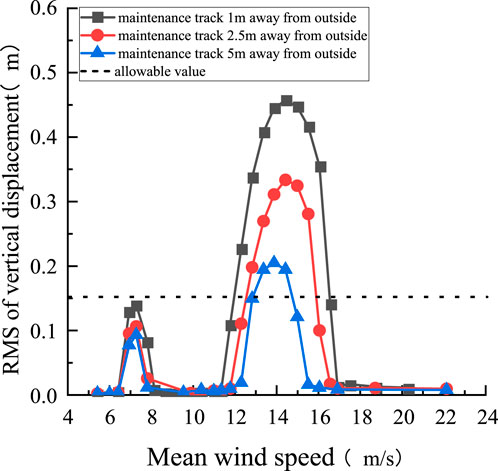
FIGURE 6. Relationship between VIV amplitude and wind speed under different maintenance track positions at a +5° angle of attack.
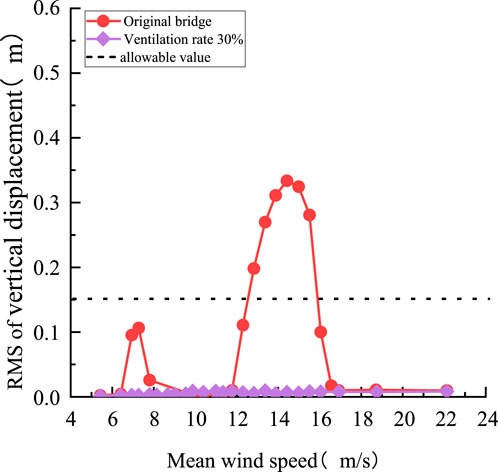
FIGURE 7. Relationship between VIV amplitude and wind speed under working conditions as follows: a wind barrier with a 30% ventilation rate, maintenance track spacing of 2.5 m, and an attack angle at +5°.
The spatial distribution of the fluctuating pressure data on the section model surface can reflect the aerodynamic distribution and evolution characteristics of the beam under different working conditions. For this reason, many scholars have applied pressure measurement tests in wind tunnels to explore the mechanism affecting the VIV of long-span bridges.
The separation and reattachment of airflow on the girder surface were judged by the mean pressure coefficient distribution of each measuring point on the model surface. Figure 8 shows the mean pressure values under the wind speed corresponding to the maximum amplitude of each test condition. The pressure coefficient of measuring point (i) is defined as:
where
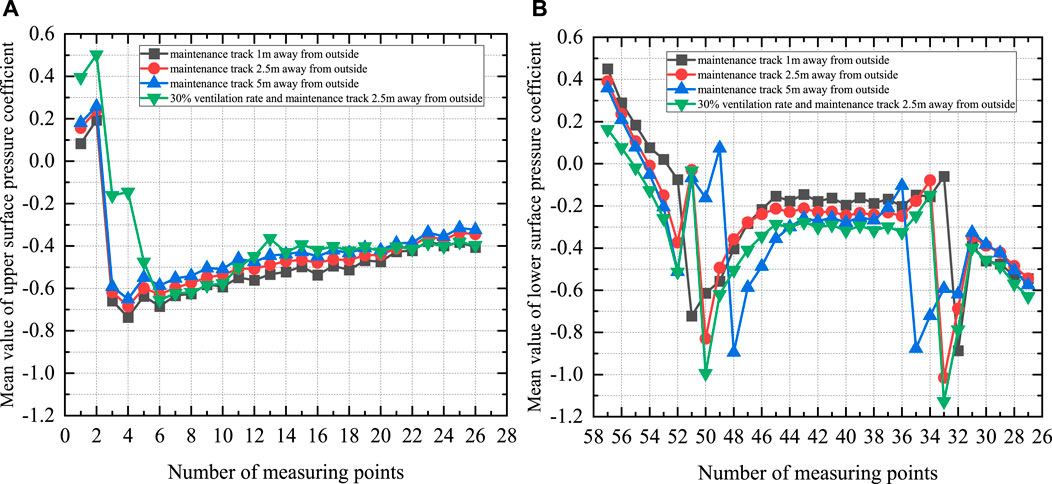
FIGURE 8. Comparison of the mean value of pressure coefficient: (A) Upper surface, (B) Lower surface.
It can be seen from Figure 8A that the mean pressure coefficient on the upper surface of the beam shifts from positive values at measuring point 2 to negative values at measuring point 3. The main reason is that the incoming flow is separated from the railing near the wind fairing. The areas on the upper surface of the main girder (measuring points 3–26) are in a negative pressure state except the wind fairing area on the windward side of the bridge deck, which indicates that the separated flow in the railing area remains detached in the area behind the upper surface. With the inward movement of the maintenance track, the positive pressure in the windward side fairing area on the upper surface increases to varying degrees, and the negative pressure in other areas of the main girder shows a decreasing trend. When the maintenance track is 2.5 m away from the outer edge, a wind barrier with a 30% ventilation rate is placed on the surface of the main girder. The positive pressure of the wind fairing area increases sharply, and the negative pressure (measuring points 3–5) decreases to a large extent. The reason for this phenomenon may be the obstruction of airflow by wind barriers, or even backflow.
As is shown in Figure 8B, when the maintenance track on the lower surface of the main girder is 1 m away from the outer edge, the mean pressure coefficient at measuring point 53 changes from a positive value to a negative value, which indicates the incoming flow is separated at the junction of the windward inclined web and the bottom plate. With the maintenance track moving inward, the position where the wind pressure coefficient changes from positive values to negative values moves forward (from point 51 to 50 and then to point 48); the positive value of the inclined web area on the windward side decreases. The downstream mutation point is also altered. Relocation of the maintenance track can cause a sharp jump in the mean pressure coefficient at the two measuring points near the maintenance track, and its inward movement slightly raises the absolute value of the pressure coefficient. However, when the maintenance track is arranged 2.5 m from the outer edge of the bottom plate, the addition of the bridge deck wind barrier does not change the spatial distribution of the pressure on the lower surface and only slightly increases the negative pressure there.
Figure 9 shows the vertical VIV response for various locking-in ranges, and the blue and red dots represent the wind speeds used to analyze the evolution of aerodynamic pressure in two lock-in ranges, respectively. In the 1st lock-in range, the selected wind speeds are 6.41, 7.27, 7.80, and 8.14 m/s, respectively. In the 2nd lock-in range, the wind speeds of 11.34, 12.30, 14.42, 16.55, and 16.91 m/s are selected, including the initial VIV point, midpoint of ascent stage, extreme amplitude point, point of descent stage, and ending VIV point. To study the non-linear evolution characteristics of aerodynamic forces around a box girder during the whole VIV-development process, this section shows the mean value of pressure coefficient in different VIV stages, as shown in Figure 10. It can be seen that the variation trends of the surface pressure coefficient of the main girder are basically the same under different wind speeds, and the values are not significantly different. These indicate that the airflow around the surface of the box girder does not change with the VIV amplitude. It is worth noting that in the 2nd VIV lock-in range, the pressure amplitude at point 51 on the lower surface changes significantly, which may be due to the impact of the maintenance track on the downstream vicinity.
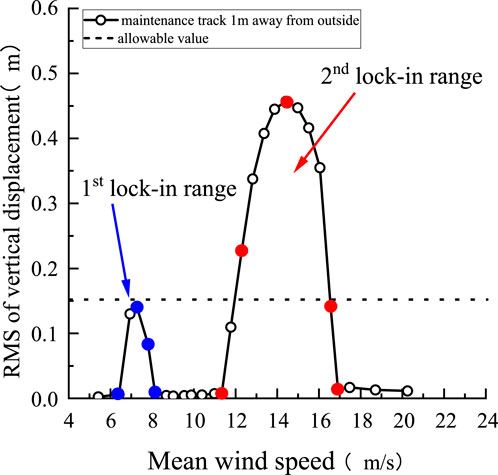
FIGURE 9. Vertical VIV responses for various lock-in ranges.
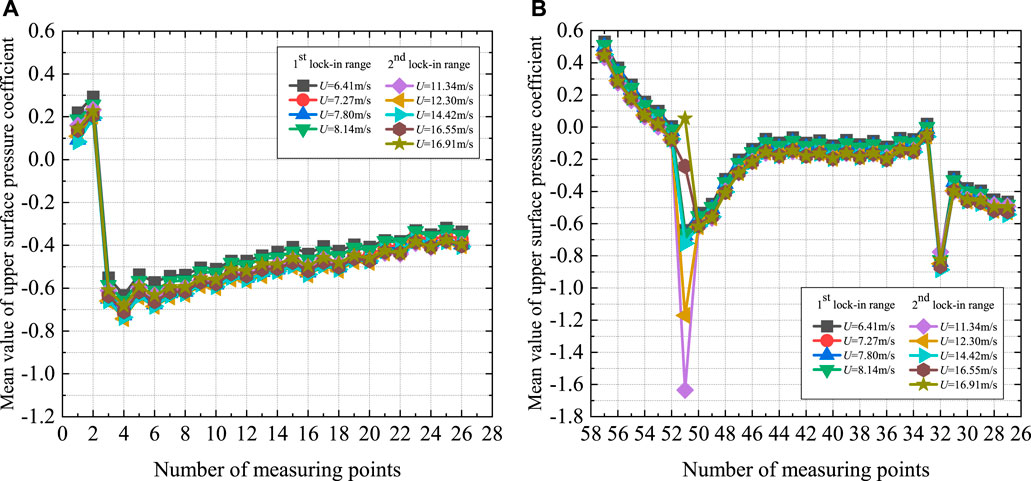
FIGURE 10. Mean value of pressure coefficient in different VIV stages: (A) Upper surface, (B) Lower surface.
The spatial distribution of the root mean square (RMS) of the pressure coefficient on the surface of the section model can clearly reflect the strength of the surface pressure fluctuation.
It can be seen from Figure 11A that when the main girder undergoes VIV, the trend of pressure fluctuations on the upper and lower surfaces is basically consistent. At the +5° attack angle, significant vortices curled up near the windward side of the upper surface, leading to a clear range of pressure fluctuations. The pressure fluctuation is relatively low in the middle position. However, with the movement and development of the boundary layer and shear layer airflow on the surface of the main girder, a stronger pressure pulsation zone is formed at the rear. Strong pressure fluctuations appear in the front (measuring points 2–13) and rear (measuring points 15–23) of the upper surface, with those in the rear area being significantly more intense. The pressure fluctuations may be an important factor for the strong VIV of the model. With the inward movement of the maintenance track, the pressure fluctuations in the two areas and the VIV of the main girder are greatly reduced. When the maintenance track is 2.5 m away from the edge of the bottom plate and the wind barrier with a 30% ventilation rate is installed, the strong pressure fluctuations in these two areas on the upper surface of the main girder disappear.
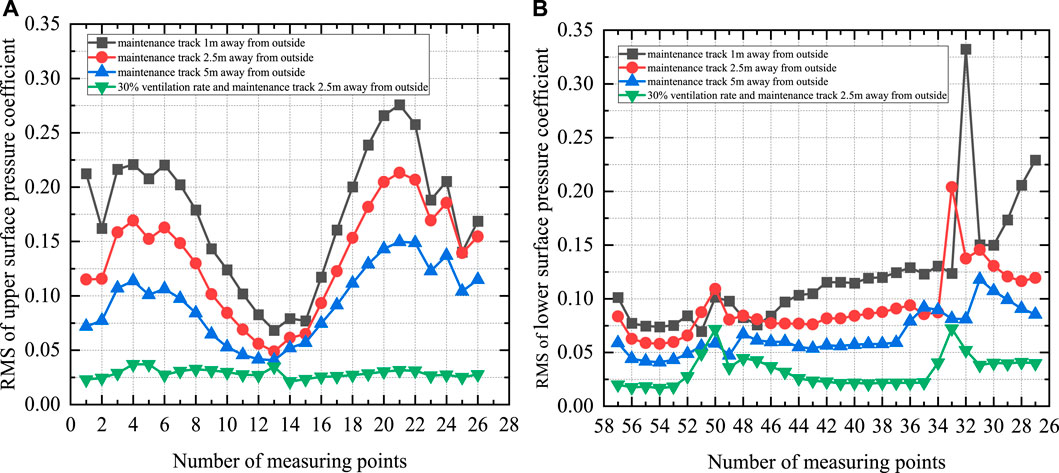
FIGURE 11. Comparison of RMS value of pressure coefficient: (A) Upper surface, (B) Lower surface.
Due to the relocation of the maintenance track, the position of the peak RMS of the lower surface pressure coefficient changes, as shown in Figure 11B. As the air flows downstream, the pressure coefficient on the lower surface gradually increases, forming strong pressure fluctuation near the downstream maintenance track and the lower web plate. The RMS of the pressure coefficient in a certain area decreases to varying degrees with the inward movement of the maintenance track. The pressure fluctuation near the maintenance track is strong, but its influence scope is limited. However, when the wind barrier is added and the maintenance track is 2.5 m away from the outer edge, the RMS of the pressure coefficient is significantly lower than the value under other working conditions. In Figure 11B, the pulsating pressure coefficient of the maintenance track at a distance of 1 m from outerside has increased to a certain extent in the leeward inclined web area, which should be caused by the vortex formed at the downstream web shedding and entering the wake. Based on the free vibration test results of the section model, it can be seen that the RMS of the pressure coefficient depends on the VIV amplitude.
In the 1st and 2nd lock-in range, the RMS of the surface pressure coefficient of the girder varies with wind speed as shown in Figures 12, 13. There is a significant difference in the VIV excitations and VIV-sustained mechanisms between the two lock-in intervals. At the same time, there are obvious evolutionary characteristics of fluctuation pressure in each stage of VIV in two ranges. From Figure 12, it can be seen that in the 1st lock-in range, the overall wind pressure fluctuation on the upper and lower surfaces of the girder is strong, and decreases as the wind speed decreases. As shown in Figure 13, in the 2nd lock-in range, the pressure distribution trends at each stage are basically consistent when the girder experiences VIV, which also indicates that it is reasonable to only compare the pressure distribution at the extreme point of different working conditions. When the girder does not experience VIV, the pressure fluctuations on the upper and lower surfaces are relatively low. In the ascent stage, the pressure fluctuation in the front and rear of the upper surface is significantly enhanced, and there is also significant pressure fluctuation near the inclined web of the lower surface. However, when the wind speed reaches 14.42 m/s, corresponding to the extreme amplitude point, the pressure fluctuation at the rear of the upper surface is slightly lower than that in the ascent stage, but the vortex shedding intensity at the rear of the lower surface is slightly stronger. As the wind speed continues to increase to 16.55 m/s, corresponding to the descent stage, the pressure fluctuation on the surface significantly decreases. It is worth noting that the peak point of the RMS of pressure coefficient at the rear of the upper surface moves downstream with the increase of wind speed, which may be related to the downstream movement of vortex shedding.
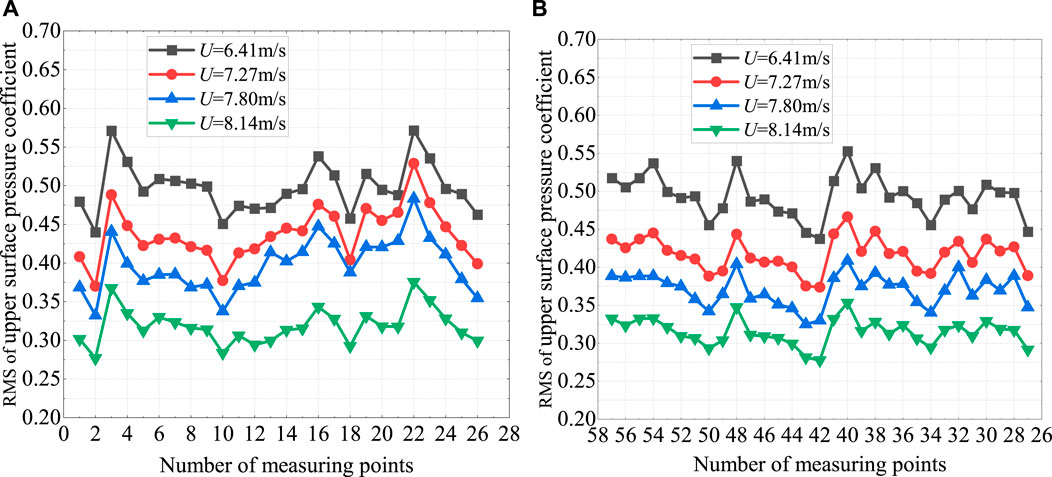
FIGURE 12. RMS of pressure coefficient in the 1st lock-in range: (A) Upper surface, (B) Lower surface.
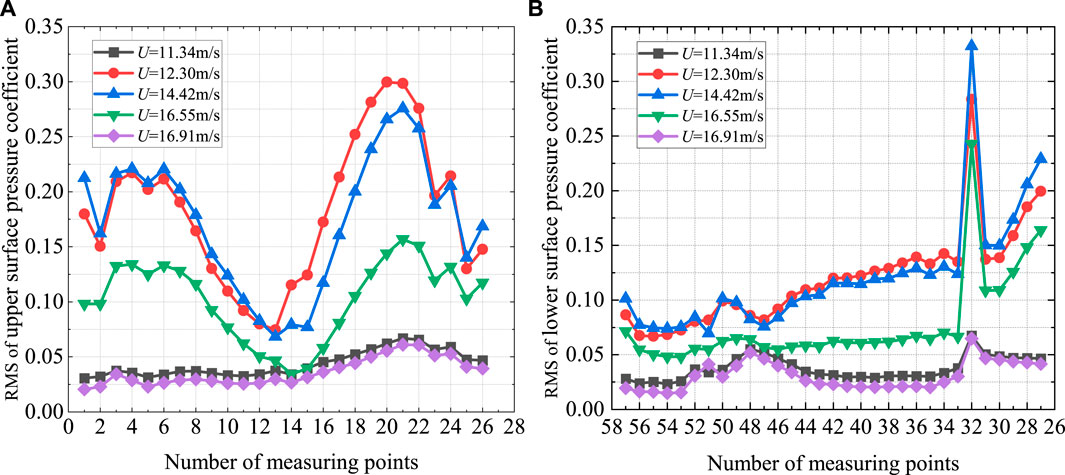
FIGURE 13. RMS of pressure coefficient in the 2nd lock-in range: (A) Upper surface, (B) Lower surface.
The product of the pressure at each measuring point and its representative area is the local aerodynamic force. The total aerodynamic force of the whole section can be obtained by integrating the local aerodynamic force at all pressure measuring points. The vortex-induced force can be acquired by subtracting the average value of the overall aerodynamic force and converting it to the overall coordinate system of the wind axis. However, the total aerodynamic force obtained by the pressure integration method does not include the aerodynamic force on the ancillary facilities of the main girder. Vortex-induced force is calculated by the following equations (Xu et al., 2023):
where
Figure 14 shows the time history of vortex-induced force at the amplitude extreme point when the maintenance track is 1 m away from the outer edge. It can be seen that the vortex-induced force does not follow a sine curve with a single frequency, and its fluctuation amplitude is large. The amplitude spectra of vortex-induced force under different working conditions are shown in Figure 15, which reflects its multi-frequency characteristics and amplitude variation law. The vortex-induced force has a predominant frequency of 4.898 Hz and a second harmonic component frequency of 9.795 Hz. The frequency doubling phenomenon reflects the non-linear characteristics of vortex-induced force. When the maintenance track is 1, 2.5, and 5 m away from the outer edge, the second harmonic components account for 14.4%, 16.9%, and 9.9%, respectively, also indicating that vortex-induced force has non-linear characteristics. As the maintenance track moves inward, the amplitude of VIV decreases. The non-linearity of vortex-induced force does not decrease with the reduction of the amplitude of VIV, and there is no positive correlation between them. When the wind barrier is added and the maintenance track is 2.5 m away from the outer edge, the frequency of the amplitude spectrum of vortex-induced force is disordered, and there is no obvious predominant frequency. It is indicated that the wind barrier can effectively control the VIV of the girder.
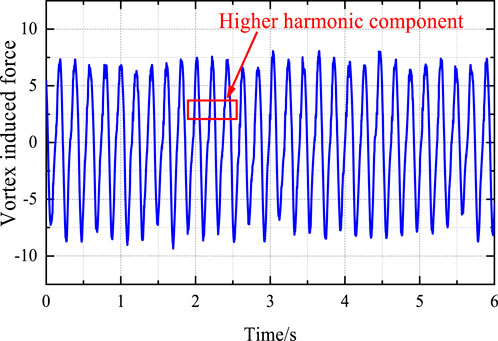
FIGURE 14. Time history of vortex-induced force at amplitude extreme point when the maintenance track is 2 cm away from the outside.
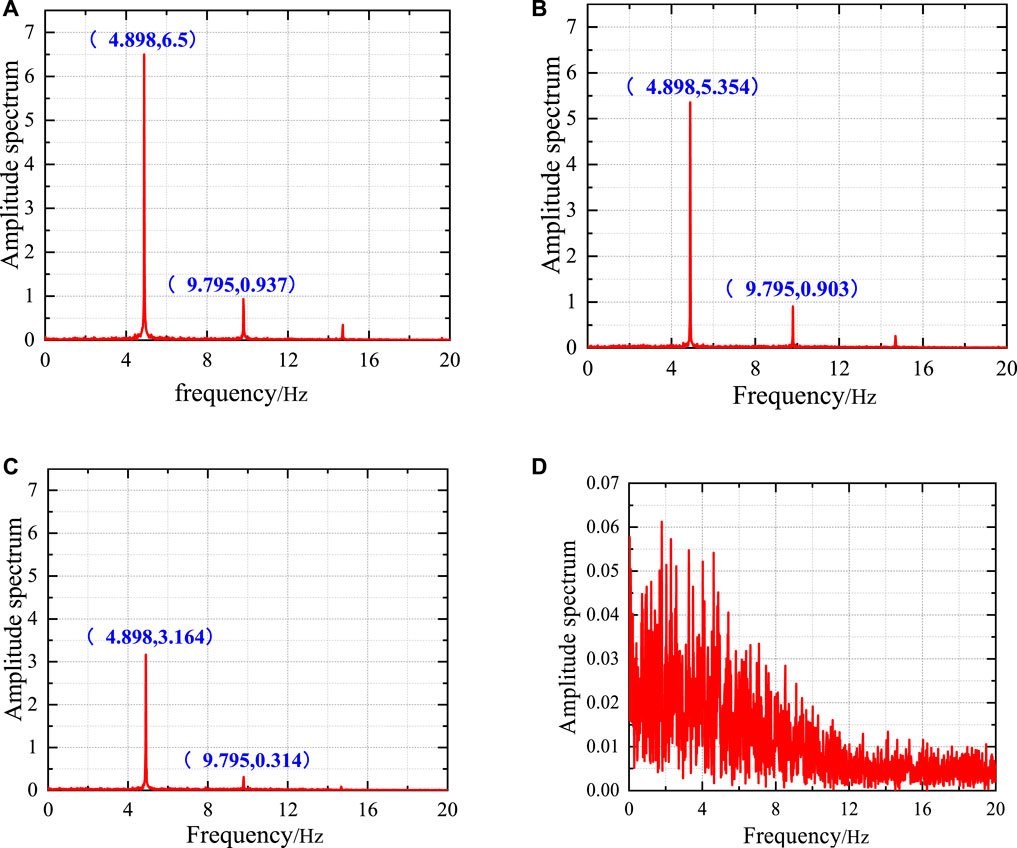
FIGURE 15. Amplitude spectrum of vortex-induced force under different working conditions: (A) Maintenance track 1 m away from the outer edge, (B) Maintenance track 2.5 m away from the outer edge, (C) Maintenance track 5 m away from the outer edge, (D) Maintenance track 2.5 m away from the outer edge and wind barrier with a 30% ventilation rate.
The correlation between the local aerodynamic force and the overall vortex-induced force is expressed by the correlation coefficient. The sign of the correlation coefficient indicates the direction of the correlation between them, and the absolute value of the correlation coefficient indicates the degree of correlation. The aerodynamic force is calculated by Eqs 2, 3 in Section 3.2. The relevant coefficient is defined as follows:
Where X is the local aerodynamic force at a measuring point; Y is the overall aerodynamic force of the section obtained by integrating the local aerodynamic force at each measuring point. The value range of R is (−1, 1).
Figure 16 shows the spatial distribution of the correlation coefficients under different working conditions. The correlation coefficients in Figure 16A are positive, indicating a positive correlation between the local aerodynamic force on the upper surface and the overall vortex-induced force. The trends of the correlation coefficients in the case of the upper surface are similar despite the different positions of the maintenance track. With the inward movement of the maintenance track, the correlation coefficients in two areas (at measuring points 1–6 and 10–13) slightly increase. The correlation coefficients are basically the same in the area covering measuring points 15–24 when the maintenance track is 1 or 5 m away from the outer edge. When the maintenance track is 5 m away from the outer edge, the correlation coefficients at measuring points 15–21 are slightly larger, while those at points 23–26 are lower than the values under the other two working conditions. When the maintenance track is 2.5 m away from the outer edge, the added wind barrier can significantly weaken the correlation between the local aerodynamic force on the upper surface and the overall aerodynamic force. Although the correlation coefficient at measuring point 20 reaches 0.5, the vortex near this measuring point is destroyed, and therefore vortex-induced vibration cannot occur.
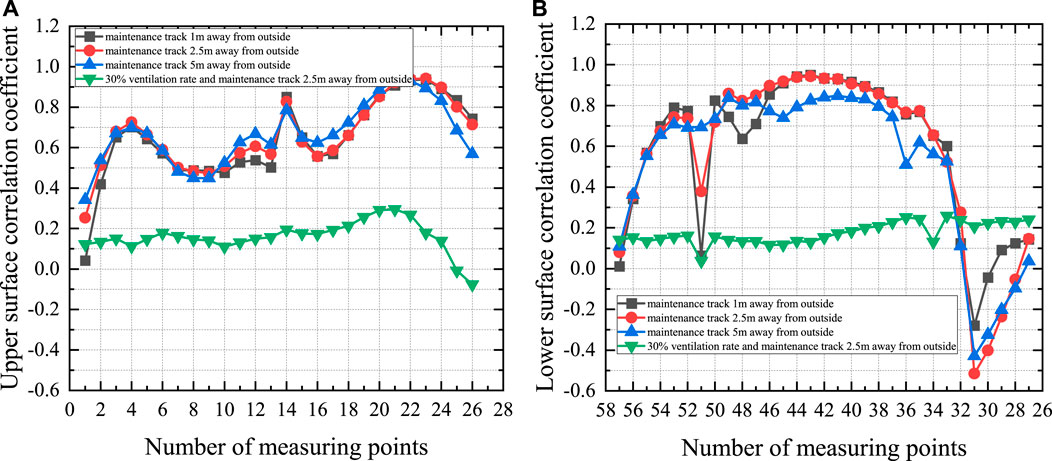
FIGURE 16. Correlation coefficient comparison under different working conditions: (A) Upper surface, (B) Lower surface.
The correlation between the local aerodynamic force on the lower surface and the overall force is also degraded to a large extent when the maintenance track is 2.5 m away from the outer edge and a wind barrier is installed. The inward movement of the maintenance track can only cause a minor change in the correlation coefficient, but the local aerodynamic force on the lower surface still has a strong correlation with the overall aerodynamic force. The reason may be that the VIV has not completely disappeared.
The contribution of local aerodynamic force to vortex-induced force is expressed by the contribution coefficient, which is calculated as follows:
Where
Figure 17 shows the spatial distribution of contribution coefficients of the local aerodynamic force on the upper and lower surfaces under different working conditions. For the working conditions of only moving the maintenance track position, the changes in the contribution values of the upper and lower surfaces are basically consistent. On the upper surface, the contribution value gradually increases from the leading edge and then decreases. After the flow development in the central region, the contribution increases again downstream, and its amplitude far exceeds the peak that appears at the front area. On the lower surface, the contribution value gradually increases along the bridge’s bottom surface. Until the downstream corner, the contribution value sharply decreases and a negative value appears, indicating that the downstream lower web area has a restraining effect on the VIV of the main girder. The variation in contribution values between the upper and lower surfaces indicates that the main vortex causing VIV is formed at the rear area of the upper surface and the middle-rear area of the lower surface. When the maintenance track positions 1 m away from the outer edge, the contribution coefficient of the local aerodynamic force on the upper surface exhibits two peaks at the front and rear areas where the strongest wind pressure fluctuations occur, as shown in Figure 17A. With the inward movement of the maintenance track, the contribution of the local aerodynamic force on the upper surface to the vortex-induced force gradually diminishes, weakening the VIV of the main girder. When the maintenance track is 2.5 m away from the outer edge, the wind barrier inhibits the generation of the vortex on the upper surface, so the contribution of the local aerodynamic force on the upper surface is very small. The contribution coefficients in most areas on the lower surface also decrease significantly with the inward movement of the maintenance track, and the impact of wind barrier installation on the lower surface is similar to that on the upper surface, as shown in Figure 17B.
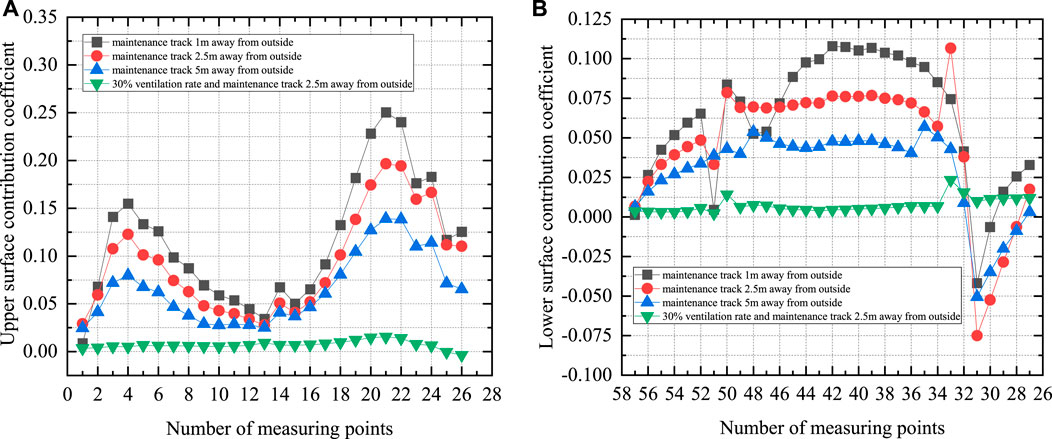
FIGURE 17. Comparison of contribution coefficients under different working conditions: (A) Upper surface, (B) Lower surface.
(1) When the maintenance track is 1 m away from the outer edge, the box girder has intense vertical VIV in two wind speed ranges (6.41–8.13 m/s and 11.77–17.47 m/s). The maximum amplitude is 0.457 m, which is far beyond the allowable value (0.156 m). Large pressure fluctuations occurred in the front and rear of the upper surface of the girder, and there is a strong correlation between the local aerodynamic force and the overall aerodynamic force in these areas, leading to significant VIV of the girder.
(2) After relocating the maintenance track, the VIV of the girder is significantly reduced in the two locking ranges. A longer distance between the maintenance track and the outer edge of the bottom plate contributes to a less intense vertical response. When the maintenance track is 5 m away from the outer edge, the maximum amplitude of VIV decreases to 0.205 m, about 1.32 times the specified value. Through the analysis of surface pressure, it is found that the inward movement of the maintenance track gradually mitigates the pressure fluctuations at the front and rear of the upper surface and the middle and rear areas of the lower surface. The contribution of the area with violent pressure fluctuation to the vortex-induced force of the girder is reduced, and therefore the amplitude of VIV is effectively decreased.
(3) By analyzing the amplitude spectra of vortex-induced force corresponding to different maintenance vehicle positions, it is found that the vortex-induced force has second harmonics, and the non-linearity of vortex-induced force has no positive correlation with the amplitude of VIV.
(4) When the maintenance track is 2.5 m away from the outer edge, severe VIV is controlled by installing a 3.5 m high wind barrier with a 30% ventilation rate. After analyzing the spatial distribution characteristics of aerodynamic force, it is found that the wind barrier can destroy the correlation of the local aerodynamic force on the upper and lower surfaces of the main girder with the overall aerodynamic force. The pressure fluctuations at the front and rear of the upper surface completely disappear, resulting in a very low contribution of local aerodynamic force in these areas to the vortex-induced force.
The original contributions presented in the study are included in the article/Supplementary Material, further inquiries can be directed to the corresponding author.
CL: Conceptualization, Funding acquisition, Methodology, Writing–review and editing, Writing–original draft. HY: Data curation, Formal Analysis, Software, Writing–original draft. MZ: Data curation, Software, Visualization, Writing–review and editing. YH: Conceptualization, Funding acquisition, Investigation, Resources, Writing–review and editing. CC: Conceptualization, Funding acquisition, Investigation, Methodology, Supervision, Writing–review and editing. LW: Methodology, Software, Writing–review and editing.
The author(s) declare financial support was received for the research, authorship, and/or publication of this article. The work was supported by the Open Fund Project of Key Laboratory of Safety Control of Bridge Engineering of the Ministry of Education of Changsha University of Science and Technology under contract No. 18ZDXK09. The authors would also like to gratefully acknowledge the support from the National Science Foundation of China (No. 51978087) and the Hunan Province Science and Technology Innovation Leading Talent Project (2021RC4031).
The authors declare that the research was conducted in the absence of any commercial or financial relationships that could be construed as a potential conflict of interest.
All claims expressed in this article are solely those of the authors and do not necessarily represent those of their affiliated organizations, or those of the publisher, the editors and the reviewers. Any product that may be evaluated in this article, or claim that may be made by its manufacturer, is not guaranteed or endorsed by the publisher.
Battista, R. C., and Pfeil, M. S. (2000). Reduction of vortex-induced oscillations of Rio–Niterói bridge by dynamic control devices. J. Wind Eng. Ind. Aerodyn. 84 (3), 273–288. doi:10.1016/S0167-6105(99)00108-7
Chen, W. L., Yang, W. H., and Li, H. (2019). Self-issuing jets for suppression of vortex-induced vibration of a single box girder. J. Fluids Struct. 86, 213–235. doi:10.1016/j.jfluidstructs.2019.02.017
China’s Ministry of Transportation (2018). Wind-resistant design specification for highway bridges. Beijing, China: China Communications Press. JTG/T3360-01-2018 (in Chinese).
Fujino, Y., and Yoshida, Y. (2002). Wind-induced vibration and control of trans-tokyo bay crossing bridge. J. Sturct Eng. 128 (8), 1012–1025. doi:10.1061/(ASCE)0733-9445(2002)128:8(1012)
Gao, D., Deng, Z., Yang, W., and Chen, W. (2021). Review of the excitation mechanism and aerodynamic flow control of vortex-induced vibration of the main girder for long-span bridges: A vortex-dynamics approach. J. Fluids Struct. 105, 103348. doi:10.1016/j.jfluidstructs.2021.103348
Ge, Y., Zhao, L., and Cao, J. (2022). Case study of vortex-induced vibration andmitigation mechanism for a long-spansuspension bridge. J. Wind Eng. Ind. Aerodyn. 220, 104866. doi:10.1016/j.jweia.2021.104866
He, X., Li, H., Wang, H., Fang, D., and Liu, M. (2017). Effects of geometrical parameters on the aerodynamic characteristics of a streamlined flat box girder. J. Wind Eng. Ind. Aerodyn. 170, 56–67. doi:10.1016/j.jweia.2017.08.009
Hu, C., Zhao, L., and Ge, Y. (2019). Mechanism of suppression of vortex-induced vibrations of a streamlined closed-box girder using additional small-scale components. J. Wind Eng. Ind. Aerodyn. 189, 314–331. doi:10.1016/j.jweia.2019.04.015
Hu, C., Zhao, L., and Ge, Y. (2018). Time-frequency evolutionary characteristics of aerodynamic forces around a streamlined closed-box girder during vortex-induced vibration. J. Wind Eng. Ind. Aerodyn. 182, 330–343. doi:10.1016/j.jweia.2018.09.025
Larsen, A. (2008). “Aerodynamic stability and vortex shedding excitation of suspension bridges,” in Proceedings of the 4th international conference on advances in wind and structrues(AWAS) (Jeju, Korea).
Li, H., Laima, S., Zhang, Q., Li, N., and Liu, Z. (2014). Field monitoring and validation of vortex-induced vibrations of a long-span suspension bridge. J. Wind Eng. Ind. Aerodyn. 124, 54–67. doi:10.1016/j.jweia.2013.11.006
Li, M., Sun, Y., Jing, H., and Li, M. (2018a). Vortex-induced vibration optimization of a wide streamline box girder by wind tunnel test. KSCE J. Civ. Eng. 22 (12), 5143–5153. doi:10.1007/s12205-018-0548-y
Li, Y. L., Chen, X. Y., Yu, C. J., Togbenou, K., Wang, B., and Zhu, L. D. (2018b). Effects of wind fairing angle on aerodynamic characteristics and dynamic responses of a streamlined trapezoidal box girder. J. Wind Eng. Ind. Aerodyn. 177, 69–78. doi:10.1016/j.jweia.2018.04.006
Liu, L., Zhou, Y., He, X., Yang, J., Wang, Z., and Guo, D. (2022). Experimental investigation on vortex-induced vibration of a long-spanrail-cum-road bridge with twin separated parallel decks. J. Wind Eng. Ind. Aerodyn. 228, 105086. doi:10.1016/j.jweia.2022.105086
Montoya, M. C., Nieto, F., Hernández, S., Kusano, I., Alvarez, A. J., and Jurado, J. A. (2018). CFD-based aeroelastic characterization of streamlined bridge deck cross-sections subject to shape modifications using surrogate models. J. Wind Eng. Ind. Aerodyn. 177, 405–428. doi:10.1016/j.jweia.2018.01.014
Nagao, F., Utsunomiya, H., Yoshioka, E., Ikeuchi, A., and Kobayashi, H. (1997). Effects of handrails on separated shear flow and vortex-induced oscillation. J. Wind Eng. Ind. Aerodyn. 69-71, 819–827. doi:10.1016/S0167-6105(97)00208-0
Nguyen, D. T., Hargreaves, D. M., and Owen, J. S. (2018). Vortex-induced vibration of a 5:1 rectangular cylinder: A comparison of wind tunnel sectional model tests and computational simulations. J. Wind Eng. Ind. Aerodyn. 175, 1–16. doi:10.1016/j.jweia.2018.01.029
Wang, D. (2013). Geometrical optimization of the closed boxgirders based on aerodynamic performance. Master degree. Tongji University.
Xu, F., Ma, Z., Zeng, H., Zhang, M., Wang, X., Wang, M., et al. (2020b). A new method for studying wind engineering of bridges: large-scale aeroelastic model test in natural wind. J. Wind Eng. Ind. Aerodyn. 202, 104234. doi:10.1016/j.jweia.2020.104234
Xu, F., Ying, X., Li, Y., and Zhang, M. (2016). Experimental explorations of the torsional vortex-induced vibrations of a bridge deck. J. Bridge Eng. 21, 04016093. doi:10.1061/(ASCE)BE.1943-5592.0000941
Xu, K., Ge, Y., and Zhao, L. (2020a). Quantitative evaluation of empirical models of vortex-induced vibration of bridge decks through sectional model wind tunnel testing. Eng. Struct. 219, 110860. doi:10.1016/j.engstruct.2020.110860
Xu, S., Fang, G., Øiseth, O., Zhao, L., and Ge, Y. (2023). Experimental study on distributed aerodynamic forces of parallel box girders with various slot width ratios and aerodynamic countermeasures during vortex-induced vibration. J. Wind Eng. Ind. Aerodyn. 240, 105493. doi:10.1016/j.jweia.2023.105493
Zhang, Z., Xu, F., Wang, X., and Wang, Y. (2022). Instability modes of the flows around a streamlined box girder. J. Wind Eng. Ind. Aerodyn. 225, 105008. doi:10.1016/j.jweia.2022.105008
Zhao, L., Cui, W., Shen, X., Xu, S., Ding, Y., and Ge, Y. (2022). A fast on-site measure-analyze-suppress response to control vortex-induced-vibration of a long-span bridge. Structures 35, 192–201. doi:10.1016/j.istruc.2021.10.017
Keywords: maintenance track, vortex-induced vibration performance, steel box girder, wind tunnel test, mechanism analysis
Citation: Li C, Yan H, Zou M, Han Y, Cai CS and Wang L (2023) Experimental study on the influence of maintenance track position on vortex-induced vibration performance of a box girder suspension bridge. Front. Built Environ. 9:1264996. doi: 10.3389/fbuil.2023.1264996
Received: 21 July 2023; Accepted: 21 September 2023;
Published: 03 October 2023.
Edited by:
Xiguang Liu, Xi’an University of Architecture and Technology, ChinaReviewed by:
Genshen Fang, Tongji University, ChinaCopyright © 2023 Li, Yan, Zou, Han, Cai and Wang. This is an open-access article distributed under the terms of the Creative Commons Attribution License (CC BY). The use, distribution or reproduction in other forums is permitted, provided the original author(s) and the copyright owner(s) are credited and that the original publication in this journal is cited, in accordance with accepted academic practice. No use, distribution or reproduction is permitted which does not comply with these terms.
*Correspondence: Yan Han, Y2VfaGFueWFuQDE2My5jb20=
Disclaimer: All claims expressed in this article are solely those of the authors and do not necessarily represent those of their affiliated organizations, or those of the publisher, the editors and the reviewers. Any product that may be evaluated in this article or claim that may be made by its manufacturer is not guaranteed or endorsed by the publisher.
Research integrity at Frontiers
Learn more about the work of our research integrity team to safeguard the quality of each article we publish.