 Han Yang
 Hexiang Wang2
 Boris Jeremić
- 1Tianjin University, Tianjin, China
- 2Berkshire Hathaway Specialty Insurance, San Ramon, CA, United States
- 3University of California, Davis, CA, United States
Presented is a validation study for high fidelity numerical modeling of earthquake soil structure interaction (ESSI) for a building, hotel structure in Ventura, California. A detailed finite element (FE) model of the ESSI system, featuring the 12-story concrete structure, pile group foundation, and underlying soil, is developed using the Real-ESSI Simulator (Jeremić et al., The Real-ESSI Simulator System 1988–2022, 2022a). The domain reduction method (DRM) (Bielak et al., Bulletin of the Seismological Society of America, 2003, 93(2), 817–824; Yoshimura et al., Bulletin of the Seismological Society of America, 2003, 93(2), 825–841) is used to apply seismic loads, in this case the 1994 Northridge earthquake motions. Direct comparison between simulation results and California Strong Motion Instrumentation Program (CSMIP) recordings shows a high level of agreement in acceleration and displacement responses at all instrumented locations. Sensitivity study on a number of modeling choices and analysis parameters is conducted to investigate controlling factors for the ESSI response. For example, the soil-structure interaction effect and structural damping ratios are shown to have significant influence on system dynamic response. In addition, the soil inelasticity is shown to be highly influenced by the magnitude of seismic motion. Both effects are important for validation as they contribute to sensitivity of response to parametric variability.
Introduction
High-performance, high-fidelity numerical analysis has become an essential part in studies of seismic behavior of soil, structure, and their interaction (Roh and Reinhorn, 2010; Reza Tabatabaiefar et al., 2013; Lu et al., 2015; O’Reilly and Calvi, 2019; Salami et al., 2019; Wu et al., 2021; Zhang and Taciroglu, 2021). Finite element method (FEM) has been shown to be effective for analysis of earthquake soil structure interaction (ESSI) problems (Jeremić and Preisig, 2005; Jeremić et al., 2010; Jeremić et al., 2009; Jeremić et al., 2013; Lou et al., 2011; Torabi and Rayhani, 2014; Bybordiani and Arici, 2019; Løkke and Chopra, 2019; Lizundia et al., 2020). New material models, finite elements, load application techniques, and numerical analysis methods are being developed to study complex material and system behavior with high sophistication. For new, sophisticated models and sophisticated analysis, quality assurance is important. Quality assurance is usually comprised of verification and validation of the analysis program. Verification is defined (Roache, 1998; Oberkampf et al., 2002; Roy and Oberkampf, 2011) as the process of determining that a model implementation accurately represents the developer’s conceptual description and specification. It is essentially a mathematics issue and it provides evidence that the model is solved correctly. On the other hand, validation is the process of determining the degree to which a model is accurate representation of the real world from the perspective of the intended uses of the model. It is essentially a physics issue and it provides evidence that the correct model is solved.
Verification has to be developed in great detail, for all components of the analysis program that is used. Verification relies on high accuracy solutions Oberkampf and Trucano (2007) to documenting finite element discretization error.
Validation tests should be performed on model that captures all important aspects of the target soil-structure. However, full-scale testing of building soil-structure system are too expensive and time-consuming to perform. Therefore, various reduced-scale testing methods were developed, and continuously being improved, for validation of soil, structure, and ESSI problems. Reduced scale models are useful as they provide means to investigate specific issues, discover new physics and/or validate already existing models of soil-structure systems and components.
For example, shake table and centrifuge testing is used to validate numerical analysis of soil-structure. Torabi and Rayhani (2014) investigated dynamic soil structure interaction in soft soil by performing finite element (FE) simulations that were validated by centrifuge test results. Lu et al. (2015) modeled earthquake-induced collapse process of a reinforced concrete frame-core structure and validated numerical results using shake table test with a reduced-scale model. Wu et al. (2021) used scaled models on a shake table of embedded metro station in soft soil to evaluate numerical modeling.
Full scale validation studies offer the most useful validation data, as issues with scaling of various mechanical phenomena do not need to be addressed Wood (2004).
However, complexity and cost of full scale testing pose serious problem and therefor numbers of full-scale validation studies, for soil-structure systems, are very small. Few examples of large scale, full scale tests of structures and soil-structure systems are noted below. Ji et al. (2011) conducted a series of full-scale tests on the E-Defense shaking table facilities in Japan to simulate various levels of realistic seismic damage for a high-rise steel building. Goggins and Salawdeh (2013) performed full-scale shake table tests in order to validate the nonlinear time history analysis models for single-story concentrically braced frames. Marques and Lourenço (2014) tested two full-scale masonry buildings under quasi-static lateral loading as validation of the macro-element modeling approach. Roohi et al. (2019) validated a methodology to reconstruct nonlinear seismic response of wood-frame buildings using seismic response measurements from full-scale tests conducted at the E-Defense facility in Japan. The aforementioned experiments were performed at some of the world’s largest structural testing facilities. It is noted that even tests at these large facilities are limited to testing low-rise, relatively light buildings, with possibly small amount of soil beneath foundation, or no soil at all.
An alternative approach to validation is to use data obtained from existing, full scale, structures that are instrumented with earthquake monitoring devices, and that have experienced earthquakes. This approach makes it possible to perform direct validation of seismic behavior of large, complex, high-rise structures. For example, Michel et al. (2010) performed FE analysis on the Grenoble City Hall building and validated numerical results using seismic recordings from the 2005 Vallorcine earthquake. With the increase in data availability, more validation studies using recorded data from existing structures are expected.
This paper presents a validations study, numerical modeling of seismic behavior of a 12-story building in Ventura, California. The 12-story building in Ventura is a station of the California Strong Motion Instrumentation Program (CSMIP), and consequentially the building is well instrumented with motion sensors at various floors and locations. A finite element (FE) model of the building was developed using the original structural design drawings that were provided by Bret Lizundia (2021). Two layers of underlying soil are included in the model. Properties of those layers are based on the soil profile established at the construction site. The 1994 Northridge earthquake motion, that was felt and measured at the building location, is applied to the model. Detailed modeling and simulation approaches using the Real-ESSI Simulator (Jeremić et al., 2022a) are presented in this paper. In addition, detailed model input files, for the Real-ESSI Simulator, used in this study, are provide on the Real-ESSI web site http://real-essi.us/.
It is noted that the main goal of the analysis earthquake soil structure interaction (ESSI) for Ventura Hotel building model is to demonstrate the validity of modeling and simulation technique that are then used for design and assessment. To achieve this goal, direct comparisons of response quantities, acceleration and displacement histories, between numerical simulation and CSMIP records are presented and discussed. This approach represents validation of the modeling (Roache, 1998; Babuška and Oden, 2004; Oberkampf and Roy, 2010; Roy and Oberkampf, 2011). Note that all modeling parameters, model geometries, material properties, seismic loads, etc., were determined, calibrated from available design drawings and site characterization before numerical results are compared to records. In other words, no calibration or adjustment of material properties or simulation parameters was made to make the numerical results “fit better” with recorded structural responses. This is particularly important for the validation of numerical modeling method used for full-scale, realistic structures and ESSI systems. In addition, sensitivity of analysis results to variation of common modeling parameters, for example variation in damping, is presented as well.
Numerical model development
Modeling and simulation presented in this paper was performed using the Real-ESSI Simulator system (Jeremić et al., 2022a). Full model input files used in this study are available on the Real-ESSI web site http://real-essi.us/.
Figure 1 shows the FE model of the whole ESSI system, featuring the 12-story structure, pile foundations, and two layers of underlying soil. Details of each component of the model are discussed in the following sections. The model has a total of 88516 elements (solids, shells, beams, interfaces) and 260103 degrees of freedom. Model is too large to fit on a single CPU, hence analysis is performed using parallel version of the Real-ESSI, on local, UCD parallel computer/cluster and also on Amazon Web Services (AWS) super computers running linux operating systems.
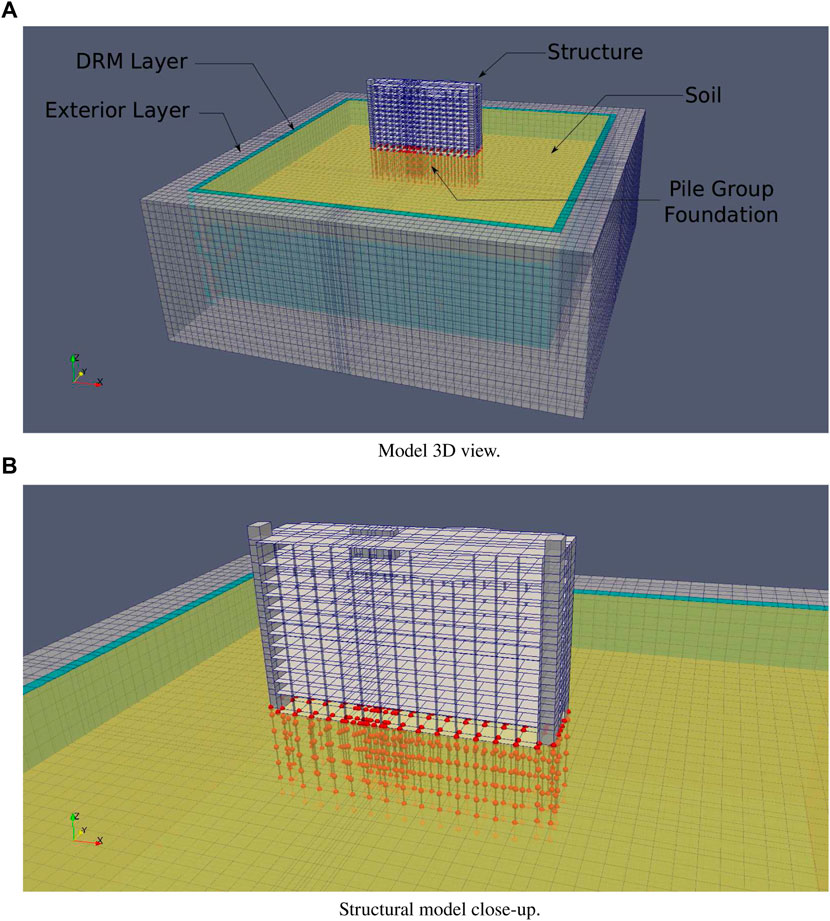
FIGURE 1. Finite element model of the 12-story structure used in this study. (A) Model 3D view. (B) Structural model close-up.
Structure and foundation modeling
Building description
Plan view of the building, as shown in Figure 2, has a near rectangular shape of 58.85 m (193 ft) by 51.00 m (167 ft 4 in) with its long side in the north-south direction.
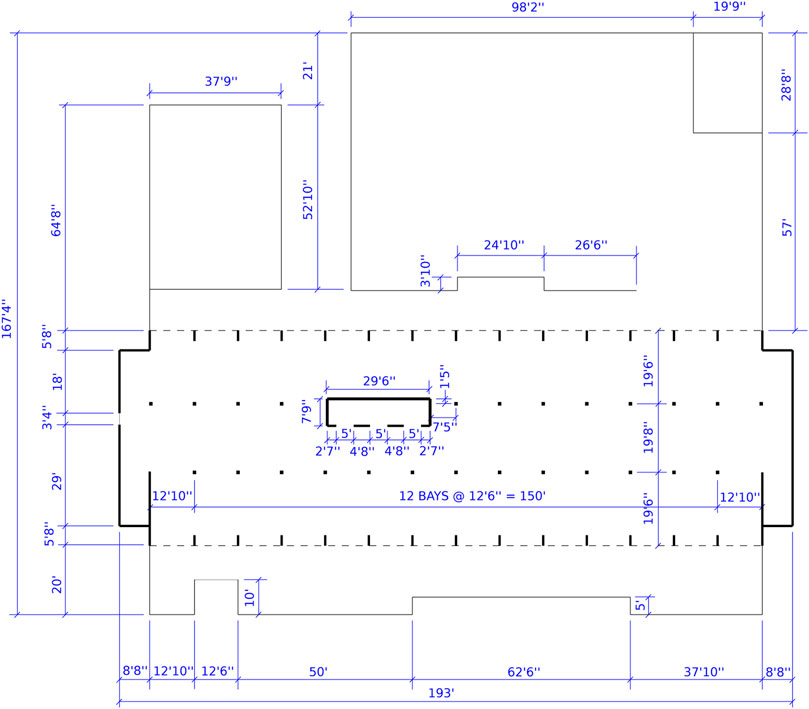
FIGURE 2. Plan view of ground floor of the structure, based on the original project design drawings (Bret Lizundia, 2021). The original document is in US customary units, 1’ = 1 ft = 0.3048 m, 1” = 1 in = 0.0254 m.
As indicated in Figure 1, the positive X direction for the FE model aligns with the north direction. Total height of the structure is 36.68 m (120 ft). The structure consists of reinforced concrete columns, floor slabs, and concrete shear walls. Load-bearing shear walls are located in the middle, forming elevator shaft, and on the north and south sides, encompassing stairwells. Distribution, location of columns and shear walls are repeating from the second to the 11th floor. Structural design changes for the 12th floor, as it serves as a restaurant with large open space.
Locations of accelerometers in the structure are shown in Figure 3. A total of 15 signal channels are installed at various elevations and in different directions. The data collected during past seismic events are used to directly validate the modeling and simulation results.
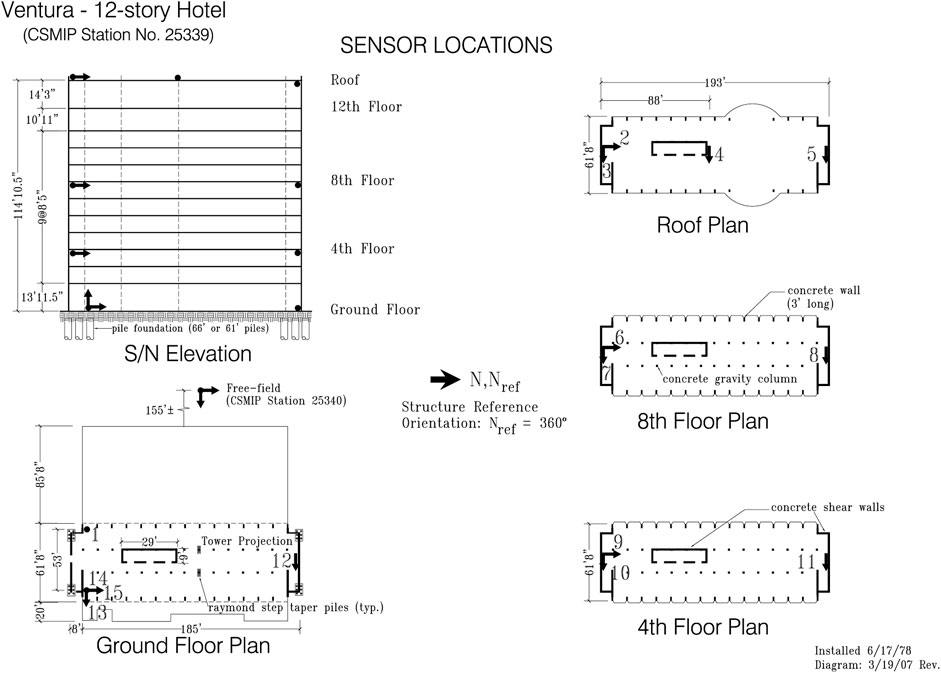
FIGURE 3. Locations of accelerometers in the 12-story hotel structure, based on the original project design drawings (Bret Lizundia, 2021). The original document is in US customary units, 1’ = 1 ft = 0.3048 m, 1” = 1 in = 0.0254 m.
There are various piles and pile group foundations beneath the load-bearing shear walls and columns. Each pile group has 2, 4, or 6 piles with a cap connected at the top. Typical reinforced concrete Raymond step-tapered piles with a maximum diameter of 36.51 cm (14.375 in) and minimum diameter of 24.13 cm (9.5 in) are used. Depending on their locations, the piles are 18.59 m (61 ft) to 20.12 m (66 ft) deep. Each pile group is modeled as one beam-column element with the cross section area and moment of inertia calculated from the original design. It is also assumed that seismic motions, a that are of a moderate magnitude, will not cause significant slippage between piles and soil. Thus the nodes for pile elements and soil elements are bonded together. For analyzing ESSI behavior of this structure excited by more significant earthquakes, interface elements would be placed in the pile-soil interface zone.
FEM model of the structure and foundation
The 4NodeShell_ANDES element, from the Real-ESSI Simulator (Jeremić et al., 2022a), is used for the floors, roofs, shear walls, elevator walls, and restaurant balcony of the numerical model. The average floor thickness is 15.24 cm (6 in). The thicknesses of perimeter shear wall, inside shear wall, elevator wall are 20.32 cm (8 in), 20.32 cm (8 in), 25.40 cm (10 in), respectively. The beam_elastic element is used for the perimeter and inside columns. The perimeter columns are 60.96 cm (2 ft) by 30.48 cm (1 ft). And the inside columns are 30.48 cm (1 ft) by 30.48 cm (1 ft). An average elastic modulus of 30.34 GPa (4,400 ksi) and mass density of 2,323 kg/m3 (145 pcf) are used for the concrete members.
The single-story east annex and west annex are light in weight compared to the main 12-story structure. Also, the annexes are structurally disconnected from the main structure. As a result, the annexes have little influence on the structural response of the ESSI system, thus are neglected in the numerical model.
Additional mass from non-structural components, including rooftop equipment, floor carpets, soffits, ceilings, and cladding, are considered and added to the structure model. The total imposed surface load, in addition to the self-weight from structural components, at the roof level is estimated to be 957.6 Pa (20 psf). The total imposed surface load at each floor is 814.0 Pa (17 psf). Taking into account of the exterior stucco on metal studs with gypsum board interiors and glazing, an average of 718.2 Pa (15 psf) additional surface loading is added to the perimeter walls. Note that the additional loads from non-structural members are important to the overall response of the structure model and ESSI system. It was found out that the eigen-frequencies of the structural model changed significantly when these additional dead weights/loads are added.
Eigenvalue analysis
Eigen-analysis was performed for the above-ground structural part of the ESSI model. The first ten eigen-periods (natural periods) and eigen-frequencies (natural frequencies) are shown in Table 1.
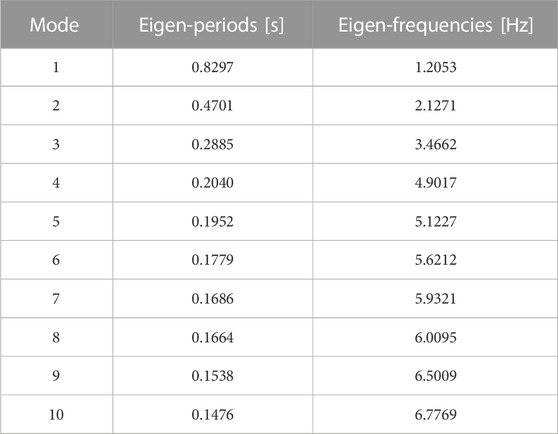
TABLE 1. Eigen analysis results for the 12-story hotel structure.
Since the main frequency contents of the input seismic motion are below 4.5 Hz, it is expected that the first three eigen-modes will be excited and will control the overall dynamic behavior of the ESSI model.
The first five eigen-modes, visualized as deformed shape of the ESSI model, are shown in Figure 4. The first two eigen-modes are represented by bending in two horizontal directions. The third eigen-mode is twisting, torsion around the vertical axes. The fourth and fifth eigen-modes are represented by higher mode bending in two horizontal directions.
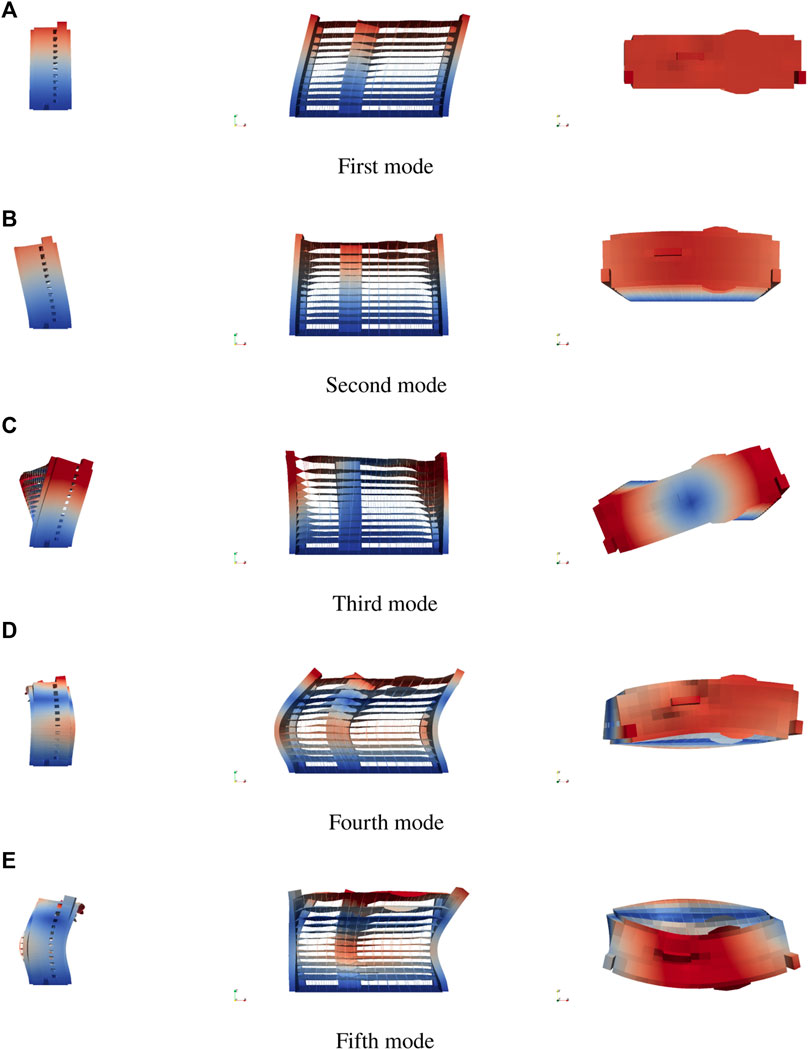
FIGURE 4. First five eigen-modes of the 12-story structure model. (A) First mode. (B) Second mode. (C) Third mode. (D) Fourth mode. (E) Fifth mode.
Soil modeling
Soil profile at the site of the 12-story hotel was available (Bret Lizundia, 2021) and used for developing ESSI finite element model. Figure 5 shows the soil types, properties, and estimated shear wave velocities at the site.

FIGURE 5. Soil profile at the site of the 12-story hotel, based on the original project documents (Bret Lizundia, 2021). The original document is in US customary units, 1 ft = 0.3048 m, 1 pcf = 16.02 kg/m3, 1 psf = 47.88 Pa.
Based on the soil profile, two layers of soil elements with different material properties are modeled. The top soil layer has a thickness of 15.24 m (50 ft), and has a shear wave velocity of 243.84 m/s (800 ft/s). The bottom soil layer starts at the depth of 15.24 m (50 ft) and extends to the bottom of the ESSI model, to depth of 24.38 m (80 ft). Deeper soil layer has a larger shear wave velocity of Vs = 426.72 m/s (1400 ft/s). An averaged unit weight of γ = 1922.4 kg/m3 (120 pcf), is used for both soil layers.
Using the shear wave velocity and mass density, the elastic properties of the soil layers are calculated and shown in Table 2.For the benchmark case, the soil layers are modeled as elastic materials. In a later section of this paper, this assumption is further examined by using elastoplastic material models for soil and comparing simulation results with the benchmark case.
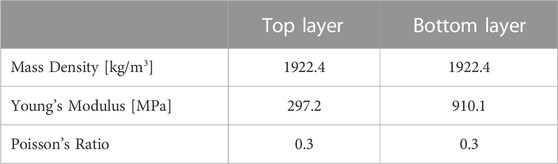
TABLE 2. Elastic soil material parameters for Ventura site.
The horizontal dimensions of the soil domain are 243.84 m (800 ft) in both directions. The size of the soil domain is 4 times that of the structure in the X direction and 13.3 times that of the structure in the Y direction. The size of the soil domain is chosen to be large enough so that the outgoing waves from structural vibration can be properly absorbed by the boundary layers without significant reflection back into the soil domain. This point will be further explained in the next section where seismic motion is discussed.
The 8NodeBrick solid element, from the Real-ESSI Simulator (Jeremić et al., 2022a), is used for the soil layers. Average edge length of the solid elements is around 3 m (10 ft). Smaller sized elements are used at various locations to accommodate building geometry. The chosen element size is sufficiently small to model the seismic wave propagation in the soil layers in this case.
Seismic motion
Seismic motion is applied to the ESSI model using a combination of surface motion deconvolution and domain reduction method (DRM) (Bielak et al., 2003; Yoshimura et al., 2003). Displacement and acceleration records at ground surface are deconvoluted to generate the input seismic motion field. The effective DRM forces are then developed from such seismic motion field, and applied to the DRM layer nodes, shown in Figure 1. The aforementioned operations are implemented in the Real-ESSI Simulator, whereby a defined surface motions can be automatically deconvoluted to certain depth, and the effective DRM forces created and applied to the ESSI model.
It is also noted that the Real-ESSI Simulator can input any user supplied signal, at any angle as a plane wave, using the DRM. In this study, a measured free field motions were used to develop a one dimensional, one component seismic motions.
Record of the 1994 Northridge earthquake at CSMIP Station No. 25340, that is very close to the Ventura hotel site, is selected as the input motion in this study. The main shaking lasts approximately 15 s, however, seismic motion recorded at the location last much longer. The magnitude of shaking is moderate, with a peak ground acceleration (PGA) of 0.06 g. Transforming the motion time series to frequency domain reveals that the main frequency contents are below 4.5 Hz. Information about frequency content is useful in determining damping parameters, as discussed in the next section.
In order to verify the generated input seismic motion, a free field model, without a structure, is made and analyzed. Ideally, the simulation results at ground surface should match the given records. Figure 6 shows the comparison between Real-ESSI free field simulation and CSMIP records in X direction.
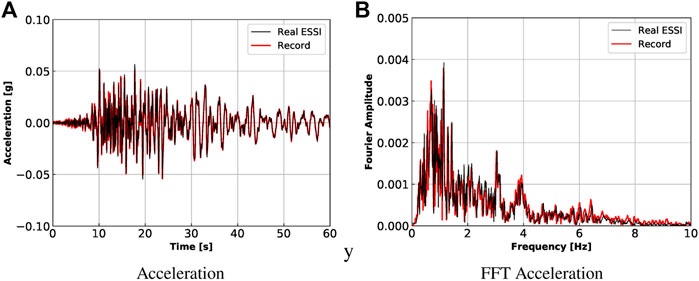
FIGURE 6. Comparison between Real-ESSI free field simulation and CSMIP records for Ventura site under the 1994 Northridge earthquake. (A) Acceleration. (B) FFT Acceleration.
It is noted that Real-ESSI free field results match well with records in both time domain and frequency domain. Thus, the generated input motion is validated and will be used with confidence in later simulations of the complete ESSI model.
Rayleigh damping
Rayleigh damping is used to simulate energy dissipation due to viscous coupling between solids and fluids. As pointed out by Hall (2006) and Yang et al. (2019), classic Rayleigh damping must be used with appropriate damping coefficients, that should provide a near-constant value of damping for all natural modes with frequencies that are of interest. For the natural modes outside the prescribed frequency range, the damping ratios can be higher.
For linear viscous damping of the Rayleigh type, the damping matrix is expressed as
where Cij is the damping matrix, Mij is the mass matrix, Kij is the stiffness matrix, aM and aK are damping constants with units of s−1 and s, respectively.
Rayleigh damping ratio is calculated based on Section 4.2.7 of the “Guidelines for Performance-Based Seismic Design of Tall Buildings” (Baker et al., 2017). In this study, the damping coefficients are chosen as aM = 0.5, aK = 0.003 for soil (5% damping ratio) and aM = 0.3, aK = 0.0018 for structure (3% damping ratio). Figure 7 shows damping ratio vs. frequency for the soil and structural elements in this model.
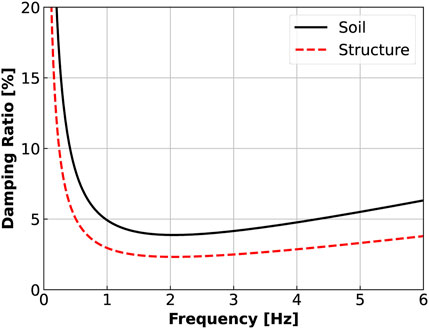
FIGURE 7. Damping ratio vs. frequency for soil and structural elements.
It can be seen that the damping ratios between 1 Hz and 5 Hz are close to 5% for soil and 3% for structure. According to Figure 6, the main frequency contents of the input seismic motion are below 4.5 Hz. Therefore, the chosen Rayleigh damping coefficients can reasonably model the viscous damping in the ESSI model.
Model and components verification
It is important to develop verification of the model and model components. Components of the model, finite elements used, constitutive and finite element level algorithms were verified prior to presented work, as reported by Jeremić et al. (2022b), part 300, and by Feng et al. (2019). General finite element program verification, as presented above, is applicable to every and all components of the program (Roache, 1998; Oberkampf et al., 2002; Oberkampf, 2003; Babuska et al., 2004; Babuška and Oden, 2004; Oberkampf and Roy, 2010; Roy and Oberkampf, 2011). On the other hand, finite element model verification is specific to the finite element model that is used for particular analysis. In that sense, all the components, substructures and structures of the actual finite element model, that were not verified during general finite element program verification, need to be verified.
Earthquake soil structure interaction response
Ventura Hotel building is well-instrumented with seismometers (CSMIP Station No. 25339). This section presents the comparison of actual records during the 1994 Northridge earthquake and corresponding Real-ESSI simulation results. For direct comparison, all acceleration plots are set to the same scale.
Dynamic responses of the full ESSI model excited by the Northridge earthquake at each instrumented location are shown in Figure 8 for acceleration in X direction, Figure 9 for acceleration in Y direction, Figure 10 for displacement in X direction, and Figure 11 for displacement in Y direction. Fast Fourier transform (FFT) is performed to investigate dynamic response of the structure in frequency domain. The channel number of each plot corresponds to that noted in Figure 3. For example, “CHAN15” in Figure 8 refers to the channel located on the south side of ground floor, in X direction.
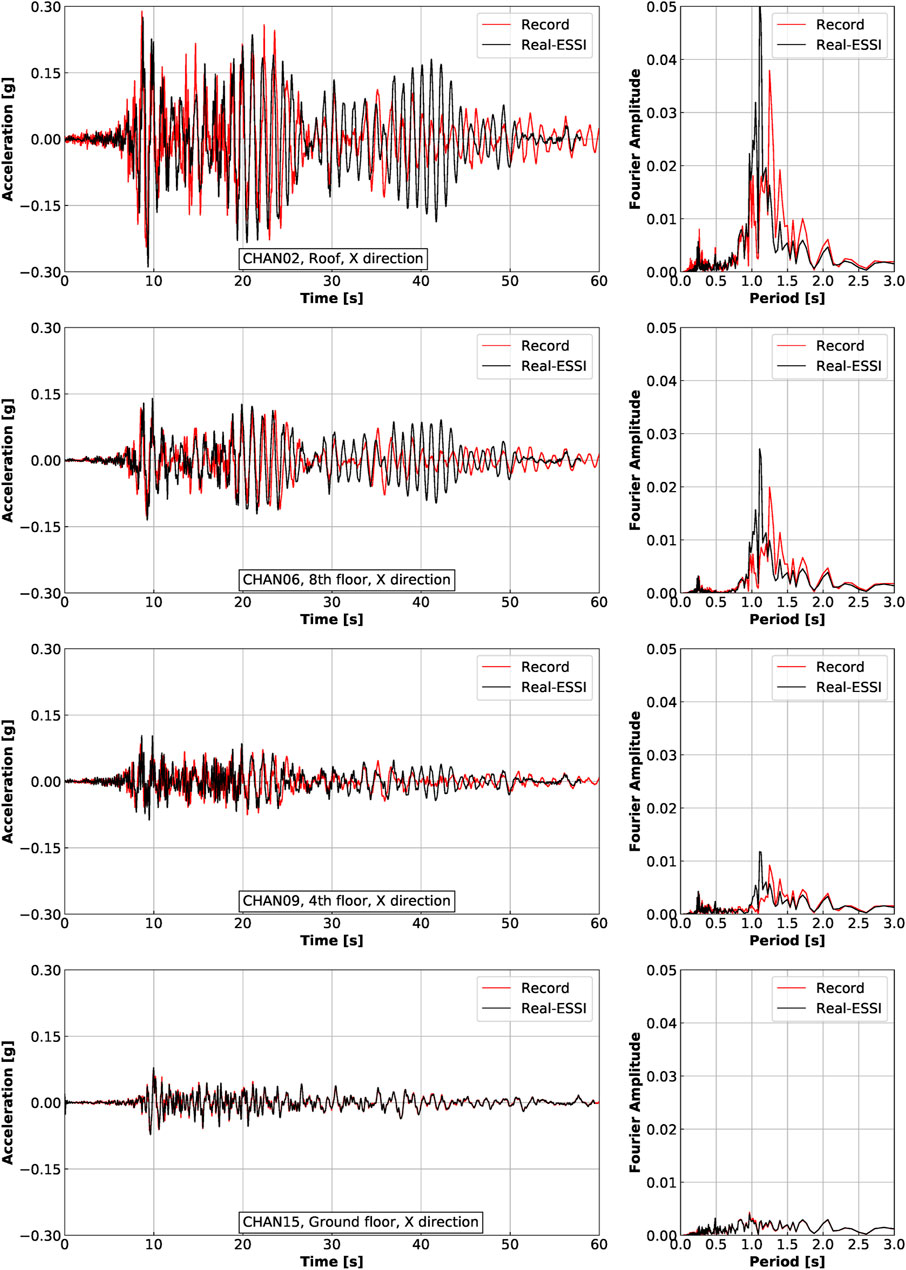
FIGURE 8. Acceleration responses in X direction of Ventura Hotel building excited by the Northridge earthquake.
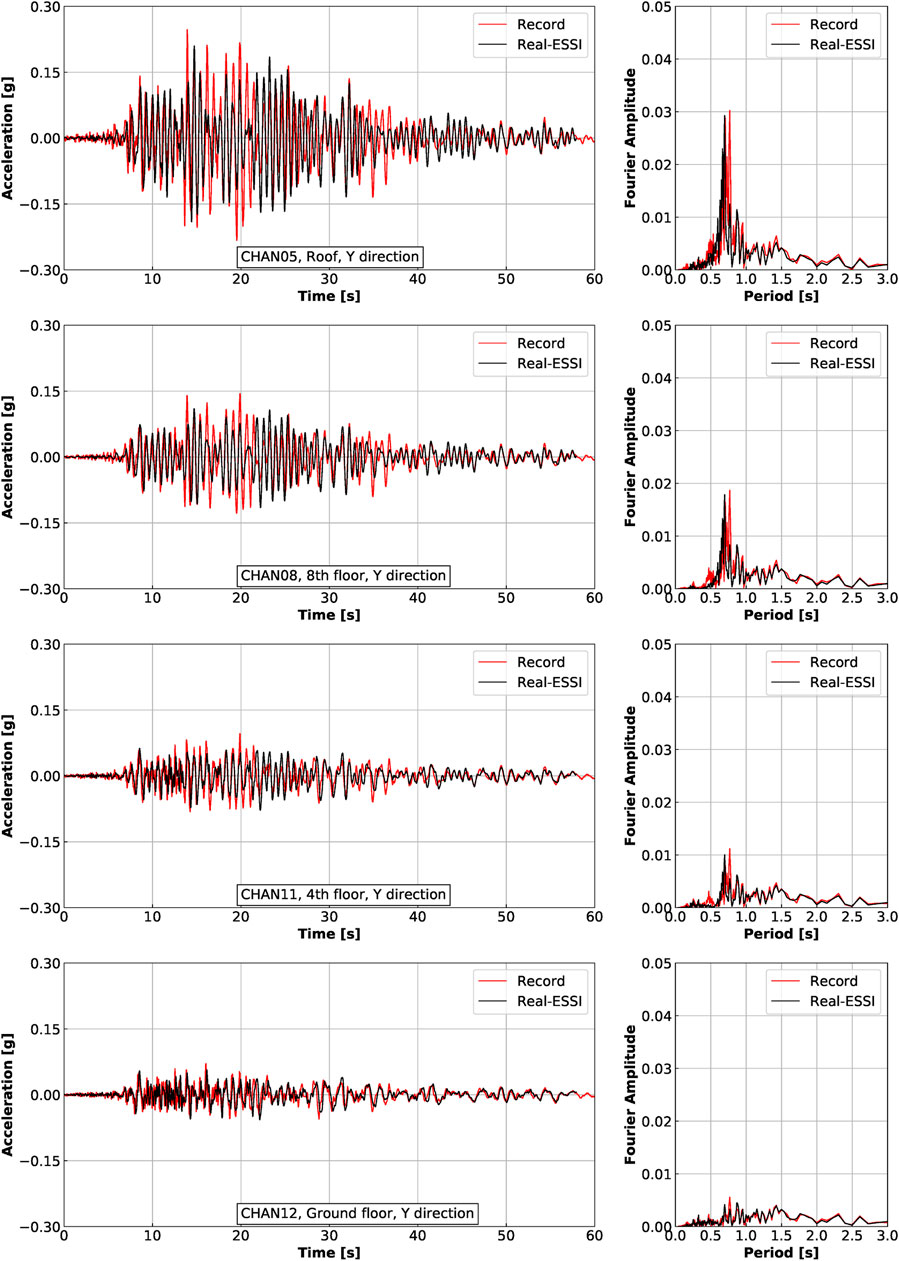
FIGURE 9. Acceleration responses in Y direction of Ventura Hotel building excited by the Northridge earthquake.

FIGURE 10. Displacement responses in X direction of Ventura Hotel building excited by the Northridge earthquake.

FIGURE 11. Displacement responses in Y direction of Ventura Hotel building excited by the Northridge earthquake.
According to Figures 8–11, the dynamic responses of the ESSI model match fairly well with the recorded responses in both directions and at all elevations. As one of the main purposes of developed simulations was to validate the modeling and simulation of the Ventura Hotel building, presented results show strong evidence that the ESSI modeling and simulation methodology, as implemented and available within the Real-ESSI Simulator, can be successfully used for analysis of detailed, large-scale, practical engineering problems.
It is noted that few minor discrepancies between simulation results and records do exist, and are commented upon below. According to the acceleration time history plots, shown in Figure 8 between times of 35 and 45 s, numerical simulation predicts larger acceleration than what was recorded, especially at higher elevations of the building. Another observation is that the numerical result in frequency domain has a smaller dominant period and larger peak at that period. In other words, the simulated response is slightly stiffer than recorded response.
Both of the discrepancies are likely due to the use of elastic material models for soil instead of inelastic models, even with the use of viscous damping to model both viscous and slight inelastic effects. As stated earlier, the use of elastic material model is justified by the moderate magnitude of seismic motion. The yielding of soil and structure is assumed to play a minor role for this model and for this earthquake. The majority of seismic energy is dissipated through viscous, Rayleigh damping instead of material inelasticity. Since a high level of agreement between numerical simulation and records is achieved, it is safe to say that the use of elastic material model is reasonable in this case. Obviously, when the seismic motion becomes larger, material yielding will play a much more significant role and elasto-plastic material models should be used. Influence of elastic-plastic modeling on ESSI response is investigated in some more detail next section.
Sensitivity study
Simplifying modeling assumptions had to be made in developing analysis model for numerical analysis of realistic ESSI system, the Ventura Hotel building in this case. The level of sophistication that a numerical model can achieve is usually determined with taking into account the scope and timing of the engineering project. In addition, analysts expertise, as well as access to appropriate numerical modeling tool, program, that provides a range of modeling and simulation capabilities and sophistication levels, plays an important role in this decision. While choosing modeling sophistication level, and modeling simplifications that are to be made, it is important to understand the factors that control ESSI response. This is particularly true in order to make appropriate decisions about where to focus limited resource in order to control more important ESSI modeling aspects. In other words, it is important to gain good understanding of sensitivity of ESSI response to simplifying modeling assumptions. In this section, variations in a number of several modeling variables are considered in order to investigate the controlling factors in dynamic response of a realistic ESSI model.
Soil-structure interaction
It is widely accepted that earthquake-soil-structure-interaction (ESSI) effects play significant role in seismic response of a number of different structures. In order to highlight the importance of ESSI effects, a numerical model with only the above-ground structure, e.g. no soil or pile foundation, the so called non-ESSI model, is developed, analyzed, and results compared with the full ESSI model. For the structure-only model, non-ESSI model, seismic motion recorded at ground surface is directly imposed at the base of the model.
Figure 12 shows the comparison of acceleration responses at roof level between the full ESSI model, non-ESSI model, and records. It can be observed that the non-ESSI model shows unrealistically large acceleration responses. From the perspective of seismic energy propagation and dissipation, the non-ESSI model cannot model radiation damping, that takes away, dissipates a significant amount of seismic energy. In addition, the dominant period of the non-ESSI model response are much lower than those of the full ESSI model. It is obvious that the non-ESSI model does not properly simulate dynamic response of the system.
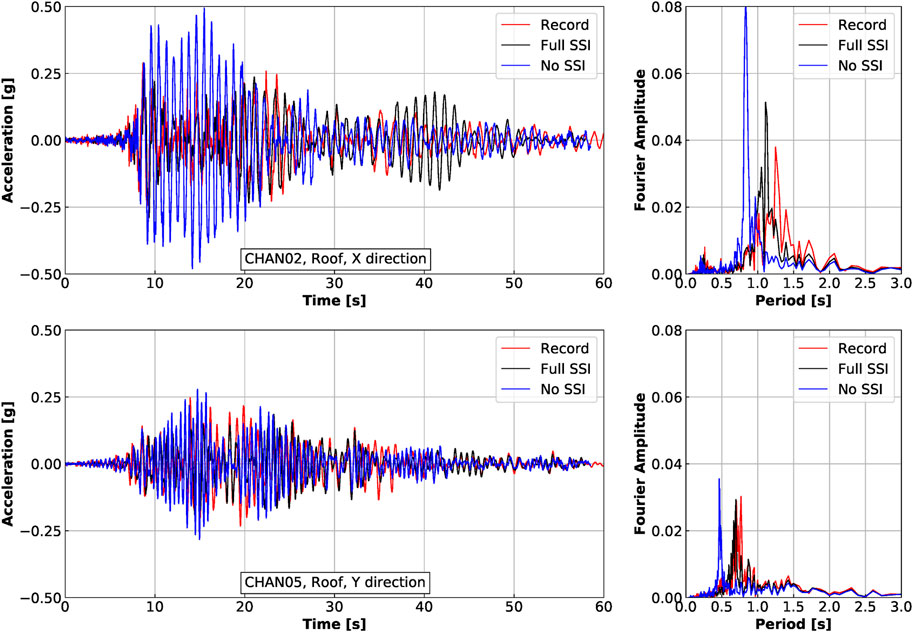
FIGURE 12. Comparison of responses of full ESSI model, non-ESSI model and records for Ventura Hotel building excited by the Northridge earthquake.
Structural damping ratio
Rayleigh damping is often used in ESSI analysis to simulate the viscous, dissipative interaction between solids, e.g. structure and soil, and fluids, e.g. air and water within and outside solids. Damping parameters need to be chosen carefully to prevent under- or over-damping. As mentioned earlier, recommendations from Baker et al. (2017) were used in choosing viscous damping parameters used in this study. In this section, the influence of structural damping ratio on the dynamic response of ESSI system is investigated.
Figure 13 shows the comparison of acceleration responses at roof level for structural damping ratios of 1%, 3%, and 5%. Clearly, damping ratio has a major influence on the dynamic response of ESSI system. Peak acceleration decrease significantly when a larger damping ratio is used. Since the model is elastic, damping ratio does not significantly change the frequency content of the response.
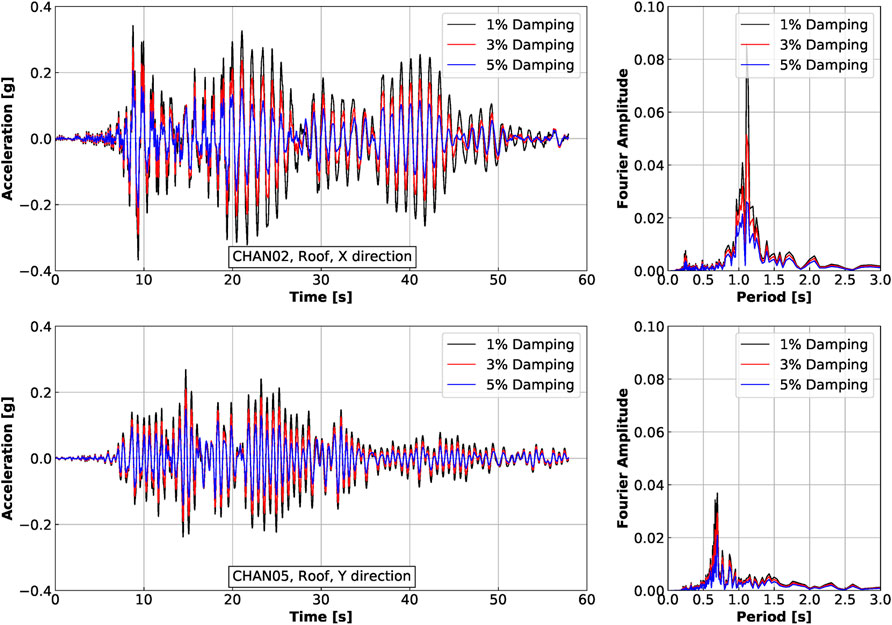
FIGURE 13. Comparison of dynamic response of Ventura Hotel building excited by the Northridge earthquake using different structural damping ratios.
Soil inelasticity
In previous simulations, linear elastic material model is used for soil. This modeling decision was made due to low magnitude of the input seismic motions that are not expected to exceed underlying soil yield limit. However, due to stress concentration around foundations, there is still the possibility of localized soil yielding. The influence of soil inelasticity on structural response is investigated in this section.
The hyperbolic Drucker-Prager plasticity model with nonlinear kinematic hardening of Armstrong-Frederick type is used for modeling soil response. This model is capable of representing the pressure-dependent, nonlinear, elastoplastic soil behavior, and is described in some detail by Jeremić et al. (2022b). The soil material model behaviors for the two layers at different depths are shown in Figure 14.
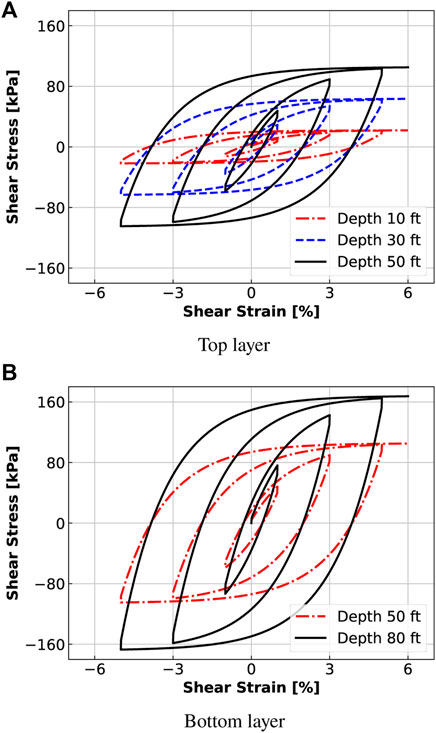
FIGURE 14. Cyclic behavior of inelastic, Drucker-Prager soil model at Ventura site. (A) Top layer. (B) Bottom layer.
The peak shear strengths match well with the field-measured soil parameters shown in Figure 5. The material model parameters, summarized in Table 3, for Real-ESSI program, are calibrated using the soil properties from the original soil profile, shown in Figure 5.

TABLE 3. Inelastic soil material parameters for Ventura site.
Using inelastic soil material model, the simulation is rerun and compared with the results from using linear elastic soil model. The comparison of dynamic responses between elastic and inelastic soil models at each instrumented location are shown in Figure 15 for acceleration in X direction, Figure 16 for acceleration in Y direction, Figure 17 for displacement in X direction, and Figure 18 for displacement in Y direction.

FIGURE 15. Acceleration response in X direction for Ventura Hotel building excited by the Northridge earthquake.
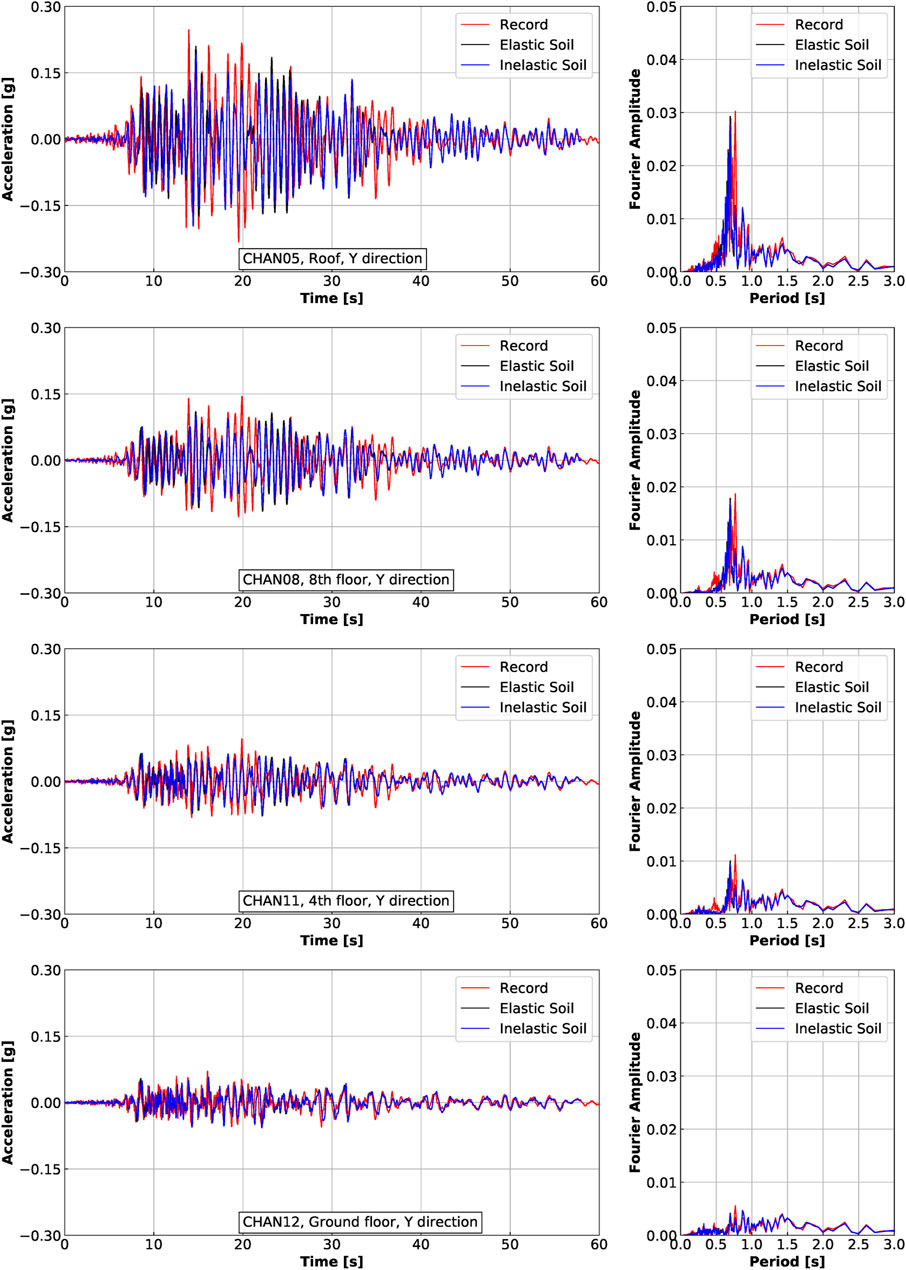
FIGURE 16. Acceleration response in Y direction for Ventura Hotel building excited by the Northridge earthquake.
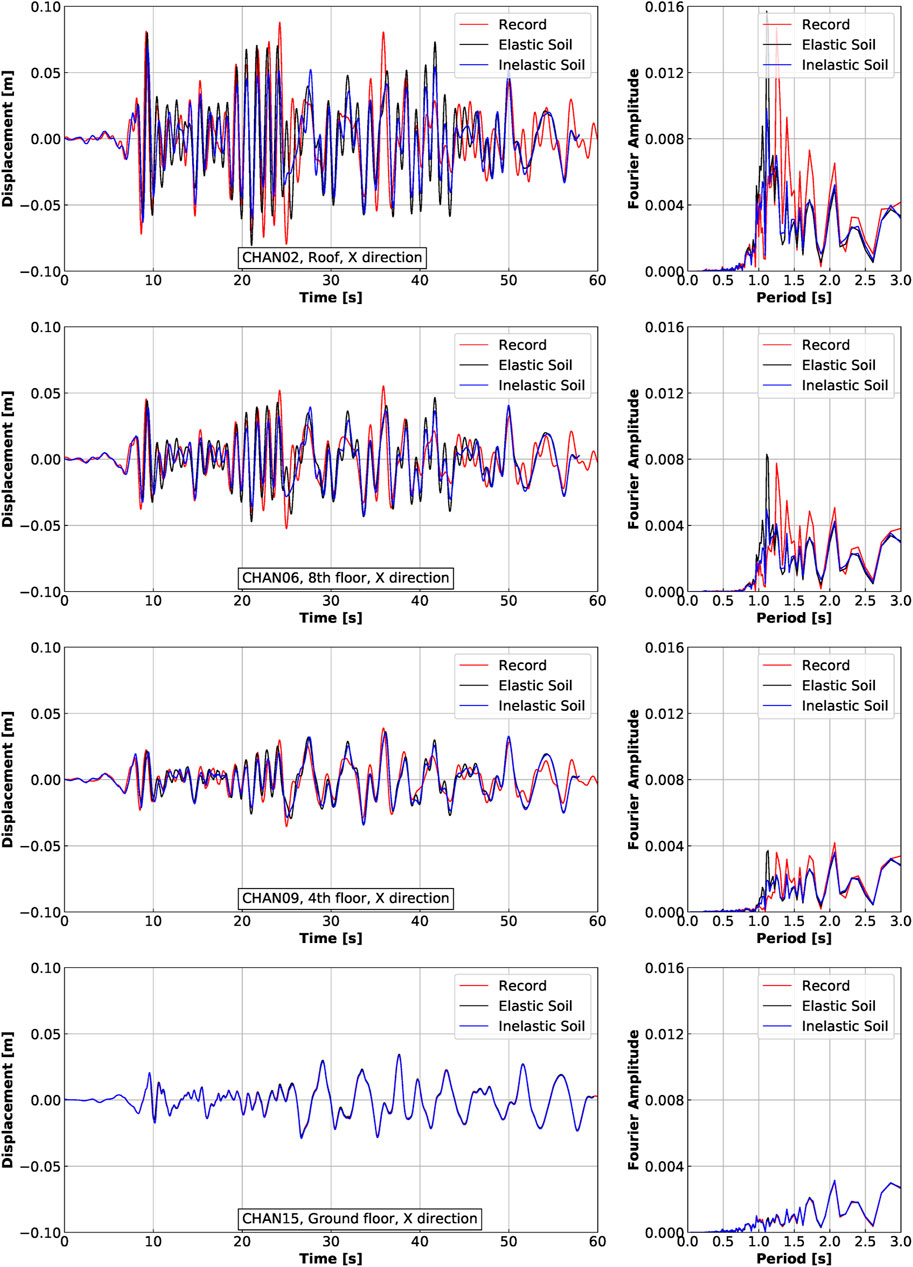
FIGURE 17. Displacement response in X direction for Ventura Hotel building excited by the Northridge earthquake.

FIGURE 18. Displacement response in Y direction for Ventura Hotel building excited by the Northridge earthquake.
In general, the change of dynamic response is small when inelastic soil material model is used. Looking at the time history plots, the peak acceleration and displacement remain almost the same. There is a noticeable reduction in inelastic model accelerations in X direction after time of 30 s. The response reduction is more obvious in frequency domain. Fourier amplitudes of acceleration and displacement at dominant periods are smaller for the inelastic soil model case than the elastic case.
This is not surprising, primarily due to the small volume of soil that does yield, mostly in the zone adjacent to structural foundations. Thus limited reduction is observed in the overall dynamic response of the ESSI model. This comparison also further justifies the use of elastic soil model in the benchmark case.
Seismic motion magnitude
In the previous section, it was shown that, for moderate seismic motions, soil inelasticity has small influence on the overall ESSI system response. When seismic motion do increase, it is expected that more reductions of response will be observed for the case with inelastic soil response. In this section, the Northridge earthquake motion is linearly scaled up 5 times and applied to the two ESSI models with elastic and inelastic soil behavior.
The comparison of dynamic response between elastic and inelastic soil response, when the Northridge earthquake motions are scaled up 5 times, are shown in Figure 19 for acceleration in X direction, Figure 20 for acceleration in Y direction, Figure 21 for displacement in X direction, and Figure 22 for displacement in Y direction, for all instrumented locations.
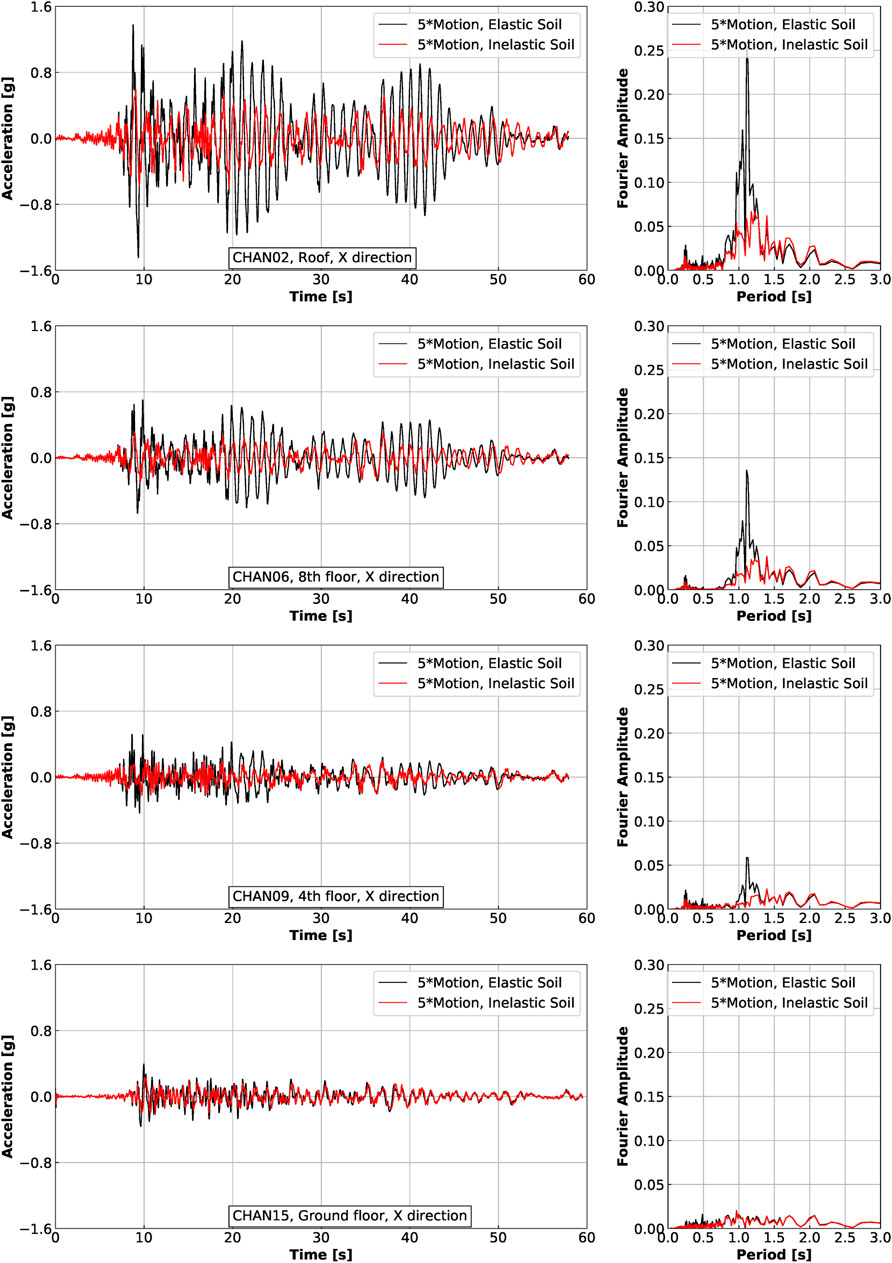
FIGURE 19. Acceleration response in X direction for Ventura Hotel building excited by the Northridge earthquake scaled up 5 times.

FIGURE 20. Acceleration response inn Y direction for Ventura Hotel building excited by the Northridge earthquake scaled up 5 times.

FIGURE 21. Displacement response in X directions for Ventura Hotel building excited by the Northridge earthquake scaled up 5 times.
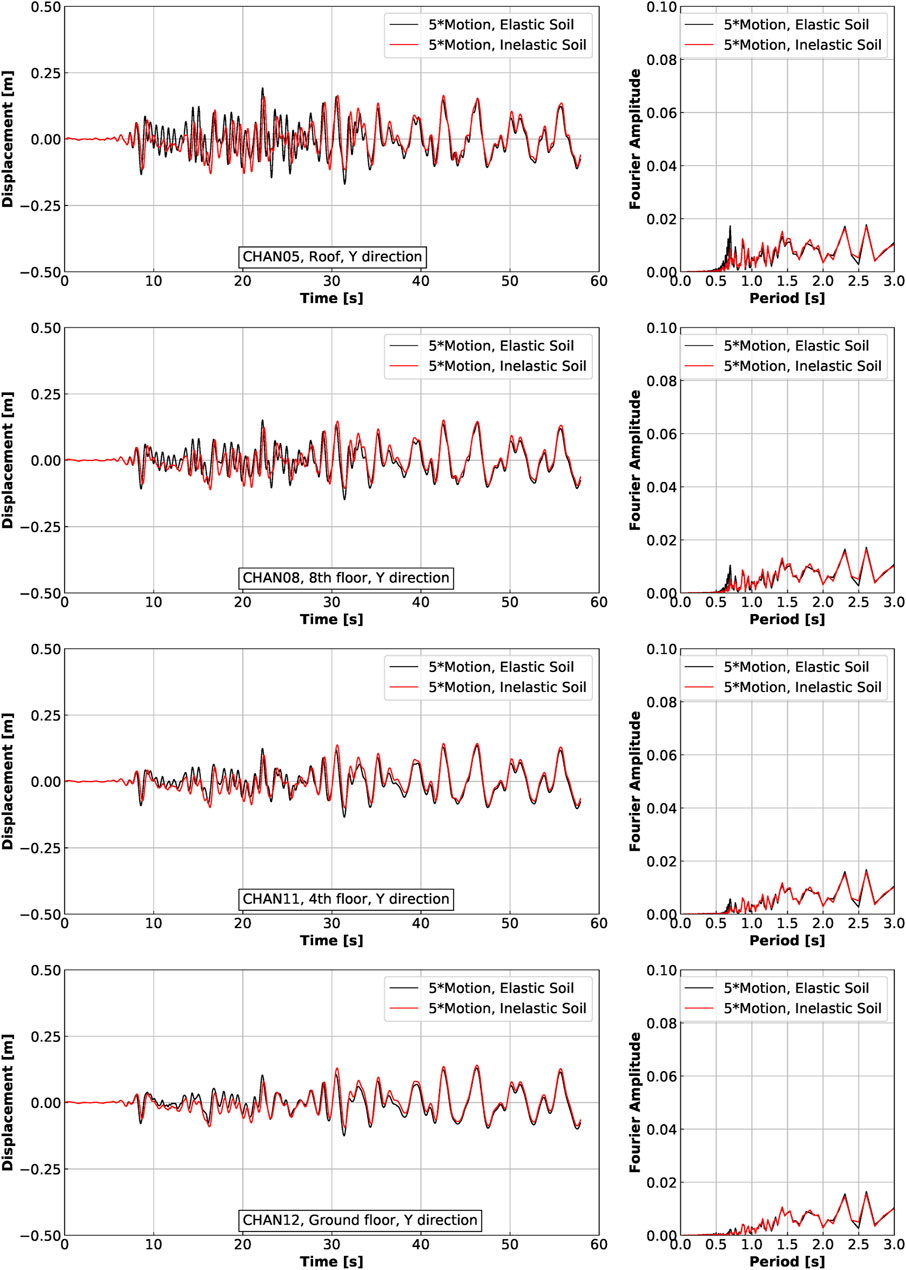
FIGURE 22. Displacement response in Y direction for Ventura Hotel building excited by the Northridge earthquake scaled up 5 times.
Significant acceleration and displacement reductions are observed, especially at higher elevations of structure. For the elastic soil, the peak acceleration at roof in X direction is 1.5 g, while for the inelastic soil, the peak acceleration for the same instrument/channel is about only 0.6 g. This is a 60% reduction in acceleration response when soil features inelastic response. Reduction in displacement response is also seen, although not as significant as reduction in accelerations.
As observed in frequency domain result plots, notable reductions in Fourier amplitude are also observed. More importantly, the use of inelastic soil material leads to larger dominant period in acceleration and displacement responses. For example, as shown in Figure 19, the dominant, first period of acceleration response in X direction is T = 1.1 s for the elastic soil response case, while the dominant period for inelastic soil response case is approximately T = 1.3 s. This is to be contrasted with the first mode calculated for the structure only (non-ESSI case), T1 = 0.83 s, that was presented in Table 1 on page 22.
Is shown that for milder seismic motions, use of linear elastic model might be acceptable, provided that the analyst/engineer can demonstrate that use of full nonlinear soil response makes relatively small changes in overall ESSI response. It is important to note that analysis using inelastic material model takes longer time to run and might require higher expertise from analyst, hence possibility of switching to simpler, linear elastic analysis if mild to moderate earthquake excitations are expected can benefit analysis time and reduce modeling complexity. Of course, when the seismic motions are large enough, inelastic modeling should be used. The use of full nonlinear, inelastic modeling and simulation and the increase in required expertise and computational cost is unavoidable if reliable numerical simulation results are needed for assessing behavior of an SSI system excited by a full range of seismic motions and experiencing inelastic material behavior.
Conclusion
Presented was a full-scale numerical modeling and simulation study of a 12-story hotel building structure in Ventura, California, excited by the 1994 Northridge earthquake. Main purpose of presented work is to introduce sophisticated modeling and to validate a modeling and simulation approach for a realistic structure and ESSI system excited by realistic seismic motions. Direct validation studies of complex ESSI systems are rather limited. Presented work is intended to contribute to the general knowledge base of modeling earthquake soil structure interaction problems. In addition to validation of modeling and simulation using real, measured data, a sensitivity study showed influence of a number of different levels of modeling sophistication and modeling choices on response of the ESSI system. The benchmark case analysis provides strong evidence that the modeling approach presented provides accurate and reliable numerical results, for given earthquake, soil and structural system.
Direct comparison of dynamic responses, time history and FFT, at all instrumented locations, between Real-ESSI simulation result and CSMIP record was presented. Numerical results were shown to match very well with the recorded responses in both directions and at all elevations.
In order to understand the controlling factors in the numerical simulation, sensitivity of results to several modeling variables was investigated. As expected, ESSI effect and structural damping ratio had significant influence on the dynamic response of the SSI system. It was also shown that the influence of soil inelasticity depends on the magnitude of seismic motion. For a moderate earthquake motion, up to approximately PGA = 0.06 g, localized soil yielding does happen, however such yielding has limited influence on the overall dynamic response of the ESSI system. For a larger seismic motion, up to approximately PGA = 0.3 g, significant reduction in system dynamic response was observed. Therefore, the use of inelastic soil material model is recommended, especially when strong seismic motion is considered.
It is noted that developed model input files, are available for direct download (Jeremić et al., 2022b), and can be analyzed using the Real-ESSI Simulator (Jeremić et al., 2022a), that is also available for download, or use on Amazon Web Services computers.
Data availability statement
The original contributions presented in the study are included in the article/supplementary materials, further inquiries can be directed to the corresponding author.
Author contributions
BJ: Concept, models, writing HY: Modeling, writing HW: Modeling writing. All authors contributed to the article and approved the submitted version.
Funding
Support for presented work was provided by the US-FEMA as part of the ATC-144 project, that is published as a FEMA P-2091 report, (Lizundia et al., 2020).
Acknowledgments
The authors acknowledge accessing strong-motion data through the Center for Engineering Strong Motion Data (CESMD). The networks or agencies providing the data used in this paper are the California Strong Motion Instrumentation Program (CSMIP) and the USGS National Strong Motion Project (NSMP).
Conflict of interest
The authors declare that the research was conducted in the absence of any commercial or financial relationships that could be construed as a potential conflict of interest.
Publisher’s note
All claims expressed in this article are solely those of the authors and do not necessarily represent those of their affiliated organizations, or those of the publisher, the editors and the reviewers. Any product that may be evaluated in this article, or claim that may be made by its manufacturer, is not guaranteed or endorsed by the publisher.
References
Babuska, I., Nobile, F., Oden, J., and Tempone, R. (2004). “Reliability, uncertainty estimates, validation and verification,”. Report No. 04-05 (Copenhagen: ICES).
Babuška, I., and Oden, J. T. (2004). Verification and validation in computational engineering and science: basic concepts. Comput. Methods Appl. Mech. Eng. 193 (36-38), 4057–4066. doi:10.1016/j.cma.2004.03.002
Baker, J., Bray, J., Crouse, C., Deierlein, G., Hamburger, R. O., Hooper, J., et al. (2017). “Guidelines for performance-based seismic design of tall buildings,”. Report No. PEER Report No. 2017/05 (Richmod, CA: Pacific Earthquake Engineering Research Center). (May).
Bielak, J., Loukakis, K., Hisada, Y., and Yoshimura, C. (2003). Domain reduction method for three–dimensional earthquake modeling in localized regions. Part I: theory. Bull. Seismol. Soc. Am. 93 (2), 817–824. doi:10.1785/0120010251
Bybordiani, M., and Arici, Y. (2019). Structure-soil-structure interaction of adjacent buildings subjected to seismic loading. Earthq. Eng. Struct. Dyn. 0 (0).
Feng, Y., Zamani, K., Yang, H., Wang, H., Wang, F., and Jeremić, B. (2019). Procedures to build trust in nonlinear elastoplastic integration algorithm: solution and code verification. Eng. Comput. 36, 1643–1656. doi:10.1007/s00366-019-00787-0
Goggins, J., and Salawdeh, S. (2013). Validation of nonlinear time history analysis models for single-storey concentrically braced frames using full-scale shake table tests. Earthq. Eng. Struct. Dyn. 42 (8), 1151–1170. doi:10.1002/eqe.2264
Hall, J. F. (2006). Problems encountered from the use (or misuse) of Rayleigh damping. Earthq. Eng. Struct. Dyn. 35 (5), 525–545. doi:10.1002/eqe.541
Jeremić, B., Jie, G., Cheng, Z., Tafazzoli, N., Tasiopoulou, P., Pisanò, F., et al. (2022a). The real-ESSI simulator system 1988-2022. Davis: University of California. Available at: http://real-essi.us/.
Jeremić, B., Jie, G., Preisig, M., and Tafazzoli, N. (2009). Time domain simulation of soil–foundation–structure interaction in non–uniform soils. Earthq. Eng. Struct. Dyn. 38 (5), 699–718. doi:10.1002/eqe.896
Jeremić, B., and Preisig, M. (2005). Seismic soil–foundation–structure interaction: Numerical modeling issues. New York, NY, U.S.A: ASCE Structures Congress. (April 20-24).
Jeremić, B., Tafazzoli, N., Ancheta, T., Orbović, N., and Blahoianu, A. (2013). Seismic behavior of NPP structures subjected to realistic 3d, inclined seismic motions, in variable layered soil/rock, on surface or embedded foundations. Nucl. Eng. Des. 265, 85–94. doi:10.1016/j.nucengdes.2013.07.003
Jeremić, B., Tafazzoli, N., Kamrani, B., Chao, Y., Jeong, C., Tasiopoulou, P., et al. (2010). “On seismic soil structure interaction simulations for nuclear power plants,” in Proceedings of the OECD – NEA – IAGE – ISSC Workshop on Soil Structure Interaction Knowledge and Effect on the Seismic Assessment of NPPs Structures and Components, Noordwijk, The Nethetrlands, 21-September-2010.
Jeremić, B., Yang, Z., Cheng, Z., Jie, G., Tafazzoli, N., Preisig, M., et al. (2022b). Nonlinear finite elements: Modeling and simulation of earthquakes, soils, structures and their interaction 1989-2022. Davis, CA, USA: University of California. Available at URL: http://sokocalo.engr.ucdavis.edu/jeremic/LectureNotes/.
Ji, X., Fenves, G. L., Kajiwara, K., and Nakashima, M. (2011). Seismic damage detection of a full-scale shaking table test structure. J. Struct. Eng. 137 (1), 14–21. doi:10.1061/(asce)st.1943-541x.0000278
Lizundia, B., Crouse, C., Harris, S., Jeremić, B., Stewart, J. P., and Valley, M. (2020). “A practical guide to soil-structure interaction, FEMA P-2091,” (Redwood City, CA, USA: Applied Technology Council). Report No. FEMA P-2091.
Lizundia, Bret (2021). Private communications 2019-2021. San Francisco, California: RUTHERFORD + CHEKENE.
Løkke, A., and Chopra, A. K. (2019). Direct finite element method for nonlinear earthquake analysis of concrete dams: simplification, modeling, and practical application. Earthq. Eng. Struct. Dyn. 48 (7), 818–842. doi:10.1002/eqe.3150
Lou, M., Wang, H., Chen, X., and Zhai, Y. (2011). Structure–soil–structure interaction: literature review. Soil Dyn. Earthq. Eng. 31 (12), 1724–1731. doi:10.1016/j.soildyn.2011.07.008
Lu, X., Xie, L., Guan, H., Huang, Y., and Lu, X. (2015). A shear wall element for nonlinear seismic analysis of super-tall buildings using opensees. Finite Elem. Analysis Des. 98, 14–25. doi:10.1016/j.finel.2015.01.006
Marques, R., and Lourenço, P. B. (2014). Unreinforced and confined masonry buildings in seismic regions: validation of macro-element models and cost analysis. Eng. Struct. 64, 52–67. doi:10.1016/j.engstruct.2014.01.014
Michel, C., Guéguen, P., El Arem, S., Mazars, J., and Kotronis, P. (2010). Full-scale dynamic response of an rc building under weak seismic motions using earthquake recordings, ambient vibrations and modelling. Earthq. Eng. Struct. Dyn. 39 (4), 419–441.
Oberkampf, W. L., and Roy, C. J. (2010). Verification and validation in scientific computing. Cambridge: Cambridge University Press.
Oberkampf, W. L., Trucano, T. G., and Hirsch, C. (2002). “Verification, validation and predictive capability in computational engineering and physics,” in Proceedings of the Foundations for Verification and Validation on the 21st Century Workshop, Laurel, Maryland, October 22-23, 2002 (Maryland, United States: Johns Hopkins University/Applied Physics Laboratory). 1–74.
Oberkampf, W. L., and Trucano, T. G. (2007). “Verification and validation benchmarks,”. Report No. SAN2007-0853 (Albuquerque, New Mexico 87185 and Livermore, California 94550: Sandia National Laboratory). (February).
Oberkampf, W. (2003). Material from the short course on verification and validation in computational mechanics. Albuquerque, New Mexico: University of southtompon.
O’Reilly, G. J., and Calvi, G. M. (2019). Conceptual seismic design in performance-based earthquake engineering. Earthq. Eng. Struct. Dyn. 48 (4), 389–411. doi:10.1002/eqe.3141
Reza Tabatabaiefar, S. H., Fatahi, B., and Samali, B. (2013). Seismic behavior of building frames considering dynamic soil-structure interaction. Int. J. Geomechanics 13 (4), 409–420. doi:10.1061/(asce)gm.1943-5622.0000231
Roache, P. J. (1998). Verification and validation in computational science and engineering. Albuquerque, New Mexico: Hermosa Publishers. ISBN 0-913478-08-3.
Roh, H., and Reinhorn, A. M. (2010). Modeling and seismic response of structures with concrete rocking columns and viscous dampers. Eng. Struct. 32 (8), 2096–2107. doi:10.1016/j.engstruct.2010.03.013
Roohi, M., Hernandez, E. M., and Rosowsky, D. (2019). Nonlinear seismic response reconstruction and performance assessment of instrumented wood-frame buildings-validation using neeswood capstone full-scale tests. Struct. Control Health Monit. 26 (9), e2373. doi:10.1002/stc.2373
Roy, C. J., and Oberkampf, W. L. (2011). A comprehensive framework for verification, validation, and uncertainty quantification in scientific computing. Comput. Methods Appl. Mech. Eng. 200 (25-28), 2131–2144. doi:10.1016/j.cma.2011.03.016
Salami, M. R., Kashani, M. M., and Goda, K. (2019). Influence of advanced structural modeling technique, mainshock-aftershock sequences, and ground-motion types on seismic fragility of low-rise rc structures. Soil Dyn. Earthq. Eng. 117, 263–279. doi:10.1016/j.soildyn.2018.10.036
Tasiopoulou, P., Taiebat, M., Tafazzoli, N., and Jeremić, B. (2015). Solution verification procedures for modeling and simulation of fully coupled porous media: static and dynamic behavior. Coupled Syst. Mech. J. 4 (1), 67–98. doi:10.12989/csm.2015.4.1.067
Torabi, H., and Rayhani, M. T. (2014). Three dimensional finite element modeling of seismic soil–structure interaction in soft soil. Comput. Geotechnics 60, 9–19. doi:10.1016/j.compgeo.2014.03.014
Wu, W., Ge, S., Yuan, Y., Ding, W., and Anastasopoulos, I. (2021). Seismic response of a cross interchange metro station in soft soil: physical and numerical modeling. Earthq. Eng. Struct. Dyn. 50, 2294–2313. doi:10.1002/eqe.3446
Yang, H., Wang, H., Feng, Y., Wang, F., and Jeremić, B. (2019). Energy dissipation in solids due to material inelasticity, viscous coupling, and algorithmic damping. ASCE J. Eng. Mech. 145 (9). doi:10.1061/(asce)em.1943-7889.0001617
Yoshimura, C., Bielak, J., and Hisada, Y. (2003). Domain reduction method for three-dimensional earthquake modeling in localized regions, Part II: verification and applications. Bull. Seismol. Soc. Am. 93 (2), 825–841. doi:10.1785/0120010252
Keywords: FEM, soil-structure, analysis, validation, practical methods
Citation: Yang H, Wang H and Jeremić B (2023) Numerical modeling and validation of earthquake soil structure interaction: a 12-story building in Ventura, California. Front. Built Environ. 9:1249550. doi: 10.3389/fbuil.2023.1249550
Received: 28 June 2023; Accepted: 13 September 2023;
Published: 09 November 2023.
Edited by:
Fatih Çelik, Niğde Ömer Halisdemir University, TürkiyeReviewed by:
Luca Martinelli, Polytechnic University of Milan, ItalyFilippo Gatti, Université Paris-Saclay, France
Yifei Sun, Hohai University, China
Copyright © 2023 Yang, Wang and Jeremić. This is an open-access article distributed under the terms of the Creative Commons Attribution License (CC BY). The use, distribution or reproduction in other forums is permitted, provided the original author(s) and the copyright owner(s) are credited and that the original publication in this journal is cited, in accordance with accepted academic practice. No use, distribution or reproduction is permitted which does not comply with these terms.
*Correspondence: Han Yang, cHJvZmVzc29yaGFuc29sb0B0anUuZWR1LmNu