 Osama Ayadi1*
 Sahban Alnaser2
 Mohammed Haj-ahmed2
 Hussam Khasawneh3
 Sereen Althaher2Mohammad Alrbai1Mohammad Arabiat4
- 1Department of Mechanical Engineering, University of Jordan, Amman, Jordan
- 2Department of Electrical Engineering, University of Jordan, Amman, Jordan
- 3Department of Mechatronics Engineering, University of Jordan, Amman, Jordan
- 4Engineering Department, University of Jordan, Amman, Jordan
The global lockdowns adopted by many countries to combat the outbreak of the COVID-19 pandemic led to a significant transformation in the teaching methods adopted in higher education institutions toward dependence on online learning systems. Although this pandemic has placed a technical and financial burden on academic institutions to facilitate the successful transition to online learning, it provides opportunities to understand the impacts of adopting new policies and strategies to improve the efficient utilization of resources and thus reduce operational costs. The detailed analyses of the changes in energy consumption can support assessing the potential savings in electricity bills with the wide-scale adoption of online learning methods in the future as a business as usual to improve and modernize the education systems. This paper provides a detailed analysis of the electrical energy consumption of the buildings within the campus of the University of Jordan. The diversity of building types on the campus (e.g., university hospital, humanities schools, scientific schools) supports the provision of more general and robust recommendations to extend the results to other institutions, particularly in developing countries. The Energy Use Intensity (EUI) per unit area and EUI per student are employed for the first time for benchmarking the energy usage in educational buildings in Jordan. Overall, the analyses show that the total electricity consumption in 2020 was significantly lower than in 2019, with a decrease of 20.8% from 27.7 GWh in 2019 to 21.9 GWh in 2020. It is also found that the most significant reduction occurred in the humanities buildings (i.e., a 39% drop in energy consumption). However, this volume of energy reduction is still relatively low, considering the absence of students. Furthermore, the hospital has an extremely high EUI value (161 kWh/m2/year) compared to the other categories (e.g., the EUI for humanities schools is 32.5 kWh//m2/year). To conclude, the electrical energy consumption data suggests that there may be significant opportunities for energy conservation in all building categories, especially in the hospital.
1 Introduction
The worldwide procedures carried out to restrict the outbreak of COVID-19 (e.g., city lockdowns, travel bans, online work, and other distancing actions) have dramatically impacted the economy, social life, and individual lifestyles (Zhong et al., 2020). In particular, the worldwide full and partial lockdowns have affected the teaching models adopted at higher academic institutions. Across the globe, the closure of universities due to the uprising of COVID-19 has accelerated the adoption of the online teaching model as an alternative to the classical physical classroom teaching model. Also, flexible work arrangements, including the option to work from home all day, were widely implemented during the pandemic at academic institutions to decrease the transmission of COVID-19. Although the academic institutions managed to some extent to cope with the new educational needs and continue the educational process, the transformation demonstrated the necessity to rapidly digitize and modernize the educational system to ensure the delivery of online courses at the same quality and effectiveness as the traditional physical teaching classroom. Also, the pandemic highlighted the importance of accelerating the automation process for most routine daily work and complex tasks to improve the performance of services delivered by administrative offices at academic institutions. Realizing the important role of digital transformation based on the lessons learned from the pandemic requires increasing investments in digital technologies and communication infrastructure. However, the necessary investments may place financial barriers towards achieving the long-term strategic goals of fully digitalizing the educational system and working process. A considerable share of the expected cost of digitalization could be secured from the potential reduction in electricity bills with online teaching models and flexible work arrangements. Fortunately, the electric energy consumption data during the pandemic allows for assessing the positive implications of future teaching techniques and working models on the amounts of electricity bills, thus understanding the extent to which the financial benefits could subsidize the cost of digitalization. To draw proper recommendations, it is also important to analyze the energy consumption data at the level of each building within the higher academic institutions (i.e., not at the aggregate level of the institution). In particular, the electric energy consumption of buildings varies according to different factors that are mainly related to the area of the building, the purpose of the building (e.g., administrative building, teaching, and learning building), the daily energy usage of the building and number of active students/employees at the building. For instance, the electric energy consumption of buildings at scientific faculties (e.g., faculty of engineering) might not be the same as that of humanities faculties. To this end, analyzing the aggregate electric energy consumption of higher academic institutions may not capture the potential benefits of future teaching and working models on the amounts of electricity bills. It is crucial to conduct detailed energy analysis at the building level. It is also worth noting that the study of the COVID-19 energy data at the building level of an academic institution supports drawing general insights about the changes in electricity usage, which could be applied to other academic and educational institutions with similar types of buildings.
Most studies presented in the literature considered the effects of lockdowns during the pandemic on the national electrical energy sector. For example, the study by Czosnyka et al. (2020) presented a detailed analysis of the load profiles for Poland’s residential and non-residential loads during the pandemic period. In another study by Ruensukon et al. (2021) in the Mueang Phetchaburi district in Thailand, the authors reported that the reduction in total electrical energy consumption was accompanied by increased residential consumption. Similar energy consumption patterns were noticed in Hungary and Ukraine, where the decline in industrial and governmental facilities was accompanied by an increase in the residential load (Morva and Diahovchenko, 2020). In another study performed by Zarbakhsh et al. (2022), the authors reported that the pandemic changed energy consumption patterns by shifting the daily morning and evening peaks.
On the other hand, some research found that the change in residential load during the pandemic changed insignificantly. For example (Agdas and Barooah, 2020), investigated the effect of COVID-19 on the load and supply changes in three states in the US. The authors indicated that in Florida, for example, energy consumption did not show a reduction. In their paper (Tavakoli et al., 2023), studied the impact of the COVID-19 pandemic on energy consumption in office buildings. This study emphasizes the need for changes in building energy management systems. It offers recommendations for office and commercial buildings to reduce energy over-consumption during similar crises and normal situations.
Additionally (Xu et al., 2023), studied the impact of the COVID-19 pandemic on power consumption in open university campus buildings. According to their findings, the implementation of the restriction policy had a noteworthy impact on teaching, sports, and cultural buildings, resulting in a reduction of 0.28, 0.09, and 0.07 kWh/m2/day in the electricity intensity of these three building types, respectively. This reduction is considered significant.
In their paper (Soluyanov et al., 2020), performed a study that concluded that the only effect of the pandemic on energy consumption is summarized by the decrease in energy consumption in non-residential loads. Also (Scarabaggio et al., 2020), considered the effect of the pandemic on energy consumption in one of the most affected areas (i.e., north Italy). The authors proposed a neural network model to estimate the variation in energy consumption and then validated the model with on-ground real data. The convolutional neural network was also studied in (Atik, 2022) to develop a forecasting model for one, two, and 3 h ahead of hourly energy consumption data for the year of 2021 in Turkey. The proposed model achieved more accurate results when compared to other forecasting models. Other load forecasting techniques were also adopted to estimate the load profile during the pandemic. In (Andariesta and Wasesa, 2022) study, the authors utilized public access internet data (like google mobility and google trends) to estimate the load. Finally (Li et al., 2023), explored the impact of the COVID-19 pandemic on residential energy consumption. The study indicated that residential energy consumption increases significantly with longer durations of in-home activity. However, the growth rate can vary depending on the neighborhood, time of day, and energy usage. Researchers have focused on the changing attitudes toward this trend post-pandemic and the impact of factors such as lockdowns, newly confirmed cases, and social distancing on residential energy consumption.
In addition to the previous studies, many studies focused on the effect of the pandemic on the operation of the electric power system. The authors of (Werth et al., 2021) studied the impact of COVID-19 on the generation side. With a study of 16 European countries, it has been reported that there is a decrease in nuclear, oil, and fossil fuels generation. On the other hand, the net-demand levels at the power systems of different countries were reduced significantly, particularly during the middle of the day, due to the shutdown of commercial and industrial activities along with the high-power injections from solar photovoltaic systems. In the study of (Al-Abdullah et al., 2021), the authors developed a resource adequacy model to assess the Kuwaiti power system’s ability to supply sufficient energy to meet the peak demand during the COVID-19 pandemic. The authors in (Scarabaggio et al., 2020), proposed a multi-layer feed-forward neural network to estimate the aggregated demand in northern Italy for planning purposes. To assess the effects of reducing the net demand on the security of supply, the authors in (Mattar et al., 2022) provided a detailed dynamic analysis of the Jordanian power system during the lockdowns. On the other hand, the implications of the pandemic on the electricity markets, especially on the day-ahead and ancillary services’ prices, were considered (Zhong et al., 2020).
While all the above research contributed to better awareness in large-scale areas and countries, few research studies were conducted on smaller-scale entities like universities and hospitals. For instance, the studies in (Chihib et al., 2021; Gaspar et al., 2022) considered the energy consumption of universities during the pandemic in Alermia and Barceleno, respectively. However, the impacts were limited to the aggregate energy consumption. To better understand energy usage, detailed and advanced energy analysis were conducted in (Tavakoli et al., 2023) at several teaching buildings. However, all these studies were performed in the context of developed countries (e.g., Spain and Australia) with the support of smart metering data. Also, none of the previously mentioned studies considered teaching hospitals whose electrical energy consumption during the pandemic might differ from buildings at scientific and humanities faculties.
In Jordan, the first diagnosed COVID-19 case was reported in March 2020 (Singh, 2020). Since then, the government has enforced a wide lockdown and full curfew in all cities for 3 weeks and long partial lockdowns afterwards. These lockdowns have thoroughly affected energy consumption due to the close of all governmental and private sector premises. Since March, two major impacts on electrical energy consumption have been noticed. The first is the internal total energy consumption decrease during the first 7 months of 2020. This can be deduced by the 95% increase in exported energy to the neighboring countries in the same period. Secondly, a decrease in non-residential consumption is accompanied by a rise in residential consumption due to the work-from-home and stay-at-home policies enforced by the government. However, it is worth mentioning that while the residential loads have been increased, the electric bills did not register an expected increase in general, and this is due to the decrease in global oil prices, which in turn was reflected in the electric bills in Jordan (National Electric Power Company NEPCO, 2020).
To cater for the above gaps in the literature, this paper aims to provide a detailed quantitative analysis of the electrical energy consumption of the buildings within the campus of the University of Jordan during the pandemic as an example of universities in developing countries. This analysis supports assessing the potential savings in electricity bills with the wide-scale adoption of online learning methods in the future as a business as usual to improve and modernize the education systems. Also, the COVID-19 energy data enables capturing the inefficient utilization of electrical energy consumption, particularly through analyzing energy data during full lockdown days. To do so, the electricity consumption between 2019 and 2020 is analyzed for seven types of buildings at the University of Jordan (administration, scientific schools, art and humanities schools, hospital and health schools, commercial buildings, restaurants, and residential buildings for university students). The diversity of building types on the campus supports the provision of more general and robust recommendations to extend the results to other institutions. Electrical energy consumption reduction is assessed for all university buildings throughout the year. Indicators of energy consumption per unit area are also provided to compare different building types in terms of the changes in electrical energy consumption in response to future policies of online teaching models and flexible work arrangements.
Based on the above, the contribution of this work could be summarized by the following points.
1. Compared to previous studies in the literature, the importance of the analysis comes from the diversity of building types on the campus (administration, scientific schools, art and humanities schools, hospital and health schools, commercial buildings, restaurants, and residential buildings for university students). This diversity in the buildings allows the provision of more general and robust recommendations to extend the results to other institutions, particularly in developing countries.
2. The employment of the Energy Use Intensity (EUI) per unit area and student for the first time for benchmarking the energy usage in educational buildings and hospitals in Jordan. This facilitates allow for comparisons and energy-saving planning.
3. The detailed analysis of the COVID-19 electrical energy data carried out in this work reduces the necessity for advanced and complex models with arbitrary assumptions that would be otherwise required to quantify the implications of future online teaching policies on electricity bills and the potential savings.
This paper is organized as follows: the second section presents the material and method. Analysis of the load variations and the energy consumption is discussed in section three. And finally, the paper is concluded in section four.
2 Materials and method
The University of Jordan (JU) was established in 1962 as the first University in Jordan, initially comprising a few main buildings. Over time, it has grown significantly and currently has approximately 80 buildings. The University encompasses 25 schools and 7 research centers. The student body at JU consists of 53,000 students, including 5,000 international students. The university campus is situated in Amman, precisely located at 32°00′48 "N 35°52′20 "E. Covering an area of approximately 1.2 square kilometers, the campus accommodates a built-up area of about 469,363 square meters. Figure 1 visually represents the University of Jordan campus map, with each building category being colored differently.
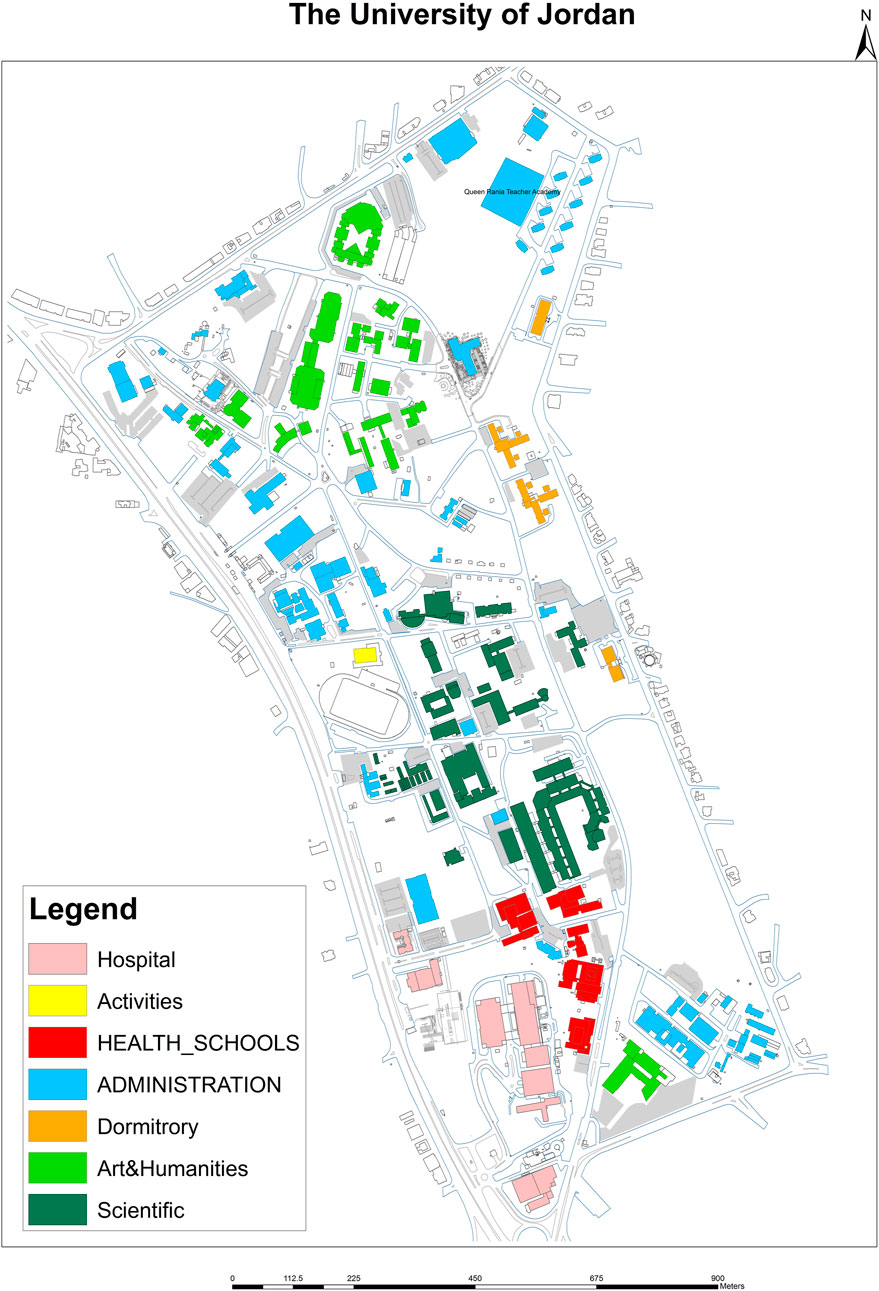
FIGURE 1. Map of the university campus, highlighting different building categories.
The typical meteorological conditions at the university campus were obtained from the ground-based weather station located on the rooftop of the Engineering school for the years 2020–2022. The obtained data is illustrated in Figure 2. In January, the monthly minimum temperatures were around 4.9°C; in August, the maximum temperatures exceeded 31.2°C. The average monthly solar radiation values ranged from 87 kWh/m2/month in January to 258 kWh/m2/month in July.
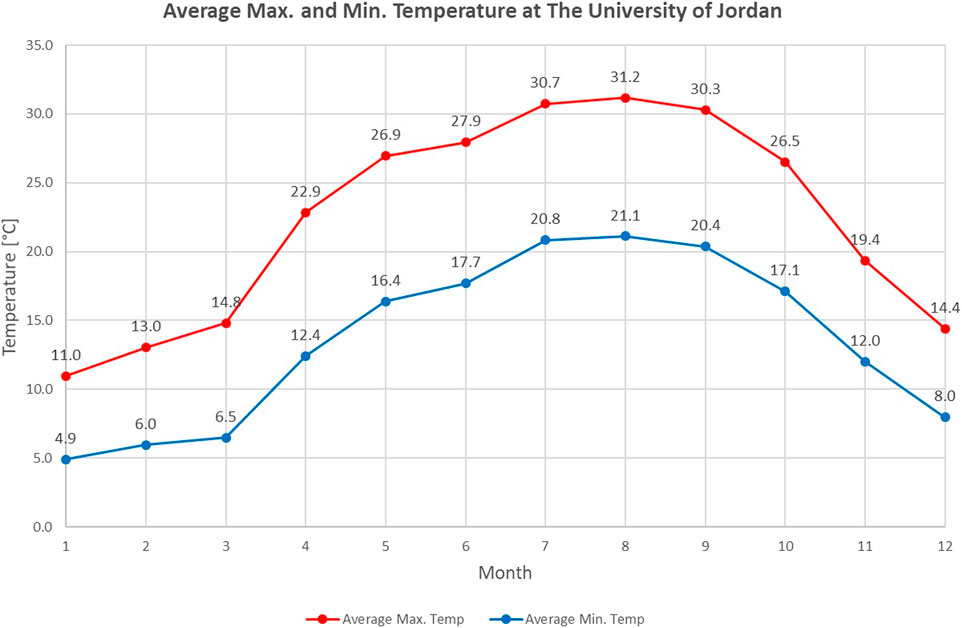
FIGURE 2. Average monthly ambient temperatures at the university campus.
This paper’s first step involved classifying university buildings according to their function and usage type. Subsequently, electricity bills for each building were collected and analyzed. The area of each building category was calculated, along with identifying the number of students in each school category. This allowed for benchmarking energy usage in the university buildings based on areas and number of students. Furthermore, the impact of COVID-19 on each building category was assessed, and energy-saving measures were recommended. Figure 3 presents the flow of the methodology followed in this paper. The following sections offer a detailed description of each step.
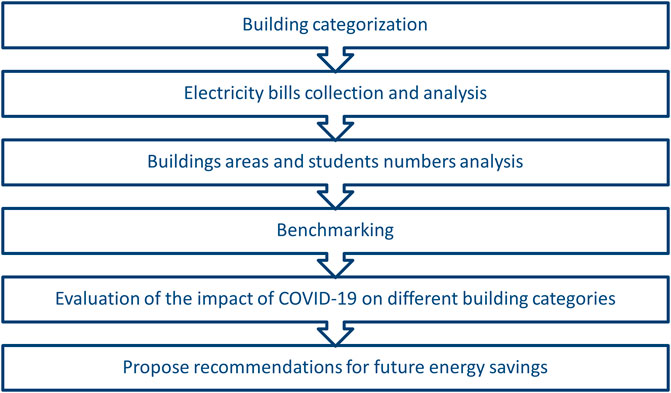
FIGURE 3. Methodology followed in this research.
2.1 Building categorizing
The university buildings have been classified based on their function and usage type. The buildings have been initially divided into five main categories: Hospital, Administrative, Schools, Dorms, and activities buildings. Furthermore, due to the unique requirements of each school type at the University, such as laboratory requirements and student schedules, schools have been further divided into three categories: humanities, scientific, and health schools. So the final classification consisted of seven categories. The following categorizations were utilized.
2.1.1 University hospital
University Hospital is a teaching hospital established in 1973. The Jordan University Hospital provides comprehensive healthcare services to the local community. With a bed capacity of 600 and 64 speciality and subspecialty services, the hospital attends to over 500,000 patients annually through its outpatient clinics, emergency department, and surgical operation theaters. Furthermore, the hospital plays a crucial role in providing practical training opportunities for medical students and other healthcare professionals, enabling them to gain hands-on experience in a clinical setting and engage in research projects under the guidance of experienced clinicians and faculty members. The University hospital presents the major electricity consumer on the campus. Electricity consumption in the hospital is mainly due to the space cooling, ventilation, lighting, equipment usage, fans, pumps, and elevators.
2.1.2 Administrative buildings
Administrative buildings comprise 30% of the total number of buildings at the University and use an estimated 5,000 administrative staff. They house various administrative units and centers, including the Admission and Registration Unit, Financial Affairs, Information Technology Center, and Center for Strategic Studies. Other departments include Human Resources, Public Relations, and Legal Affairs, among others, each with their respective roles, such as managing student admissions, handling financial operations, providing technical support and services, conducting research and analysis, and managing human resources, public relations, and legal affairs. Electricity consumption in administrative buildings is mainly due to the lighting, equipment usage, and space cooling for parts of the buildings.
2.1.3 Art and humanities schools
The Art and Humanities schools at the University of Jordan consist of ten schools, namely, the School of Arts, School of Business, School of Sharia, School of Educational Sciences, School of Law, School of Sport Science, School of Arts and Design, Prince Al Hussein Bin Abdullah II School of International Studies, School of Foreign Languages, and School of Archaeology and Tourism. Apart from the School of Arts, these buildings are predominantly located in the northern part of the campus.
Approximately 24,500 students are currently enrolled in the Arts and Humanities schools, which accounts for roughly 48% of the total student population at the University. The combined building area for these schools amounts to approximately 100,000 square meters. Electricity consumption in these schools is primarily attributed to lighting and partial space cooling in certain sections of the buildings. While a few laboratories are present, they mainly utilize standard office equipment and desktop computers.
2.1.4 Scientific schools
The University of Jordan encompasses four distinct scientific schools: the School of Science, the School of Agriculture, the School of Engineering, and the King Abdullah II School of Information Technology. These schools are situated in the southern section of the university campus.
The scientific schools at the University currently have an enrollment of approximately 13,600 students, representing around 27% of the total student population. These schools occupy a combined building area of approximately 111,000 square meters, which includes lecture halls and diverse laboratory spaces. Electricity usage in these schools primarily encompasses lighting, space cooling in specific areas, and powering laboratory equipment.
2.1.5 Health schools
The University of Jordan is home to five health schools: Medicine, Nursing, Pharmacy, Dentistry, and Rehabilitation Sciences. These schools are situated in the southwestern section of the university campus, in close proximity to the university hospital.
The health schools currently have an enrollment of approximately 12,500 students, representing around 25% of the total student population. These schools occupy a combined building area of approximately 44,000 square meters, which includes lecture halls and diverse laboratory spaces. Electricity usage in these schools primarily encompasses lighting, space cooling in specific areas, and powering laboratory equipment.
2.1.6 Dormitories
Four dormitories are currently operational to cater exclusively to the accommodation needs of female students. Al-Zahra’a and Al-Andalus were constructed between 1977 and 1979, while Jerash and Amon were erected between 2004 and 2005. These dormitories are indispensable in providing on-campus housing for female students, facilitating their pursuit of academic objectives within a secure and nurturing environment. The total built area of the four dormitories is 30,100 sqm.
Electricity use in these dormitories is mainly for lighting, plug-in appliances, air circulation fans, and elevators. A detailed investigation of the renewable energy utilization for the dormitory buildings was presented by Ayadi and Al-Dahidi (2019).
2.1.7 Buildings for students’ activities
The student activities buildings at the University of Jordan are comprised of three distinct structures: the University gymnasium building, the student activities building, and the university stadium. The University gymnasium building is predominantly utilized for indoor physical activities, including basketball, volleyball, fitness training, and exercise. The student activities building serves as a hub for various student activities, such as club meetings, social events, and other gatherings. Finally, the university stadium is primarily used for outdoor sports events, such as football, soccer, or track and field, as well as for large-scale events, such as concerts and graduations. Electricity use in these buildings is mainly for lighting, especially the lighting of the stadiums, plug-in appliances, and air circulation fans.
2.2 Electricity bills analysis
From energy sources perspective, the JU campus uses both electricity and diesel. In this study, the focus was exclusively on the electricity consumption within the JU campus, specifically excluding the use of diesel. Investigating electrical energy consumption in the University of Jordan campus employed the following methodology. Initially, the monthly energy bills for 2019 and 2020, totalling 24 months, were collected for each electricity meter. The electricity was supplied to the University through 46 m, where each meter served one or more adjacent buildings. These bills contained detailed information about the electrical energy consumption of each building. The monthly electricity bills were obtained on paper from the University’s Financial Affairs unit and subsequently compiled into spreadsheets. By aggregating the electricity consumption of buildings within each category, the monthly electricity consumption for each category during the specified period was determined.
2.3 Area and population analysis
Following the first step of building categorization, the area of the buildings in each category was obtained from the AutoCAD drawings of the buildings from the engineering department at the University. The number of students was obtained from the students’ registration department. Both pieces of information are presented in Table 1.
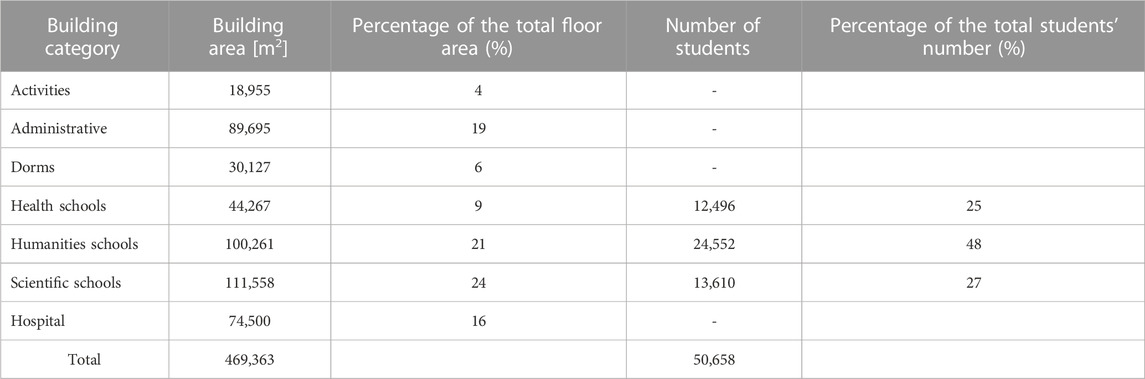
TABLE 1. Building categories areas and number of students in each school category.
The largest building category in terms of area is the Scientific schools, with a substantial coverage of 111,558 square meters. It is followed by the Humanities schools, which have a significant area of 100,261 square meters. The Administrative buildings also occupy a considerable space, totalling 89,695 square meters. About half of the university students are enrolled in the humanities schools, while the other half are divided equally between the scientific and health schools.
2.4 Benchmarking
Energy Use Intensity (EUI) is a commonly used indicator for assessing the energy performance of buildings (Litardo et al., 2021). It is calculated by dividing the annual energy consumption of a building by its total floor area (Chung, 2011). The EUI facilitates benchmarking analysis, allowing comparisons among buildings with similar uses and located in comparable climate zones (Arjunan et al., 2020). Building energy benchmarking serves as a reference point to evaluate the efficiency of buildings and provides a basis for proposing energy-saving strategies. While previous studies, such as the work done by Ayadi et al. (2021), have developed energy benchmarks for residential buildings in Jordan, this study is the first to present energy benchmarking specifically for educational buildings in Jordan.
This study focuses on assessing the energy performance of the University of Jordan campus. The findings presented in this paper hold significance in establishing a benchmark for university buildings, as there is limited knowledge about this subject in the context of dry Mediterranean climates, specifically in Jordan.
Calculating the EUI based on the building area and the number of people is developed based on (Litardo et al., 2021) and is presented in Eqs 1, 2.
where Ei is the monthly total electricity consumption for a given building category, and Abuilding is the total building floor area.
where Ei is the monthly total electricity consumption for a given school category, and npeople is the total number of students in the same school category.
3 Results and discussion
The University’s annual electricity consumption has been increasing steadily due to the growing number of buildings, students, and services. Monthly electricity bills for the main campus and the university hospital are depicted in Figure 3, with annual consumption reaching approximately 27 GW-hours (GWh), in 2019. At a high electricity tariff of 0.376 US $/kWh, the resulting electricity bill amounts to roughly 10 million US dollars annually, placing considerable financial pressure on the University’s annual budget. In response, the University has identified Renewable Energy and Energy Efficiency (RE and EE) as strategic objectives for the next decade. Specifically, the University has set an ambitious goal of achieving 100% electrical energy independence, primarily through renewable solar energy via photovoltaic (PV) panels (Ayadi et al., 2018). In 2017, a tender was prepared for the Design, Engineering, Supply, Delivery, Installation, Testing, Commissioning, Cleaning, and Maintenance of Grid-Connected 16 MW AC Photovoltaic Systems at the University of Jordan to meet the annual electricity needs of the University. Of the total capacity, 12 MW will be installed on building rooftops, while the remaining 4 MW to be erected in parking lots. Notably, the commercial operation of the solar PV project began in 2021, which does not impact the analysis presented in this paper.
3.1 Overall electricity consumption at the university
In this study, the electricity consumption data for 2019 and 2020 were analyzed to compare the total and monthly energy consumption between the 2 years, as shown in Figure 4. Results show that the total electricity consumption in 2020 was significantly lower than in 2019, with a decrease of 20.8% from 27.7 GWh in 2019 to 21.9 GWh in 2020.

FIGURE 4. Total monthly electricity use trends for the University over 2019–2020.
A clear seasonal pattern in electricity consumption was observed for 2019, with higher consumption during the summer months (June to August) and lower consumption during the winter months (December to February). This pattern is consistent with the influence of temperature on electricity demand related to using air conditioning applications during summer months.
The monthly electricity consumption data for 2020 showed significant differences compared to the previous year, likely due to the COVID-19 pandemic. In particular, a sharp decrease in electricity consumption was observed in March 2020, coinciding with the onset of lockdowns and restrictions. This decrease in consumption continued through April, which saw the lowest electricity consumption of the year. This is consistent with the time of the COVID-19 pandemic, since that on 14 March 2020, the Jordanian government announced the closure of all educational institutions, including kindergartens, nurseries, schools, universities, colleges, training institutions, and institutes, effective from Sunday, March 15th, for 2 weeks (Kayed, 2020) This decision was made in response to the outbreak of COVID-19, which had become a global pandemic, to prevent the spread of the virus within educational institutions and the wider community. Consequently, the university campus was largely unoccupied during this period, significantly reducing energy consumption. In May, electricity consumption increased gradually, likely due to some relaxation of restrictions and warmer temperatures. Throughout the summer months (June to August), electricity consumption continued to grow, reaching its peak in August 2020. After the peak in August, electricity consumption started to decline again in September and continued to decline through the end of the year.
The electricity consumption data for the University of Jordan, covering all of its buildings, highlights the complexity of energy consumption patterns in such a large and diverse institution. Given the broad scope of the data, it is likely that the electricity consumption patterns for each building category (such as the hospital, schools, and administrative buildings) are distinct. A detailed investigation of each building category is necessary to gain a deeper understanding of the impact of each category on the overall electricity consumption patterns. By analyzing the electricity consumption data for each building category separately, it may be possible to identify specific factors contributing to electricity demand in each category.
The University of Jordan has a diverse range of buildings. To understand the energy consumption patterns of these buildings, the annual electricity consumption during 2019 was analyzed, and it found that the University hospital has the highest share of energy consumption at 45%, while the lowest percentage was for students’ activities buildings, with only 2%.
3.2 Energy use intensity (EUI)
A useful key performance indicator generally used to understand better the relation between the area of a building and its energy consumption is the Energy Use Intensity (EUI). In this study, the EUI investigation was limited to electricity consumption. The electricity EUI for these building categories based on the built floor area is presented in Figure 5, while the EUI based on the number of students is illustrated in Figure 6.
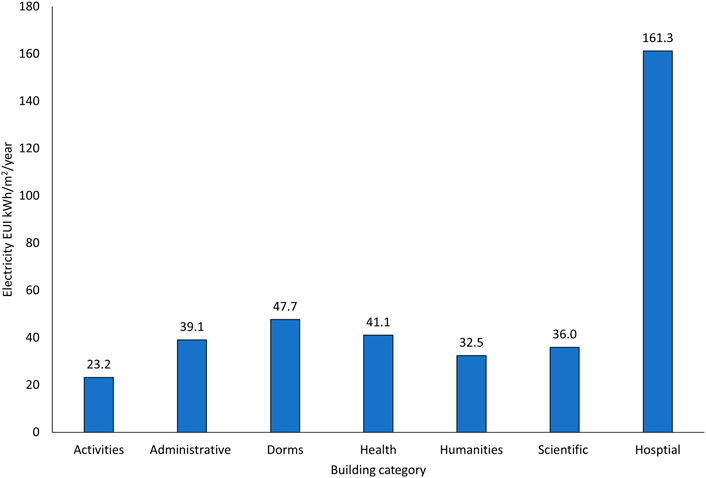
FIGURE 5. Electricity EUI for different building categories based on the built floor area.
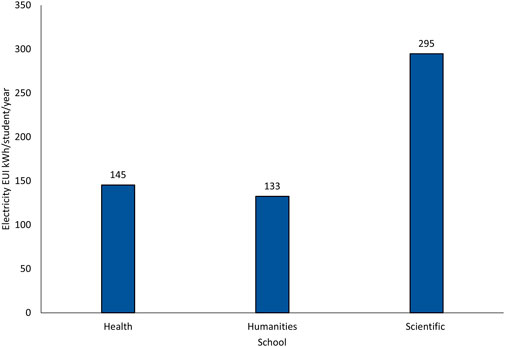
FIGURE 6. Electricity EUI for different school categories based on the number of students.
Based on these values, several conclusions about the energy usage patterns at the University of Jordan can be drawn.
• The Hospital category has an extremely high EUI value compared to the other categories. This suggests there may be significant opportunities for energy conservation in this category.
• The activities category has the lowest EUI value, while the Dorms and Health categories have the highest EUI values after the Hospital category.
• The Administrative and Scientific categories have moderate EUI values, suggesting that energy conservation efforts in these categories may also be worthwhile.
• Overall, the data suggest significant variability in EUI values across different building categories at the University of Jordan. This highlights the importance of targeted energy conservation efforts that consider each category’s specific needs and usage patterns.
• Scientific schools have the highest EUI in terms of energy per student, which is 295 kWh/student/year, compared to 145 and 133 kWh/student/year for Health and Humanities schools, respectively. The reason for the high EUI in scientific schools is primarily attributed to the widespread presence of laboratories within these schools. Laboratories require significant energy due to the specialized equipment, ventilation systems, and other energy-intensive processes involved in conducting experiments and research. Compared to simple lecture halls with lower energy consumption, laboratories consume more energy.
3.3 Impact of COVID-19 on energy consumption in different building categories
The annual drop in electric energy consumption between 2019 and 2020 in the seven building categories at the University of Jordan is a noteworthy phenomenon (see Figure 7). The most significant reduction occurred in the Humanities building, with a 39% drop in energy consumption. The other six categories experienced a range of decreases, with the Hospital building experiencing the smallest decline of 5%.
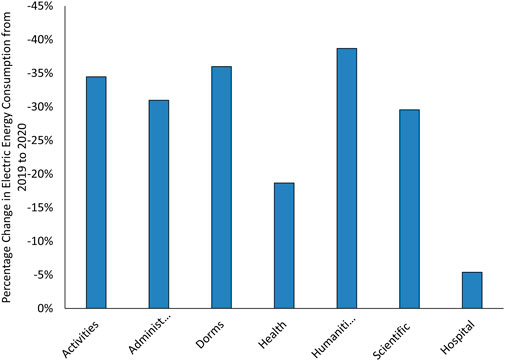
FIGURE 7. The annual drop in electric energy consumption between 2019 and 2020 in the seven building categories.
Given the significant variation in annual electricity consumption across different building types at the University, it is important to investigate the monthly electricity use of each building category to identify patterns and trends. Such analysis can provide valuable insights into the drivers of energy consumption and help develop targeted energy efficiency and conservation strategies. Overall, monthly electricity use analysis can provide a more granular understanding of energy consumption at the campus and enable more effective energy management practices.
3.3.1 University hospital
The University hospital exhibits the greatest energy consumption among the various categories of buildings, accounting for 45% of the total energy consumption. The monthly electricity consumption data for 2019 and 2020 shown in Figure 8 indicate variations in energy consumption patterns over time. The data show a decrease in energy consumption in the hospital during the partial lockdown period in April, May, and June 2020 due to the reduced number of non-essential medical procedures and surgeries. However, the data also reveal a significant increase in energy consumption in September 2020 compared to September 2019. This could be attributed to the rescheduling of delayed medical procedures and surgeries following the lockdowns imposed due to the COVID-19 pandemic. These findings underscore the potential impact of external factors on energy consumption patterns and highlight the importance of monitoring and managing energy consumption to optimize energy efficiency and identify potential areas for improvement.
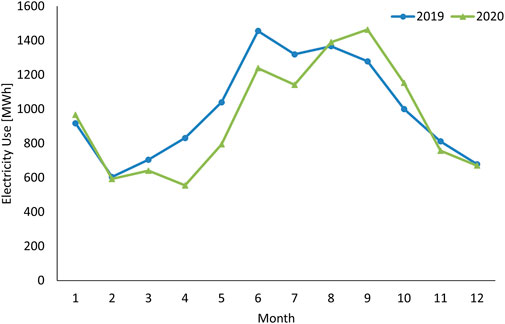
FIGURE 8. Monthly electricity use trends for the university hospital over 2019–2020.
3.3.2 Scientific schools
Scientific schools have the second highest share of energy consumption on the University of Jordan campus. The monthly electricity consumption data for these schools in Figure 9 reveal interesting patterns. In 2019, the mean monthly consumption was highest in July and lowest in June, likely due to increased academic activities and higher occupancy rates during the summer semester and the summer holiday period. However, in 2020, the mean monthly consumption for March and April was significantly lower than in other months due to the outbreak of COVID-19 and the resulting decrease in occupancy rates and academic activities, and the conversion to online teaching. It is worth noting that the overall mean monthly consumption in 2020 was approximately 33% lower than in 2019.
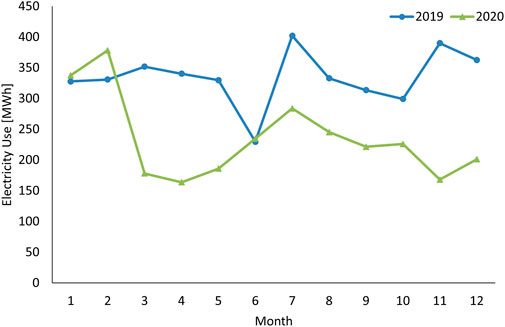
FIGURE 9. Monthly electricity use trends for the scientific schools over 2019–2020.
3.3.3 Administrative buildings
The monthly electricity consumption in administrative buildings at the University of Jordan shown in Figure 10 shows a significant 30% decrease in the annual electricity consumption in 2020 compared to 2019, coinciding with the outbreak of the COVID-19 pandemic and the subsequent implementation of full lockdown in March and April followed by the rotational scheduling, where employees worked 1 day on and 1 day off. This led to a decrease in the number of employees present in the office, which reduced energy consumption. The seasonal energy consumption pattern was still evident in 2020, with higher consumption during summer and lower consumption during winter. These findings suggest that rotational scheduling can effectively reduce energy consumption in administrative buildings, which has positive implications for energy conservation and cost savings.

FIGURE 10. Monthly electricity use trends for the administrative buildings over 2019–2020.
3.3.4 Health schools
The monthly electricity consumption data for the Health School at the University of Jordan in 2019 and 2020, shown in Figure 11, reveal an overall 19% decrease in energy usage in 2020. This drop is attributed to the transition to remote learning during the initial months of the COVID-19 pandemic. However, starting in May 2020, the Health School resumed in-person experimental and laboratory work, which likely contributed to increased energy consumption during the summer months. Nonetheless, the energy consumption pattern in the health School remained similar to that of 2019, with higher consumption during the summer months and lower consumption during the winter months. These findings suggest that even with the resumption of in-person activities, there are still opportunities to reduce energy consumption through measures such as energy-efficient practices.
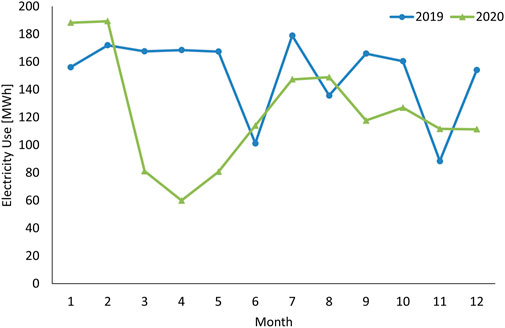
FIGURE 11. Monthly electricity use trends for the health schools over 2019–2020.
3.3.5 Humanities schools
The monthly electricity consumption of the humanities school at the University of Jordan, shown in Figure 12, was analyzed for the years 2019 and 2020. The data showed a 39% decrease in energy consumption in 2020 compared to 2019. June had the lowest consumption in 2019 due to the summer holidays, and 2020 followed the same trend but with much lower consumption. All teaching was converted to online education due to the pandemic. In addition, it is worth noting that the humanities school showed a high energy consumption in winter, especially in December, possibly due to the increased use of electric heating systems during the cold season. Despite the absence of students, there was still a significant energy consumption in the building, highlighting an opportunity for energy savings.
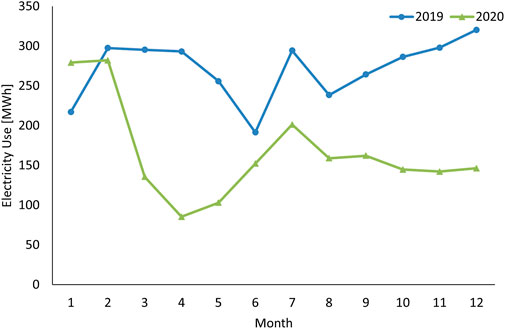
FIGURE 12. Monthly electricity use trends for the humanities schools over 2019–2020.
3.3.6 Dormitories
The analysis of actual monthly electricity consumption data for the female dormitory at the University of Jordan in 2019 and 2020 (Figure 13) revealed a significant reduction of 36% in 2020 compared to 2019. The drop in electricity consumption in the dormitory was delayed until June compared to other university buildings, likely due to higher occupancy in the dormitory during the lockdown period when international students could not travel. Furthermore, the lower electricity consumption observed in July to October 2019 and 2020 was likely due to lower occupancy in the dormitory, as not all students registered for the optional summer semester. Interestingly, the number of students and thus the electricity consumption during the first semester of 2020 continued to be very low compared to 2019 due to the adoption of online teaching by the University, which allowed students to continue their studies remotely. These findings demonstrate the impact of lockdown restrictions and student occupancy on electricity consumption in university dormitories and highlight the potential benefits of online learning in reducing energy usage.
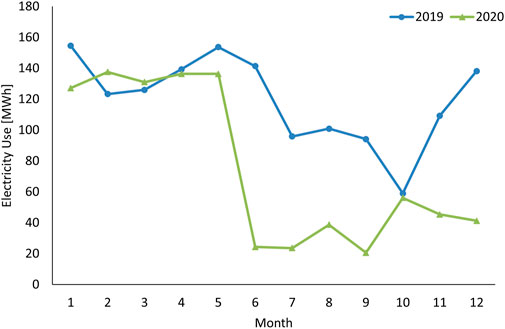
FIGURE 13. Monthly electricity use trends for the dormitories over 2019–2020.
3.3.7 Buildings for students’ activities
The analysis of monthly electricity bills for the student activities buildings at the University of Jordan during 2019 (Figure 14) showed a relatively stable consumption trend, with some fluctuations in the summer months due to reduced occupancy. In contrast, 2020 saw a significant reduction of 67.3% compared to 2019, with the largest decrease observed from March to June, likely due to the University’s closure during the COVID-19 lockdown. While the electricity consumption in the student activities buildings began to increase in the latter half of 2020, it remained significantly lower than 2019 levels. These findings demonstrate the significant impact of COVID-19 restrictions on energy usage in university buildings and highlight the need for further research to understand the long-term effects of remote learning and other changes to university operations on energy consumption.
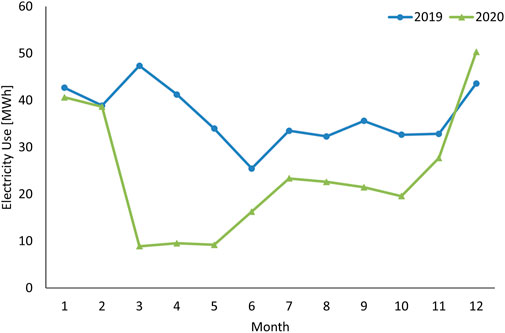
FIGURE 14. Monthly electricity use trends for the buildings for students’ activities over 2019–2020.
4 Conclusion
This paper provides a detailed and comprehensive analysis of the electrical energy consumption of the buildings within the campus of the University of Jordan during the COVID-19 pandemic. Compared to previous studies in the literature, the importance of the analysis comes from the diversity of buildings types on the campus (administration, scientific schools, art and humanities schools, hospital and health schools, commercial buildings, restaurants and residential buildings for university students). This diversity in the buildings allows the provision of more general and robust recommendations to extend the results to other institutions, particularly in developing countries. Also, the analysis enables an understanding of the extent to which the cost to transform the classical physical teaching model towards an online teaching model could be secured from the reduction in electricity bills.
By comparing the electric energy consumption between 2019 and 2020 in the seven types of buildings at the University of Jordan, it is found that an overall decrease of 20.8% was noticed between the 2 years, from 27.7 GWh in 2019 to 21.9 GWh in 2020. It is also found that the most significant reduction occurred in the humanities buildings (i.e., a 39% drop in energy consumption). This demonstrates that implementing online teaching models at the Humanities faculties might be more economically feasible than in scientific faculties. While the electrical energy consumption of hospital buildings only declined by 5% in 2020 compared to their consumption in 2019. Furthermore, the COVID-19 electrical energy consumption data suggests that the flexible working arrangements and rotational scheduling of employees can effectively reduce energy consumption in administrative buildings. However, the findings demonstrate the importance to implement energy conservation programs. Despite the absence of students, there was still a relatively high energy consumption in the building, highlighting an opportunity for energy savings. Also, the buildings of the Hospital has an extremely high EUI value compared to the other types of buildings.
The analysis of the EUI for different building categories revealed significant variability in EUI values across different building categories at the campus. This highlights the importance of targeted energy conservation efforts that consider each category’s specific needs and usage patterns. The hospital has an extremely high EUI value (161 kWh/m2/year) compared to the other categories (e.g., the EUI for humanities schools is 32.5 kWh//m2/year). Whereas, considering the EUI in terms of the number of students, scientific schools have the highest EUI in terms of energy per student, which is 295 kWh/student/year compared to 145 and 133 kWh/student/year for Health and Humanities schools respectively. Overall, this highlights the importance of targeted energy conservation efforts that consider the specific needs and usage patterns of each building.
Future research will extend the current analysis of the annual energy consumption to study the time-based power consumption per category. This is important with the evolution of time-use tariff. To do so, advanced smart metering equipment and energy management systems could also be fitted to buildings with high potential energy savings.
Data availability statement
The original contributions presented in the study are included in the article/Supplementary Material, further inquiries can be directed to the corresponding author.
Author contributions
Conceptualization OA and SN; Methodology HK; Formal analysis OA and HK; Visualization OA and MAl; Writing OA, SN, MH, HK, MAl, SA, and MAr. All authors contributed to the article and approved the submitted version.
Conflict of interest
The authors declare that the research was conducted in the absence of any commercial or financial relationships that could be construed as a potential conflict of interest.
Publisher’s note
All claims expressed in this article are solely those of the authors and do not necessarily represent those of their affiliated organizations, or those of the publisher, the editors and the reviewers. Any product that may be evaluated in this article, or claim that may be made by its manufacturer, is not guaranteed or endorsed by the publisher.
References
Agdas, D., and Barooah, P. (2020). Impact of the COVID-19 pandemic on the US electricity demand and supply: An early view from data. IEEE Access 8, 151523–151534. doi:10.1109/access.2020.3016912
Al-Abdullah, Y. M., Al-Saffar, M., Alazemi, A. M., and Sahraei-Ardakani, M. (2021). Impacts of COVID-19 on Kuwait's electric power grid. Electr. J. 34 (9), 107025. doi:10.1016/j.tej.2021.107025
Andariesta, D. T., and Wasesa, M. (2022). Machine learning models for predicting international tourist arrivals in Indonesia during the COVID-19 pandemic: A multisource internet data approach. J. Tour. Futur. ahead-of-print(ahead-of-print). doi:10.1108/JTF-10-2021-0239
Atik, I. (2022). A new CNN-based method for short-term forecasting of electrical energy consumption in the Covid-19 period: The case of Turkey. IEEE Access 10, 22586–22598. doi:10.1109/ACCESS.2022.3154044
Ayadi, O., Abdalla, O., Hallaq, Y., and Aldalabih, A. (2021). “Developing an energy benchmark for residential buildings in Jordan,” in 2021 12th International Renewable Engineering Conference (IREC), Amman, Jordan, 14-15 April 2021 (IEEE), 1–5. doi:10.1109/IREC51415.2021.9427826
Ayadi, O., Al-Assad, R., and Al Asfar, J. (2018). Techno-economic assessment of a grid connected photovoltaic system for the University of Jordan. Sustain. Cities Soc. 39, 93–98. doi:10.1016/j.scs.2018.02.011
Ayadi, O., and Al-Dahidi, S. (2019). Comparison of solar thermal and solar electric space heating and cooling systems for buildings in different climatic regions. Sol. Energy 188, 545–560. doi:10.1016/J.SOLENER.2019.06.033
Chihib, M., Salmerón-Manzano, E., Chourak, M., Perea, A., and Manzano-Agugliaro, F. (2021). Impact of the COVID-19 pandemic on the energy use at the university of almeria (Spain). Sustainability 13, 5843. doi:10.3390/su13115843
Chung, W. (2011). Review of building energy-use performance benchmarking methodologies. Appl. Energy 88 (5), 1470–1479. doi:10.1016/j.apenergy.2010.11.022
Czosnyka, M., Wnukowska, B., and Karbowa, K. (2020). “Electrical energy consumption and the energy market in Poland during the COVID-19 pandemic,” in 2020 progress in applied electrical engineering (PAEE), 1–5.
Gaspar, K., Gangolells, M., Casals, M., Pujadas, P., Forcada, N., Macarulla, M., et al. (2022). Assessing the impact of the COVID-19 lockdown on the energy consumption of University buildings. Energy Build. 257, 111783. doi:10.1016/j.enbuild.2021.111783
Kayed, M. (2020). Schools suspended, borders closed, gatherings banned as gov't responds to continued coronavirus spread. Available at: https://www.jordantimes.com/news/local/schools-suspended-borders-closed-gatherings-banned-govt-responds-continued-coronavirus.
Li, H., Jiang, T., Wu, T., Skitmore, M., Talebian, N., Jacobson, R., et al. (2023). Measuring wellbeing: A scoping review of metrics and studies measuring medical student wellbeing across multiple timepoints. J. Environ. Plan. Manag., 1–20. doi:10.1080/0142159X.2023.2231625
Litardo, J., Hidalgo-Leon, R., and Soriano, G. (2021). Energy performance and benchmarking for university classrooms in hot and humid climates. Energies 14 (21), 7013. doi:10.3390/en14217013
Mattar, S. S. A., Alnaser, S. W., and Althaher, S. Z. (2022). “Dynamic frequency analysis of the Jordanian power system with significant penetration of renewables: Lessons learnt from the COVID-19 lockdowns,” in 2022 IEEE Sustainable Power and Energy Conference (ISPEC), Perth, Australia, 4-7 Dec. 2022 (IEEE), 1–5. doi:10.1109/iSPEC54162.2022.10033011
Morva, G., and Diahovchenko, I. (2020). “Effects of COVID-19 on the electricity sectors of Ukraine and Hungary: Challenges of energy demand and renewables integration,” in 2020 IEEE 3rd International Conference and Workshop in Óbuda on Electrical and Power Engineering (CANDO-EPE), Budapest, Hungary, 18-19 Nov. 2020 (IEEE), 41–46. doi:10.1109/CANDO-EPE51100.2020.9337785
National Electric Power Company (NEPCO) (2020). Annual report 2020. Available at: www.nepco.com.jo.
Ruensukon, R., Tephiruk, N., Hongesombut, K., and Romphochai, S. (2021). “Effects of COVID-19 on electrical energy demand based on spatial analysis – a case study of Phetchaburi, Thailand,” in 2021 9th international electrical engineering congress (IEECON), 137–140. doi:10.1109/iEECON51072.2021.9440338
Scarabaggio, P., La Scala, M., Carli, R., and Dotoli, M. (2020). “Analyzing the effects of COVID-19 pandemic on the energy demand: The case of northern Italy,” in 2020 AEIT International Annual Conference (AEIT), Catania, Italy, 23-25 Sept. 2020 (IEEE), 1–6. doi:10.23919/AEIT50178.2020.9241136
Singh, M. (2020). Jordan after COVID-19: From crisis adjustment to crisis management. Washington Institute for Near East Policy. Available at: https://www.washingtoninstitute.org/fikraforum/view/Jordan-response-COVID19-pandemic-Middle-East.
Soluyanov, Y., Fedotov, A., Akhmetshin, A., and Khalturin, V. (2020). “Monitoring of electrical consumption, including self-isolation during the COVID-19 pandemic,” in 2020 ural smart energy conference (USEC), 80–83.
Tavakoli, S., Loengbudnark, W., Eklund, M., Voinov, A., and Khalilpour, K. (2023). Impact of COVID-19 pandemic on energy consumption in office buildings: A case study of an Australian university campus. Sustainability 15 (5), 4240. doi:10.3390/su15054240
Werth, A., Gravino, P., and Prevedello, G. (2021). Impact analysis of COVID-19 responses on energy grid dynamics in Europe. Appl. Energy 281, 116045. doi:10.1016/j.apenergy.2020.116045
Xu, S., Cheng, B., Huang, Z., Liu, T., Li, Y., Jiang, L., et al. (2023). Impact of the COVID-19 on electricity consumption of open University campus buildings – the case of Twente University in The Netherlands. Energy Build. 279, 112723. doi:10.1016/j.enbuild.2022.112723
Zarbakhsh, N., Misaghian, M. S., and Mcardle, G. (2022). Human mobility-based features to analyse the impact of COVID-19 on power system operation of Ireland. IEEE Open Access J. Power Energy 9, 213–225. doi:10.1109/OAJPE.2022.3155960
Keywords: pandemic COVID-19, educational buildings, electricity consumption, load profiles, energy efficiency, clean energy
Citation: Ayadi O, Alnaser S, Haj-ahmed M, Khasawneh H, Althaher S, Alrbai M and Arabiat M (2023) Impacts of COVID-19 on educational buildings energy consumption: case study of the university of Jordan. Front. Built Environ. 9:1212423. doi: 10.3389/fbuil.2023.1212423
Received: 26 April 2023; Accepted: 05 July 2023;
Published: 14 July 2023.
Edited by:
Gerardo Maria Mauro, University of Sannio, ItalyReviewed by:
Tomasz Cholewa, Lublin University of Technology, PolandMargherita Mastellone, University of Naples Federico II, Italy
Giuseppe Aruta, University of Naples Federico II, Italy
Copyright © 2023 Ayadi, Alnaser, Haj-ahmed, Khasawneh, Althaher, Alrbai and Arabiat. This is an open-access article distributed under the terms of the Creative Commons Attribution License (CC BY). The use, distribution or reproduction in other forums is permitted, provided the original author(s) and the copyright owner(s) are credited and that the original publication in this journal is cited, in accordance with accepted academic practice. No use, distribution or reproduction is permitted which does not comply with these terms.
*Correspondence: Osama Ayadi, by5heWFkaUBqdS5lZHUuam8=