 Feiyang Sun
- 1Department of Urban Studies and Planning, University of California, San Diego, San Diego, CA, United States
- 2Department of Urban Design and Planning, University of Washington, Seattle, WA, United States
- 3Department of Architecture, University of Washington, Seattle, WA, United States
- 4Department of Real Estate, University of Washington, Seattle, WA, United States
The first year of COVID-19 tested the economic resilience of cities, calling into question the viability of density and the essential nature of certain types of services. This study examines built environment and socio-economic factors associated with the closure of customer-facing food businesses across urban areas of Seattle, Washington. The study covers 16 neighborhoods (44 census block groups), with two field audits of businesses included in cross-sectional studies conducted during the peak periods of the pandemic in 2020. Variables describing businesses and their built environments were selected and classified using regression tree methods, with relationships to business continuity estimated in a binomial regression model, using business type and neighborhood socio-demographic characteristics as controlled covariates. Results show that the economic impact of the pandemic was not evenly distributed across the built environment. Compared to grocery stores, the odds of a restaurant staying open during May and June were 24%, only improving 10% by the end of 2020. Density played a role in business closure, though this role differed over time. In May and June, food retail businesses were 82% less likely to remain open if located within a quarter-mile radius of the office-rich areas of the city, where pre-pandemic job density was greater than 95 per acre. In November and December, food retail businesses were 66% less likely to remain open if located in areas of residential density greater than 23.6 persons per acre. In contrast, median household income and percentage of non-Asian persons of color were positively and significantly associated with business continuity. Altogether, these findings provide more detailed and accurate profiles of food retail businesses and a more complete impression of the spatial heterogeneity of urban economic resilience during the pandemic, with implications for future urban planning and real estate development in the post-pandemic era.
1 Introduction
In January 2020, the US began mobilizing to combat COVID-19 (Coronavirus Infectious Disease-2019), a disease caused by the SARS-CoV-2 virus (Severe Acute Respiratory Syndrome, Coronavirus, Version 2) (Covid Crisis Group, 2023). The first travel-related case of the disease in the US was confirmed by the US Centers for Disease Control and Prevention (CDC) on January 21, in the Seattle area of the state of Washington (CDC, 2020). Declared a global pandemic on March 11, COVID-19 was on track to become the deadliest pandemic the US had experienced in over 100 years (WHO, 2020). As travel bans failed to contain the outbreak, public health policies in the US aimed to suppress transmission of the virus, while increasing the capacity of the healthcare system for testing, quarantine, treatment, and the development and dissemination of vaccines.
The scale of disruption was unprecedented. The Dow Jones lost 37% of its value between February 12 and March 23, surpassing the 1929 losses of the Great Depression (Frazier, 2021). By April, stay-at-home orders had been issued in 49 US states (Covid Crisis Group, 2023, chap. 6). From March to September, more than 60 million claims for unemployment insurance were filed (Cutler and Summers, 2020). Economic projections, assuming the disease would be contained by fall of 2021, forecasted losses to GDP of $7.6 trillion, with another $8.6 trillion in losses of productivity ascribed to a forecast of 625,000 deaths and a reduced quality of life for millions more. The first deadly wave of disease in the US peaked in April 2020, but as restrictions were relaxed and communities opened up, a second wave rose further than the first, and peaked in the early days of January 2021 (IHME, 2023). As the crisis wore on, many state policies became more focused, targeting high-contact businesses, imposing occupancy restrictions, and limiting large gatherings (Covid Crisis Group, 2023).
Though COVID-19 no longer bears the status of a public health emergency in the US, the scale of the pandemic and the nature of its differential impact deserve scrutiny as public health problems we are likely to revisit in the future, and as economic problems derived in part from our built environments. The scale of the crisis was greater than most projections. By the time the declaration of emergency was lifted in the US, deaths surpassed 1.1 million and hospitalizations approached 6.2 million (US Department of Health and Human Services, 2023). The federal government deployed over $5 trillion to combat the pandemic and offer relief—an amount greater than the entire 2019 federal budget (Covid Crisis Group, 2023). Early macroscale models framed economic impacts in relation to the health benefits of physical distancing, targeted lockdowns, and stay-at-home orders (Acemoglu et al., 2020; Alvarez et al., 2020; Kruse and Strack, 2020; Newbold et al., 2020; Thunström et al., 2020; Toxvaerd, 2020; Eichenbaum et al., 2021; Farboodi et al., 2021). Microscale economic consequences are not as well understood; businesses experienced wide variations in economic impact from the pandemic (Goolsbee and Syverson, 2021; Klein and Smith, 2021; Monte, 2021; Autor et al., 2022). Cities were struck by the hollowing out of office-rich downtown cores and urban flight—shifts in the populations of office workers and residents that comprise the customer base of metropolitan central business districts (Liu and Su, 2021; Ramani and Bloom, 2021; Rosenthal et al., 2022; Hutson and Orlando, 2023). Suddenly, the characteristics of the built environment, immutable due to their inordinate agglomerated expenses and relied upon for economic performance, such as building design and urban density, were up for reconsideration by policymakers, academics, business owners, and consumers alike.
Some of the most visible effects of the pandemic were witnessed in the food retail industry, as businesses struggled, regrouped, and adapted with makeshift efforts to repurpose the built environment (Proksch et al., 2021). The size and types of food retail in a city’s neighborhoods are a key indicator of economic vitality and resiliency (Carré and Tilly, 2008; Sutton, 2010; Mehta, 2011), yet recognized as being particularly vulnerable to crisis (Bartik et al., 2020; Fairlie and Fossen, 2022). As the outbreak ensued, people began to avoid large gatherings and crowds, and to favor business types labeled “essential” (Goolsbee and Syverson, 2021). Supply chain studies describe widespread shifts in demand for retail goods and services that emerged due to the spread of the virus, changing consumer behavior and preferences, new stay-at-home and work-from-home policies, as well as disruptions to supply (Pujawan and Bah, 2021; Swanson and Santamaria, 2021; Thilmany et al., 2021; Moosavi et al., 2022). Prior to COVID-19, retail businesses and markets favored urban density, but customer preferences changed rapidly during the shock of lockdown; customer traffic relocated with the work-from-home movement, and retail managers began to re-evaluate their asset management strategies (Balemi et al., 2021; Nanda et al., 2021; Gupta et al., 2022). Many studies regarding the built environment have focused on analyzing the role of density in the spread of COVID-19, but the impact of density is not straightforward (Alidadi and Sharifi, 2022). The food retail industry, with its sensitivity to shifts in demand, its variegated pandemic policy environment, and its many business types, building forms, and neighborhood settings, could offer insights into the complex relationship between urban density and the economic impact of the pandemic.
This paper examines the effects of makeshift adaptations, the staid characteristics of business and building type, and the larger scale characteristics of urban density and socio-demographic environments within and between neighborhoods, on food retail business continuity as the first two waves of the pandemic crossed the city of Seattle, Washington (Proksch et al., 2021). The built environment is an important, ever-evolving determinant of health and wellbeing (Acuto, 2020; Rice, 2020) deserving research to improve economic resilience in harmony with pandemic health policy (Honey-Roses et al., 2020; Megahed and Ghoneim, 2020; Asif et al., 2022). The operational and built environment changes to food retail establishments in the wake of the outbreak were natural experiments, observable on the streets of cities. Investigation of these changes and their effects can provide insight into the multiscale characteristics of the built environment that support the economic resilience of neighborhoods.
2 Literature review
2.1 Food retail resilience during COVID-19
As the onset of COVID-19 became apparent in the US, food retail businesses were quickly categorized in government policies as essential, to maintain access to grocery stores and prepared foods through take-out and delivery services while suppressing transmission of the virus by limiting access to in-person activities (Goolsbee and Syverson, 2021). Whether due to fear or policy, people reacted by adjusting their social and transportation activities (e.g., Gao et al., 2021), showing a preference for essential food businesses such as grocery stores over restaurants, taverns, and pubs (Goolsbee and Syverson, 2021).
The US food retail industry suffered significant losses in business continuity. After healthcare, food services were poised to be the sector most threatened by the pandemic (Dua et al., 2020). In an early nationwide survey of small businesses, Bartik et al. (2020) found 45% of the sample either temporarily or permanently closed on 1 April 2020. Balla-Elliott et al. (2020, p. 17) found 34% of small businesses surveyed to be either temporarily or permanently closed, with another 34% operating at less than full capacity (i.e., “partially open”). Two-thirds of closed businesses involved workers operating in close proximity to one another, as found in food retail businesses such as restaurants and cafes. A study of US points of interest found food services, retail and trade to be significantly more likely to be closed than recreational and entertainment businesses (Zhai and Yue, 2022). Rates of closure for food establishments in New York City’s Chinatown were high enough to prompt researchers to shift their focus to questions of food security (Russo et al., 2022).
Researchers suggest that customers were making safety their first priority (Gursoy and Chi, 2020; Yost and Cheng, 2021). Surveys of customer concerns in the US ranked sit-down restaurants the most concerning type of retail business for COVID-19 transmission (McFadden et al., 2021). People’s impressions in the US of the safety of food establishments have been described as differing in relation to media reports, concern about the crowdedness of establishments, and according to their own risk factors for COVID (Byrd et al., 2021; Wang et al., 2021). It should be noted that research intended to explain perceptions of risk can be quite complex, and institutional environments may differ in ways that strain comparison within and between markets (e.g., Siegrist et al., 2021; Yuan et al., 2021). Public impressions are likely to differ, for example, in relation to the effectiveness of educational campaigns about public health requirements and strategies (Khorram-Manesh et al., 2021).
Influenced at least in part by regulatory requirements, public preferences in the US have been shown to contribute to a shift in foot traffic from in-person dining to grocery stores (Goolsbee and Syverson, 2021). Data from the US Department of Agriculture’s Economic Research Service showed inflation-adjusted expenditures at grocery stores, supercenters, convenience stores, and other retailers (food at home) up 19% in March 2020 compared to the same period in 2019, and food expenditures from restaurants and other eating-out places down by 29% during the same period (Dong and Zeballos, 2021). During the second quarter of 2020, the decline in expenditures at restaurants and similar establishments continued, at 38% below expenditures in 2019. In other words, the impacts of COVID-19 were not equally distributed across the types of businesses comprising the food retail industry, nor would they likely be equally distributed within a given urban area.
Studies on disruptions to supply chains often include examination of impacts to retail demand and can add depth to interpretations of the impact of the pandemic on business continuity (Pujawan and Bah, 2021; Swanson and Santamaria, 2021; Moosavi et al., 2022). Moosavi and colleagues (2022), in a literature review, bibliometric analysis, and citation analysis on supply chain management and COVID-19, found “food security” and “food supply chain” to be the fourth and fifth top keywords in search results. The most highly cited of the articles, by Ivanov (2020) and Ivanov and Das (2020), featured a simulation of the ripple effects of COVID-19 in supply chains, including the simultaneous impacts of attenuated demand from customers and impacts to supplies due to lockdowns and barriers to logistics. Notably, supply chain studies have forecasted and drawn attention to spikes in demand such as panic buying (Yuan et al., 2021), and spikes in demand for healthcare services (Govindan et al., 2020) as well as declines, disruptions, and plunges in demand in other sectors, including food services (Akseer et al., 2020). The bibliometric literature review from Swanson and Santamaria (2021) on the topics of “pandemic” and “supply chain” reaches back to 1997, pulling together analyses of influenza as well as COVID. Authors emphasize the fundamental differences between the disruptions posed by pandemics in comparison to other types of events and suggest how limited current knowledge is of these “black swan” events, while offering advice on further research and modeling. Recommendations from these studies to improve resilience include flexibility and redundancy (Moosavi et al., 2022), and elevating the importance of safety, digitalization, and supply-base localization (Pujawan and Bah, 2021). Many of the same themes exist in empirical studies focused on food retail performance in the US.
Though many establishments closed, many also responded in a variety of ways to the restrictions and to the concerns of customers, which persisted even as restrictions were lifted (Goolsbee and Syverson, 2021). Grocery stores marked sidewalks, controlled occupancy to store interiors, made disinfectant available, and invested in contactless point-of-sale equipment; some also reconfigured uses of space to promote drop off and pick up service (Proksch et al., 2021). Restaurateurs and cafe managers adopted highly visible, customer-facing hygiene and health protection measures, changed operating hours and employee roles and responsibilities, offered new or limited menu items, and expanded communications with their customers through signage and online sites (Norris et al., 2021; Proksch et al., 2021; Russo et al., 2022; Yenerall et al., 2022; Bonfanti et al., 2023; Mandhan and Gregg, 2023). Within their existing building spaces and public rights-of-way, some businesses expanded or re-configured their use of space for indoor storage, exterior-facing contactless payment and take out, drive-thru services, and outdoor dining experiences (Proksch et al., 2021; Mandhan and Gregg, 2023). These makeshift adaptations to the built environment were accompanied by online and financial efforts. Digitalization expanded and took many forms, such as web sites, online ordering, options for customer pick up, store-run delivery services, and third-party apps for ordering and/or delivery (Brewer and Sebby, 2021; Norris et al., 2021; Proksch et al., 2021). Many also sought financial support, through the Paycheck Protection Program and a variety of other instruments, such as the COVID-19 Economic Injury Disaster Loan Program (Autor et al., 2022; Barraza et al., 2020; U.S. Small Business Administration, 2023).
2.2 Questioning the role of density in COVID-19
There have been many studies suggesting a positive relationship between population density and the incidence of COVID (Ganasegeran et al., 2021; Ilardi et al., 2021; Lee et al., 2021; Qeadan et al., 2021; Sarmadi et al., 2021; Tchicaya et al., 2021; Wong and Li, 2020; Jamal et al., 2022), and many studies showing a negative or insignificant correlation (Hamidi et al., 2020; Klompmaker et al., 2021; Perone, 2021; Basellini and Camarda, 2022). These differences in findings exist on a variety of scales, from the state (Ganasegeran et al., 2021; Ilardi et al., 2021; Perone, 2021; Sarmadi et al., 2021; Tchicaya et al., 2021; Basellini and Camarda, 2022), to county (Hamidi et al., 2020; Wong and Li, 2020; Klompmaker et al., 2021; Lee et al., 2021, p. 202; Qeadan et al., 2021; Jamal et al., 2022), to more local levels (Tribby and Hartmann, 2021; Almagro and Orane-Hutchinson, 2022; Laefer and Protopapas, 2022; Sun et al., 2022). Findings suggest the effects of density have differed over time as well (Lee et al., 2021; Carozzi et al., 2022; Wu et al., 2022; Tsou et al., 2023). Some differences in outcomes may be traced to differences in research methods, such as cluster analysis (Fan et al., 2022; Wu et al., 2022), the application of indexes built from multiple variables (Rahman et al., 2023), and the use of advanced statistical methods to control for endogeneity of density measures (Carozzi et al., 2022; Hong and Chakrabarti, 2022). Other differences may result from different control variables used in models (Teller, 2021; Zhang et al., 2022), and different cultural, policy and institutional contexts (Hasnat, 2022). That said, socio-economic factors (e.g., income, ratio of minority group) are commonly considered across many studies, with benefits for their findings and interpretation (Benita et al., 2022; Carella et al., 2022; Choi and Denice, 2022; Huang et al., 2020; Kang et al., 2020; Loomba et al., 2021; Paul et al., 2021; Rahman et al., 2023; Schmiege et al., 2023; Tang et al., 2021; Tsou et al., 2023; Verma et al., 2021; Wang et al., 2021).
Population is not the only meaningful measure of density for understanding the impact of COVID-19. Studies that use less common sources of data, such as mobility traces (Liu et al., 2021) or records of COVID transmission at scales smaller than the county, provide the basis for more promising hypotheses about the role of density in COVID transmission. These studies suggest that connectivity (Jo et al., 2021; Almagro and Orane-Hutchinson, 2022; Carozzi et al., 2022), customer density (Laefer and Protopapas, 2022), crowding (Lee et al., 2021; Almagro and Orane-Hutchinson, 2022; Schmiege et al., 2023) or contact density (Verma et al., 2021) might be more meaningful indicators.
The most common question asked in these studies is one that can be reasonably inferred from the airborne transmission of the virus, which is the effect of population density, alone or in connection with socio-spatial connectivity and socio-demographics, on rates of transmission, incidence of disease, and mortality (Dietz et al., 2020; Liu et al., 2021). This same question drives urban planners, architects, and engineers to draw normative conclusions for improving urban design, by integrating the aims of design with health (Megahed and Ghoneim, 2020). While COVID transmission is important to understand and predict for its spatial distribution, research on COVID transmission should not be equated to research on business continuity. Fewer studies attempt to distinguish between density, the incidence of COVID-19, and business continuity, though all three factors may be related.
To understand the relationship between business continuity and the built environment during COVID-19, reviews of the literature should take a broader perspective, reaching business, economic, and real estate literature (Table 1). Balla-Elliott et al. (2020), for example, finds that small businesses took cues from the restrictions put in place by government when contemplating the prospects for reopening business, while restrictions, in turn, correlated with the prevalence of COVID-19 in the population, as well as density at the county level. In a study specific to restaurant closures in major US cities, Sedov (2022) found a positive relationship between closure and the density of establishments within a 500-m radius, as well as proximity to the city center. However, the study relied on “Yelp” records for indications of business closure. Wang et al. (2022b), in an intriguing study of data regarding visits to the 100 largest restaurant chains in the US from July 2020 to May 2021, found a 1% increase in COVID cases associated with a 2.5% decrease in restaurant visits in the period prior to the availability of vaccines. Stepping outside of the US, it is important to note the paper by Jun et al. (2022), examining effects at the neighborhood level on business closure across the city of Seoul, Korea, including the number of businesses, employment density, population density, and other demographic and economic variables, such as income. Business survival was negatively associated with the number of businesses and employment density. Furthermore, the study clustered businesses according to their amenities, finding that though the replication of amenities across stores in proximity to one another was a common strategy prior to the pandemic, this feature worked against stores during the pandemic.
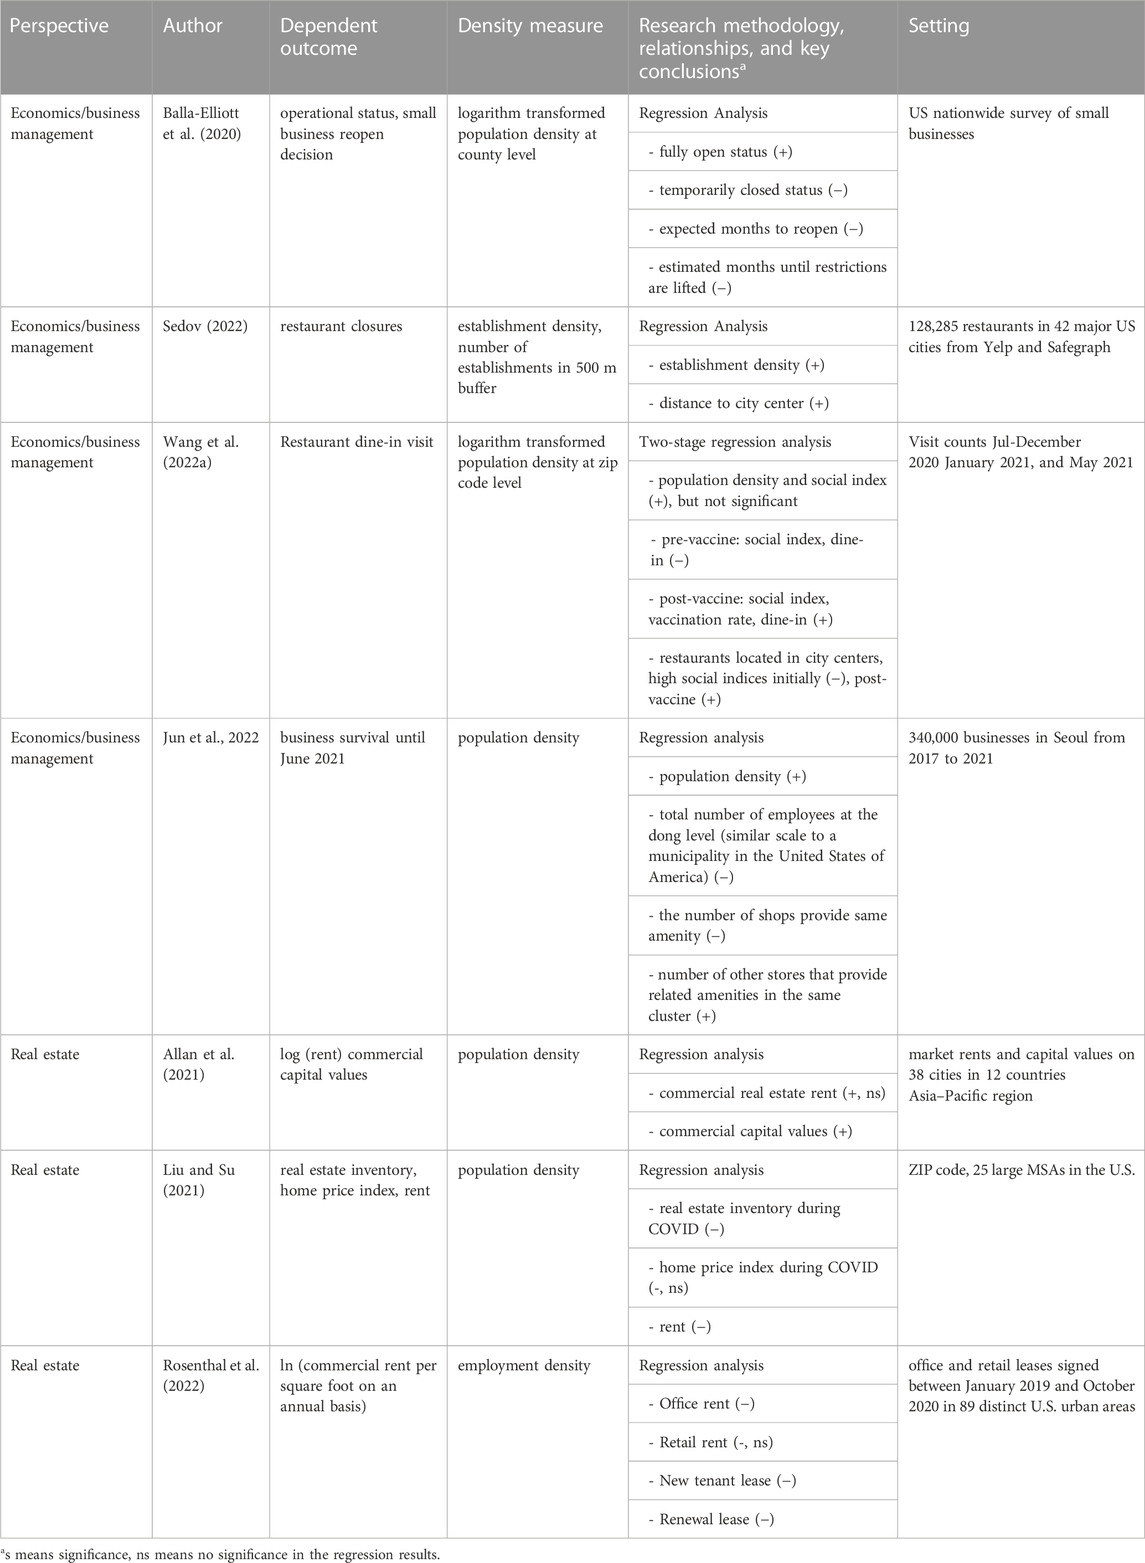
TABLE 1. Density and COVID risk: summary of literature.
Studies focused on business closure and business characteristics run the risk of missing the effect of greater movements of the population defined or indicated by shifts in markets for housing, office, and retail real estate. Note, in this context, Ramani and Bloom’s (2021) description of the hollowing-out of the population from the downtown core, either to work-from-home in residential suburbs or to take flight to more distanced residence. The advent of work-from-home policies and urban flight—in addition to previously mentioned public concerns, policies, and shifting preferences—change the foundations for understanding the effects of the pandemic on urban markets for retail, including the survival and closure of food retail stores and services. COVID-19, for example, did lead to a strong shift in housing demand in the US, especially within densely populated neighborhoods and central cities (Liu and Su, 2021). Research suggests that work-from-home policies opened the possibility for people to relocate outside of densely populated areas; a possibility incentivized by the relatively high cost of housing in dense urban areas in addition to concern for exposure to COVID. Relatedly, an examination of the changing value of commercial rent across 89 US urban areas found steeper declines, compared to pre-COVID times, in the value of commercial real estate in metropolitan city centers that are characterized by enough density to support vibrant transit systems, such as subways, commuter rail, and bus rapid transit (Rosenthal et al., 2022).
2.3 Research question and contribution
The purpose of this research is to help distinguish the role of the built environment in mediating pandemic disturbance to business continuity. As a disruption in otherwise slowly shifting urban economic environments, the pandemic occurred in waves, coupled with public health policies designed to suppress transmission of the virus, prior to the dissemination of vaccines. Policies were intended to be applied uniformly across urban settings, yet disruptions to business continuity (i.e., risk to economic resilience) were not uniformly distributed. What explains spatial variation in business continuity? This study is designed to improve understanding of the role of the built environment in the spatial heterogeneity of business continuity during the first year of the pandemic, using the food retail sector as a proxy for the urban economy.
The target construct for this study views COVID-19 and subsequent policies and behaviors as one bundled source of disruption in an otherwise functioning urban economy. The built environment mediates such disruptions and contributes to the spatial heterogeneity of food retail business continuity in several plausible ways. The built environment is implicated at the scale of the business location because policies and behavioral preferences differed in terms of type of business operations and in terms of the uses of indoor and outdoor space (e.g., Gursoy and Chi, 2020; Goolsbee and Syverson, 2021; Yost and Cheng, 2021). Built environments, at a more aggregate scale, differed for urban density and demographic compositions of the customer base of businesses, and for qualities that manifested through the adoption of stay-at-home and work-from-home policies, and behaviors such as urban flight (e.g., Swanson and Santamaria, 2021; Thilmany et al., 2021). The aim of this research is to untangle conflicting explanations of the relationship between density and business continuity in the literature, and to understand the effects of actions the businesses took themselves to maintain continuity, which include makeshift changes to the operation and the site of businesses.
Besides the direct mediating effects of built environments, spatially heterogeneous disruptions can also be observed due to associations between built environments and other mediators, with financial relief (loans, grants, rent relief) and the digitalization of services (websites for ordering, payment, pickup and delivery services) being the most commonly discussed (Barraza et al., 2020; Brewer and Sebby, 2021; Norris et al., 2021; Autor et al., 2022). Though these policies and approaches were designed to be applied uniformly across urban settings, they could have had heterogeneous spatial effects as they were adopted by different businesses and in different neighborhoods. Due to the difficulty of collecting business-level financial relief and digitalization information at the city scale, this study design does not allow us to distinguish the direct effect of built environments and the indirect effect through associations with these other mediators. However, this study discerns the latent vulnerabilities—either vulnerability as a lack of resilience to disruptions or vulnerability as ineffectiveness in adopting countermeasures—in urban built environments, and the capacity to adapt at the pace of widescale waves of disruption. Follow-on research could, for example, combine the independent variables in this study with evidence of financial relief and digitalization, apply the same independent variables in an examination of business continuity in urban areas that were subject to different sets of public health policies than Seattle, or seek to generalize results in suburban and rural settings.
As an evaluation of a natural experiment, this research is designed to identify associations between selected independent variables and the dependent variable of open or closed status of food retail businesses. The unit of analysis is the business (per location, not per organization), inclusive of its surrounding environment. It is a repeated cross-sectional study of the full population of food retail businesses (n = 921) in a purposive sample of 16 neighborhoods (44 census block groups) across the metropolitan city of Seattle. As a matter of interest to policymakers, this research design is selected to provide for external as much as internal validity (e.g., minimizing individual unit and contextual selection bias). The sampling of neighborhoods (i.e., collections of census block groups) is designed to encompass the business districts of neighborhoods (containing the full complement of food retail business types and building types within neighborhoods), to maintain representativeness with the city at large for controlled covariates (e.g., socio-demographics and economics), to maximize the variance of independent variables (e.g., population density, employment density, land use mix), and to rule out alternative plausible explanations of business closure at the scale of the census block group and/or neighborhood (e.g., protests, educational pivots to remote learning). The data representing many variables pre-dates the pandemic, giving research design the characteristics of a pre- and post-test, with post-tests carried out during each of the first two waves of pandemic (prior to the dissemination of vaccines).
As illustrated in Figure 1, this study examines factors hypothesized at the business and neighborhood level to influence pandemic food retail business continuity, applying new data and methodologies to examine effects that remain either mixed or unclear in the literature. This study contributes to current literature in several ways. First, as desirable as field research might have been, we are unaware of any other studies that were able to provide in-person documentation of ground-level details of built environment changes during the first wave of COVID-19 (Megahed and Ghoneim, 2020; e.g.; Russo et al., 2022; Liu et al., 2021). Thus, this study adds to the existing body of literature by generating more detailed and accurate profiles of food retail businesses in situ and in relation to business continuity during this critical time period (Proksch et al., 2021). Secondly, this study compares different types of urban density measures, quantifying thresholds of urban population and employment density, plus land use mix in relation to business continuity. By examining density measures besides population density in a repeated post-test, the study helps provide clarity to conflicting interpretations of the role of urban density found in the literature.
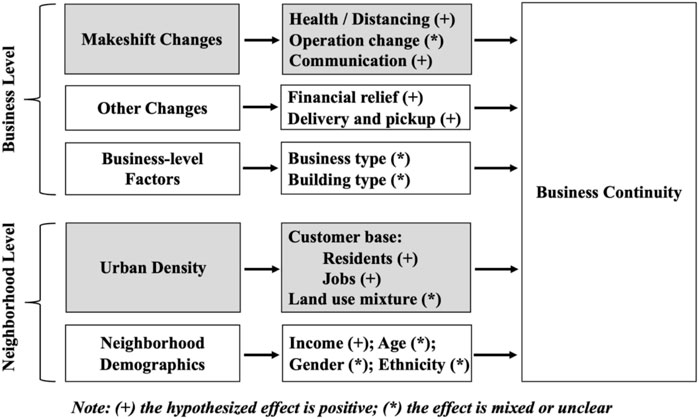
FIGURE 1. Conceptual framework. The business level linkages describe makeshift business-side changes and factors such as business type and building type. The neighborhood level linkages describe consumer-side changes in the built environment, and with factors that include population density, employment density, and land use mixture, as well as neighborhood demographics. The highlighted boxes are the main interests of this study.
This study also implements a novel methodological approach that combines the advantage of variable selection and cluster detection of a classification and regression tree analysis with the convenience of interpretation of a regression model. This is a useful methodology for studies that attempt to model correlated urban design and built environment factors. The methodology, combined with domain knowledge, is intended to provide a causal discovery approach to model nonrandomly implemented urban design and built environment interventions collected from observational data (Leist et al., 2022). However, it is essential to acknowledge that the set of variables used in this study is not exhaustive, leaving room for potential confounding effects. As a result, while our results demonstrate statistical associations, we cannot definitively confirm causation due to the inherent limitations of observational data.
3 Data and methodology
3.1 Study setting
The city of Seattle is the center of a metropolitan area within the Puget Sound region of the state of Washington. The city contains the largest urban population in the state and is home to several noteworthy companies in information technology, biotechnology, and health sciences. The greater Seattle area of King County has been the subject of several studies of the effects of COVID-19 (e.g., Liu et al., 2021). Its well-coordinated corporate and civic culture and high proportion of the workforce in technology are credited with the city having 50% of the population work from home during the pandemic (Balk, 2022). The first case of a US patient testing positive for the SARS-CoV-2 virus occurred on 21 January 2020, in a suburb of Seattle, Washington (Gallagher, 2020). The following section describes the policy environment that took shape as the pandemic arrived and this study began.
On 29 February 2020, Governor Inslee issued a State of Emergency for Washington State and King County, where Seattle is located (Washington Governor, 2020a). Public activities were gradually curtailed until March 15, when King County ordered all gatherings of 50 or more persons to cease and, particular to the food retail industry, declared (King County, 2020a).
• Restaurants, bars, dance halls, clubs, theaters, health and fitness clubs, and other similar indoor social or recreational venues must cease operations until 31 March 2020
• Restaurants and food service establishments may remain open only for drive-through, delivery, and pick-up only, until 31 March 2020
• All other retail such as groceries, pharmacies, banks, gas stations, hardware stores, shopping centers, etc. may remain open provided they meet Public Health directives in the previous Local Health Order
On March 23, Governor Inslee announced the “Stay Home, Stay Healthy” order (Washington Governor, 2020b), requiring Washingtonians to stay home except for essential activities, asking people to stay at least six feet from one another when outside, and closing all businesses except those deemed essential, such as grocery stores. This was followed by a series of proclamations defining a phased, scientific approach to reopening (Washington Governor, 2020c). As of June 1, measures such as trends in hospitalization were to inform decisions for each County to move through phases of a reopening plan. Physical distancing and the use of personal protective equipment were to be maintained (among other requirements), while occupancy rates could be gradually increased in each phase of reopening. On June 3, with known infection rates in decline, King County, including Seattle, placed an application for a “modified” phase 1 opening which, as approved on June 5, allowed retail stores to open at 30% or less of maximum occupancy and for restaurants and bars to open for 25% of indoor and 50% of outdoor occupancy (King County, 2020b; King County, 2020c). By June 19, King County advanced to phase 2 of the State’s reopening plan, allowing 50% indoor occupancy of restaurants, bars, and similar establishments (King County, 2020d).
Witnessing a resurgence of the virus, on 16 Nov 2020, Governor Inslee once again ordered all restaurants, cafes, and such to eliminate in-person dining, resorting to take out and delivery services for a period of 4 weeks (Washington Governor, 2020d). After a surge of cases over the holiday season, Governor Inslee announced a new “Healthy Washington” plan on January 5th, to bring the state toward reopening in 2021 (Washington Governor, 2021).
3.2 Data collection
From May to June 2020, the research team conducted a three-part protocol to collect and validate data on the population of food retail establishments in a selection of 44 census block groups, comprising 16 neighborhoods, geographically distributed throughout the city of Seattle (Figure 2) (Proksch et al., 2021). The neighborhoods were purposely selected to cover Seattle’s Urban Centers and Hub Urban Villages, identified in the comprehensive plan as centers driving local and regional growth. The sampled neighborhoods were demographically similar to the average characteristics of the city, while also indicative of the variety of socio-economic and demographic characteristics of its neighborhoods. Parts of downtown Seattle and the Capitol Hill neighborhood (northeast to downtown Seattle) were excluded to avoid the introduction of confounding variables caused by protests and riots during that time. The area in the vicinity of the University of Washington campus was also excluded from the sample, as the shift to remote instruction and physical absence of the student body created its own significant impacts to food retail establishments.
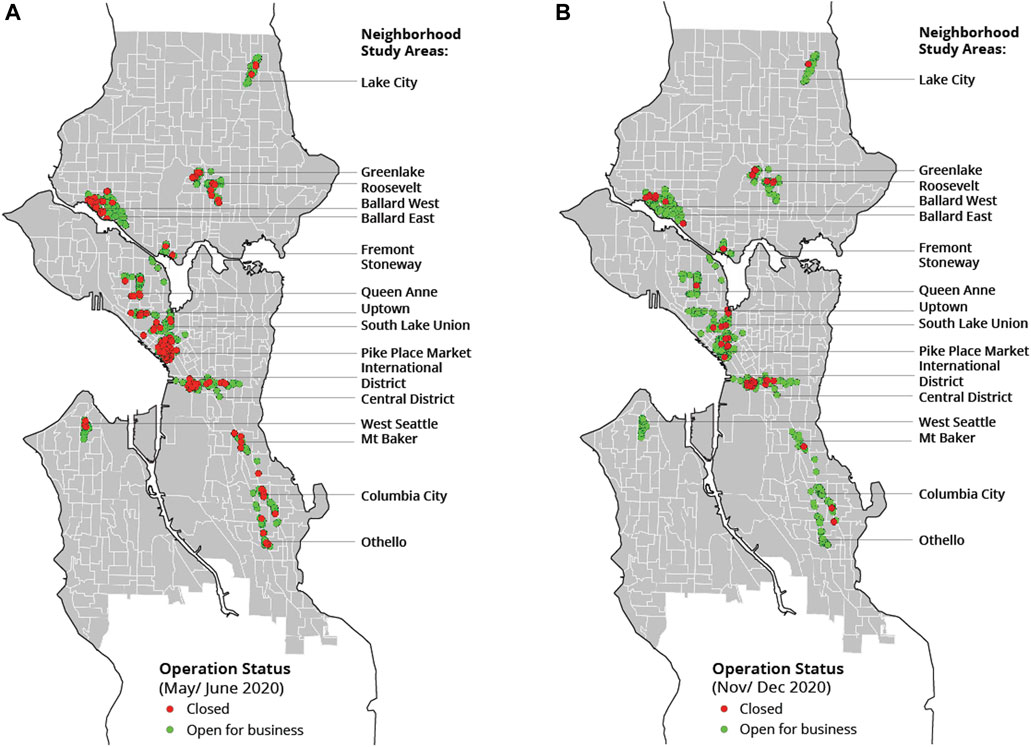
FIGURE 2. Operation Status of Food Retail Businesses in the Sampled Neighborhood Areas in Seattle, Washington. The neighborhoods were selected to cover the majority of Urban Centers and Hub Urban Villages identified in Seattle’s comprehensive plan as key urban growth centers. Field observations, followed by phone calls, identified and confirmed the operation status of food retail establishments (n = 921) across 16 neighborhoods (44 census block groups) over two peak pre-vaccination time periods of COVID-19.
Data collection began with King County food permit data from 2018, joined in May 2020, with Google Knowledge Panel data to append to and update the listing of businesses, along with census data and zoning information. Then, from May to mid-June of 2020, the team conducted field surveys administered with a Google Form and a guide for photographic documentation to provide in-person validation of the number, identification, location, visible indoor and outdoor built features and makeshift changes, and status of the businesses in the selected block groups. To alleviate any doubt about open or closed status, phone calls were made to all businesses. There were 921 food retail businesses found in the sample of neighborhoods. This is the total population of the 44 census block groups selected for study, which amounts to 17% of all food retail businesses in the city of Seattle. The research team conducted a follow-up field and phone survey to obtain updated information on business operations and closure between November and December 2020. To maintain the consistency of field observation in the two time periods, the team maintained the Google form to guide the collection of information and were instructed to follow the same protocol to provide uniform photo and phone documentation of each visited business.
The research team also conducted structured interviews with a limited set of food businesses about their financial situation and digitalization activities from November to December 2020, as a supplement to the field surveys. In total there were 82 food businesses interviewed, distributed among 27 census block groups. The interview asked about business ownership, rent relief, and financial relief, and changes in comparison to 2019 in hours of operation, usage of online delivery, percentage of pick-up orders, levels of employment, labor costs, food costs and revenues.
3.3 Data processing
The outcome variable of interest is open or closed status per business in each time period of study (May through June and November through December 2020). Open or closed status has been used as an indicator of economic resilience in recent literature (Jun et al., 2022; Karniouchina et al., 2022; Li et al., 2022). Neighborhood characteristics were first obtained at either census block group level or parcel level and grouped into two domains: density measures and socio-demographic characteristics.
We used three density measures: population density, employment density, and land use mix entropy. Both population density (Alidadi and Sharifi, 2022; Carozzi et al., 2022; Schmiege et al., 2023; Diao et al., 2021; Ganasegeran et al., 2021; Hong and Chakrabarti, 2022; Huang et al., 2020; Kadi and Khelfaoui, 2020; Lee et al., 2021; Lima et al., 2021; Paul et al., 2021; Rahman et al., 2023; Sun et al., 2020; Tsou et al., 2023) and employment density (Allan et al., 2021; Jo et al., 2021; Liu and Su, 2021; Rosenthal et al., 2022; Rahman et al., 2023) are popular measurements of urban density in recent COVID-19 related articles. Hamidi et al. (2020) proposed the use of activity density (population and employment per square mile); we contend that separating employment from population density helps to disentangle the impact of work-from-home orders from population migration during COVID. We also controlled for the land use mix entropy, which is a traditional measure of urban form from the economic agglomeration literature (Cervero and Kockelman, 1997; Cervero and Duncan, 2003), and has been used in other similar studies as well (Haddad et al., 2023; Nguyen et al., 2020; Wu et al., 2022).
For each neighborhood-level variable, an average value was calculated for each business with all census blocks or parcels that overlap within a one-quarter-mile radius buffer surrounding the business. The choice of one-quarter-mile radius is based on the established walkability literature (Ewing et al., 2011; Pivo and Fisher, 2011; Ameli et al., 2015; Ewing et al., 2016; Park et al., 2019). Additional business characteristics obtained from the field survey were grouped into two domains: general business characteristics (including immutable built environment conditions, such as available parking onsite and offsite) and indoor and outdoor makeshift changes. The idea that the built environment contains makeshift or temporary characteristics pre-dates the pandemic, whether as rhetorical flourish in the examination of the history of cities (Rybczynski, 2010) or as empirical classification separating pop-up from more permanent retail establishments (Hietanen et al., 2016). Pandemic research (e.g., Ali et al., 2021) and casual observation of new options for outdoor dining (e.g., Gold, 2020) also use the term. In Makeshift Metropolis: Ideas About Cities, Rybcynski (2010), 12), defines the “makeshift metropolis” as an “unplanned, almost anarchical area for individual enterprise.” The “makeshift” changes in the built environment observed during the early phase of the pandemic can be seen as anarchical advances of individual businesses to improve the potential for business success in an urban environment in transition. All variables, also described in Supplementary Table S1, were processed using QGIS 3.16.16 and R 4.2.3.
3.4 Methodology
The modeling flow is illustrated in Figure 3. The study uses classification and regression tree (CART) analysis to first select and identify possible combinations and thresholds that are most important to business continuity. We then combine the outputs with a negative binomial regression model to estimate their effect sizes. The CART analysis is a tree-based recursive binary splitting algorithm that selects, at each step, the variable and cutoff threshold with the strongest association with the outcome (i.e., business open or closed status) and performs a binary split of the data according to that variable (Hothorn et al., 2006). Further partitioning occurs on top of prior partitions, maximally sorting observations into groups or combinations based on the cutoff value at each splitting variable. Its main advantage over regression models is that CART models allow the existence of correlations among variables without biasing model performance. It has been used in prior studies with similar urban contexts to address correlated design and locational predictors, such as bus stop amenity changes affecting ridership (Shi et al., 2021), and store locations influencing customer shopping choices (Hounwanou et al., 2018).
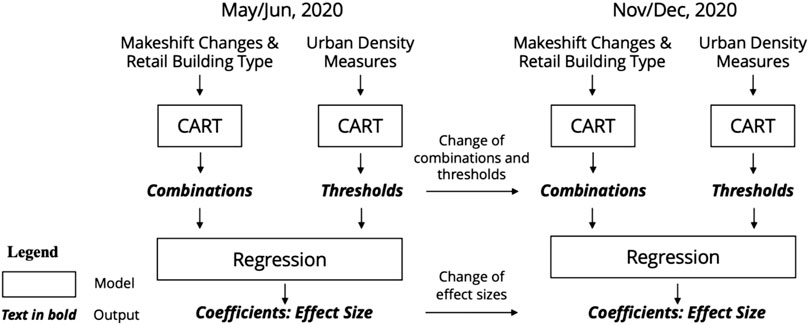
FIGURE 3. Modeling Flow Diagram. Classification and regression tree analysis (CART) was applied to identify combinations and thresholds of variables statistically significant to the business continuity of food retail establishments within and across 16 neighborhoods over two time periods. CART results were used as predictors in negative binomial regression analysis to estimate the size of the effect or association of the variables on operation status.
Makeshift changes were implemented during and in response to the pandemic and related policy. As suggested in literature (e.g., Saelens and Handy, 2008), business-level changes are not selected at random but in combination, with several types of strategies implemented in accordance to the physical constraints of a business’s building type (e.g., storefront, individual building, food court). Similarly, urban density measures are spatially clustered and can have a nonlinear relationship with retail performance. Therefore, CART analysis was used in our study to identify the combinations of makeshift changes and building types and thresholds of urban densities most relevant to business continuity.
We produced two sets of CART models. The first set identified combinations of the most important makeshift changes (i.e., distance marks and customer counters) and associated building types (i.e., walkable storefront and food court) for businesses. The second set of models selected the most important density measures and formed threshold measures of density relevant to business continuity at the neighborhood level. Business open or closed status in each period of survey (May to June and November to December 2020) were used as the outcome variables in the CART analysis.
In applying CART analysis to the two time periods, the analysis identifies the most statistically significant factors in each period and shows how these factors change between the two periods of study (May to June and November to December 2020). This is particularly useful to understand how estimations of the effect of urban density are influenced by the type of measurement and the timing of the study period. It may also be potentially illuminating for unresolved questions in the literature about the role of density in the economic impacts of COVID-19.
As CART analysis does not provide direct estimations of the size of the effects of generated classifications, negative binomial regression models were developed following CART analysis. The makeshift combinations and urban density thresholds from the CART models were introduced as predictors in the negative binomial regression models, with business open or closed status from May to June and November to December 2020, as the dependent variables. Additional controlled covariates included business primary type, neighborhood median household income, and percentage of non-Asian people of color. The choice of negative binomial regression models was based on the presence of over-dispersion in the outcome variables.
4 Results and findings
4.1 Summary statistics
Table 2 provides summary statistics. The field survey during May and June 2020, found 25% of food retail businesses closed. The repeated survey in November and December found a slight recovery, with about 14% of businesses closed. Figure 2 shows the spatial distribution of business operation status in the two periods. The majority of businesses in the sampled neighborhood census block groups were restaurants, though all forms of customer-facing food businesses were included in the sample, including grocery stores, convenience stores, supermarkets, quick service and/or fast-food stores, cafes, bakeries, coffee shops, taverns and pubs. Note that business types aggregate small groceries and convenience stores with supermarkets to form a food retail category. Similarly, coffee shops are merged with bakeries, pubs, and taverns, and other miscellaneous, yet customer-facing, food service establishments.
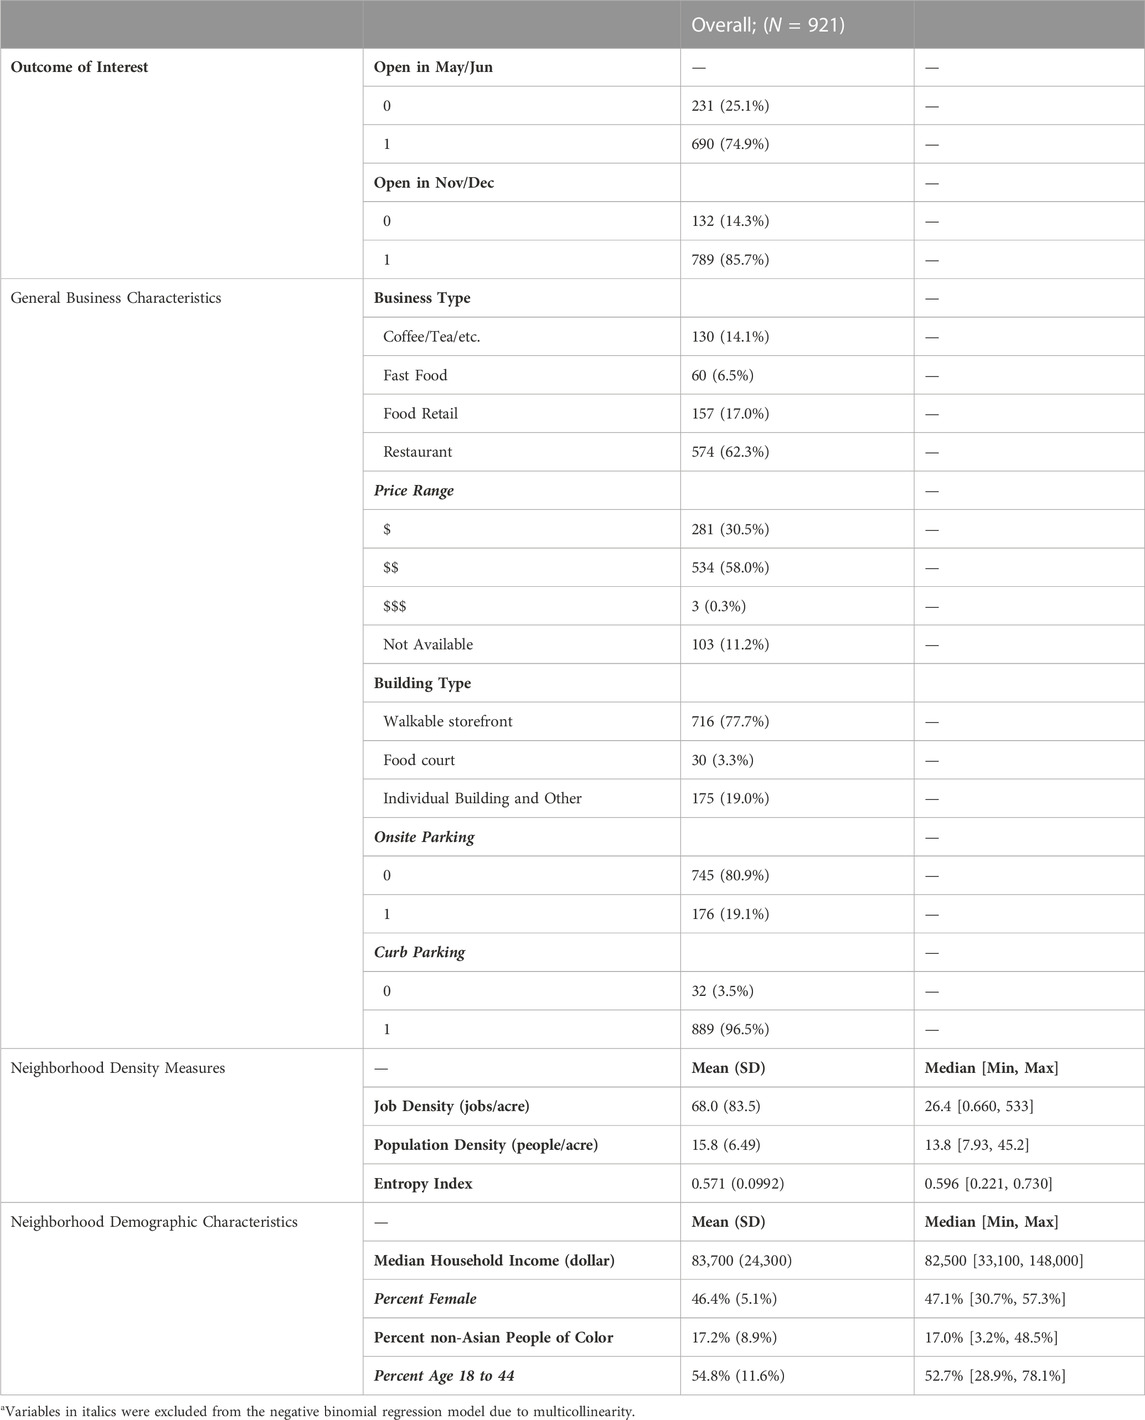
TABLE 2. Summary statistics: open/close, neighborhood characteristics, business general characteristics.
Businesses were situated in a wide variety of urban and architectural settings. A majority of businesses in the sample were situated along walkable storefronts. Only about 3% of the surveyed food businesses were located in a food court, as would be found inside of an indoor shopping mall or office complex. Many were housed in individual buildings (e.g., standalone buildings, drive-through facilities, and former single family residential facilities). Based on our field survey, 20% of businesses had onsite parking, though most businesses were located within 100 feet of curbside parking.
Employment density averaged 68 jobs per acre. The average residential population density was slightly fewer than 16 persons per acre, which is to be expected in a city with nearly half of the land area zoned for single family residential use. Other characteristics obtained from the American Community Survey included household income, racial composition, and age range. Mean aggregate household income within walking distance of the sampled retail businesses (about a quarter-mile) was USD 83.5 thousand. The median age of persons living within walking distance of the businesses was within the 18–44 age cohort.
Table 3 summarizes the makeshift changes found in use by food retail businesses. These are changes made to both outdoor and indoor areas of establishments, documented by type of business in May and early June 2020. Signage, posted on the store window, wall, or sidewalk, is the most common outdoor change adopted, possibly due to its low cost of implementation and to its obvious use to signal that the site is open for business. Other changes were observed with much less frequency. These include customer counters or outdoor pickup tables, to provide distance between customers and employees and facilitate customer pick-up of prepared food, often changing the point of sale. They also include indicators for customers to use to reinforce social distancing, and materials such as hand sanitizer. Note differences in the frequency of strategies observed between business types. Compared with other business types, restaurants have a higher percent adoption rate of signage and a lower percent adoption rate of customer counters.
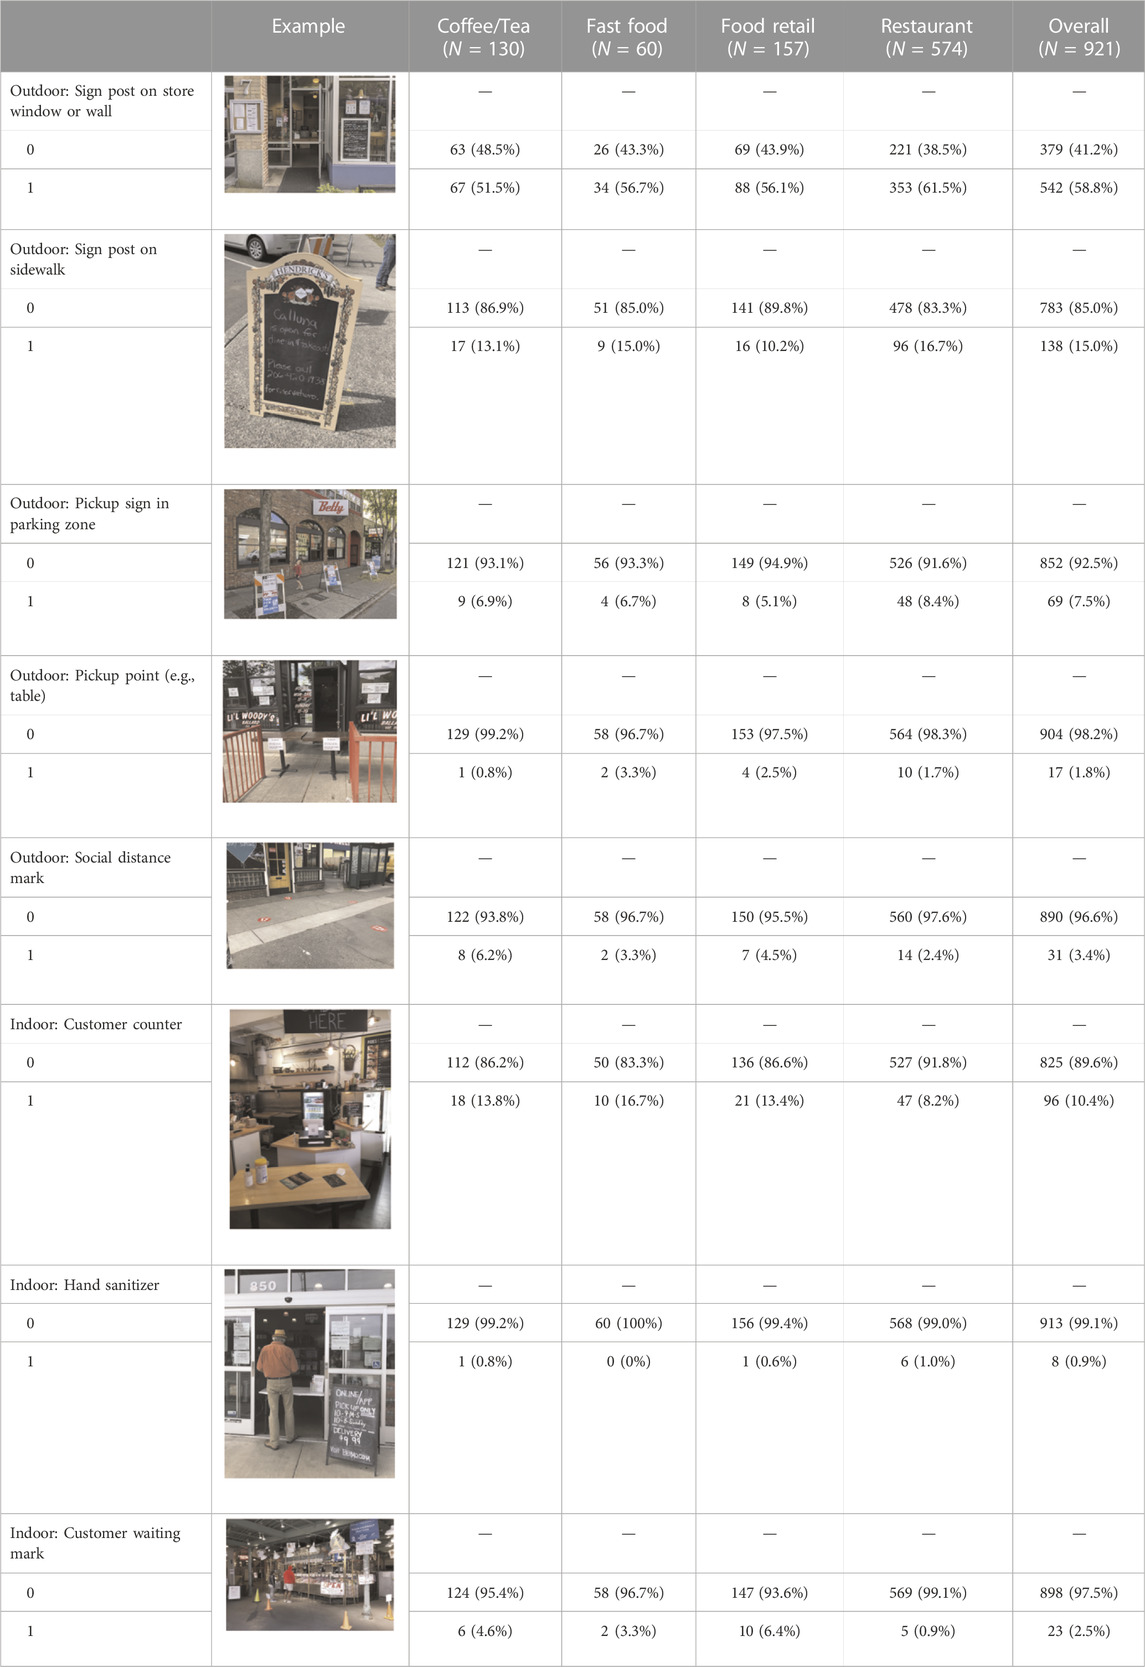
TABLE 3. Summary statistics: makeshift changes by primary business type (May/June 2020).
4.2 Classification and regression tree of building type and makeshift changes
Figure 4; Table 4 show the combination of makeshift changes and building storefront types that emerge from the CART analysis. They form seven classified combinations in the first survey period (May to June) and two combinations in the second survey period (November to December) of 2020. The combinations provide a mutually exclusive and collectively exhaustive classification of the storefront types and makeshift changes that best predict variations in business open status in the respective period. Food court, walkable storefront, and individual buildings, with signs posted on store windows and/or on the sidewalk, as well as a customer counter, were identified as the most important predictors of open businesses in May and June. Signs posted on store windows were estimated to be the only predictor for open businesses in November and December 2020. In the first period, the combination of signs posted on store windows and adjusted locations for customer counters were observed at the highest percentage of open businesses, with the next highest percentage of open businesses having signs posted on both store windows and sidewalks. By November and December, the repositioning of customer counters no longer played a role in business continuity.
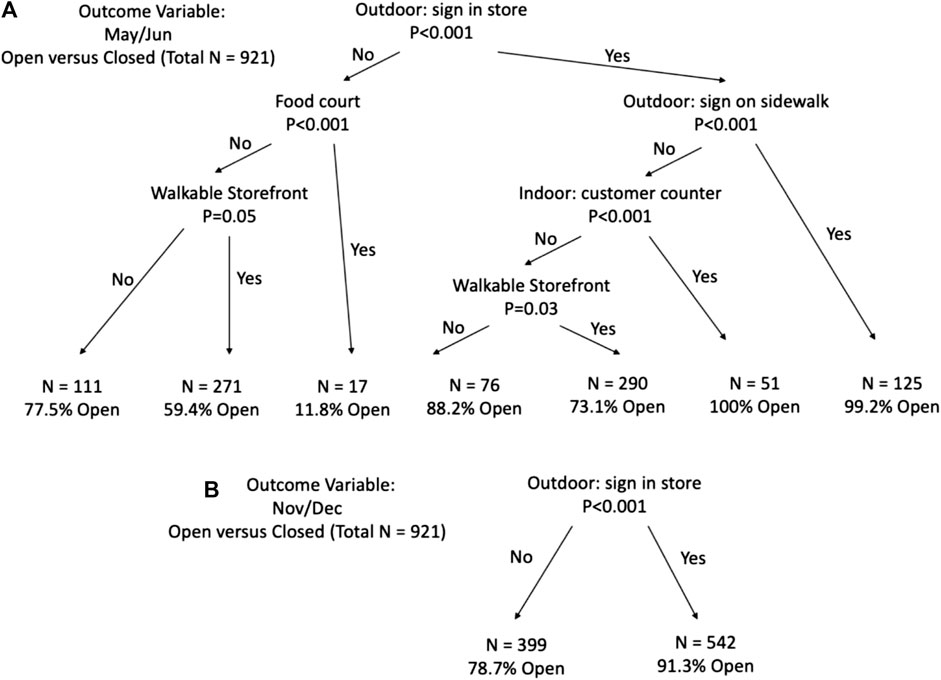
FIGURE 4. Classification and regression tree of makeshift changes and retail storefront types predicting open versus closed. Other makeshift changes and retail building types were not selected by the CART models due to low associations with the outcome variable in each period; (A) Seven Combinations were classified in May and June 2020; (B) Two Combinations were classified in November and December 2020.
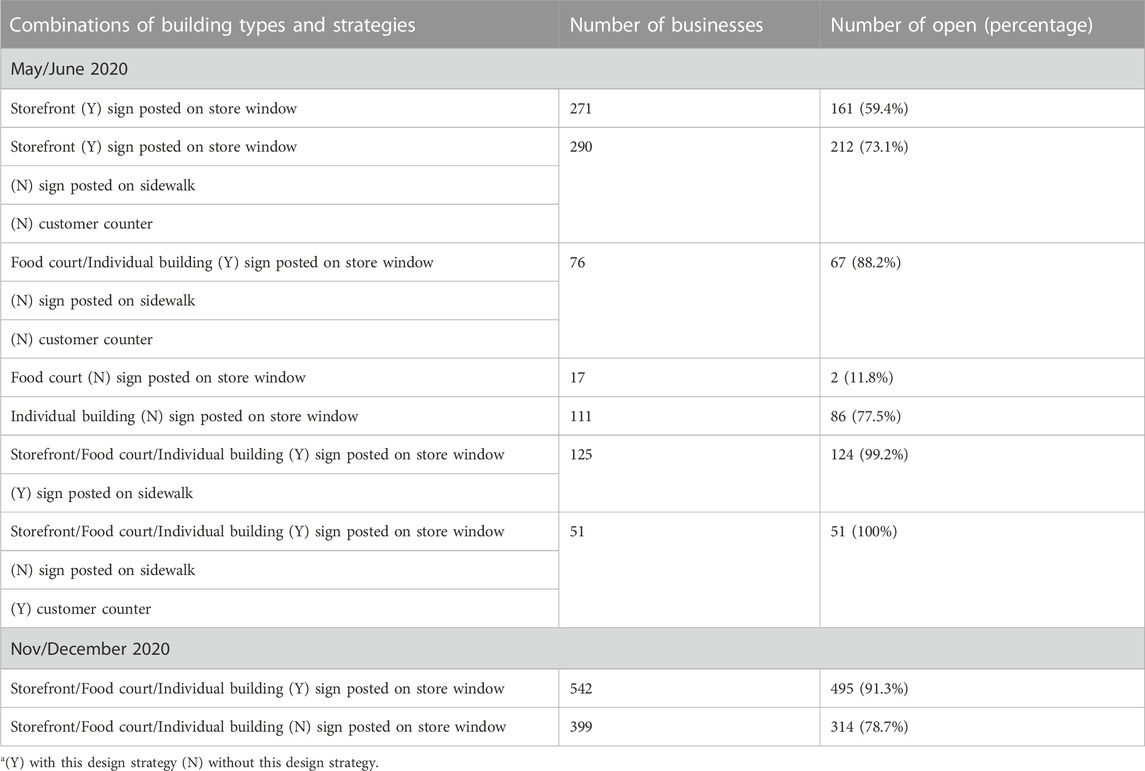
TABLE 4. Combinations of building types and makeshift changes.
4.3 Classification and regression tree of urban density measures
Figure 5; Table 5 show the results of density classification from the CART analysis with three measures of urban density—employment density, residential population density, and entropy index of land use mixture. Employment density was estimated to be the only significant predictor of open or closed status in May and June, with 95 jobs per acre as the threshold that separated the classification of businesses by their neighborhood location. In contrast, residential density was the only predictor in November and December, with 23.6 persons per acre as the threshold for separating classifications of businesses by their location.
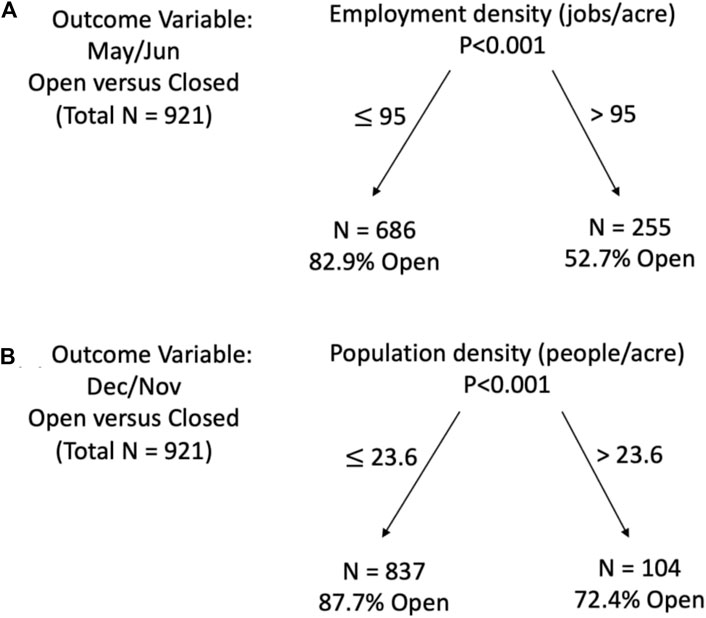
FIGURE 5. Classification and regression tree of urban density thresholds predicting open versus closed. Other urban density measures were not selected by the CART model due to low associations with the outcome variable in each period. (A) Employment density was the only significant predictor in May and June 2020; (B) Residential population density was the only significant predictor in November and December 2020.
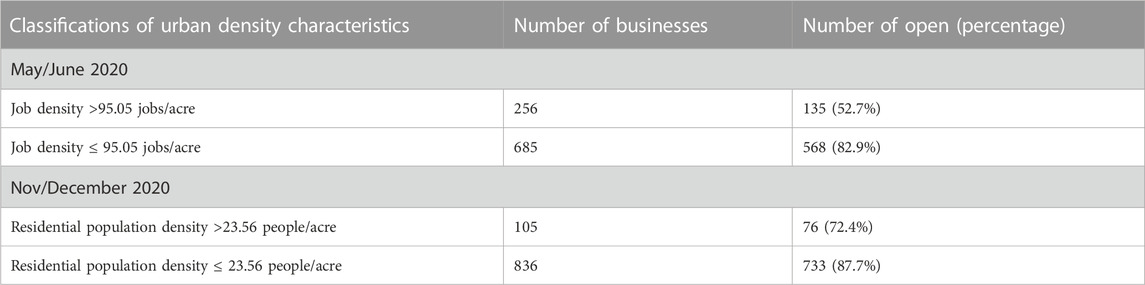
TABLE 5. Classifications of urban density measures.
4.4 Negative binomial regression results
Negative binomial regression estimates of the effect sizes of variables on open or closed status, in May through June and November through December 2020, are shown in Table 6. The table includes the effects of makeshift change combinations and urban density thresholds produced through the CART analysis. All coefficients were converted into odds ratios. A ratio less than one indicates that the presence of the corresponding variable decreases the likelihood of business continuity, while a ratio greater than one indicates that the variable increases the chance of businesses being open. The further away an odds ratio from one, the stronger the association between the independent variable and the dependent variable.
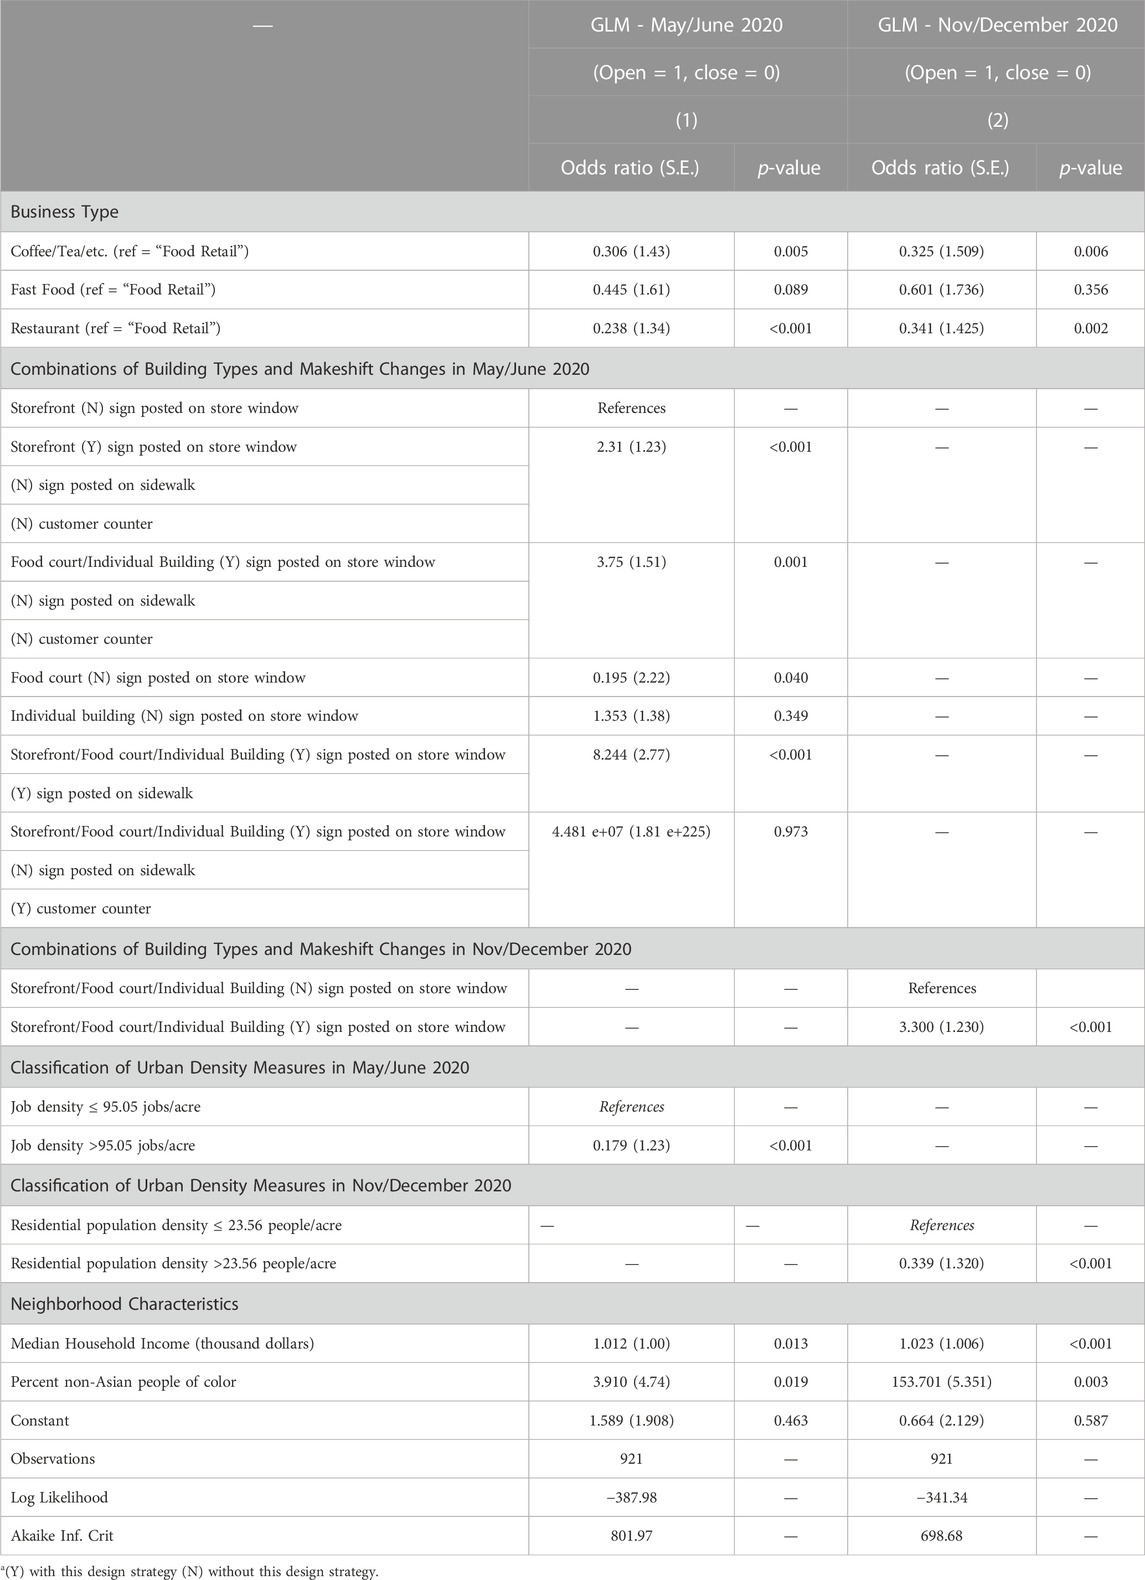
TABLE 6. Impact factors of food and retail business continuity.
For the business type variable, food retail (e.g., grocery stores) is used as the baseline reference because this type of business was labeled “essential,” and demand was unlikely to decline. Therefore, it provides a relatively stable baseline reference to understand how all other types of businesses, by comparison, are expected to underperform during these peak pandemic periods. Compared to food retail, restaurants were 76% less likely to be open in May and June of 2020, and 66% less likely to be open by the end of the year. Similarly, shops selling coffee and tea, including bakeries and other establishments with specialized products, were 69% less likely than food retail to remain open during the May to June period of 2020, improving the odds of reopening by only 2% by the end of the year.
For the variables indicating makeshift adaptations, storefront businesses without any sign are used as the baseline reference in both study periods. Compared with the baseline, businesses with a sign on their window and those with signs on both the window and sidewalk were found to have higher odds of being open in May and June. Food court establishments with no signs on windows were negatively associated with being open. While the relocation of customer counters by food establishments was observed with a 100% open rate in Table 4, after controlling for other factors this strategy was no longer found to be statistically significant. In the November and December model, businesses with signage were also found to have higher odds of remaining open compared to those without.
Measures of employment and residential density were reclassified into binary variables based on the thresholds from CART. Overall, density measures were found to be negatively associated with the odds of being open. In the May and June model, businesses were 82% less likely to be open if the quarter-mile area around them averaged more than 95 pre-pandemic jobs per acre. In the November and December model, businesses were 66% less likely to be open if the quarter-mile area around them averaged more than 23.6 persons per acre.
For other neighborhood characteristics, median household income and percentage of non-Asian persons of color were both positively and significantly associated with business continuity in May and June, as well as November and December of 2020. In particular, the magnitude of the estimated effect of percentage of non-Asian persons of color increased greatly between the first and second period of analysis.
5 Discussion
Despite the designation of essential businesses (Goolsbee and Syverson, 2020), efforts to pivot to online communications and delivery (Yenerall et al., 2022; Norris et al., 2021; Russo et al., 2022; Bonfanti et al., 2023), and financial assistance programs, such as the Paycheck Protection Program (Autor et al., 2022), businesses carrying relatively small amounts of cash on hand found drops in demand to be highly disruptive, leading many to lay off workers, temporarily shut down, and reassess how they might be able to weather the crisis (Bartik et al., 2020). Existing literature clearly anticipates and describes impacts to customer-facing food businesses from reductions in demand (Bartik et al., 2020; Goolsbee and Syverson, 2021; Balla-Elliott et al., 2022). However, most studies have described such impacts at more aggregated scales, either at the county level or submarket level, failing to identify the market segments and individual businesses that require assistance during the pandemic. With data collected in the field within the first few months of the pandemic and the use of CART analysis and regression models, this study adds to the existing body of literature by generating more detailed and accurate profiles of food retail businesses in relation to business continuity during these critical time periods.
In May and June 2020, at the business level, fast food sites were the businesses most likely to continue operations. At the neighborhood level, businesses found in neighborhoods with job density of less than 95 per acre were more likely to remain open. Median income within a walkable area of a business was positively correlated with business continuity. Yet these benefits of business continuity also accrued to locations within a walkable area that includes comparatively higher proportions of non-Asian persons of color, which are comparatively lower income neighborhoods. Conversely, businesses most vulnerable to closure were found in job-dense neighborhoods, especially in the areas around or in downtown, Seattle. Food court closures, inside retail malls and similar establishments, made restaurants in these settings particularly vulnerable to closure. Business closure also was more likely if the business was located in a less-wealthy area, or in a less diverse area. These profiles, however, changed within 6 months. By November and December, the business types most vulnerable to closure were coffee and tea shops. Vulnerability to closure was also found in residential neighborhoods with pre-pandemic residential density greater than of 23.6 persons/acre, or lower median income, or lower diversity.
These profiles can serve multiple urban planning purposes. In the short term, the profiles, especially the business and building types and the neighborhood level characteristics, can help public programs to better target market segments and business groups for more efficient resource allocation. By comparing the profiles with guidelines and criteria used for the qualification of business supporting programs, such as the issuance of special parking permits to facilitate take-out and food delivery, and permits to allow outdoor dining in the public right-of-way, profiles can assist in evaluating the effectiveness of those public programs in reaching the businesses most in need, and to identify potential service gaps. These profiles identify successful (and unsuccessful) cases for further in-depth study to understand the causal mechanisms of how urban designs at the street-level and the neighborhood-level can facilitate a vibrant economy, despite the pandemic.
Besides the profiles, the findings also add to the understanding of underlying factors that affect business continuity. Despite the presence of significant investments in indoor and outdoor dining facilities in our study areas within Seattle, the statistically significant factor observed to have the strongest impact on business continuity was the posting of signs either in windows or affixed to sandwich boards on the sidewalk. There are several reasons for signage to matter in the immediate wake of pandemic restrictions on business operations. During our field audits, we found that information online was often inaccurate, lagging behind the times in regard to operating status and open hours. Signage, as simple as it may be, provides a quick and cost-effective communication channel with customers about new hours, menu items, and safety guidelines.
Business continuity, perhaps emphasized in signage, may also reflect unobserved variables, such as financial conditions and digitalization. The results from structured phone interviews of a subsample (n = 82) of businesses (Supplementary Table S2), found that businesses with posted signs were on average accruing more revenue than in pre-pandemic times (i.e., 2019), and were benefiting from higher percentages of financial assistance (e.g., PPP, EMIC) and rent relief. In terms of operations, they had more full-time employees and longer operating hours in May and June of 2020 than their counterparts. A significantly higher percentage were advancing digitization, adding to their existing online delivery services during COVID-19, and/or witnessing higher percentages of pickup orders in May and June of 2020. The small sample size of this follow-up phone survey cannot show statistical association. Still, the descriptive results do suggest the possibility of relationships between makeshift adaptations in the built environment, financial relief, and the efforts of businesses to elevate take-out and delivery throughput.
Perhaps the most interesting results of this study examine how density in the built environment and socio-economic factors relate to the continued operation or closing of food retail businesses. Pre-pandemic employment density is negatively and significantly associated with customer-facing food business continuity, as measured in the May to June period of 2020. Just 6 months later, however, this variable was replaced by pre-pandemic residential population density, which is also negatively and significantly associated with food retail business continuity.
These results may be better explored through further understanding of the spatial distribution of density in Seattle. Figure 6A shows the spatial distribution of businesses in the study, according to their placement above or below the CART threshold of 95 jobs per acre within a quarter-mile radius. Businesses clustered in and around the downtown area of Seattle, which is dominated by office buildings, were 82% less likely to be open from May to June of 2020. As downtown office workers shifted to work-from-home practices, the floor fell out from underneath the businesses dependent on this customer base.
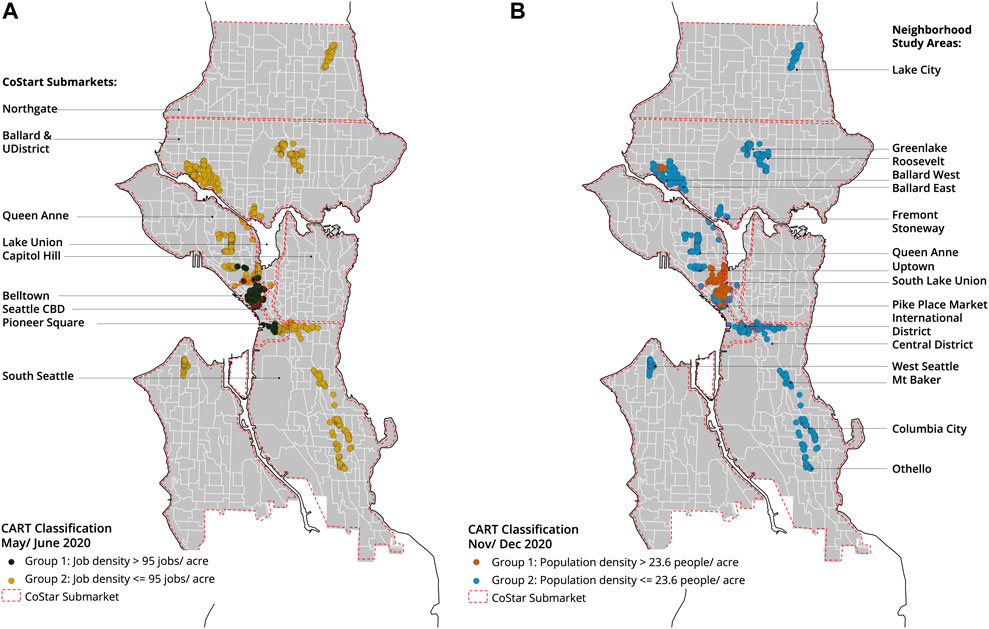
FIGURE 6. (A) Business clusters under each employment density classification in May through June 2020; Businesses in Group 1, of higher employment density, have a lower opening rate (52.7%) than those in Group 2 (82.9%) (B) Business clusters under each residential population density classifications in November through December 2020; Businesses in Group 1, of higher population density, have a lower opening rate (72.4%) than those in Group 2 (87.7%).
Results in November to December 2020, show food retail businesses 66% less likely to stay open if the area within a quarter mile radius of the establishment had a pre-pandemic residential population density greater than 23.6 per acre. To try to understand why pre-pandemic residential density could worsen customer-facing food business continuity, we again examine the spatial and built environment context for our results, as shown in Figure 6B. What began as a collection of business closures associated with a loss of employment density in the central business district, Pike’s Place Market and Pioneer Square, grew outward over the ensuing months to the South Lake Union area, associated with a loss of residential population density.
Placing these results in the context of the literature, Ramani and Bloom (2021) describe a “donut effect” of the pandemic on cities, a hollowing out of city centers, with business demand shifting to the suburban and outer rings of large US metropolitan areas, based on data from the US Postal Service and Zillow. Coven et al. (2022) suggest that parts of downtown Seattle had, like other US urban centers, also experienced the mass relocation of people from urban to more suburban and exurban areas, based on smartphone GPS and ZIP code information. Our research suggests that the driving forces of the hollowing out of cities likely changed over time, attributable first to work-from-home policies and followed by the movement of residents to locations that met latent preferences for residential living—preferences that were masked by the desire to be conveniently located close to one’s place of work. The converse was also true, however, for other neighborhoods in the city. Studies have found racial and ethnic minority groups less likely to leave the city and more dependent on work required to be conducted on-premises during the pandemic (Coven and Gupta, 2020; Fu and Zhai, 2021; Zhai and Yue, 2022), which corresponds to the finding that businesses in neighborhoods with higher percentages of non-Asian persons of color are more likely to stay open.
Placed in the context of the real estate literature, the findings encourage mixed-use development in the city core and the redistribution of restaurants and similar food service businesses to diverse residential neighborhoods, to maintain close ties between local businesses and their customer base. Traditionally, the real estate market has valued the centrality and density of urban areas. Rosenthal et al. (2022) found that pandemic employment density had a negative impact on both office rent and the number of new tenant leases and renewals. Other recent studies also document a shift of demand in the housing market away from densely populated areas (Liu and Su, 2021; Ramani and Bloom, 2021). This study offers a retrospective explanation of these changes, beginning with work-from-home and remote-work vacancies of high-density office buildings (and the closure of associated local food retail businesses) and followed, 6 months later, by the flight of residents from high-density residential buildings on the outskirts of downtown (and the closure of associated local food retail businesses).
6 Conclusion
The economic impacts of COVID-19 were not equally distributed across the businesses comprising the food retail industry, nor were they equally distributed across the urban areas of cities. This study sought to improve understanding of role of the built environment in mediating urban economic decline and resiliency during the first year of the pandemic, by investigating the effects of business-level factors (e.g., business type, building type, and makeshift adaptations made by the business to improve outcomes), and neighborhood-level factors, (e.g., employment density, residential population density, and socio-demographics), on the business continuity of food retail establishments in the city of Seattle. Results show that closure was much more likely for businesses such as restaurants, cafes, and pubs, than for their counterparts in food retail, such as grocery stores and supermarkets. Results also demonstrate a meaningful role for density in the risk of business closure, though that role changed over time. The first wave of food retail business closure coincided with the first wave of the pandemic and the immediate and widespread shift of workers in office-rich downtown areas to work-from-home practices. Six months later, this was followed by a separate wave of food retail business closures, possibly in connection with the flight of people away from high density residential areas, on the outskirts of downtown. Both dynamics contrast with observations in the socio-demographically diverse areas of the city, where food retail businesses exhibited stability and resilience. Understanding the effects of such factors on business closure offers opportunities to provide more efficient and targeted financial support (Autor et al., 2022), should a similar crisis appear in the future.
Other authors have expressed concern that there may be strategic misalignments between business assets and the shifting environmental demands of novel shocks or crises, such as COVID-19, that place industries at risk (Amankwah-Amoah et al., 2021). Our study demonstrates that the built environment itself, with its form, density, and mix of land use, is one such asset misaligned with the aim of resilience against pandemic shock. The hollowing out of the office-rich downtown core of Seattle may have been swift, but its effects have continued as vacancy rates remain higher than pre-pandemic levels, and as a substantial subset of workers reconsider their preferred place of residence with work-from-home options in mind. The adaptive capacity and therefore the resilience of the food retail industry are affected by the dynamic interplay of characteristics of the built environment with these pandemic-driven economic impacts. The food retail industry, often dependent upon a local customer base, may be a bellwether for both swift and lasting change in the urban economy.
There are four types of limitations to this study. First, this study focused on the built environment, seeking a balance between internal validity and external validity. Though this research includes the full population of food retail businesses in sampled neighborhoods, the sample was not randomly selected and there were no controls. Additional explanatory variables, such as financial condition and digitalization, have the potential to change the outcomes of this study. And apart from a temporal relationship between the first two waves of COVID-19 incidence and the implementation of the study, the research design did not provide explicit linkages with variables representing policy and behavior. Perceived risk, for example, as a controlled variable, has the potential to change the sign of density, and may differ among groups in society (Chauhan et al., 2021; Carella et al., 2022; Joiner et al., 2022). Second, though our selection of neighborhoods for study excluded prominent areas of unrest, it is important to note that the “Black Lives Matter” protests occurred during these periods of observation, which may have contributed to business closure (Motoyama, 2022). Third, there were limits to the frequency of observations recorded in the field for this study. More recent public health and real estate research papers are beginning to fill this gap by examining impacts over longer periods of time (Lee et al., 2021; Carozzi et al., 2022; Guo et al., 2023; Kiaghadi et al., 2022; Motoyama, 2022; Wang et al., 2022a; Wu et al., 2022; Tsou et al., 2023). Fourth, as a study of urban neighborhoods, zoned for growth, in a US city, at the center of a metropolitan area, there are limits to the generalizability of this work and its findings. This study suggests that Seattle increasingly resembles the transit-rich metropolitan centers described by Rosenthal et al. (2022).
Data availability statement
The raw data supporting the conclusion of this article will be made available by the authors, without undue reservation.
Author contributions
FS and SN organized the data, cleaned the data, and performed statistical analyses. FS contributed the draft of the introduction, data and methodology, results and findings, discussion, and conclusion of the manuscript and contributed to the literature review. SN contributed the draft of the data and methodology and literature review sections of the manuscript. JW, GP, and FS conceptualized the research design. JW acquired the funding, was the principal investigator for the research, developed and oversaw the research design and methodology, contributed to the literature review, and substantially revised the draft to produce the final manuscript. At the time of this research FS and SN were doctoral students in the lab founded by JW. GP oversaw and managed the field audit and phone surveys, and created and revised the figures. All authors contributed to the article and approved the submitted version.
Funding
This research was made possible by the generous and timely support of University of Washington Population Health Initiative, with a COVID-19 Rapid Response Grant and a COVID-19 Economic Recovery Research Grant, both administered in 2020.
Acknowledgments
The authors would like to thank the members of the Urban Infrastructure Lab and the Circular City and Living Systems Lab at the University of Washington for their contributions.
Conflict of interest
The authors declare that the research was conducted in the absence of any commercial or financial relationships that could be construed as a potential conflict of interest.
Publisher’s note
All claims expressed in this article are solely those of the authors and do not necessarily represent those of their affiliated organizations, or those of the publisher, the editors and the reviewers. Any product that may be evaluated in this article, or claim that may be made by its manufacturer, is not guaranteed or endorsed by the publisher.
Supplementary material
The Supplementary Material for this article can be found online at: https://www.frontiersin.org/articles/10.3389/fbuil.2023.1212244/full#supplementary-material
References
Acemoglu, D., Chernozhukov, V., Werning, I., and Whinston, M. D. (2020). A multi-risk SIR model with optimally targeted lockdown. MA: National Bureau of Economic Research Cambridge.
Acuto, M. (2020). COVID-19: lessons for an urban(izing) world. One Earth 2, 317–319. doi:10.1016/j.oneear.2020.04.004
Akseer, N., Kandru, G., Keats, E. C., and Bhutta, Z. A. (2020). COVID-19 pandemic and mitigation strategies: lmplications for maternal and child health and nutrition. Am. J. Clin. Nutr. 112, 251–256. doi:10.1093/ajcn/nqaa171
Ali, S. H., Imbruce, V. M., Russo, R. G., Kaplan, S., Stevenson, K., Mezzacca, T. A., et al. (2021). Evaluating closures of fresh fruit and vegetable vendors during the COVID-19 pandemic: methodology and preliminary results using omnidirectional street view imagery. JMIR Form. Res. 5, e23870. doi:10.2196/23870
Alidadi, M., and Sharifi, A. (2022). Effects of the built environment and human factors on the spread of COVID-19: a systematic literature review. Sci. Total Environ. 850, 158056. doi:10.1016/j.scitotenv.2022.158056
Allan, R., Liusman, E., Lu, T., and Tsang, D. (2021). The COVID-19 pandemic and commercial property rent dynamics. JRFM 14, 360. doi:10.3390/jrfm14080360
Almagro, M., and Orane-Hutchinson, A. (2022). JUE Insight: the determinants of the differential exposure to COVID-19 in New York city and their evolution over time. J. Urban Econ. 127, 103293. doi:10.1016/j.jue.2020.103293
Alvarez, F. E., Argente, D., and Lippi, F. (2020). A simple planning problem for covid-19 lockdown. Cambridge: National Bureau of Economic Research.
Amankwah-Amoah, J., Khan, Z., Wood, G., and Knight, G. (2021). COVID-19 and digitalization: the great acceleration. J. Bus. Res. 136, 602–611. doi:10.1016/j.jbusres.2021.08.011
Ameli, S. H., Hamidi, S., Garfinkel-Castro, A., and Ewing, R. (2015). Do better urban design qualities lead to more walking in Salt Lake City, Utah? J. Urban Des. 20 (3), 393–410. doi:10.1080/13574809.2015.1041894
Asif, Z., Chen, Z., Stranges, S., Zhao, X., Sadiq, R., Olea-Popelka, F., et al. (2022). Dynamics of SARS-CoV-2 spreading under the influence of environmental factors and strategies to tackle the pandemic: a systematic review. Sustain. Cities Soc. 81, 103840. doi:10.1016/j.scs.2022.103840
Autor, D., Cho, D., Crane, L. D., Goldar, M., Lutz, B., Montes, J., et al. (2022). The $800 billion paycheck protection program: where did the money go and why did it go there? J. Econ. Perspect. 36, 55–80. doi:10.1257/jep.36.2.55
Balemi, N., Füss, R., and Weigand, A. (2021). COVID-19’s impact on real estate markets: review and outlook. Financ. Mark. Portf. Manag. 35, 495–513. doi:10.1007/s11408-021-00384-6
Balk (2022). Only one major city ranks higher than Seattle for remote work. [WWW Document]. The Seattle Times. URL https://www.seattletimes.com/seattle-news/only-one-major-city-ranks-higher-than-seattle-for-remote-work/ (accessed July 7, 23).
Balla-Elliott, D., Cullen, Z. B., Glaeser, E. L., Luca, M., and Stanton, C. (2022). Determinants of small business reopening decisions after covid restrictions were lifted. J. Policy Analysis Manag. 41, 278–317. doi:10.1002/pam.22355
Balla-Elliott, D., Cullen, Z. B., Glaeser, E. L., Luca, M., and Stanton, C. T. (2020). Business reopening decisions and demand forecasts during the COVID-19 pandemic.
Barraza, S., Rossi, M., and Yeager, T. J. (2020). The short-term effect of the paycheck protection program on unemployment. SSRN J. doi:10.2139/ssrn.3667431
Bartik, A. W., Bertrand, M., Cullen, Z., Glaeser, E. L., Luca, M., and Stanton, C. (2020). The impact of COVID-19 on small business outcomes and expectations. Proc. Natl. Acad. Sci. 117, 17656–17666. doi:10.1073/pnas.2006991117
Basellini, U., and Camarda, C. G. (2022). Explaining regional differences in mortality during the first wave of Covid-19 in Italy. Popul. Stud. 76, 99–118. doi:10.1080/00324728.2021.1984551
Benita, F., Rebollar-Ruelas, L., and Gaytán-Alfaro, E. D. (2022). What have we learned about socioeconomic inequalities in the spread of COVID-19? A systematic review. Sustain Cities Soc. 86, 104158. doi:10.1016/j.scs.2022.104158
Bonfanti, A., Vigolo, V., Yfantidou, G., and Gutuleac, R. (2023). Customer experience management strategies in upscale restaurants: lessons from the Covid-19 pandemic. Int. J. Hosp. Manag. 109, 103416. doi:10.1016/j.ijhm.2022.103416
Brewer, P., and Sebby, A. G. (2021). The effect of online restaurant menus on consumers’ purchase intentions during the COVID-19 pandemic. Int. J. Hosp. Manag. 94, 102777. doi:10.1016/j.ijhm.2020.102777
Byrd, K., Her, E., Fan, A., Almanza, B., and Liu, Y.Lei US Department of Health and Human Services tch, S. (2021). Restaurants and COVID-19: what are consumers’ risk perceptions about restaurant food and its packaging during the pandemic? Int. J. Hosp. Manag. 94, 102821. doi:10.1016/j.ijhm.2020.102821
Carella, G., Pérez Trufero, J., Álvarez, M., and Mateu, J. (2022). A bayesian spatial analysis of the heterogeneity in human mobility changes during the first wave of the COVID-19 epidemic in the United States. Am. Statistician 76, 64–72. doi:10.1080/00031305.2021.1965657
Carozzi, F., Provenzano, S., and Roth, S. (2022). Urban density and COVID-19: understanding the US experience. Ann. Reg. Sci., 1–32. doi:10.1007/s00168-022-01193-z
Carré, F., and Tilly, C. (2008). America’s biggest low-wage industry: continuity and change in retail jobs. Center for Social Policy Publications 22.
Cervero, R., and Duncan, M. (2003). Walking, bicycling, and urban landscapes: Evidence from the San Francisco bay area. Am. J. Public Health 93 (9), 1478–1483. doi:10.2105/ajph.93.9.1478
Cervero, R., and Kockelman, K. (1997). Travel demand and the 3Ds: Density, diversity, and design. Transp. Res. Part D Transp. Environ. 2 (3), 199–219. doi:10.1016/S1361-9209(97)00009-6
CDC (2020). Coronavirus disease 2019. Centers for Disease Control and Prevention. URL https://www.cdc.gov/media/releases/2020/p0121-novel-coronavirus-travel-case.html (accessed July 7, 23).
Chauhan, R. S., da Silva, D. C., Salon, D., Shamshiripour, A., Rahimi, E., Sutradhar, U., et al. (2021). COVID-19 related attitudes and risk perceptions across urban, rural, and suburban areas in the United States. Findings. doi:10.32866/001c.23714
Choi, K. H., and Denice, P. (2022). Socioeconomic variation in the relationship between neighbourhoods’ built environments and the spread of COVID-19 in Toronto, Canada. Can. Stud. Popul. 49, 149–181. doi:10.1007/s42650-022-00070-6
Coven, J., and Gupta, A. (2020). Disparities in mobility responses to COVID-19. New York: New York University.
Coven, J., Gupta, A., and Yao, I. (2022). JUE Insight: urban flight seeded the COVID-19 pandemic across the United States. J. Urban Econ. 133, 103489. doi:10.1016/j.jue.2022.103489
Cutler, D. M., and Summers, L. H. (2020). The COVID-19 pandemic and the $16 trillion virus. JAMA 324, 1495–1496. doi:10.1001/jama.2020.19759
Diao, Y., Kodera, S., Anzai, D., Gomez-Tames, J., Rashed, E. A., and Hirata, A. (2021). Influence of population density, temperature, and absolute humidity on spread and decay durations of COVID-19: a comparative study of scenarios in China, england, Germany, and Japan. One Health 12, 100203. doi:10.1016/j.onehlt.2020.100203
Dietz, L., Horve, P. F., Coil, D. A., Fretz, M., Eisen, J. A., and Wymelenberg, K. V. D. (2020). 2019 Novel Coronavirus (COVID-19) pandemic: built environment considerations to reduce transmission. mSystems 5, e00245-20. doi:10.1128/mSystems.00245-20
Dong, X., and Zeballos, E. (2021). COVID-19 working paper: The effects of COVID-19 on food sales (No. AP-088). Washington: USDA Economic Research Service.
Dua, A., Ellingrud, K., Mahajan, D., and Silberg, J., 2020. Which small businesses are most vulnerable to COVID-19—and when [WWW Document]. McKinsey and Company. URL https://www.mckinsey.com/featured-insights/americas/which-small-businesses-are-most-vulnerable-to-covid-19-and-when (accessed July.21.23).
Eichenbaum, M. S., Rebelo, S., and Trabandt, M. (2021). The macroeconomics of epidemics. Rev. Financial Stud. 34, 5149–5187. doi:10.1093/rfs/hhab040
Ewing, R., Greenwald, M., Zhang, M., Walters, J., Feldman, M., Cervero, R., et al. (2011). Traffic generated by mixed-use developments—six-region study using consistent built environmental measures. J. Urban Plan. Dev. 137 (3), 248–261. doi:10.1061/(ASCE)UP.1943-5444.0000068
Ewing, R., Hajrasouliha, A., Neckerman, K. M., Purciel-Hill, M., and Greene, W. (2016). Streetscape features related to pedestrian activity. J. Plan. Educ. Res. 36 (1), 5–15. doi:10.1177/0739456X15591585
Fairlie, R., and Fossen, F. M. (2022). The early impacts of the COVID-19 pandemic on business sales. Small Bus. Econ. 58, 1853–1864. doi:10.1007/s11187-021-00479-4
Fan, P., Chen, J., and Sarker, T. (2022). Roles of economic development level and other human system factors in COVID-19 spread in the early stage of the pandemic. Sustainability 14, 2342. doi:10.3390/su14042342
Farboodi, M., Jarosch, G., and Shimer, R. (2021). Internal and external effects of social distancing in a pandemic. J. Econ. Theory 196, 105293. doi:10.1016/j.jet.2021.105293
Frazier, L. (2021). The coronavirus crash of 2020, and the investing lesson it taught us. New Jersey: Forbes.
Fu, X., and Zhai, W. (2021). Examining the spatial and temporal relationship between social vulnerability and stay-at-home behaviors in New York City during the COVID-19 pandemic. Sustain. Cities Soc. 67, 102757. doi:10.1016/j.scs.2021.102757
Ganasegeran, K., Jamil, M. F. A., Ch’ng, A. S. H., Looi, I., and Peariasamy, K. M. (2021). Influence of population density for COVID-19 spread in Malaysia: an ecological study. Int. J. Environ. Res. Public Health 18, 9866. doi:10.3390/ijerph18189866
Gao, X., Fan, C., Yang, Y., Lee, S., Li, Q., Maron, M., et al. (2021). Early indicators of human activity during COVID-19 period Using digital trace data of population activities. Front. Built Environ. 6, 607961. doi:10.3389/fbuil.2020.607961
Gao, X., Shi, X., Guo, H., and Liu, Y. (2020). To buy or not buy food online: the impact of the COVID-19 epidemic on the adoption of e-commerce in China. PLOS ONE 15, e0237900. doi:10.1371/journal.pone.0237900
Gold, M. (2020). Indoor dining returns to New York city, but will customers? The New York Times. Available at: https://www.nytimes.com/2020/09/30/nyregion/indoor-dining-nyc.html.
Goolsbee, A., and Syverson, C. (2021). Fear, lockdown, and diversion: comparing drivers of pandemic economic decline 2020. J. public Econ. 193, 104311. doi:10.1016/j.jpubeco.2020.104311
Govindan, K., Mina, H., and Alavi, B. (2020). A decision support system for demand management in healthcare supply chains considering the epidemic outbreaks: a case study of coronavirus disease 2019 (COVID-19). Transp. Res. Part E Logist. Transp. Rev. 138, 101967. doi:10.1016/j.tre.2020.101967
Guo, Z., Zhang, F., and Ji, Y. (2023). Investigating the nonlinear relationship between takeout order demand and built environment under different periods of COVID-19. J. Adv. Transp. doi:10.1155/2023/5248888
Gupta, A., Mittal, V., and Van Nieuwerburgh, S. (2022). Work from home and the office real estate apocalypse (No. w30526). Cambridge, MA: National Bureau of Economic Research. doi:10.3386/w30526
Gursoy, D., and Chi, C. G. (2020). Effects of COVID-19 pandemic on hospitality industry: review of the current situations and a research agenda. J. Hosp. Mark. Manag. 29, 527–529. doi:10.1080/19368623.2020.1788231
Haddad, J. A., Mondal, A., and Bhat, C. B. (2023). Eat-in or eat-out? A joint model to analyze the new landscape of dinner meal preferences. Transp. Res. Part C Emerg. Technol. 147. doi:10.1016/j.trc.2023.104016
Hamidi, S., Sabouri, S., and Ewing, R. (2020). Does density aggravate the COVID-19 Pandemic? J. Am. Plan. Assoc. 86, 495–509. doi:10.1080/01944363.2020.1777891
Hasnat, B. (2022). Culture, institution, and policy response to COVID-19. J. Econ. Issues 56, 624–631. doi:10.1080/00213624.2022.2066446
Hietanen, J., Mattila, P., Schouten, J. W., Sihvonen, A., and Toyoki, S. (2016). Reimagining society through retail practice. J. Retail. 92, 411–425. doi:10.1016/j.jretai.2016.05.005
Honey-Roses, J., Anguelovski, I., Bohigas, J., Chireh, V., Daher, C., Konijnendijk, C., et al. (2020). The impact of COVID-19 on public space: A review of the emerging questions (preprint). Open Sci. Framew. doi:10.31219/osf.io/rf7xa
Hong, A., and Chakrabarti, S. (2022). Compact living or policy inaction? Effects of urban density and lockdown on the COVID-19 outbreak in the US. Urban Stud. 60, 1588–1609. doi:10.1177/00420980221127401
Hothorn, T., Hornik, K., and Zeileis, A. (2006). Unbiased recursive partitioning: a conditional inference framework. J. Comput. Graph. Statistics 15, 651–674. doi:10.1198/106186006X133933
Hounwanou, S., Comi, A., Gonzalez-Feliu, J., and Gondran, N. (2018). Inner city versus urban periphery retailing: store relocation and shopping trip behaviours. Indications from saint-etienne. Transp. Res. Procedia 30, 363–372. doi:10.1016/j.trpro.2018.09.039
Huang, J., Kwan, M.-P., Kan, Z., Wong, M. S., Kwok, C. Y. T., and Yu, X. (2020). Investigating the relationship between the built environment and relative risk of COVID-19 in Hong Kong. ISPRS Int. J. Geo-Information 9, 624. doi:10.3390/ijgi9110624
Hutson, N. M., and Orlando, A. W. (2023). The effects of COVID-19 on downtown land use: evidence from four U.S. cities. J. Urban Aff. 0, 1–19. doi:10.1080/07352166.2023.2195665
IHME (2023). COVID-19 projections. Institute for Health Metrics and Evaluation. URL https://covid19.healthdata.org/ (accessed May 7, 23).
Ilardi, A., Chieffi, S., Iavarone, A., and Ilardi, C. R. (2021). SARS-CoV-2 in Italy: population density correlates with morbidity and mortality. Jpn. J. Infect. Dis. 74, 61–64. doi:10.7883/yoken.JJID.2020.200
Ivanov, D., and Das, A. (2020). Coronavirus (COVID-19/SARS-CoV-2) and supply chain resilience: a research note. IJISM 13, 90. doi:10.1504/IJISM.2020.107780
Ivanov, D. (2020). Predicting the impacts of epidemic outbreaks on global supply chains: a simulation-based analysis on the coronavirus outbreak (COVID-19/SARS-CoV-2) case - ScienceDirect.
Jamal, Y., Gangwar, M., Usmani, M., Adams, A. E., Wu, C.-Y., Nguyen, T. H., et al. (2022). Identification of thresholds on population density for understanding transmission of COVID-19. Geohealth 6, e2021GH000449. doi:10.1029/2021GH000449
Jo, Y., Hong, A., and Sung, H. (2021). Density or connectivity: what are the main causes of the spatial proliferation of COVID-19 in Korea? Int. J. Environ. Res. Public Health 18, 5084. doi:10.3390/ijerph18105084
Joiner, A., McFarlane, C., Rella, L., Uriarte-Ruiz, M., Grover, J., Godfrey, A., et al. (2022). Problematising density: cOVID-19, the crowd, and urban life. Soc. Cult. Geogr. 0, 1–7. doi:10.1080/10903127.2022.2137744
Jun, B., Jara-Figueroa, C., and Yu, D. (2022). The economic resilience of a city: the effect of relatedness on the survival of amenity shops during the COVID-19 pandemic. Camb. J. Regions, Econ. Soc. 15, 551–573. doi:10.1093/cjres/rsac029
Kadi, N., and Khelfaoui, M. (2020). Population density, a factor in the spread of COVID-19 in Algeria: statistic study. Bull. Natl. Res. Centre 44, 138. doi:10.1186/s42269-020-00393-x
Kang, M., Choi, Y., Kim, J., Lee, K. O., Lee, S., Park, I. K., et al. (2020). COVID-19 impact on city and region: what’s next after lockdown? Int. J. Urban Sci. 24, 297–315. doi:10.1080/12265934.2020.1803107
Karniouchina, K., Sarangee, K., Theokary, C., and Kübler, R. (2022). The impact of the COVID-19 pandemic on restaurant resilience: lessons, generalizations, and ideas for future research. Serv. Sci. 14, 121–138. doi:10.1287/serv.2021.0293
Khorram-Manesh, A., Dulebenets, M. A., and Goniewicz, K. (2021). Implementing public health strategies—the need for educational initiatives: a systematic review. IJERPH 18, 5888. doi:10.3390/ijerph18115888
Kiaghadi, A., Adepoju, O. E., Rifai, H. S., Liaw, W., and Woodard, L. D. (2022). Examining longitudinal disparities in COVID-19 prevalence in the U.S. a county level growth rate perspective. Ann. Med. 54, 1277–1286. doi:10.1080/07853890.2022.2069852
King County (2020a). Executive constantine and king county health officer announce new orders to limit spread of COVID-19 - king county. King County.
King County (2020d). King county enters phase 2 of safe start recovery plan. Available at: https://kingcounty.gov/elected/executive/constantine/news/release/2020/June/19-phase-2-reopening.aspx.
Klein, A., and Smith, E. (2021). Explaining the economic impact of COVID-19: Core industries and the Hispanic workforce.
Klompmaker, J. O., Hart, J. E., Holland, I., Sabath, M. B., Wu, X., Laden, F., et al. (2021). County-level exposures to greenness and associations with COVID-19 incidence and mortality in the United States. Environ. Res. 199, 111331. doi:10.1016/j.envres.2021.111331
Laefer, D. F., and Protopapas, D. (2022). Essential business visits and social vulnerability during New York city’s initial COVID-19 outbreak. Epidemiologia 3, 518–532. doi:10.3390/epidemiologia3040039
Lee, W., Kim, H., Choi, H. M., Heo, S., Fong, K. C., Yang, J., et al. (2021). Urban environments and COVID-19 in three Eastern states of the United States. Sci. Total Environ. 779, 146334. doi:10.1016/j.scitotenv.2021.146334
Leist, A. K., Klee, M., Kim, J. H., Rehkopf, D. H., Bordas, S. P. A., Muniz-Terrera, G., et al. (2022). Mapping of machine learning approaches for description, prediction, and causal inference in the social and health sciences. Sci. Adv. 8, eabk1942. doi:10.1126/sciadv.abk1942
Li, Y., Sungur, E., Jimenez, A., and Brail, S. (2022). Covid-19, urban economic resilience and the pandemic pivot: toronto’s restaurant scene. Regional Stud. Regional Sci. 9, 1–4. doi:10.1080/21681376.2021.2013732
Lima, F. T., Brown, N. C., and Duarte, J. P. (2021). Understanding the impact of walkability, population density, and population size on COVID-19 spread: a pilot study of the early contagion in the United States. Entropy 23, 1512. doi:10.3390/e23111512
Liu, C., Liu, Z., and Guan, C. (2021). The impacts of the built environment on the incidence rate of COVID-19: A case study of king county, Washington. Sustain. Cities Soc. 74, 103144. doi:10.1016/j.scs.2021.103144
Liu, S., and Su, Y. (2021). The impact of the COVID-19 pandemic on the demand for density: evidence from the U.S. housing market. Econ. Lett. 207, 110010. doi:10.1016/j.econlet.2021.110010
Loomba, R. S., Aggarwal, G., Aggarwal, S., Flores, S., Villarreal, E. G., Farias, J. S., et al. (2021). Disparities in case frequency and mortality of coronavirus disease 2019 (COVID-19) among various states in the United States. Ann. Med. 53, 151–159. doi:10.1080/07853890.2020.1840620
Mandhan, S., and Gregg, K. (2023). Managing the curb – public space and use of curbside cafes during the Coronavirus pandemic. Cities 132, 104070. doi:10.1016/j.cities.2022.104070
McFadden, B. R., Malone, T., Kecinski, M., and Messer, K. D. (2021). COVID-19 induced stigma in U.S. consumers: evidence and implications. Am. J. Agric. Econ. 103, 486–497. doi:10.1111/ajae.12188
Megahed, N. A., and Ghoneim, E. M. (2020). Antivirus-built environment: lessons learned from Covid-19 pandemic. Sustain. Cities Soc. 61, 102350. doi:10.1016/j.scs.2020.102350
Mehta, V. (2011). Small businesses and vitality of main street. J. Archit. Plan. Res. 28 (4), 271–291.
Monte, L. M., 2021. Historical look at unemployment, sectors shows magnitude of COVID-19 impact on economy [WWW Document]. Census.gov. URL https://www.census.gov/library/stories/2021/03/putting-economic-impact-of-pandemic-in-context.html (accessed May.2.22).
Moosavi, J., Fathollahi-Fard, A. M., and Dulebenets, M. A. (2022). Supply chain disruption during the COVID-19 pandemic: recognizing potential disruption management strategies. Int. J. Disaster Risk Reduct. 75, 102983. doi:10.1016/j.ijdrr.2022.102983
Motoyama, Y. (2022). Is COVID-19 causing more business closures in poor and minority neighborhoods? Econ. Dev. Q. 36, 124–133. doi:10.1177/08912424221086927
Nanda, A., Xu, Y., and Zhang, F. (2021). How would the COVID-19 pandemic reshape retail real estate and high streets through acceleration of E-commerce and digitalization? J. Urban Manag. 10, 110–124. doi:10.1016/j.jum.2021.04.001
Newbold, S. C., Finnoff, D., Thunström, L., Ashworth, M., and Shogren, J. F. (2020). Effects of physical distancing to control COVID-19 on public health, the economy, and the environment. Environ. Resour. Econ. 76, 705–729. doi:10.1007/s10640-020-00440-1
Nguyen, Q. C., Huang, Y., Kumar, A., Duan, H., Keralis, J. M., Dwivedi, P., et al. (2020). Using 164 million google street view images to derive built environment predictors of COVID-19 cases. Int. J. Environ. Res. Public Health 17, 17. doi:10.3390/ijerph17176359
Norris, C. L., Taylor, J. S., and Taylor, D. C. (2021). Pivot! How the restaurant industry adapted during COVID-19 restrictions. Int. Hosp. Rev. 35, 132–155. doi:10.1108/IHR-09-2020-0052
Park, K., Ewing, R., Sabouri, S., and Larsen, J. (2019). Street life and the built environment in an auto-oriented US region. Cities 88, 243–251. doi:10.1016/j.cities.2018.11.005
Paul, A., Englert, P., and Varga, M. (2021). Socio-economic disparities and COVID-19 in the USA. J. Phys. Complex 2, 035017. doi:10.1088/2632-072X/ac0fc7
Perone, G. (2021). The determinants of COVID-19 case fatality rate (CFR) in the Italian regions and provinces: an analysis of environmental, demographic, and healthcare factors. Sci. Total Environ. 755, 142523. doi:10.1016/j.scitotenv.2020.142523
Proksch, G., Sun, F., Whittington, J., and Craddock, E. (2021). COVID-19 rapid response: design determinants of Seattle food retail business continuity. Proc. 109th ACSA Annu. Meet.
Pujawan, N., and Bah, A. (2021). Supply chains under COVID-19 disruptions: literature review and research agenda. Supply Chain Forum 23, 81–95. doi:10.1080/16258312.2021.1932568
Pivo, G., and Fisher, D. J. (2011). The walkability premium in commercial real estate investments. Real Estate Econ. Am. Real Estate Urban Econ. Assoc. 39 (2), 185–219. doi:10.1111/j.1540-6229.2010.00296.x
Qeadan, F., Mensah, N. A., Tingey, B., Bern, R., Rees, T., Madden, E. F., et al. (2021). The association between opioids, environmental, demographic, and socioeconomic indicators and COVID-19 mortality rates in the United States: an ecological study at the county level. Archives Public Health 79, 101. doi:10.1186/s13690-021-00626-z
Rahman, Md.S., Paul, K. C., Rahman, Md.M., Samuel, J., Thill, J.-C., Hossain, Md.A., et al. (2023). Pandemic vulnerability index of us cities: A hybrid knowledge-based and data-driven approach. Sustain. Cities Soc. 95, 104570. doi:10.1016/j.scs.2023.104570
Ramani, A., and Bloom, N. (2021). The donut effect of covid-19 on cities. Work. Pap. Ser. doi:10.3386/w28876
Rice, L. (2020). After Covid-19: urban design as spatial medicine. Urban Des. Int. 28, 97–102. doi:10.1057/s41289-020-00142-6
Rosenthal, S. S., Strange, W. C., and Urrego, J. A. (2022). JUE insight: are city centers losing their appeal? Commercial real estate, urban spatial structure, and COVID-19. J. Urban Econ. JUE Insights COVID-19 Cities 127, 103381. doi:10.1016/j.jue.2021.103381
Russo, R. G., Ali, S. H., Mezzacca, T. A., Radee, A., Chong, S., Kranick, J., et al. (2022). Assessing changes in the food retail environment during the COVID-19 pandemic: opportunities, challenges, and lessons learned. BMC Public Health 22, 778. doi:10.1186/s12889-022-12890-x
Rybczynski, W. (2010). “Makeshift metropolis: ideas about cities,” in 1st Scribner hardcover ed. (New York: Scribner).
Saelens, B. E., and Handy, S. L. (2008). Built environment correlates of walking: A review. Med. Sci. sports Exerc. 40, S550–S566. doi:10.1249/MSS.0b013e31817c67a4
Sarmadi, M., Moghanddam, V. K., Dickerson, A. S., and Martelletti, L. (2021). Association of COVID-19 distribution with air quality, sociodemographic factors, and comorbidities: an ecological study of US states. Air Qual. Atmos. Health 14, 455–465. doi:10.1007/s11869-020-00949-w
Schmiege, D., Haselhoff, T., Ahmed, S., Anastasiou, O. E., and Moebus, S. (2023). Associations between built environment factors and SARS-CoV-2 infections at the neighbourhood level in a metropolitan area in Germany. J. urban health Bull. N. Y. Acad. Med. 100, 40–50. doi:10.1007/s11524-022-00708-5
Sedov, D. (2022). Restaurant closures during the COVID-19 pandemic: A descriptive analysis. Econ. Lett. 213, 110380. doi:10.1016/j.econlet.2022.110380
Shi, L., Hao, Y., Lv, S., Cipcigan, L., and Liang, J. (2021). A comprehensive charging network planning scheme for promoting EV charging infrastructure considering the Chicken-Eggs dilemma. Res. Transp. Econ. 88, 100837. doi:10.1016/j.retrec.2020.100837
Siegrist, M., Luchsinger, L., and Bearth, A. (2021). The impact of trust and risk perception on the acceptance of measures to reduce COVID-19 cases. Risk Anal. 41, 787–800. doi:10.1111/risa.13675
Sun, Y., Xie, J., and Hu, X. (2022). Detecting spatial clusters of coronavirus infection across London during the second wave. Appl. Spat. Anal. 15, 557–571. doi:10.1007/s12061-021-09413-3
Sun, Z., Zhang, H., Yang, Y., Wan, H., and Wang, Y. (2020). Impacts of geographic factors and population density on the COVID-19 spreading under the lockdown policies of China. Sci. Total Environ. 746, 141347. doi:10.1016/j.scitotenv.2020.141347
Sutton, S. A. (2010). Rethinking commercial revitalization: A neighborhood small business perspective. Econ. Dev. Q. 24, 352–371. doi:10.1177/0891242410370679
Swanson, D., and Santamaria, L. (2021). Pandemic supply chain research: A structured literature review and bibliometric network analysis. Logistics 5, 7. doi:10.3390/logistics5010007
Tang, F., Feng, Y., Chiheb, H., and Fan, J. (2021). The interplay of demographic variables and social distancing scores in deep prediction of U.S. COVID-19 cases. J. Am. Stat. Assoc. 116, 492–506. doi:10.1080/01621459.2021.1901717
Tchicaya, A., Lorentz, N., Leduc, K., and Lanchy, G. (2021). COVID-19 mortality with regard to healthcare services availability, health risks, and socio-spatial factors at department level in France: A spatial cross-sectional analysis. PLOS ONE 16, e0256857. doi:10.1371/journal.pone.0256857
Teller, J. (2021). Urban density and covid-19: Towards an adaptive approach. Build. Cities 2 (1), 150–165. doi:10.5334/bc.89
Thilmany, D., Canales, E., Low, S. A., and Boys, K. (2021). Local food supply chain dynamics and resilience during COVID-19. Appl. Econ. Perspect. Policy 43, 86–104. doi:10.1002/aepp.13121
Thunström, L., Newbold, S. C., Finnoff, D., Ashworth, M., and Shogren, J. F. (2020). The benefits and costs of using social distancing to flatten the curve for COVID-19. J. Benefit-Cost Analysis 11, 179–195. doi:10.1017/bca.2020.12
Toxvaerd, F. M. (2020). “Equilibrium social distancing,” in Cambridge working papers in economics 2021 (Cambridge: Faculty of Economics, University of Cambridge).
Tribby, C. P., and Hartmann, C. (2021). COVID-19 cases and the built environment: initial evidence from New York city. Prof. Geogr. 73, 365–376. doi:10.1080/00330124.2021.1895851
Tsou, M.-H., Xu, J., Lin, C.-D., Daniels, M., Embury, J., Park, J., et al. (2023). Analyzing spatial-temporal impacts of neighborhood socioeconomic status variables on COVID-19 outbreaks as potential social determinants of health. Ann. Am. Assoc. Geogr. 113, 891–912. doi:10.1080/24694452.2022.2149460
US Department of Heatlh and Human Services (2023). Fact sheet: End of the COVID-19 public health emergency. HHS.gov. URL https://www.hhs.gov/about/news/2023/05/09/fact-sheet-end-of-the-covid-19-public-health-emergency.html (accessed May 7, 23).
U.S. Small Business Administration (2023). COVID-19 relief option. URL https://www.sba.gov/funding-programs/loans/covid-19-relief-options (accessed May 7, 23).
Verma, R., Yabe, T., and Ukkusuri, S. V. (2021). Spatiotemporal contact density explains the disparity of COVID-19 spread in urban neighborhoods. Sci. Rep. 11, 10952. doi:10.1038/s41598-021-90483-1
Wang, J., Wu, X., Wang, R., He, D., Li, D., Yang, L., et al. (2021). Review of associations between built environment characteristics and severe Acute respiratory Syndrome coronavirus 2 infection risk. Int. J. Environ. Res. Public Health 18, 7561. doi:10.3390/ijerph18147561
Wang, S., Lee, C. L., and Song, Y. (2022a). The COVID-19 sentiment and office markets: evidence from China. Buildings 12, 2100. doi:10.3390/buildings12122100
Wang, B., Williams, M., Duarte, F., and Zheng, S. (2022b). Demand for social interactions: evidence from the restaurant industry during the COVID-19 pandemic. Journal of Regional Science 62, 830–857. doi:10.1111/jors.12585
Washington Governor (2020d). Inslee announces statewide restrictions for four-weeks. Washington Governor. URL https://www.governor.wa.gov/news-media/inslee-announces-statewide-restrictions-four-weeks (accessed 21 April, 23).
Washington Governor (2021). Inslee announces “Healthy Washington–roadmap to recovery. [WWW Document]. Washington Governor. URL https://www.governor.wa.gov/news-media/inslee-announces-healthy-washington%E2%80%93roadmap-recovery (accessed 21 April, 23).
Washington Governor (2020b). Inslee announces “stay home, stay Healthy” order. Washington Governor. URL https://www.governor.wa.gov/news-media/inslee-announces-stay-home-stay-healthy%C2%A0order (accessed 21 April, 23).
Washington Governor (2020c). Safe start phased reopening. URL https://www.governor.wa.gov/sites/default/files/SafeStartPhasedReopening.pdf (accessed 21 April, 23).
WHO (2020). WHO Director-General’s opening remarks at the media briefing on COVID-19 - 11 March 2020. URL https://www.who.int/director-general/speeches/detail/who-director-general-s-opening-remarks-at-the-media-briefing-on-covid-19---11-march-2020 (accessed May 7, 23).
Wong, D. W. S., and Li, Y. (2020). Spreading of COVID-19: density matters. PLOS ONE 15, e0242398. doi:10.1371/journal.pone.0242398
Wu, Y., Wei, Y. D., and Liu, M. (2022). Urban form and spatiotemporal vulnerability of local communities to covid-19. Geogr. Rev. 0, 482–501. doi:10.1080/00167428.2022.2155519
Yenerall, J., Jensen, K., Chen, X., and Edward Yu, T. (2022). COVID-19 risk perception and restaurant utilization after easing in-person restrictions. Food Policy 107, 102206. doi:10.1016/j.foodpol.2021.102206
Yost, E., and Cheng, Y. (2021). Customers’ risk perception and dine-out motivation during a pandemic: insight for the restaurant industry. Int. J. Hosp. Manag. 95, 102889. doi:10.1016/j.ijhm.2021.102889
Yuan, J., Zou, H., Xie, K., and Dulebenets, M. A. (2021). An assessment of social distancing obedience behavior during the COVID-19 post-epidemic period in China: A cross-sectional survey. Sustainability 13, 8091. doi:10.3390/su13148091
Zhai, W., and Yue, H. (2022). Economic resilience during COVID-19: an insight from permanent business closures. Environ. Plan. A 54, 219–221. doi:10.1177/0308518X211055181
Zhang, X., Sun, Z., Ashcroft, T., Dozier, M., Ostrishko, K., Krishan, P., et al. (2022). Compact cities and the Covid-19 pandemic: Systematic review of the associations between transmission of Covid-19 or other respiratory viruses and population density or other features of neighborhood design. Health & Place 76. doi:10.1016/j.healthplace.2022.102827
Keywords: economic resilience, pandemic, urban design, neighborhood, food retail business, built environment, COVID-19
Citation: Sun F, Whittington J, Ning S, Proksch G, Shen Q and Dermisi S (2023) Economic resilience during COVID-19: the case of food retail businesses in Seattle, Washington. Front. Built Environ. 9:1212244. doi: 10.3389/fbuil.2023.1212244
Received: 26 April 2023; Accepted: 18 August 2023;
Published: 28 September 2023.
Edited by:
Wenjia Zhang, Peking University, ChinaReviewed by:
Maxim A. Dulebenets, Florida Agricultural and Mechanical University, United StatesBor Tsong Teh, University of Malaya, Malaysia
Copyright © 2023 Sun, Whittington, Ning, Proksch, Shen and Dermisi. This is an open-access article distributed under the terms of the Creative Commons Attribution License (CC BY). The use, distribution or reproduction in other forums is permitted, provided the original author(s) and the copyright owner(s) are credited and that the original publication in this journal is cited, in accordance with accepted academic practice. No use, distribution or reproduction is permitted which does not comply with these terms.
*Correspondence: Jan Whittington, janwhit@uw.edu
†These authors have contributed equally to this work and share first authorship