 Zhenwei Guo1,2
 Xinyu Wang
95% of researchers rate our articles as excellent or good
Learn more about the work of our research integrity team to safeguard the quality of each article we publish.
Find out more
ORIGINAL RESEARCH article
Front. Built Environ. , 31 July 2023
Sec. Indoor Environment
Volume 9 - 2023 | https://doi.org/10.3389/fbuil.2023.1207193
This article is part of the Research Topic Indoor Environmental Air Quality in Urban Areas View all 8 articles
It is increasingly important to create a healthier indoor environment for office buildings. Accurate and reliable prediction of PM2.5 concentration can effectively alleviate the delay problem of indoor air quality control system. The rapid development of machine learning has provided a research basis for the indoor air quality system to control the PM2.5 concentration. One approach is to introduce the CatBoost algorithm based on rank lifting training into the classification and prediction of indoor PM2.5 concentration. Using actual monitoring data from office building, we consider previous indoor PM2.5 concentration, indoor temperature, relative humidity, CO2 concentration, and illumination as input variables, with the output indicating whether indoor PM2.5 concentration exceeds 25 μg/m3. Based on the CatBoost algorithm, we construct an intelligent classification prediction model for indoor PM2.5 concentration. The model is evaluated using actual data and compared with the multilayer perceptron (MLP), gradientboosting decision tree (GBDT), logistic regression (LR), decision tree (DT), and k-nearest neighbors (KNN) models. The CatBoost algorithm demonstrates outstanding predictive performance, achieving an impressive area under the ROC curve (AUC) of 0.949 after hyperparameters optimition. Furthermore, when considering the five input variables, the feature importance is ranked as follows: previous indoor PM2.5 concentration, relative humidity, CO2, indoor temperature, and illuminance. Through verification, the prediction model based on CatBoost algorithm can accurately predict the indoor PM2.5 concentration level. The model can be used to predict whether the indoor concentration of PM2.5 exceeds the standard in advance and guide the air quality control system to regulate.
More than 80% of people’s time is spent indoors, and in recent years, with the prevalence of respiratory infectious diseases and increasingly severe outdoor environmental pollution, this proportion will continue to rise. Office buildings are the main places where people work, and existing research shows that indoor air quality (IAQ) directly affects the physical and mental health of indoor personnel. High-quality indoor environmental quality can promote work efficiency and health (Fisk, 2000; Newsham et al., 2008; Thayer Julian et al., 2010; Horr et al., 2016). In the era of the COVID-19 pandemic, compared to outdoor, commercial, and hotel buildings, the requirements for wearing masks indoors in office buildings are relatively low. Therefore, IAQ in office buildings is extremely important.
PM2.5 is particle size ≤ 2.5 μm fine particles, which are composed of many chemical components, are easy to absorb harmful substances, and are the main pollutants affecting the IAQ. Particulate pollution mainly harms the respiratory system of human body, can cause tracheitis, pneumonia and fever, and may also cause eye and nasal allergy, or even death (BellMichelle and Davis, 2001; Jacobs et al., 2018; Mo, 2019). As the largest developing country in the world and one of the largest anthropogenic air pollution emitters in the world, China is currently facing serious air pollution problems, mainly PM2.5. The number of PM2.5-related deaths in China in 2017 was 1.8 million, an increase of 30% over 2005 (Ming et al., 2021). The hazard of indoor PM2.5 has gradually attracted people’s attention, and it has been included in the Standard for Health Building Assessment as a control item (GB, 2002). Research has revealed that indoor PM2.5 concentrations occasionally surpass 75 μg/m3 on a daily basis, exceeding the guidelines set by the World Health Organization for IAQ (Zhao et al., 2015; Fan et al., 2018; XueWangLiu and Dong, 2020). To foster a healthy indoor environment, certain indoor office spaces have adopted the use of IAQ improvement devices to ensure the provision of clean air. Fresh air system is the main method for HVAC to control indoor air pollution, which can significantly reduce the concentration of PM2.5 (ZhaoLiuRen, 2018; Huang et al., 2020). While the fresh air systems effectively lower indoor PM2.5 concentrations to satisfactory levels, a notable concern is that the majority of these systems do not adapt their operation in response to the IAQ conditions, often remaining fully operational at all times (Lai et al., 2018). This lack of responsiveness is both unnecessary and energy-inefficient.
The application of artificial intelligence (AI) and machine learning (ML) has emerged as a promising solution to tackle the aforementioned challenges. With the gradual maturity of computer technology and automatic control theory, intelligent control technology based on ML has been widely used in the field of HVAC regulation. By combining intelligent predictive models with IAQ control devices, it becomes possible to accurately forecast PM2.5 concentrations and translate them into control signals, thereby guiding the regulation process. This integration not only facilitates the creation of a healthy indoor environment but also minimizes unnecessary energy consumption within the systems.
Over the past decade, remarkable advancements have been made in applying AI/ML and Internet of Things (IoT) technologies to monitor and predict the physical environment of buildings. Specifically, ML prediction models for IAQ have been established based on historical data collected from sensors. Various methods have been employed to enhance the accuracy of IAQ prediction, including multivariate linear regression (MLR) (MengSpectorColome and Turpin, 2009; Martin and Šafránek, 2011; Maher Nor et al., 2015), artificial neural networks (ANN) (Sofuoglu, 2008; Xie et al., 2009; Skön et al., 2012), random forests (RF) (Kropat et al., 2015; Yuchi, 2017; Yuchi et al., 2019), partial least squares (PLS) (KimSankararaoKang et al., 2012; Lim et al., 2012; LeeKimKim and Yoo, 2015), decision trees (DT) (Kropat et al., 2015; Choi et al., 2017; Yuchi et al., 2019), among others. Additionally, less commonly used ML models have been explored for IAQ prediction. For instance, Justin et al. (2023) developed a Long Short-Term Memory prediction model using physical data observed by IAQ sensors, achieving an accuracy of approximately 60%–80% in determining real-time and near-term concentrations of indoor bioaerosols and PM, surpassing regression models with an accuracy of around 90%. YeganehMotlaghRashidi and Kamalan (2012) combined PLS with support vector machines (SVM) to predict the daily average value of CO, resulting in satisfactory outcomes. Carlos et al. (2018) used a kernel regression model to forecast CO2 concentration, leveraging continuous data obtained through the Internet, which yielded favorable predictive results. These findings underscore the potential of ML in IAQ prediction.
PM2.5, being a significant pollutant influencing IAQ, has garnered considerable attention. Initially, mechanical models were employed for PM2.5 prediction. However, these models lacked convenience as they necessitated detailed inputs, including indoor sources and sinks of PM2.5, building envelope structures, ventilation conditions, and outdoor concentrations (Wei et al., 2019). When the prerequisites for constructing mechanical models are unavailable, data-driven ML models have emerged as a favored approach for prediction. Feng et al. used ANN to predict PM2.5 (XiaoQiZhu et al., 2015). Cheng et al. (2019) proposed a PM2.5 prediction method based on multiple example genetic neural networks for hospitals. Kim et al. (2009) used a recurrent neural network (RNN) to predict the daily indoor PM2.5 concentration in subway stations, achieving a root mean square error (RMSE) of 17.8 μg/m3. The RNN model exhibited superior performance with lower RMSE values and higher accuracy compared to other prediction models. Maher Nor et al. (2015) evaluated indoor PM2.5 concentrations in naturally ventilated school buildings using MLR and feed-forward backpropagation (FFBP). The FFBP model outperformed the MLR model in determining indoor PM2.5. Yuchi et al. (2019) applied the RF method to model indoor PM2.5 concentrations in Mongolian apartments, demonstrating its superiority over the MLR model, but showing comparable performance in cross-validation. Xu et al. (2020) estimated indoor PM2.5 concentrations in 66 apartments in China using the RF method, achieving an RMSE of approximately 20 μg/m3 in 10-fold cross-validation. Li et al. (2020) also employed the RF method and successfully estimated indoor PM2.5 concentrations with a normalized RMSE of 15% in 10-fold cross-validation.
Although ML algorithms have been utilized to predict indoor PM2.5 concentrations to some extent, there is limited research specifically focused on predicting PM2.5 concentrations in office buildings (Wei et al., 2019; LagesseWangLarson and Kim, 2020). Moreover, these studies have primarily targeted continuous variables representing PM2.5 concentrations. According to the Chinese standard “Healthy Building Evaluation Standard” (T/ASC 02-2021), it is desirable to maintain indoor PM2.5 concentrations below 25 μg/m3 (T/ASC 02-2021, 2021). When the indoor PM2.5 concentration exceeds this threshold, there is a potential health risk, requiring intervention to improve IAQ. Therefore, it is crucial to predict whether the indoor PM2.5 concentration exceeds the standard. However, there is currently a lack of research on the classification prediction of PM2.5 concentrations.
Considering the practical problem of classification prediction, the Boosting algorithm offers an effective solution approach. Boosting algorithm is an integrated learning idea that converts weak learners into strong learners by adding iterations, which can solve the supervised learning classification problem (Susnjak et al., 2012; Sun and Zhou, 2014). Currently, Boosting algorithm is widely used in the photovoltaic power generation prediction field (Imran, 2021; Liu et al., 2021; Yamamoto et al., 2022), business forecasting (Kiki and Vinasetan, 2020; Xie et al., 2021), and medical and healthcare (Amy Isabella et al., 2022; Xue, 2022). And it has been applied in strength prediction of building materials (Lee et al., 2021; Zakir et al., 2022) and accident early warning (Zhou et al., 2021; Guo et al., 2022). CatBoost is one of the main algorithms of the Boosting family of algorithms, with strong robustness and versatility, as well as strong platform applicability and prediction speed (Dorogush et al., 2018). The CatBoost algorithm is based on a gradient boosting decision tree (GBDT) improved efficient ensemble learning idea that uses sorting lifting and symmetric decision trees as weak classifiers (Huang et al., 2019). Through sorting enhancement, the CatBoost algorithm builds an independent integrated model for each sample, avoiding prediction bias caused by information leakage during the training process, and improving prediction accuracy; Through the structural characteristics of symmetric decision trees, the CatBoost algorithm has smaller degrees of freedom, effectively reducing the probability of model overfitting, and significantly improving the prediction speed.
Considering that predicting whether the PM2.5 concentration will exceed the standard in the next moment is beneficial for regulating indoor air quality. However, there is currently a scarcity of research on utilizing ML algorithms to forecast and classify PM2.5 concentration. This study aims to develop an intelligent prediction model for PM2.5 concentration using the CatBoost algorithm. The accuracy and effectiveness of the model are established and validated through the utilization of real monitoring data from office buildings. Additionally, the study aims to assess the efficiency and superiority of the CatBoost algorithm by comparing it with other commonly employed algorithms.
The data used in this paper comes from indoor air quality monitoring platforms in an office of Beijing, China. The monitoring content includes indoor temperature, relative humidity, CO2 concentration, illuminance, and PM2.5 concentration. The environmental data is continuously transmitted to the monitoring platform via sensors using a wireless network. The data is sent every 5 min and stored in individual databases for each measurement. The testing range and measurement accuracy of the monitoring instruments are shown in Table 1. The monitoring record interval is 5 min, and each measurement data is stored in a separate database. We collected measurement data between January 18, 2022, and March 29, 2022.
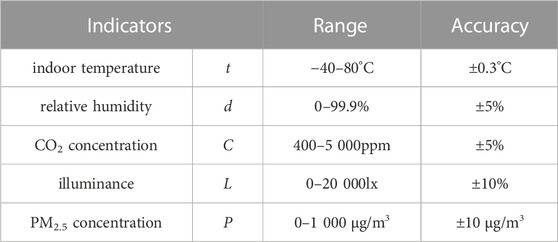
TABLE 1. Test scope and accuracy of indoor environmental testing indicators.
The relationship between input and output in this study is to predict the classification of PM2.5 concentration at the current time using previously sampled monitoring data. Based on existing research, we found that when using ML to predict PM2.5, indoor temperature (Kim et al., 2009; Das et al., 2014; Elbayoumi et al., 2014; Elbayoumi et al., 2015; LiuYoo, 2016; Deepti and Suresh, 2019; DaiLiuLi, 2021), indoor relative humidity (Kim et al., 2009; Elbayoumi et al., 2015; LiuYoo, 2016; Deepti and Suresh, 2019; DaiLiuLi, 2021), CO2 concentration (Kim et al., 2009; Elbayoumi et al., 2015; LiuYoo, 2016; Deepti and Suresh, 2019; DaiLiuLi, 2021), previous PM2.5 (Kim et al., 2009; Lim et al., 2012; Jorge et al., 2018; Hyun et al., 2018; Deepti and Suresh, 2019; DaiLiuLi, 2021), were frequently used as input variables. Infer that these parameters are related to indoor PM2.5. In addition, Ahn et al., 2017 included the influence of light when using deep learning methods to predict IAQ. The concentration of particulate matter may be related to light. Therefore, we will use the previous indoor temperature (th-1), relative humidity (dh-1), CO2 concentration (Ch-1), light intensity (Lh-1), and PM2.5 concentration (Ph-1) as input variables for the models.
The indoor PM2.5 concentration is chaotic and time-varying, strongly correlated with human activities, and it is unrealistic to accurately predict the dynamic concentration of PM2.5. Real-time and accurate prediction of the PM2.5 concentration range is an important aspect of creating an indoor environment. Therefore, this paper chooses the PM2.5 concentration range as the output of the classification model. The Chinese standard “Assessment Standard for Healthy Building" (T/ASC 02-2021) has requirements for the indoor PM2.5 concentration limit, and in the “Air” section of the control items, it is stipulated that the annual average concentration of indoor PM2.5 should not be higher than 25 μg/m3. In the scoring items, it is proposed that the annual average concentration of PM2.5 should not be higher than 15 μg/m3, and the daily average concentration of PM2.5 should not be higher than 35 μg/m3, and in the “Improvement and Innovation” section of the bonus points, it is proposed that the daily average concentration of PM2.5 should not be higher than 25 μg/m3 (T/ASC 02-2021, 2021). Based on the above, this paper determines the PM2.5 concentration as follows: When PM2.5 ≤ 25 μg/m3, it is determined that indoor air PM2.5 pollution is relatively low and the current situation is maintained; When PM2.5 > 25 μg/m3, it is determined that indoor air PM2.5 pollution is significant and requires purification, as shown in Table 2.
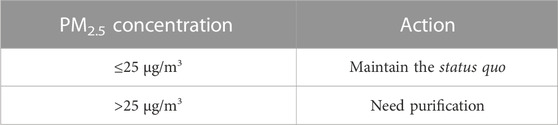
TABLE 2. Determination of indoor PM2.5 concentration.
Affected by power supply, signal transmission, network and other factors, monitoring equipment will have data quality problems such as missing values and outlier. To avoid interference with the data model, invalid data needs to be cleaned.
The data quality problems of the dataset used in this paper are missing values and outlier, and the specific processing methods are as follows: 1) Variables with a missing rate of more than 30% are regarded as invalid variables, and those with a missing rate of less than 5% are filled forward. For data with missing values of 5%–30%, random forest Multiple Interpolation Model (RFMICE) is used to fill in; 2) The oversize and undersize outlier are identified with 3Sigma criterion and filled forward; For 12 consecutive groups of samples, repeated outlier are regarded as data collection abnormalities and eliminated directly. In order to minimize the impact of outdoor environment and abnormal use on the model, the indoor temperature and CO2 concentration variables are limited to a reasonable range. Referring to the Chinese standard “Design Code for Heating Ventilation and Air Conditioning of Civil Buildings” (GB 50736-2012), the indoor temperature is higher than or equal to 16°C (GB, 2012). Referring to the Chinese standard “Hygienic Standard for Carbon Dioxide in Indoor Air” (GB/T 17094-1997), indoor CO2 ranges from 0 to 2000 mg/m3 (GB, 2021).
This article establishes a PM2.5 concentration range classification prediction model based on the CatBoost model, as shown in Figure 1. The specific process is as follows:
(1) Data acquisition and preprocessing. Data is obtained from the platform and preprocessed.
(2) Data Splitting. The preprocessed data is divided into training set, validation set, and test set in the proportions of 70%, 15%, and 15% respectively.
(3) Hyperparameter optimization (HPO). The criteria for hyperparameters selection are determined through an evaluation of their impact on the model’s performance. In addition, based on our comprehensive analysis of previous literature and our own experience (Zhao et al., 2021; Peng et al., 2022), we have observed satisfactory performance of CatBoost model after optimizing the model using the hyperparameters including learning_rate, depth, min_data_in_leaf, bagging_temperature and reg_lambda. To visualize the process of HPO, we utilized the Optuna package (version 2.10.0) (Akiba et al., 2019), an open-source optimization framework. This framework enables us to easily and efficiently implement complex machine learning experiments and perform HPO using Hyperband methods (Li et al., 2016). With Optuna, we can dynamically test various combinations of hyperparameters, allowing for an effective and systematic exploration of the hyperparameter space. This aids in finding the optimal configuration for our machine learning models, enhancing their performance and accuracy.
(4) The best hyperparameter combination is used to predict the PM2.5 concentration range, and the performance of the model is further demonstrated through time series cross validation.
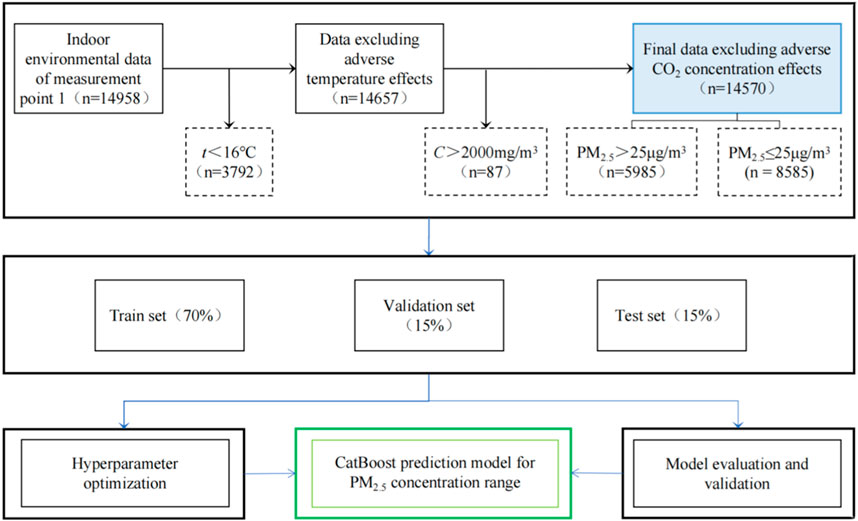
FIGURE 1. PM2.5 concentration range classification prediction model.
After processing the dataset, there were 14570 remaining samples for model analysis, as shown in Table 3. The distribution of data for each variable is shown in Figure 2. In the dataset, there are 5985 samples with p > 25 μg/m3, and 8585 samples with p ≤ 25 μg/m3.
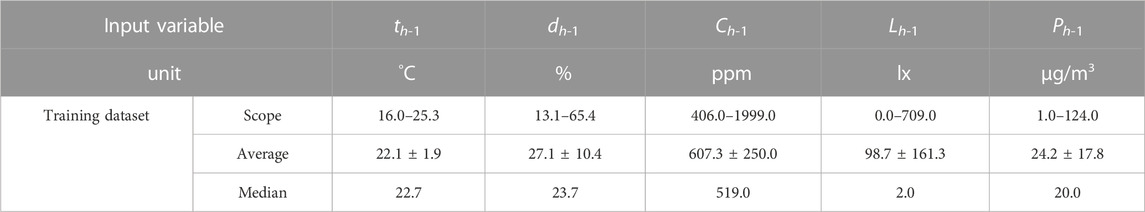
TABLE 3. Data description for the model.
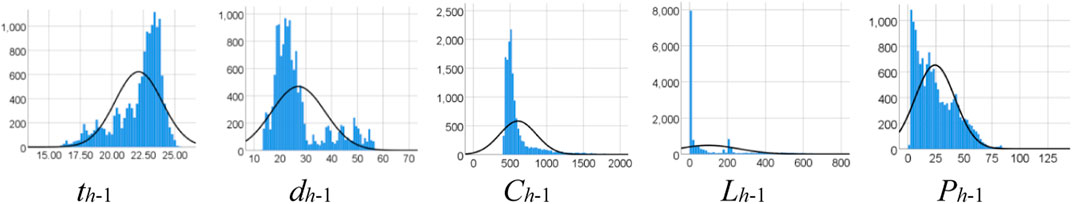
FIGURE 2. Data distribution of various variables in the training dataset.
The model underwent HPO to improve the performance of the prediction model. The CatBoost model with maximum AUC was obtained using Optuna. The search domain and set values for the hyperparameters of the CatBoost model are shown in Table 4. The search domain and set values for the hyperparameters of the competition models are also shown in Table 4. As shown in the Figure 3, after HPO, the performance of the CatBoost model was improved. The AUC value of the model after HPO is 0.949.
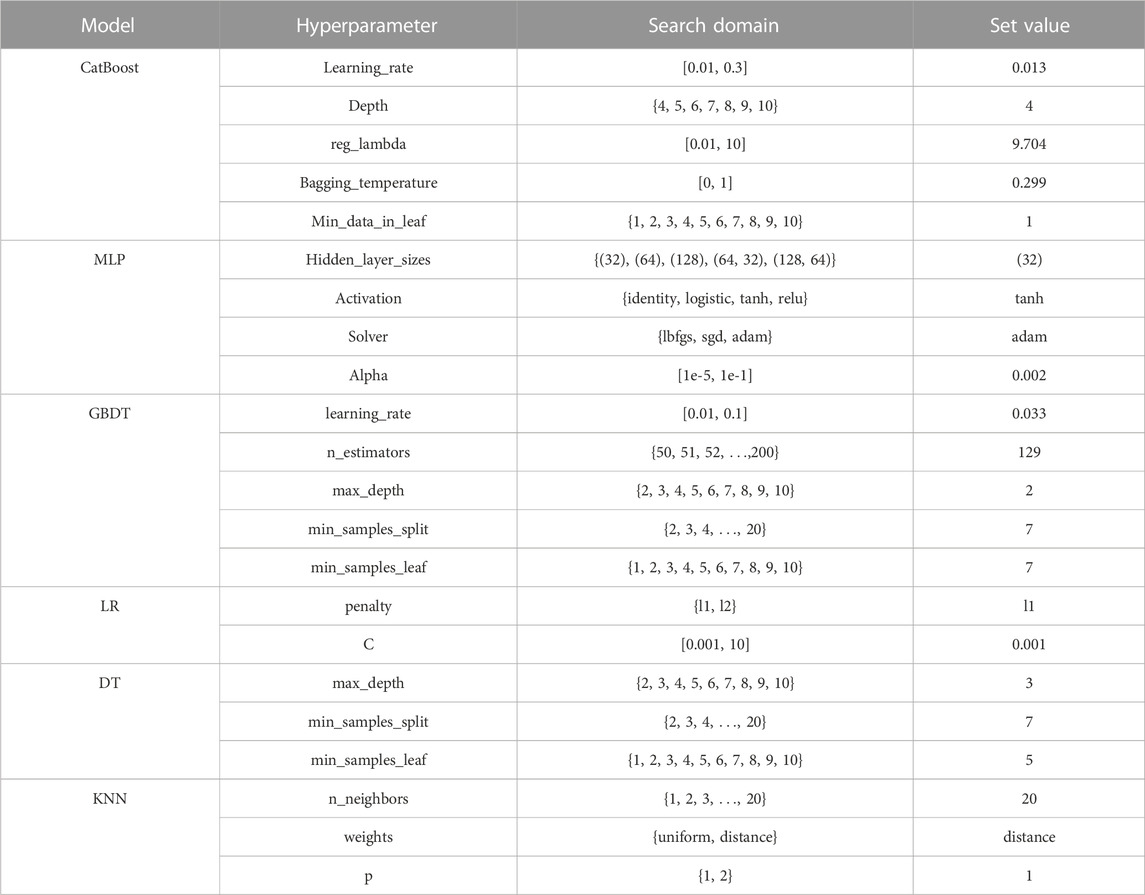
TABLE 4. Search domain and optimal combination of the main hyperparameters.
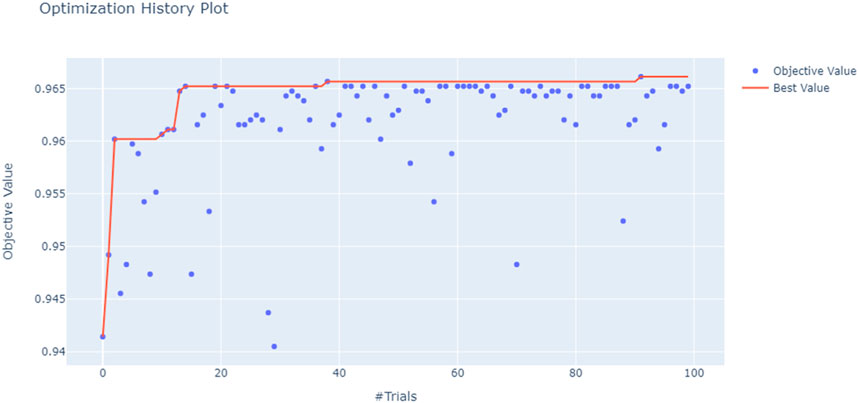
FIGURE 3. Optimization history of HPO.
In order to further validate the robustness and generalizability of the CatBoost model, we performed a Time Series Split Cross Validation. We have employed the Rolling Window approach to partition the time series data into several combinations of training and validation sets. This method involves sequentially splitting the data in accordance with the chronological order, where the training set comprises past data and the validation set contains future data. By adopting this approach, we can more effectively simulate the model’s performance on future data. The result of cross validation was shown in Figure 4.
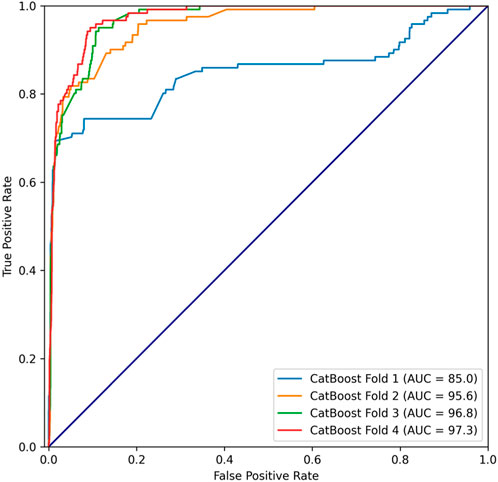
FIGURE 4. Cross-validation.
Further validate the performance of the model by comparing it with other commonly used classification algorithms and CatBoost algorithm. Five other classification algorithms were selected, including multilayer perceptron (MLP) model, GBDT model, Logistic Regression (LR) model, DT model, and k-nearest neighbors (KNN) model. The prediction results are shown in Figure 5. Among the models evaluated, the CatBoost algorithm demonstrates the highest predictive performance, achieving an AUC value of 0.949. The MLP model, GBDT model, DT model, and KNN model show similar AUC values, with scores of 0.917, 0.938, 0.927, and 0.926, respectively. In comparison, the LR model exhibits lower AUC value of 0.888. The Precision-Recall (P-R) curve is a graphical representation that illustrates the trade-off between precision and recall at various classification thresholds. By plotting the P-R curve, we can observe how the model’s precision and recall change as the threshold varies. The PR curves of the models are shown in Figure 6. The F1 score is a single metric that combines precision and recall into a balanced measure of a model’s performance. The F1 score is particularly useful in cases where we want to consider both precision and recall equally important. The F1 scores of the models are shown in Table 5.
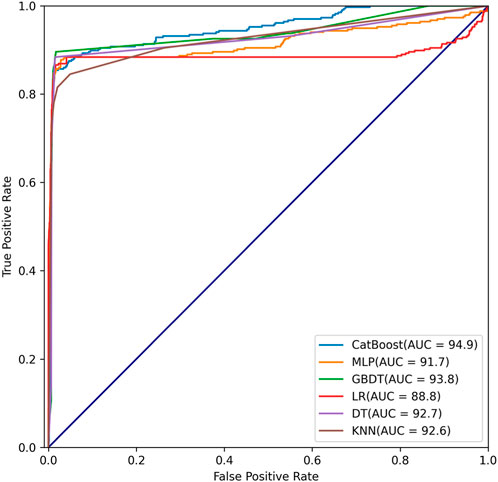
FIGURE 5. ROC curves of 6 different models.
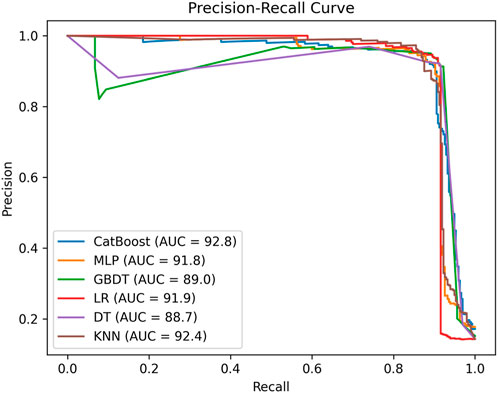
FIGURE 6. P-R curves of 6 different models.

TABLE 5. Performance of models.
The importance of model included features was analized through the SHAP (Shapley Additive exPlans) (Shapley, 1953). Figure 7 shows the SHAP value ranking of each feature and the specific impact of each feature on the output variable. The top feature value has the greatest importance for the output feature, and decreases in order from top to bottom. For identifying whether the indoor PM2.5 concentration exceeds the standard, the Ph-1 is the most important feature, followed by the dh-1, the Ch-1 and the th-1. The Lh-1 has the least importance. The blue to red color represents the feature value (red high, blue low). The x-axis measures the impacts on the model output (right positive, left negative). From the figure, it can be seen that the greater the Ph-1, the higher the risk of exceeding the indoor PM2.5 concentration; the lower the dh-1, the greater the risk of exceeding the indoor PM2.5 concentration, and vice versa, the smaller the risk; the higher the Ch-1, the greater the risk of exceeding the indoor PM2.5 concentration. Conversely, the smaller the risk; The lower the th-1, the greater the risk of exceeding the indoor PM2.5 concentration. Conversely, the lower the risk.
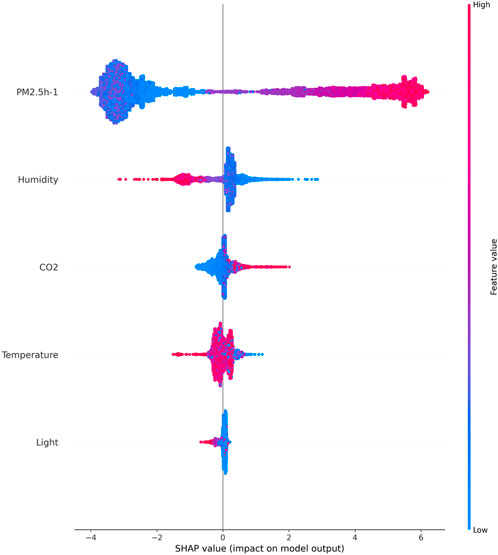
FIGURE 7. Summary of model SHAP features.
This paper presents the development of a predictive model based on ML algorithms that accurately predicts indoor PM2.5 concentration levels. The CatBoost model demonstrates significantly better predictive performance compared to the MLP, GBDT, LR, DT, and KNN models. Moreover, this study identified Ph-1 and dh-1 as the two most important predictive factors.
Emerging technologies such as the IoT, AI, and ML have shown tremendous potential in monitoring indoor environmental quality and facilitating timely intervention (Adeleke et al., 2017). The remarkable predictive capabilities of ML algorithms make them highly attractive when combined with on-site data monitoring systems to effectively determine the constantly changing levels of indoor pollutants (AdityaSharma and Gupta, 2018; Saini et al., 2022). Previous studies conducted by Elbayoumi and Yuchi have confirmed the value of ML methods in predicting PM2.5 concentrations (Elbayoumi et al., 2015; Yuchi et al., 2019). These findings align with our research, further validating the efficiency and superiority of ML models. By comparing CatBoost with other commonly used models, we highlight the superior predictive performance of CatBoost, providing valuable insights into its application for indoor air quality prediction.
Given the severity of global air pollution exceeding health thresholds, the impact of air quality on human health has garnered significant attention (Massey et al., 2012). As mentioned in the introduction, PM2.5 poses a serious threat to human health, particularly due to the potential attachment of harmful microorganisms to particulate matter. Stressing the importance of maintaining good indoor air quality in office buildings cannot be overstated, as it directly affects the health and wellbeing of occupants. Predictability plays a crucial role in controlling PM2.5 concentrations since indoor air quality improvement systems often exhibit inherent delays. Accurately predicting PM2.5 concentrations poses a considerable challenge. This study constructs a PM2.5 concentration classification prediction model using ML algorithms, enabling accurate predictions of whether PM2.5 concentrations exceed the standard and serving as a risk warning model. The model’s predicted results can be utilized as control signals in the operation and regulation of indoor air quality improvement equipment, such as fresh air systems. By forecasting in advance whether indoor PM2.5 concentrations will exceed the standard, the model helps determine whether the status quo can be maintained or if purification measures are required. Implementing the model’s predicted results as control signals guides the control system, achieving improved indoor environmental conditions while minimizing unnecessary energy consumption.
Through variable importance ranking analysis, we have determined that previous PM2.5 concentration is the most significant influencing factor in predicting whether the PM2.5 concentration exceeds the standard, as our expected. Furthermore, we observed a negative correlation between indoor humidity and the risk of PM2.5 concentration exceeding the standard. Humidity plays a vital role in the nucleation, condensation, and volatilization of particles, thereby influencing their diffusion process and altering the concentration of PM2.5 (Chithra and Nagendra, 2014). A study conducted by Yang et al. monitored indoor PM concentrations in a primary school classroom in North China and assessed the contributions of various influencing factors, the findings highlighted the critical role of indoor humidity in managing indoor PM2.5 concentration (Guangfei and YuheBing, 2023). The research results of this article align with the aforementioned studies, providing further evidence of the close relationship between indoor humidity and the likelihood of PM2.5 concentration exceeding the standard. In practical applications, this research provides valuable references for real-time assessment and management of indoor air quality. This study reveals that lower humidity increases the risk of indoor PM2.5 concentrations surpassing the standard in the next time interval, emphasizing the significance of humidity control in improving air quality.
In comparison to the MLP, GBDT, LR, DT, and KNN models, the CatBoost model demonstrates notable advantages in predicting whether the indoor PM2.5 concentration exceeds the standard. Through HPO, the model’s predictive performance can be further enhanced. Additionally, this study identifies the previous PM2.5 concentration and relative humidity as the two most influential factors for prediction.
The raw data supporting the conclusion of this article will be made available by the authors, without undue reservation.
XYW is mainly responsible for the initial writing of articles, data analysis, and so on. ZWG is mainly responsible for reviewing articles, project management, and so on. LG is mainly responsible for data collection, article polishing, and so on. All authors contributed to the article and approved the submitted version.
This study was supported by the Opening Funds of State Key Laboratory of Building Safety and Built Environment and National Engineering Research Center of Building Technology and the key special project of the National Key R&D Plan “Intergovernmental International Science and Technology Innovation Cooperation” titled “Research on Improving Energy Efficiency and Health Performance of Building Operation Based on Full Life Cycle Carbon Reduction” (2018YFE0106100).
The authors declare that the research was conducted in the absence of any commercial or financial relationships that could be construed as a potential conflict of interest.
All claims expressed in this article are solely those of the authors and do not necessarily represent those of their affiliated organizations, or those of the publisher, the editors and the reviewers. Any product that may be evaluated in this article, or claim that may be made by its manufacturer, is not guaranteed or endorsed by the publisher.
Adeleke, J. A., Moodley, D., Rens, G., and Adewumi, A. (2017). Integrating statistical machine learning in a semantic sensor web for proactive monitoring and control. Sensors 17 (4), 807. doi:10.3390/s17040807
Aditya, , Sharma, M., and Gupta, S. C. (2018). “An Internet of Things based smart surveillance and monitoring system using arduino[C],” in 2018 International Conference on Advances in Computing and Communication Engineering (ICACCE) (IEEE).
Ahn, J., Shin, D., Kim, K., and Yang, J. (2017). Indoor air quality analysis using deep learning with sensor data. Sensors 17 (11), 2476. doi:10.3390/s17112476
Akiba, T., Sano, S., Yanase, T., Ohta, T., Koyama, M., and Optuna, (2019). “A next-generation hyperparameter optimization framework,” in Proceedings of the 25th ACM SIGKDD international conference on knowledge discovery & data mining, 2623–2631.
Amy Isabella, S., Javier, R., and Peter, J. G. (2022). Integrating multiple brain imaging modalities does not boost prediction of subclinical atherosclerosis in midlife adults[J]. NeuroImage Clin. 35, 103134. doi:10.1016/j.nicl.2022.103134
BellMichelle, L., and Davis, D. L. (2001). Reassessment of the lethal london fog of 1952: Novel Indicators of acute and chronic consequences of acute exposure to air pollution. J. Environ. Health Perspect. Suppl. 109, 389. doi:10.2307/3434786
Carlos, G., Valeria, F., and Guillermo, V. (2018). Use of non-industrial environmental sensors and machine learning techniques in telemetry for indoor air pollution. ARPN J. Eng. Appl. Sci. 13, 2702-2712.
Cheng, C., Wu, H., and Liu, W. (2019). Indoor PM2.5 prediction based on multi-instance genetic neural network[J]. Comput. Appl. Softw. 36 (5), 7. (in Chinese). doi:10.3969/j.issn.1000-386x.2019.05.041
Chithra, V. S., and Nagendra, S. S. (2014). Impact of outdoor meteorology on indoor PM10, PM2.5 and PM1 concentrations in a naturally ventilated classroom. Urban Clim. 10, 77e91. doi:10.1016/j.uclim.2014.10.001
Choi, M. L., Lim, M. J., Kwon, Y. M., Kwon, Y. M., and Chung, D. K. (2017). A study on the prediction method of Emergency Room (ER) pollution level based on deep learning using scattering sensor[J]. J. Eng. Appl. Sci. 12 (10), 2560–2564. doi:10.3923/jeasci.2017.2560.2564
DaiLiuLi, X. J. Y. (2021). A recurrent neural network using historical data to predict time series indoor PM2.5 concentrations for residential buildings. Indoor Air 31, 1228–1237. doi:10.1111/ina.12794
Das, P., Shrubsole, C., Jones, B., Hamilton, I., Chalabi, Z., Davies, M., et al. (2014). Using probabilistic sampling-based sensitivity analyses for indoor air quality modelling. Build. Environ. 78 (AUG), 171–182. doi:10.1016/j.buildenv.2014.04.017
Deepti, S., and Suresh, J. (2019). Impact of intervention of biomass cookstove technologies and kitchen characteristics on indoor air quality and human exposure in rural settings of India. Environ. Int. 123, 240–255. doi:10.1016/j.envint.2018.11.059
Dorogush, A. V., Ershov, V., and Gulin, A. (2018). CatBoost: Gradient boosting with categorical features support[J].
Elbayoumi, M., Ramli, N. A., Md Yusof, N., Yahaya, A. S. B., Al Madhoun, W., and Ul-Saufie, A. Z. (2014). Multivariate methods for indoor PM10 and PM2.5 modelling in naturally ventilated schools buildings. Atmos. Environ. 94, 11–21. doi:10.1016/j.atmosenv.2014.05.007
Elbayoumi, M., Ramli, N. A., and Yusof, N. F. F. M. (2015). Development and comparison of regression models and feedforward backpropagation neural network models to predict seasonal indoor PM2 5e10 and PM2.5 concentrations in naturally ventilated schools. Atmos. Pollut. Res. 6 (6), 1013e1023. doi:10.1016/j.apr.2015.09.001
Fan, G., Xie, J., Yoshino, H., Yanagi, U., Hasegawa, K., Kagi, N., et al. (2018). Indoor environmental conditions in urban and rural homes with older people during heating season: A case in cold region, China[J]. Energy & Build.
Fisk, W. J. (2000). Health and productivity gains from better indoor environments and their relationship with building energy efficiency[j]. Annu. Rev. Energy Environ. 25. doi:10.1146/annurev.energy.25.1.537
GB (2012). “Design Code for heating ventilation and air conditioning of Civil buildings (in Chinese),” in Ministry of housing and urban-rural development of the people's Republic of China, general administration of quality supervision, inspection and quarantine of the people's Republic of China (Beijing: China Architecture & Building Press).
GB (2021). Hygienic standard for carbon dioxide in indoor air (in Chinese). National Health Commission of the People's Republic of China.
GB (2002). “Indoor air quality standard (in Chinese),” in The general administration of quality supervision, inspection and quarantine of the People’s Republic of China (Beijing: General Administration of Quality Supervision).
Guangfei, Y., and YuheBing, Z. Y. (2023). Contribution of influential factors on PM2.5 concentrations in classrooms of a primary school in North China: A machine discovery approach. Energy Build. 283, 112787. doi:10.1016/j.enbuild.2023.112787
Guo, Y., Quan, L., Song, L., and Liang, H. (2022). Construction of rapid early warning and comprehensive analysis models for urban waterlogging based on AutoML and comparison of the other three machine learning algorithms[J]. J. Hydrology, 605.
Horr, Yousef Al, Arif, M., Kaushik, A., Mazroei, A., Katafygiotou, M., and Elsarrag, E. (2016). Occupant productivity and office indoor environment quality: A review of the literature. [J]. Build. Environ. 105, 369–389. doi:10.1016/j.buildenv.2016.06.001
Huang, K., Sun, W., Feng, G., Wang, J., and Song, J. (2020). Indoor air quality analysis of 8 mechanically ventilated residential buildings in northeast China based on long-term monitoring. Sustain. Cities Soc. 54 (C), 101947. doi:10.1016/j.scs.2019.101947
Huang, G., Wu, L., Ma, X., Zhang, W., Fan, J., Yu, X., et al. (2019). Evaluation of CatBoost method for prediction of reference evapotranspiration in humid regions. J. Hydrology 574, 1029–1041. doi:10.1016/j.jhydrol.2019.04.085
Hyun, P. S., Soo, S. H., and Nam, P. S. (2018). A novel pH-responsive hydrogel based on carboxymethyl cellulose/2-hydroxyethyl acrylate for transdermal delivery of naringenin. J. Hazard. Mater. 200 (Jan.5), 341–352. doi:10.1016/j.carbpol.2018.08.011
Imran, H. (2021). Solar power system assessments using ANN and hybrid boost converter based MPPT algorithm[J]. Appl. Sci. 11 (23), 11332. doi:10.3390/app112311332
Jacobs, E. T., Burgess, J. L., and Abbott, M. B. (2018). The donora smog revisited: 70 Years after the event that inspired the clean air act. Am. J. Public Health 108 (S2), S85–S88. doi:10.2105/ajph.2017.304219
Jorge, L-B., Paulina, V., Qian, L., and ChangKyoo, Y. (2018). Sequential prediction of quantitative health risk assessment for the fine particulate matter in an underground facility using deep recurrent neural networks. [J].Ecotoxicology Environ. Saf. 169, 316–324. doi:10.1016/j.ecoenv.2018.11.024
Justin, Y. Y. L., Yanhao, M., Ricky, L. T. C., Mark, H., and Patrick, K. H. L. (2023). Artificial intelligence-based prediction of indoor bioaerosol concentrations from indoor air quality sensor data[J]. Environ. Int.
Kiki, Y., and Vinasetan, R. H. (2020). Prediction of the purchase intention of users on ECommerce platforms using gradient boosting. Int. J. Eng. Adv. Technol. (IJEAT) 10 (1), 446–450. doi:10.35940/ijeat.a1929.1010120
Kim, M. H., Kim, Y. S., Sung, S. W., and Yoo, C. K. (2009). Data-driven prediction model of indoor air quality by the preprocessed recurrent neural networks[C]. In Proceeding of the Iccas-sice. IEEE.
KimSankararaoKang, M. J. B. O. Y., Kim, J., and Yoo, C. (2012). Monitoring and prediction of indoor air quality (IAQ) in subway or metro systems using season dependent models. Energy Build. 46 (Mar), 48–55. doi:10.1016/j.enbuild.2011.10.047
Kropat, G., Bochud, F., Jaboyedoff, M., Laedermann, J. P., Murith, C., Palacios, M., et al. (2015). Improved predictive mapping of indoor radon concentrations using ensemble regression trees based on automatic clustering of geological units. J. Environ. Radioact. 147, 51–62. doi:10.1016/j.jenvrad.2015.05.006
LagesseWangLarson, B. S. T. V., and Kim, A. A. (2020). Predicting PM2.5 in well-mixed indoor air for a large office building using regression and artificial neural network models. Environ. Sci. Technol. 54 (23), 15320–15328. doi:10.1021/acs.est.0c02549
Lai, D., Qi, Y., Liu, J., Dai, X., Zhao, L., and Wei, S. (2018). Ventilation behavior in residential buildings with mechanical ventilation systems across different climate zones in China. Build. Environ. 143, 679–690. doi:10.1016/j.buildenv.2018.08.006
Lee, S., Vo, T., and Thai, T. H. (2021). Strength prediction of concrete-filled steel tubular columns using Categorical Gradient Boosting algorithm[J]. Eng. Struct., 238. doi:10.1016/j.engstruct.2021.112109
LeeKimKim, S. M. J. J. T., and Yoo, C. K. (2015). In search for modeling predictive control of indoor air quality and ventilation energy demand in subway station. Energy & Build. 98 (jul), 56–65. doi:10.1016/j.enbuild.2014.10.082
Li, L., Jamieson, K., Desalvo, G., Rostamizadeh, A., and Talwalkar, A. (2016). Hyperband: A novel bandit-based approach to hyperparameter optimization. J. Mach. Learn. Res. 18 (1-52). doi:10.48550/arXiv.1603.06560
Lim, J. J., Kim, Y. S., Oh, T. S., Kim, M. J., Kang, O. Y., Kim, J. T., et al. (2012). Analysis and prediction of indoor air pollutants in a subway station using a new key variable selection method. Korean J. Chem. Eng. 29, 994–1003. doi:10.1007/s11814-011-0278-z
Li, Z., Tong, X., Man, J., Ho, W., and Yim, S. H. L. (2020). A practical framework for predicting residential indoor PM2.5 concentration using land-use regression and machine learning methods. Chemosphere 265 (2), 129140. doi:10.1016/j.chemosphere.2020.129140
Liu, Yun, Heidari, A. A., Ye, X., Liang, G., Chen, H., and He, C. (2021). Boosting slime mould algorithm for parameter identification of photovoltaic models. J. Energy 234, 121164. doi:10.1016/j.energy.2021.121164
LiuYoo, H. C. K. (2016). A robust localized soft sensor for particulate matter modeling in Seoul metro systems. J. Hazard. Mater. 305 (15), 209–218. doi:10.1016/j.jhazmat.2015.11.051
Maher, , Elbayoumi, , Nor, , Azam, , Ramli, , Noor, , et al. (2015). Development and comparison of regression models and feedforward backpropagation neural network models to predict seasonal indoor PM2.5–10 and PM2.5 concentrations in naturally ventilated schools[J]. Atmos. Pollut. Res.
Martin, B., and Šafránek, J. (2011). Characterization of coarse particulate matter in school gyms[J]. Environ. Res.
Massey, D., Kulshrestha, A., Masih, J., and Taneja, A. (2012). Seasonal trends of PM10, PM5.0, PM2.5 & PM1.0 in indoor and outdoor environments of residential homes located in North-Central India. indoor outdoor Environ. Resid. homes located north-central India, Build. Environ. 47 (none), 223–231. doi:10.1016/j.buildenv.2011.07.018
MengSpectorColome, Q. Y. D. S., and Turpin, B. (2009). Determinants of indoor and personal exposure to PM2.5 of indoor and outdoor origin during the RIOPA study. Atmos. Environ. 43 (36), 5750–5758. doi:10.1016/j.atmosenv.2009.07.066
Ming, L., Rksa, B., and Gza, C. (2021). Recent trends in premature mortality and health disparities attributable to ambient PM 2.5 exposure in China: 2005–2017[J]. Environ. Pollut. 279. doi:10.1016/j.envpol.2021.116882
Mo, J-H. (2019). Association of particulate matter with ENT diseases. Clin. Exp. Otorhinolaryngology 12 (3), 237–238. doi:10.21053/ceo.2019.00752
Newsham, G. R., Veitch, J. A., and Charles, K. E. (2008). Risk factors for dissatisfaction with the indoor environment in open-plan offices: An analysis of COPE field study data. J. Indoor air 18 (4), 271–282. doi:10.1111/j.1600-0668.2008.00525.x
Peng, X., Li, L., Wang, X., and Zhang, H. (2022). A machine learning-based prediction model for acute kidney injury in patients with congestive heart failure. Front. Cardiovasc Med. 9, 842873. doi:10.3389/fcvm.2022.842873
Saini, J., Dutta, M., and Marques, G. (2022). Modeling indoor PM2.5 using adaptive dynamic fuzzy inference system tree (ADFIST) on Internet of things-based sensor network data. Internet Things 20, 100628. doi:10.1016/j.iot.2022.100628
Skön, J., Johansson, M., Raatikainen, M., Leivisk, K., and Kolehmainen, M. (2012). “Modelling indoor air carbon dioxide (CO2) concentration using neural network,” in World Acad Sci Eng Technol Int Sci Index 6 737–741.
Sofuoglu, S. C . (2008). Application of artificial neural networks to predict prevalence of building-related symptoms in office buildings. Build. Environ. 43 (6), 1121–1126. doi:10.1016/j.buildenv.2007.03.003
Sun, X. W., and Zhou, H. B. (2014). Research on applied technology in experiments with three boosting algorithms. Adv. Mater. Res. 3103 (908-908), 513–516. doi:10.4028/www.scientific.net/amr.908.513
Susnjak, T., Barczak, A., Reyes, N., and Hawick, K. (2012). Multiclass cascades for ensemble-based boosting algorithms[J]. Front. Artif. Intell. Appl. 241, 330–335. doi:10.3233/978-1-61499-096-3-330
T/Asc 02-2021 (2021). “Assessment standard for healthy building (in Chinese),” in The architectural society of China (Beijing: China Architecture & Building Press).
Thayer Julian, F., Verkuil, B., Brosschotj, J. F., Kevin, K., West, A., Sterling, C., et al. (2010). Effects of the physical work environment on physiological measures of stress. J. Eur. J. Cardiovasc Prev. Rehabil. 17, 431–439. doi:10.1097/hjr.0b013e328336923a
Wei, W., Ramalho, O., Malingre, L., Sivanantham, S., Little, J. C., and Mandin, C. (2019). Machine learning and statistical models for predicting indoor air quality. Indoor Air 29 (5), 704–726. doi:10.1111/ina.12580
XiaoQiZhu, F. L. Y., Hou, J., Jin, L., and Wang, J. (2015). Artificial neural networks forecasting of PM2.5 pollution using air mass trajectory based geographic model and wavelet transformation. Atmos. Environ. 107, 118–128. doi:10.1016/j.atmosenv.2015.02.030
Xie, H., Ma, F., and Bai, Q. (2009). “Prediction of indoor air quality using artificial neural networks[C],” in International Conference on Natural Computation (IEEE Computer Society).
Xie, H, Xiang, Y., Yang, E., and Zhang, H. (2021). Factors influencing hypertrophic scarring after thyroidectomy. Electr. Eng. 34, 1–6. doi:10.1097/01.ASW.0000775924.92065.78
Xue, L. (2022). Marppi: Boosting prediction of protein-protein interactions with multi-scale architecture residual network[J]. Briefings Bioinforma.
XueWangLiu, Q. Z. J., and Dong, J. (2020). Indoor PM2.5 concentrations during winter in a severe cold region of China: A comparison of passive and conventional residential buildings. Build. Environ. 180, 106857. doi:10.1016/j.buildenv.2020.106857
Xu, C., Xu, D., Liu, Z., Li, Y., and Li, N. (2020). Estimating hourly average indoor PM2.5 using the random forest approach in two megacities, China. Build. Environ. 180, 107025. doi:10.1016/j.buildenv.2020.107025
Yamamoto, H., Kure, T., Kondoh, J., and Kodaira, D. (2022). Multi-point forecasting of photovoltaic power generation by light gradient boosting machine[J]. Grand. Renew. Energy Proc. 2, 9. doi:10.24752/gre.2.0_9
YeganehMotlaghRashidi, B. M. Y., and Kamalan, H. (2012). Prediction of CO concentrations based on a hybrid partial least square and support vector machine model. Atmos. Environ. 55 (none), 357–365. doi:10.1016/j.atmosenv.2012.02.092
Yuchi, W. (2017). Modelling fine particulate matter concentrations inside the homes of pregnant women in ulaanbaatar, Mongolia[J].
Yuchi, W., Gombojav, E., Boldbaatar, B., Galsuren, J., and Allen, R. W. (2019). Evaluation of random forest regression and multiple linear regression for predicting indoor fine particulate matter concentrations in a highly polluted city. ] Environ. Pollut. 245, 746–753. doi:10.1016/j.envpol.2018.11.034
Zakir, S. S., Khondaker, S., and Nafiz, I. K. (2022). Machine learning-based failure mode identification of double shear bolted connections in structural steel[J]. Eng. Fail. Anal., 139. doi:10.1016/j.engfailanal.2022.106471
Zhao, Q. Y., Wang, H., Luo, J. C., Luo, M. H., Liu, L. P., Yu, S. J., et al. (2021). Development and validation of a machine-learning model for prediction of extubation failure in intensive care units. Front. Med. (Lausanne). 8, 676343. doi:10.3389/fmed.2021.676343
Zhao, L., Chen, C., Wang, P., Chen, Z., Cao, S., Wang, Q., et al. (2015). Influence of atmospheric fine particulate matter (PM 2.5) pollution on indoor environment during winter in Beijing. Build. Environ. 87 (5), 283–291. doi:10.1016/j.buildenv.2015.02.008
ZhaoLiuRen, L. J. J. (2018). Impact of various ventilation modes on IAQ and energy consumption in Chinese dwellings: First long-term monitoring study in Tianjin, China. Build. Environ. 143 (OCT), 99–106. doi:10.1016/j.buildenv.2018.06.057
Keywords: indoor environment, PM2.5 limit, CatBoost model, classification prediction, machine learning
Citation: Guo Z, Wang X and Ge L (2023) Classification prediction model of indoor PM2.5 concentration using CatBoost algorithm. Front. Built Environ. 9:1207193. doi: 10.3389/fbuil.2023.1207193
Received: 17 April 2023; Accepted: 20 July 2023;
Published: 31 July 2023.
Edited by:
Joanna Ferdyn-Grygierek, Silesian University of Technology, PolandReviewed by:
Mohamed F. Yassin, Kuwait Institute for Scientific Research, KuwaitCopyright © 2023 Guo, Wang and Ge. This is an open-access article distributed under the terms of the Creative Commons Attribution License (CC BY). The use, distribution or reproduction in other forums is permitted, provided the original author(s) and the copyright owner(s) are credited and that the original publication in this journal is cited, in accordance with accepted academic practice. No use, distribution or reproduction is permitted which does not comply with these terms.
*Correspondence: Xinyu Wang, d2FuZ3hpbnl1MzU2NTMzNTI5QDEyNi5jb20=
Disclaimer: All claims expressed in this article are solely those of the authors and do not necessarily represent those of their affiliated organizations, or those of the publisher, the editors and the reviewers. Any product that may be evaluated in this article or claim that may be made by its manufacturer is not guaranteed or endorsed by the publisher.
Research integrity at Frontiers
Learn more about the work of our research integrity team to safeguard the quality of each article we publish.