
95% of researchers rate our articles as excellent or good
Learn more about the work of our research integrity team to safeguard the quality of each article we publish.
Find out more
ORIGINAL RESEARCH article
Front. Built Environ. , 24 May 2023
Sec. Indoor Environment
Volume 9 - 2023 | https://doi.org/10.3389/fbuil.2023.1202965
This article is part of the Research Topic Healthy and Energy Efficient Buildings View all 13 articles
 Paul Fowler1*
 Fernando Del Ama Gonzalo1
 Sarah Newell1James Poolman1Maria J. Montero Burgos2
 Roberto Alonso González Lezcano3
Introduction: This research will determine if a native American shelter (wigwam) can create comfort and if while doing so can provide healthy indoor air quality (IAQ) levels as defined by current standards. Concurrent to this research a technique to digitally model the outcomes of comfort created within the shelter was developed.
Methods: A fullsize example of a wigwam was built and data from inside and outside the wigwam monitored for comparison. Data collected both inside and outside was temperature and relative humidity of the air, collected inside the wigwam were CO2, VOC, and PM2.5 levels. The wigwam allowed us to compare the accuracy of a digital model created in Design Builder. The Design Builder model was made to the specific size, materials, and location of the actual wigwam. This allowed an accurate comparison of temperature and relative humidity levels. Design-Builder accurately recreated the attributes of the full-size wigwam.
Results and Discussion: It was found that comfort can be achieved to modern standards in this native shelter; as temperature, relative humidity, and rainfall exposure can all be controlled to acceptable levels. Indoor air quality is always at an acceptable level when a fire isn’t active. When an open fire is introduced, the particulates and VOC released into the interior of the wigwam are at dangerous levels. A woodstove with flue pipe allowed for comfort to be maintained at healthier air quality levels but did not reach acceptable levels for particulate matter.
Before the settlers moved to North America, the indigenous woodland people, or the Algonquian tribes such as the Wampanoag, Abenaki, and Narragansett (Native American Houses, 2022), constructed a specific type of shelter called a wigwam. This shelter style was pervasive wherever tree branches were abundant and located in the northeastern region of America. Although more permanent than a tipi, this dwelling was still used as temporary or semi-permanent residency (Nabokov & Easton, 1989; Mayrl, 2022). Historically, constructing a wigwam could take one to 3 weeks. A uniform curved shape of the wigwam and wetu allowed the interior space to be evenly cooled or heated while withstanding precipitation effects (Morgan, 1881; Montgomery, 2000). The more traditional circular wigwam was typically 6–10 ft tall and 10–14 ft in diameter (Kalman, 2000; Kidadl, 2022). Steps to construct this shelter in real-life were carried out in a straightforward procedure: Traditionally, a relatively flat site would be surveyed. Next, the wigwam’s mainframe was built with young red maple, swamp maple, or even red willow saplings (The Building of a Wigwam, 2022). These flexible pieces would often be straight, no thicker than two inches in diameter, and 10–16 ft long (Bushnell, 1922). Twelve to sixteen points for holes would be plotted around the circle (Speck, 1922). The saplings would then get bent into arches. Where the arches intersected, bark fibers would be used to lash the saplings together (Nyholm, 1981). Layers of “hoops” or “bands” made of saplings would be added and be equally spaced apart from one another (Wigwam, 2022). Two lower bands on the frame would not connect on the eastern side to ensure room for an entrance. One of the last steps was to situate the “coverings” over the frame but leave a hole at the top to allow fire-generated smoke to escape. Overlapping birchbark pieces created watertight, impenetrable skin (Holley, 2007). In the summer, woven rushes would be used instead of bark for the outside layer (Montero Burgos et al., 2020). A sufficient correlation exists between the health complications experienced by the Native American population and the unhealthy level of exposure to damaging particles from birth to death. Much of the harmful particulate matter in these communities originated from burning biomass freely in a compact living area, such as a wigwam, with only a small opening to release the generated smoke (Ghio, 2017). Native Americans would employ fire burning for heating and cooking purposes. However, subjecting inhabitants to an elevated concentration of damaging particles is shown to cause health concerns analogous to the effects of desert dust storms, cigarette, and tobacco smoke. These consequences increase susceptibility to lower respiratory tract infections in Native American communities. Conversely, higher particulate matter concentrations can contribute to an increased rate of asthma, chronic bronchitis, heart disease and cardiovascular/respiratory mortality, and hospital admissions (NY State Gov., 2022). Some authors have shown that chronic bronchitis was reported in Native American people living in rural areas. Due to biomass fires and stove emissions, the severe cough cases were comparable to those diagnosed in highly populated industrial areas. The prevalence of those cases among Native Americans was more significant in women than in men, unlike the cases reported in industrial areas (Gold et al., 2000). Noting that air quality is integral to how a building performs efficiently, assessments were done measuring the concentration of VOC (volatile organic compounds), PM 2.5 (Particulate Matter 2.5), and C02 levels when a fire is burning within the wigwam. According to the World Health Organization, a healthy PM 2.5 concentration is around 10 µg/m3, with a slightly dangerous accumulation at 25 µg/m3 (Gonzalo et al., 2022). According to the U.S. Environmental Protection Agency 2022 standards, 35 µg/m3 is considered the standard limit within a 24-h standard period. Hazardous conditions gather at 250–500 µg/m3 (EPA, 2022). Although some researchers stated that it is not possible to give a unique CO2 threshold valid for every building type, some studies recommend keeping indoor CO2 concentration below 1000 ppm to reduce airborne transmission, (Fantozzi et al., 2020). Zero-220 ppb (parts per billion) is considered healthy for VOC levels. Anything between 220–660 ppb, one can start to experience uncomfortable symptoms such as nausea, dizziness, or irritation of the eyes. Longer exposure with levels surpassing 2,200 ppb can cause health compromises such as liver and kidney damage, cardiovascular diseases, and cancers (Getuhoo, 2022; IBM, 2022).
Human comfort can be evaluated through different methods. Fanger’s Predicted Mean Vote (PMV) method was developed to consider the different variables that influence the comfort assessment for an indoor environment. (Fanger, 1970; Fanger, 1973). It allows the thermal sensation prediction from the heat-balance equation in which six main factors must be considered: metabolic rate, clothing insulation, air temperature, radiant temperature, airspeed, and humidity. On the other hand, the adaptive model approach considers people as active subjects who can interact with and adapt to the environment. Fanger’s heat balance model might be unsuitable for assessing the actual thermal sensation that people may experience, especially in naturally ventilated buildings. Conversely, the adaptive model does not include several parameters implicated in thermal perception. Despite its limitations, Fanger’s Predicted Mean Vote remains the most used worldwide (Lamberti, 2021). ISO 7730 (2005), ASHRAE Handbook (2012), and ASHRAE standard 55 (2017) defined local thermal comfort as satisfaction with the thermal environment that must be evaluated by subjective means. Open or closed fires inside the wigwam generate radiant heat at a high temperature that affects the comfort of occupants due to convective airflows generated by the heat source and the top opening, so inhomogeneity in indoor air temperatures must be studied (De la Torre, 2014). A method to assess indoor comfort must consider the position of occupants, ceiling height, the room’s shape, radiant asymmetry, and the angle factor, which depends on the occupant’s position (Fawwaz et al., 2022).
The lack of thermal mass in the wigwam’s envelope and the fluctuations in outdoor conditions make the simulation of the indoor environment a challenging task (Ruiz et al., 2017). Thus, it is essential to validate the models to gain trust in the building simulation. Many studies have been published on the validation of energy simulation results, and interest in this subject has increased significantly over the last few years (Lezcano and Burgos, 2021). The literature review included scientific articles by other authors who have analyzed these criteria to standardize the calibration process of modeling a building and to clarify the typical errors that can occur in such modeling (Bozkaya et al., 2018; Mazzeo et al., 2020). Evaluating shelters’ energy efficiency and indoor comfort under extreme weather conditions has been one of the topics of former research articles. Pilsworth (1978) proposed a straightforward procedure for calculating shelters’ heat losses based on envelope parameters and air infiltrations. Several factors influence the thermal performance of the shelters. Firstly, the form factor of the shelter impacts the heat exchange between indoors and outdoors. Secondly, the envelope color can help optimize the inhabitants’ comfort conditions. Finally, the construction method affects the air leakage and the cost of the structure (Dominguez et al., 2020). As energy simulation software became a common practice for modeling building thermal performance, researchers utilized digital models for temporary shelters to sustain the actual data on the thermal properties of these shelters. Crawford et al. (2005) modeled different prototype shelters and tested their performance under severe cold conditions using simulation models validated using experimentally measured data from built prototypes. Ulal et al. (2022) used OpenStudio for a soft-wall shelter unit to predict indoor thermal comfort. Finally, computational fluid dynamics (CFD) has also been used to study shelter performance under various conditions (Borge-Diez et al., 2013). Other studies addressed the users’ energy performance and social context, proposing that the users’ social behavior, including clothing, activities, and schedules, affect energy consumption and comfort. These studies used survey methods to assess the thermal comfort of occupants of humanitarian tents (Albadra et al., 2017). However, fewer studies have been based on shelter comfort and indoor air quality. Furthermore, most of these studies focused on current technology shelter prototypes with electric or fossil-fueled heaters. Thus, this research’s novelty lies in applying energy simulation tools and actual measurements for indoor air quality optimization and renewable fuel consumption for traditional shelters.
The main objective of this article is to assess the existing functionality and comfort parameters of the traditional wigwam and compare it to a digital version of an identical model made in Design Builder. By adjusting the properties of the virtual one, it is possible to have the results congruous to existing standards to ensure comfortability. The second parameter analyzed is the indoor air quality (IAQ) through and between the open and enclosed fire operations. The IAQ components include carbon dioxide (CO2), volatile organic compounds (VOCs), Particulate Matter 2.5 (PM 2.5) evaluated damaging symptoms to the human body. This paper will evaluate the precision of Design Builder by analyzing any discrepancies in the data between the computerized and real-life model.
A full-scale wigwam replica was constructed which allowed for the evaluation of human comfort and interior air quality within the environment. A digital model of this wigwam was prepared using Design Builder; which was based on the materials and size of the full-scale replica. These two models allowed us to compare data documented in real life with that produced in the digital model. This section presented the methods to evaluate the constructed wigwam’s ability to adhere adequately to standards of comfortability and IAQ. Data from inside the wigwam and the surrounding local environment was collected throughout the fall and into the winter. Information from a week in October and December was used as samples to be evaluated against ASHRAE defined standards of comfort and IAQ. Finally, this empirical data was compared to the virtual rendition to verify the accuracy of the computer program.
Construction of a full-scale version of a traditional wigwam shelter was started in July 2022 in Winchendon Mass (42.6871°N, 72.0440°W). Wigwam was built using traditional techniques; first by scouting a flat piece of Earth and then mapping out proposed holes on the ground to dig out later. Figure 1 illustrates eight long poles that make up the mainframe, each measured to be 14′in length and between 1 1/8″ and 1 1/2″in diameter. The mapped-out holes were dug into the ground, measuring about 1 ½" in diameter and 8″to 10″deep. For each hole, one of the eight long poles was inserted. These poles would be bent in an arching fashion connecting to the opposite-facing pole by being lashed together in the middle at the highest point of the curve. These crossings would also be attached where the arches would intersect with other pairs of poles. Traditionally components would be connected using bark fibers, but in this example a non-traditional approach was used connecting members together using string as the securing mechanism (Knight, 2017). As illustrated in Figure 1, the sub-framing system was made up of two smaller poles placed into each of the four holes labeled k, j, i, l and bent into an arch facing away from each other, crossing the mainframe members 1, 2, 3, and 4 forming smaller arches when fastened together. A compression ring, adding reinforcement and resisting the arches natural tendency to compress under stress was then added to the top of these arches tying the frame together as a unified structure (Nabokov and Easton, 1989; Schwartz, 2009). The unconventional sheathing selected was cotton canvas, a biodegradable material that took the place of the traditional sheathing of bark. The canvas was then cut to specific shapes to ensure overlapping so the wigwam would be watertight. The canvas was secured using a needle and thread. A space was delegated for a doorway and included a canvas flap between holes E and F. A hole at the top was left uncovered to allow any generated smoke from a fire to escape.
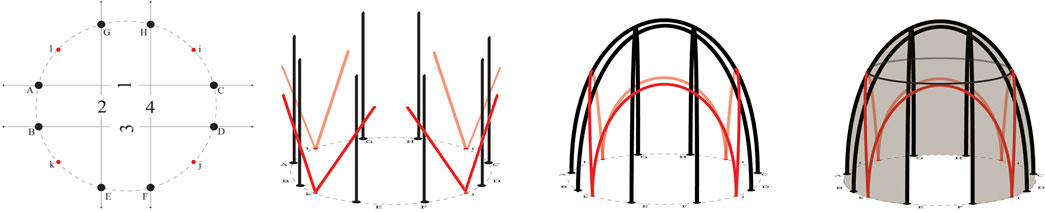
FIGURE 1. An illustrated simplification of the construction of a wigwam.
Defined by engineer Povl Ole Fanger as the Predicted Mean Vote (PMV), “comfort” is considered the product of six variables: metabolic rate, thermal insulation of clothing, mean radiant temperature, air velocity, air temperature, and relative humidity (Fanger, 1973). The CBE Thermal Comfort tool established by the University of California Berkeley is an integrative tool used to assess all these factors per the standards set by ASHRAE-55 (2017). Since the latter three factors of the PMV were actively measured and assessed in real life, and the former three were not, metabolic rate, thermal insulation, and mean radiant, these variables were preset in the CBE tool: clothing set to 1 Clo (typical winter clothing), the metabolic rate set to 1.2 Met (standing, relaxed). Operative temperature is a function of the Mean Radiant Temperature. The performance goals for the wigwam to be considered as comfortable according to the standards of ASHRAE -55–2017 (Kabrein, 2017), had to retain an air temperature level of 19.4°C–27.8°C and a relative humidity range that was less than 80% with no lower limit (CBE, 2022.). The indoor relative humidity and temperature data points were collected with an Elitech RC—51 Waterproof USB Temperature and Humidity Data logger located within Wigwam’s enclosed canvas skin. For the outdoor temperature and relative humidity, a matching datalogger was implemented 20 ft from the structure. The Elitech RC—51 Waterproof USB Data logger is a battery-operated device that measures temperature and relative humidity every 5 min and logs this information. Logged information can be transferred to a computer and exported as an EXCEL document. Measuring rainfall was done with three rain gauges. One rain gauge was placed outside directly beside the wigwam, one inside the Wigwam directly under the opening in the roof of the Wigwam, and the last off to the side inside the structure, where people would be located. At each rain event, starting from the time the Wigwam was completed to when precipitation changed from rain to snow, the amount of rain was measured and documented. Measuring air velocity was done using a handheld anemometer (Moreno-Rangel et al., 2018). These measurements were done at each fire event by measuring the air velocity directly outside the structure and inside at various times. They were then recorded and later placed into graphs. The wind velocity in the CBE tool was set to 0.1 m/s. The indoor air quality in the wigwam was monitored in this study using an AWAIR Element indoor air quality monitoring device. Relative humidity, temperature, CO2, VOC, and PM2.5 data points were collected with an AWAIR device located within Wigwam’s enclosed canvas skin. The AWAIR is a device that can function as a stand-alone or with other Smart Home devices (Dominguez et al., 2020). Each device can accurately monitor 1000 square feet of indoor air. Relative humidity and temperature are measured by a complementary metal-oxide-semiconductor (CMOS). A Non-Dispersive Infrared Sensor (NDIR) measures the CO2 concentration. In addition, a Multi-pixel metal oxide gas sensor and a laser-based light scattering sensor measure the VOC and PM2.5 concentration, respectively. These devices have been used lately to assess indoor air quality, especially in residential buildings. The characteristics of the measurement devices are summarized in Table 1. Typically, the indoor air quality was relatively stable when there was not a heat source introduced into the wigwam interior. Wood fires were utilized as the heat source; these fires were either “open” or “enclosed.” The “open” fires did not consist of any enclosed implementation that surrounded the active flames or any chimney directing the smoke through the top of the hole. A Guide Gear portable wood-burning stove where the chimney allowed the generated smoke to be vented out the top constituted an “enclosed” fire (Efficiency Valuation Organization, 2012).
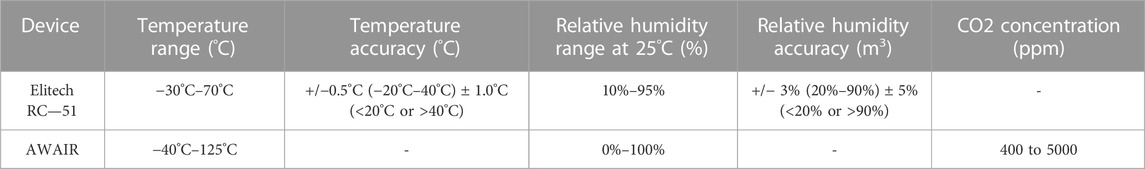
TABLE 1. Characteristics of the measurement devices.
Design-Builder requires a climatic file to recreate the model’s outdoor and indoor conditions. EnergyPlus website provides this type of file from all over the world. The one used for the wigwam simulation has been the one that contains the information regarding Keene Dillant-Hopkins Airport (WMO station 726165, 42.9065°N, 72.2726°W). This airport is located about 20 miles away from the place where the actual wigwam was built. To adapt the information contained in this file to the measured outdoor conditions of this shelter, the values for the outdoor dry-bulb temperature and its matching outdoor relative humidity were substituted by the values recorded by the data logger. This way, the accuracy of the indoor values calculated by Design-Builder was higher. Its corresponding wet bulb temperature and dew point temperature were determined using the software Elements, designed by Bigladder© software. Geometrically, Design-Builder divided the envelope of the wigwam into two groups of surfaces according to their inclination. Any surface that exceeded 70° was considered as a segment of the wall, while inclinations that were shorter constituted parts of the roof. This fact implies that their thermal transmittances (W/m2K) are different, even though their assigned material was the same, the cotton duck that covered the whole structure. In conclusion, they are slightly different because of their corresponding surface resistance values (m2K/W). The model’s door was a different element, even though its material was cotton duck. This element only affected the CFD model since it let the outdoor air enter the wigwam. Measures of area and volume of the wigwam are shown in Table 2. Occupancy was not considered, so zero persons per square meter is the value introduced as an input for the simulation. Density and conductivity are two complementary parameters. The former determines the speed at which heat will transmit (diffusivity) and its ability to accumulate heat (effusivity), while the latter only indicates the ability of these materials to oppose the passage of heat. Considering that the envelope’s thermal conductivity is equal to 0.084 W/mK, this material would be equivalent, in short, to a thermal transmittance coefficient of 0.47 W/m2K for 1.3 mm. The wigwam virtual model was created as a dome whose floor has twenty edges and was divided into four horizontal rows. Table 3 shows the technical characteristics of the envelope made with cotton duck. The values were taken from Lawson et al. (2005).

TABLE 2. Areas and volume of the wigwam.

TABLE 3. Summary of the envelope materials (Sunforger® Tent Canvas, 2023).
To take into account the influence of the hearth when it was lit up, the first option was to consider a group of people with a similar heat load. Nevertheless, that option was ruled out because it increased relative humidity. Thus, an internal sensible heat load was loaded into the model. The amount of wood used was different depending on the heating system. For open fires, the average wood was 4.6 kg per hour, whereas for the woodstove the average amount of wood was 2.1 kg per hour. On the reported days, the fire was operating for 5 h, so the total amount of wood was 23 kg for open fires and 10.5 kg for wood stoves. According to Kristak et al. (2019), the considered thermal heat capacity of wood was 3.5 kWh per kg, so an imaginary load of 8 kW was added to the model to mimic the internal sensible heat source of a wood stove at 370°C. By taking this option, the humidity levels recorded by the data logger in the wigwam were very similar to those delivered by Design-Builder. Besides, this heat source load had to be assigned a schedule in Design-Builder. It was designed considering the moment the hearth was lit up and the last trunk was added. At that moment, it reached its highest temperature, 370°C. From then, its temperature begins to decrease. By loading the open fire with this solution, no heating set point had to be established in the model or any heating system. This way, the results obtained by Design-Builder were not manipulated to match those delivered by the data logger. Air tightness is one of the parameters that can affect the energy performance of these sorts of structures. Mazzeo et al. (2020) considered 0.6 ACH the performance of a similar tent with low wind exposure in cold climates. Ulal et al. (2022) considered 1.4 ACH in tents with high wind exposure. Persily et al. (2009) considered air change rates ranging from 0.55 to 1.08 in emergency shelters with mild and calm wind conditions. Due to the low exposure to wind due to existing constructions around the prototype, the model’s airtightness was established at a constant rate of 0.7 ACH. The turbulence model corresponds to the k-e model, which belongs to the RANS family models (Reynolds Averaged Navier-Stokes). The discretization scheme was upwind, substituting the defining set of partial differential equations with a group of finite difference equations.
This section of the present research aimed to develop a methodology to match the measurements delivered by the data loggers with the results from the simulation. This way, the climatic data of its location and its surroundings were introduced into the model. Thus, its measurements, the technical characteristics of its envelope, and the hearth lit up inside it were considered. Design-Builder v7.02.006 software has been used in previous articles as a Building Energy Simulation tool to assess the energy performance of Native American shelters (Radhi, 2010). It is based on the “EnergyPlus” engine, allowing users to calculate the energy consumption of the building, the hourly variation of temperature and relative humidity, and the impact of supply air on temperature and velocity distribution within a room with computational fluid dynamics (CFD) (Neymark, 2002; Del Ama Gonzalo et al., 2023). In addition, the simulation process by Design-Builder has been validated with the Building Energy Simulation Test (BESTest) regarded by the American Department of Energy to assess building energy simulation programs’ features. (William et al., 2021; Tan et al., 2022). Parametric analysis screens allow the user to investigate the effect of variations in design parameters on several performance criteria (Wang et al., 2012).
The experimental indoor air temperature and relative humidity were used to evaluate the precision of the simulation results. For this objective, three accuracy indices were calculated for each short-time testing campaign and each parameter, the Normalized Mean Bias Error (NMBE), the Coefficient of Variation of the Root Mean Square Error (CVRMSE), and the coefficient of determination (R2). However, all these coefficients derive from the Mean Bias Error (MBE), shown in Eq. 1.
where Ai represents the actual data measured, Si is the data simulated by the tools, and n is the number of samples. RMSE varies between zero and one. A value closer to zero indicates an absence of deviations between measured and simulated data. However, the main issue with this parameter is that the sum of positive and negative values could reduce the value of MBE and, thus, the magnitude of deviations. Eq. 2 shows the Normalized Mean Bias Error (NMBE) that results from dividing MBE by the mean of measured values, Ā, and p is the number of parameters included in the control volume, which, for calibration purposes, is suggested to be zero.
This parameter can also cause cancelation errors, so ASHRAE Guideline 14, 2014 defines a procedure for validating the building energy model against actual data (Fernández and Ramos, 2017). In addition, the International Performance Measurement and Verification Protocol (IPMVP) and the Federal Energy Management Program (FEMP) propose a methodology to assess the accuracy of energy simulations. It proposes limits for the Root Mean Square Error (RMSE) and the Coefficient of Variation of Normalized Root Mean Square Error (CVRMSE), shown in Eqs 3, 4, using the average as a normalization means to verify the precision of the energy model. The CVRMSE calibrates models in measured building performance and indicates instability in the observed relationship between variables in the baseline period. It is the coefficient of the variation of the simulated values relative to the measured ones.
Finally, Eq. 5 shows the expression of the coefficient of determination, R2. It displays how close simulated values are to the regression line of the measured values. It is another statistical index commonly used to measure the uncertainty of the models. It is limited to between 0.00 and 1.00 where the upper value indicates that the simulated values correspond to the measured ones correctly and the lower ones do not. It is not a prescriptive value for calibrated models, but the ASHRAE Handbook and IPVMP always recommend values >0.75 for hourly measurements.
The open and enclosed fires were constructed for 3 months to analyze the performance of the wigwam in various climates. Throughout all the months tested, the data collected from October 16th to the 23rd was explicitly examined, as the environment was the most temperate week, and from December 18th to the 25th as it was the coldest.
During October, two woodstove fires on the 16th and 23rd were made, with an open fire on the 22nd. For December, one open fire on the 24th with three enclosed fires on the 18th, 21st, and 25th were built. The collected data is presented in two categories: comfort and IAQ. The comfort category illustrates temperature and relative humidity trends, while the IAQ denotes CO2 levels and harmful particulate matter such as VOCs and PM 2.5s.
Figure 2 helps delineate a steady pattern between the indoor temperature and relative humidity reminiscent of the mild weather in October, during the time when this was collected. The range of indoor relative humidity when there was no fire operating was between 85.9% and 92.8%. However, as the temperature increases because of the interior heat source, the relative humidity subsides to 39%–67.3%. According to ASHRAE-5-2017 and CIBSE 2005&2006 guidelines, this performing range is acceptable. The indoor temperatures during the enclosed and open fire reached and maintained an ideal thermal climate between the degrees of 18.2°C–30.2°C. The outdoor temperature nearly replicates the indoor temperature when there are no external variables.

FIGURE 2. October’s collected temperature and relative humidity data in and between periods of fires.
For each fire made in October, there is a significant spike in the graphs for particulate matter shown in Figure 3. During the first enclosed fire on the 16th, VOCs reached an accumulation of 472.4 ppb. The second enclosed fire on the 23rd attained 700.2 ppm. If occupants are exposed to either of these levels for an extended period, it could cause Adverse respiratory side-effects. The PM 2.5 levels were significantly elevated, with highs between 54.6–195 µg/m3. This particulate concentrate was above the dangerous threshold of 25 µg/m3. The CO2 levels rose with the other two variables and increased to an unsafe elevated amount of 643.7–703.6 ppb. The open fire particulates exceeded the closed fire’s IAQ values and hit hazardous levels for occupant exposure.
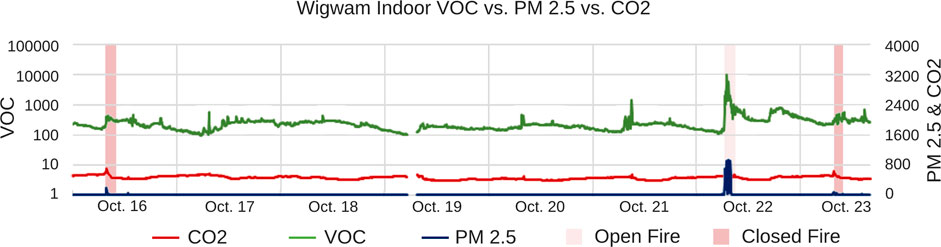
FIGURE 3. October’s collected IAQ data in and between periods of fires.
Figure 4 illustrates the indoor temperature and relative humidity levels inside the wigwam and the outdoor temperature and relative humidity levels during the selected days in December. For indoor relative humidity, the top graph shows a range between a high of 95.8% and a low of 67% between the time of each fire operation. This number is elevated from the ASHRAE-5-2017 ideal range of 40%–60%–80%. However, with a fire, there is an observable pattern where the indoor relative humidity drops as the indoor temperature crests. When there were any fires, the relative humidity descended to around 26.3%–34.2%, a low relative humidity according to ASHRAE-5-2017. The graph presents the relative humidity tapering noticeably lower on the 24th with the open fire, even though the indoor temperature did not reach the highest of the three other fires. All the fires during this time reached and maintained temperature levels within the guidelines of “comfortability,” according to ASHRAE -5-2017. The highest temperature reached was on the 21st with an enclosed fire that attained 26.7°C. Without any fires, the wigwam’s indoor temperature was aligned with the outdoor temperature, although slightly colder due to the lack of apricotty. The outdoor relative humidity oscillations show the relative humidity mirroring the interior with slight variation except for fire.
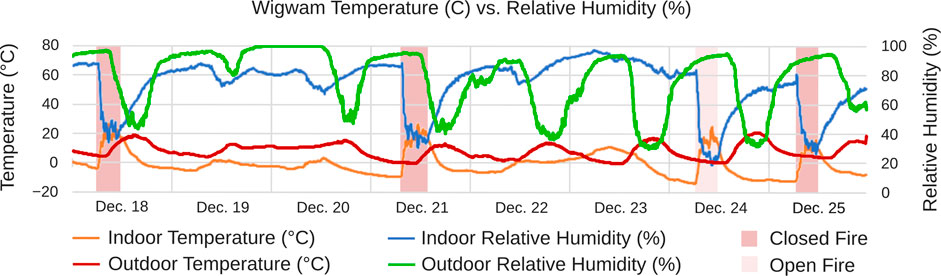
FIGURE 4. October’s collected temperature and relative humidity data in and between periods of fires.
As the indoor temperature rose with each fire made, there was somewhat of a replicated pattern amongst the IAQ variables. The data in Figure 5 suggests that having an enclosed fire significantly impacts the amount of particulate matter being projected into the indoor environment. Having an enclosed fire influences the amount of particulate matter by lowering the intensity of particulate matter. While analyzing the PM 2.5 levels, it is apparent that although significantly less than the open fire, the highest PM 2.5 levels for the first two enclosed fires and last fire reach around 119.8, 194, and 697.2 µg/m3. These numbers are well above the threshold of 25 µg/m3, which might constitute hazardous levels. As for the VOC levels, they are also all considerably higher than the amounts from PM 2.5. The VOC levels for the same enclosed fires reach 317.7, 332–391 ppb. These amounts are not at dangerous levels but could still potentially produce adverse physical symptoms. The CO2 concentrations for the enclosed fires rose with the particulate matter and achieved levels between 574.1 ppb and 713.1 ppb. Data collected during the open fire in December shows levels that are hazardous to human health. The CO2 levels reached peaks up to 896.4 ppb, VOC levels peaked at 10,592 ppb, and PM2.5 levels reached magnitudes close and up to 1000mg/m3 multiple times during the fire event. The heat source started at 8:30 on 17 December (until then, it was off). From then to 9:30, just 25% of its capacity (79°C) was on. From 9:30 to 10:45, it rose to 273°C. Finally, at noon, when no more wood was added, it reached its highest point, 370°C. From then on, its temperature decreased since no more wood was added. From 14:00 to 24:00, it went out.
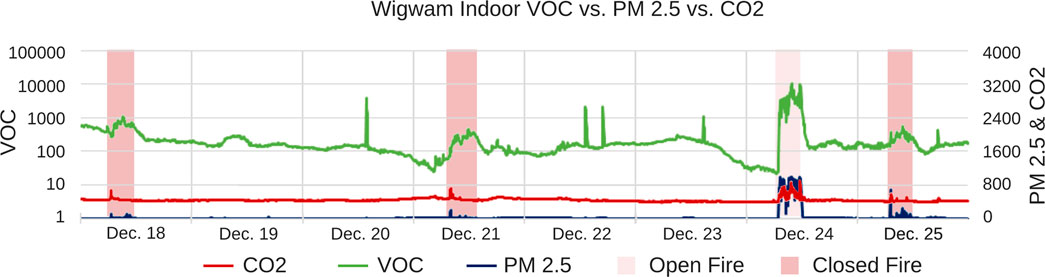
FIGURE 5. December’s collected IAQ data in and between periods of fires.
It is important to acknowledge that any succeeding IAQ oscillation after each initial peak during any closed fires in October and December reflected when the woodstove door was opened to fuel the fire. Although these initial peaks failed to match the criteria of healthy air quality standards, it was essential to look at the timeline for these crests. For example, as shown on this last graph, the period when the PM 2.5 and CO2 levels initially spiked is not continuous for any of the fires. Therefore, this would not constitute consistent exposure. On this day, these subsequent peaks were less than the initial spike. The VOC pattern, on the hand, displayed levels rising with time and only tapering off when the fires dies down.
The location of the wigwam under study determines the climatic conditions. Therefore, the weather file is applied by default in the Design-Builder software application. In addition, the data loggers measured on-site parameters inside and outside the prototype. The Computational Fluid Dynamics analysis (CFD) was carried out in two scenarios. The first corresponds to the wigwam’s surroundings, where two buildings and several trees can be found. Wind force comes from the north, and its velocity was estimated as 2.15 m/s. This value corresponds to the average annual wind velocity for Keene Dillant-Hopkins Airport according to the EnergyPlus weather files. The solution converged in iteration number 11077. As shown in Figure 6, the airflow speed at the wigwam location was decelerated by the surrounding obstacles. Therefore, its value (2.15 m/s) decreases by approximately 50%. It works in the same way vertically and horizontally. As seen in Figure 6, its surroundings are composed of trees and two buildings, which could affect indoor temperatures and their corresponding humidity levels. Moreover, they cast shadows and impacted the wind velocity and direction in such a way that was essential to simulate the indoor values of the wigwam. Besides, wind mainly blows from the north in the wigwam location, the same orientation protected by the nearby trees and the two constructions mentioned above. So, indoor conditions were highly influenced by them.
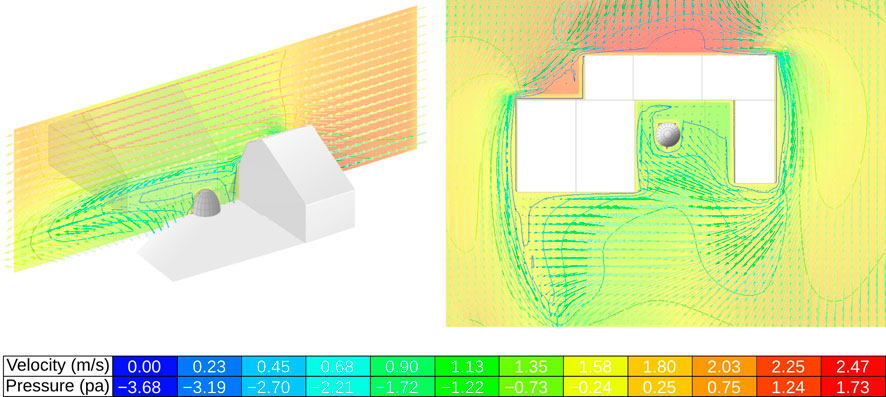
FIGURE 6. Airflow speed at the wigwam location.
Figure 7 corresponds to the indoor space of the model. A hearth was placed in its center, modeled as a Design-Builder assembly component, as a radiator. Its temperature was estimated at 100°C since the indoor temperature of the wigwam was known and established as 22°C approximately when the hearth was lit. In this case, convergence was reached in iteration number 999. As can be seen, the hearth sucked the airflow that came from the entrance, triggering a little swirl that would get out the wigwam through the smoke hole when it was opened. This effectively created a little a little air-conditioning machine since its ventilation system started when that hearth was lit up. In this way, the wood stove installed inside the wigwam created airflow from the exterior up through the smoke hole. This airflow can be controlled by modifying the percentage of the opened area of the door. The bigger the area, the slower the airflow was, and vice versa.
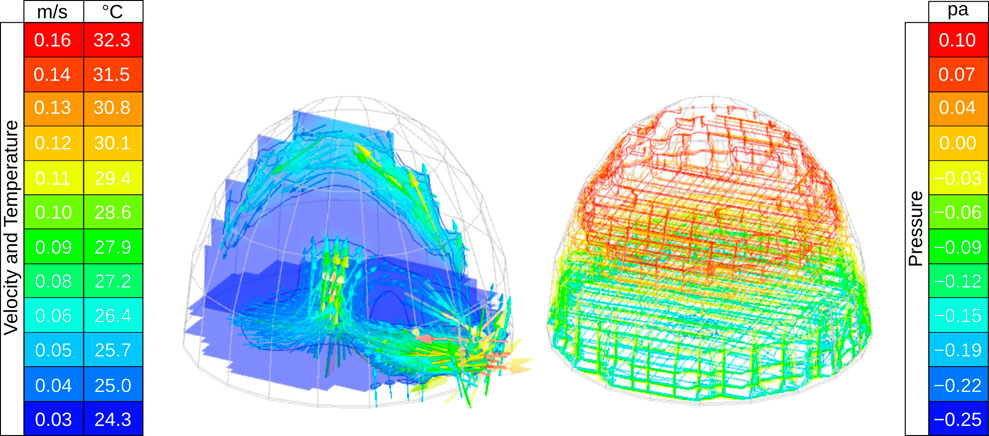
FIGURE 7. Indoor space of Design Builder model.
Although at the monthly and annual level, it might seem that there are no significant differences, when entering hourly data the differences between simulation and actual values are substantial. This means that accurate comparisons cannot be made between days of the different years; so the data must be grouped, for instance, in weeks. Figure 8 illustrates the comparison between experimental and simulated trends of the internal air temperature and relative humidity for the experimental campaigns made in October and December. In particular, the difference between the simulated and measured temperature, was 10°C when the hearths were at their peak heating load, whereas that difference was 4°C when the hearths were off. In addition to the model’s ability to predict the indoor temperature, Figure 8 showed that the deviations for indoor relative humidity were more significant than the temperature. In conclusion, the hourly temperature was predicted with less error, which is a reasonable outcome since the relative humidity depended on more factors, such as the soil, the occupancy, and fuel combustion.
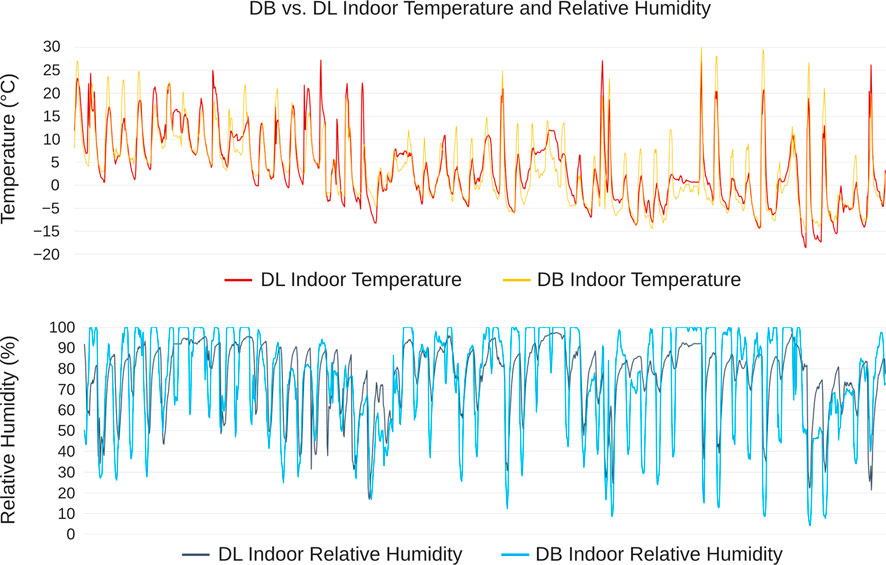
FIGURE 8. Comparison between simulated and actual values for indoor Temperature and Relative Humidity.
Some aspects require alignment to detect the accuracy of the building performance simulation tools compared with the experimental results. The deviations in results can be attributed to the accuracy of the mathematical models. However, some building simulation settings, such as the geometric representation, the outdoor climate conditions, and the heat transfer parameters, can impact the results. Design-Builder allows the user to select a gross, net, or mean internal volume of the thermal zone, so the surface areas related to a wall’s inner or external side can be used. As mentioned in Section 2.2 the experimental weather data useful for the STB thermal dynamic simulation are the external air humidity and temperature, normal direct solar radiation, horizontal diffuse solar radiation, and wind speed intensity and direction. The diffuse component’s Perez model was selected in Energy Plus to determine the global solar radiation on the STB surfaces differently oriented and inclined. To determine the simulation inputs, some experimental values, such as outdoor temperature, were introduced for the simulation. Nevertheless, other experimental values, such as the solar radiation on the inclined surfaces, were not measured, so verification was made on the indoor temperature and relative humidity.
Whether or not a wigwam can serve as a viable shelter depends on how well it can protect its occupants from the elements. Empirical data for rainfall and wind speed were collected inside and outside the wigwam to make it possible to compare the values. Ideally, wind speed would be calm and undetectable by the wigwam’s occupants, which, according to the National Weather Service, is anywhere below 4 mph (1.79 m/s). Wind speed was measured on several occasions using a handheld anemometer. In Figure 9, the top graph represents five mornings from 6:00a.m. to 11:00 a.m. when data was collected both outside and inside the wigwam. For all instances, wind speed decreased significantly on the interior. The lowest outdoor wind speed that resulted in wind registering on the anemometer was 3.1 with a 0.1 m/s reading. Any measurement below 3.1 m/s resulted in no wind inside. Day 3 experienced the strongest winds, up to 10.1 m/s. At this speed, indoor wind speed reached 0.4 m/s. Rainfall was collected both indoors and outdoors using multiple rain gauges. Due to the opening in the wigwam used for ventilating smoke, some rain entered the shelter. To be able to effectively determine the ability of the cotton duck material to keep out rain, two separate series of measurements on the interior were taken: one from the small area directly below the opening, and one underneath the covered area. The covered area is important because it’s where occupants will circulate as the fire pit is directly below the opening. Both the unprotected and protected data are illustrated in the bottom graph of Figure 9 along with the outdoor area. Both series of measurements saw a smaller amount of rain than the outside. The protected area received no rain except for Day 4’s measurement of 0.5 mm, meaning nearly 100% of the rain was kept out of this area. The unprotected area, however, received more noticeable amount for nearly all the days. The rainfall under the opening ranged from; 0.8 mm when there was outside rain in the amount of 6.4–31.8 mm when there was outside rain in the amount of 66 mm. Across all measurements, an average of 36.9% of outdoor rain made its way into the wigwam underneath the opening.
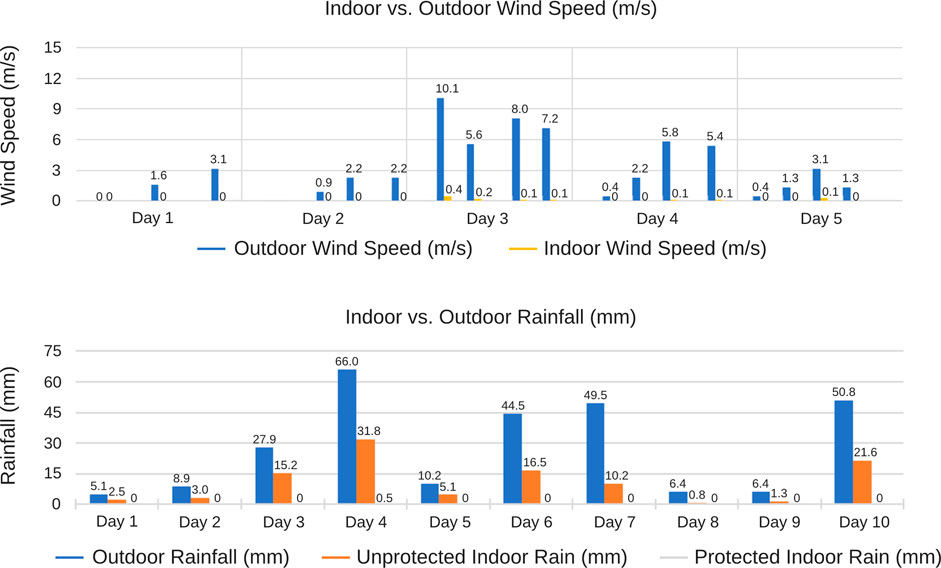
FIGURE 9. Indoor vs. outdoor windspeed and rainfall.
In this research, the simulated models were compared with data measured in the field. There were many challenges for the calibration process. First, the outdoor temperature data had strong fluctuations that could lead to significant discrepancies between the actual and simulated values. The second uncertainty was the evolution of the building envelope over time, for the materials might suffer a variation in their temperature. Finally, the simulated heat source had to be created as a sensible heat load that increased its temperature without adding humidity. These actual field measurements allowed adjustments to be made in the different parameters of the model to achieve an acceptable error. The digital model analyzed by Design-Builder included a new method to simulate the envelope parameters and characterize the heat source inside the wigwam. Therefore, after analyzing the results, it was essential to clarify the requirements to determine the accuracy of the building energy model. As it was stated in previous sections, there are several calibration criteria to assess the accuracy of simulated values against actual measurements. Table 4 illustrates the indices used to calibrate errors and the thresholds proposed by the ASHRAE Guideline 14, the Federal Energy Management Program (FEMP), and the International Performance Measurement and Verification Protocol (IPMVP). The calibration criteria given by these standards are ±10% for the NMBE, 30% for the CVRMSE, and >0.75 for the coefficient of determination R2.
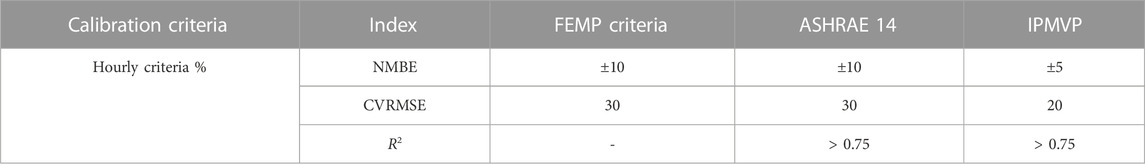
TABLE 4. Indexes to calibrate errors according to international standards.
A more extensive dataset makes evaluating the deviations more accurate. Thus, the indices were calculated over the entire month when considering hourly data. Table 5 presents the outcomes of hourly calibration, where simulated indoor air temperature and relative humidity were validated against the ASHRAE and FEMP criteria. It shows the distribution of the deviation considering hourly data for a one-month simulation. The deviation range for CVRMSE for the relative humidity was 17.16% in October and 24.12% in December. Regarding indoor temperature, CVRMSE, and NMBE values were below 15% and 5%, respectively, for October and December, which can be regarded as a good agreement.
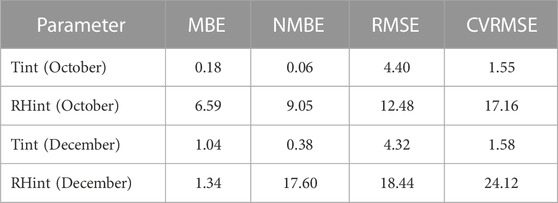
TABLE 5. Analysis of error between actual and simulated indoor temperature and relative humidity in October and December.
Despite the uncertainties in actual climatic conditions, the indoor temperature data obtained through the Design-Builder model showed a high correlation in all the comparisons made with the digital model against the actual measured data. Figure 10 shows how the coefficient of determination (R2) between experimental and simulated indoor air temperature changes as a function of the indoor data of all the considered period of testing, but it is consistently above 0.75, the minimum calibration criteria accepted by ASHRAE and IPMVP. In contrast, the relative humidity dataset shows a value of 0.5 for the R2, far from the model’s predictions and many points far from the best-fit line. As can be noticed, an increase in indoor temperature led to a growth of systematic errors. However, these measurements are valuable for validating the simulations. As observed in the images, the time the hearth was at its peak of thermal load showed the most significant difference between simulated and measured data. Mazzeo et al. (2020) analyzed the correlation between the simulated temperature by software IDA Indoor Climate and Energy 4.5. and measured internal temperature. A NRMSE equal to 11% on an hourly basis and a value of R2 of 0.9439 was obtained, confirming that the built model can be considered calibrated. Moran et al. (2021) studied thermal comfort in refugee shelters in desert environments. They reported a Pearson’s correlation coefficient, R2, ranging from 0.81 to 0.96. The main difference assessed in this article was the methodology to simulate the heating effect of open fires and wood stoves, considering the amount of renewable fuel to achieve indoor comfort in severe winter weather. Another difference from previous studies was to assess the accuracy of relative humidity simulations. The simulated indoor temperature values from December 20 to December 26 matched the trends and satisfied the required calibration criteria for the coefficient of determination. The figures highlight that the simulated relative humidity values were more accurate over the week in December when the internal heat source controlled the temperature. However, due to uncertainties in the simulation inputs that may correspond to inaccuracies in the physical properties of the building and rates of infiltration or ventilation, the coefficient of determination is not above the acceptable threshold of 0.75.
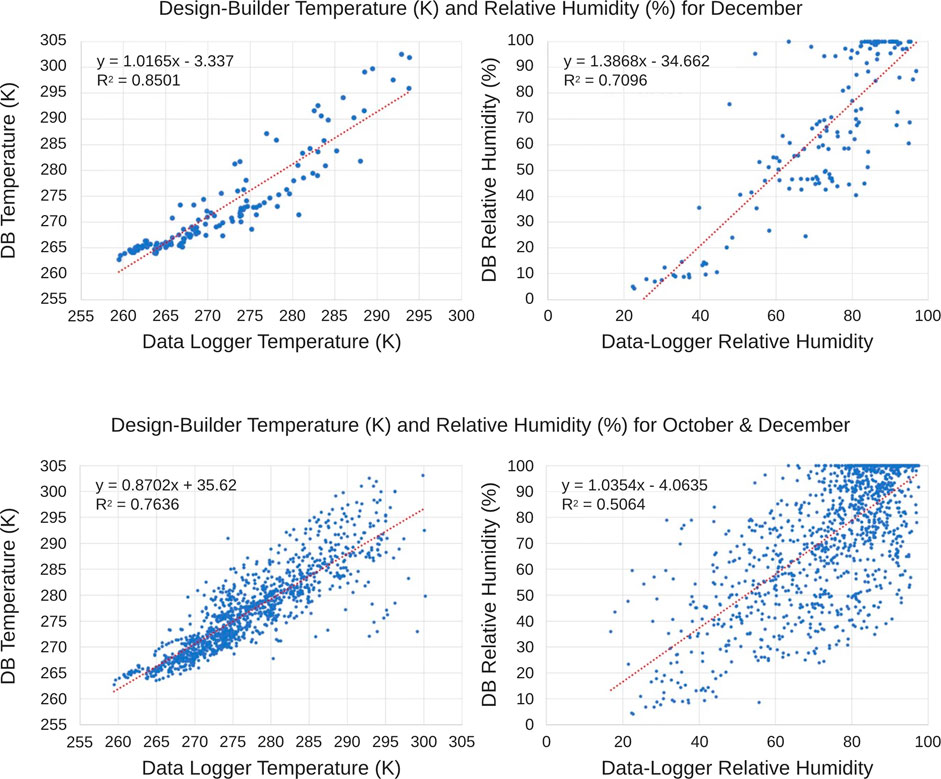
FIGURE 10. Coefficient of determination (R2) for simulated and actual values of Temperature and Relative Humidity.
The data revealed that thermal comfort and air quality standards showed different trends. Therefore, there is a need for a system that correlates indoor air quality factors and comfort parameters. This section discussed the results of Indoor Air Quality and comfort parameters, focusing on the correlation between temperature and the rest of indoor air quality indicators. As the weather got cold, there was a need to build either open fires or use a wood stove for short periods, increasing indoor temperature, decreasing relative humidity, and rising pollutants. Table 6 shows the correlation among all Indoor Air Quality factors from October 7 to October 23. Its value ranges from 0 to ±1, where 0 represents no correlation, and ±1 indicates an excellent correlation. There was a high inverse correlation between the indoor temperature (Tint) and relative humidity. However, the temperature and particles did not show a high correlation, with values ranging from 0.11 between temperature and PM2.5 to 0.28 between temperature and VOC.
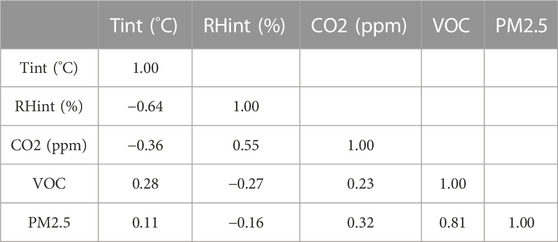
TABLE 6. Analysis of the correlation factor between IAQ parameters in October.
Table 7 shows a significant correlation between PM2.5 levels and VOCs (0.70) in December, although the highest correlation factor was shown between CO2 and VOCs (0.89).
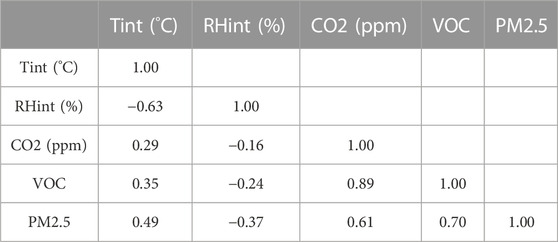
TABLE 7. Analysis of the correlation factor between IAQ parameters in December.
The correlation index increased considerably on days in which the heating source was on, either with an open fire or with a wood stove. Table 8 shows a high correlation above 0.6 between indoor temperature and both, PM2.5 and VOCs levels on December 24 and December 25. On those days, the heat source made the particle concentration rise and the relative humidity decrease. VOC and PM risk concentrations were mainly related to open fires, lack of ventilation, and occupants’ unawareness of indoor air quality.
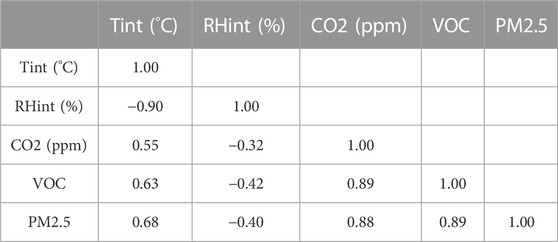
TABLE 8. Analysis of the correlation factor between IAQ parameters from December 20 to December 26.
Increasing the share of radiation or conduction can increase comfort at colder air temperatures in winter. Radiant heat can make people comfortable at a lower air temperature, too. Indoors, the radiant temperature represents the total infrared radiation exchanged between all surfaces in a room. Radiant heating systems don't heat the air but the surfaces in a space, including human skin, raising the radiant temperature and providing thermal comfort at a colder air temperature. At high wind speeds, the warming effect of the heat source disappears. A wood stove in the middle of the room can be considered a longwave infrared panel. The highest radiant temperature would be measured in the middle of the room, right beside the heating source. The radiant temperature would decrease in concentric circles towards the envelope of the wigwam. The difference between minimum and maximum radiant temperature is more significant than in the case of an air heating system. Thus, neither a high nor low radiant air temperature guarantees thermal comfort. The best interpretation of the thermal comfort in a room is provided by the operative temperature, which is a weighted average of the air and radiant temperatures. On the vertical plane, warm air rises so that most heat ends up at the ceiling level, which is useless. Heating only the occupied space of a room is possible with a radiant heating source, such as a wood stove, no matter how high the ceiling, which is much more energy efficient. The heat only rises if the heating surface is aimed upwards. In addition, almost all the energy a radiant heating system uses is effective for heating humans. Table 9 defines the PMV range for the thermal sensation scale according to ASHRAE 55 standard.

TABLE 9. ASHRAE 55 thermal comfort scalea.
Figure 11 summarizes all the variables that affected the comfort and indoor air quality inside the wigwam when there was a heat source. It illustrates the variations of the predicted mean vote (PMV), operative temperature, and relative humidity on two December days. The data logger measured indoor relative humidity, whereas the operative temperature was taken from the Design-Builder simulation. Hence, the open fire and the wood stove provided comfortable conditions during 4 hours of operation. The operative temperature rose from −10°C at 9:00 a.m. to 26°C at noon on December 24 and from −8°C at 9:00 a.m. to 21°C at 12 p.m. on December 25. In contrast, the relative humidity ranged from 80% to 22% on December 24% and 75%–30% on December 25. For 4 h, the PMV was between −1 and 1. The PMV analysis showed that occupants would describe their comfort conditions as “Slightly Cool” or “Slightly Warm.” Regarding Indoor Air Quality conditions, the wood stove provided a much better indoor environment with VOC values below 500 ppb and PM2.5 levels below 10 µg/m3, except at moments in which the stove door was open to load the fuel with levels above the dangerous threshold of 25 µg/m3, which constitutes hazardous levels.

FIGURE 11. Predicted mean vote on December 24 and December 25.
An aspect that can impact comfort is the asymmetry of radiant heating. For example, a person sitting in front of an open fire can be in thermal balance, but thermal comfort will not be obtained because the heat gain on one side equals the heat loss on the other. Thus, a solution to thermal asymmetry could be supplementing local heating with insulation to create a comfortable microclimate. One example was the hooded chair. This chair, which could be upholstered or covered with leather or wool blankets, fully exposed people to a radiant heat source while protecting their backs from the drafts and the low surface temperatures behind them. At the same time, the furniture’s shape could make the occupants effectively perceive a more significant percentage of the radiant heat emitted by the source. For example, if a chair were heated directly by the fire through radiation, the heat could be transferred to the person sitting on it by conduction. Open fires are inefficient because a large share of heat escapes vertically without heating the occupants. Stoves work better but remain relatively ineffective and must be fired regularly, like a fireplace. And both options can release air pollutants significantly. Still, many options exist, such as electric and conductive heating systems. These are more efficient and safer than the heating sources of yesteryear. Albadra et al. (2017) addressed the problem of the actual living conditions during periods of hot and cold weather in emergency shelters. These surveys confirm that occupants lived outside of comfort thresholds stated by Fanger’s Predicted Mean Vote, so other comfort models, such as adaptative models, must be considered in future studies of these structures.
In conclusion, exposure to either an open or an enclosed fire inside the wigwam for an extended period could generate adverse symptoms from the harmful particulate matter. Therefore, wigwam occupants may want to regulate their time inside the structure. In addition, for closed fires, the woodstove door should be only briefly opened to feed the fire in order to help mitigate any additional accumulation. A novelty outcome from this research was the dependence of indoor air quality on the heating system, indicating a condition to consider other heating devices that combine renewable fuels and a reduction of pollutant emissions.
This research confirmed that, by developing a digital model in Design-Builder, it is possible to get a good correlation between actual and simulated data for indoor temperature and relative humidity of wigwam. The proposed methodology offered a proper procedure to simulate the heat source of sensible heat that did not change the humidity ratio, as it was based on the data measured from the prototype. At the same time, the calibration process can be used to assess the thermal behavior of any given building.
Using Design-Builder software, the authors addressed the challenge of simulating the wigwam’s indoor air temperature and relative humidity. Several iterations were necessary to simulate, first, the thermal parameters of the envelope, second, the influence of natural ventilation, and finally, a heat source that mimicked the heat source and its impact on relative humidity. Statistical analysis was used to assess the accuracy of the simulations by finding the coefficient of determination (R2) between the simulated and actual data for daily and monthly values. Deviations were acceptable comparing the indoor air temperature with R2 values above 0.75. However, the relative humidity results showed more uncertainties.
Real data collection showed the ability to combine comfort conditions and Indoor Air Quality within the shelter with freezing outdoor weather. The Predicted Mean Vote (PMV) on winter days ranged from −1 to +1 when a renewable heating system was on. However, the Indoor Air Quality levels were far from acceptable with open fires. Data collected during the open fire in December shows levels that are hazardous to human health. For example, the CO2 levels reached 896.4 ppb, VOC levels peaked at 10,592 ppb, and PM2.5 levels reached magnitudes close and up to 1000 µg/m3 multiple times during the fire event. In contrast, during closed fires, the VOC levels reached 391 ppb, not at dangerous levels but with the potential to produce adverse physical symptoms. The CO2 concentrations for the enclosed fires achieved levels of 600 ppb, 30% below open fire levels. Finally, PM2.5 levels reached 200 µg/m3, 80% below open fire levels but above the 25 µg/m3 threshold of healthy conditions.
One of the limitations encountered in the methodology was the difficulty in measuring the Mean Radiant Temperature (MRT). CBE tool can select MRT by the input box if the user selects option EN-16798. Another option was to use the Operative Temperature as a function of Mean Radiant Temperature and Indoor Air Temperature. Design Builder provides users with Operative Temperature, so those values were used as input to calculate thermal comfort using the option ASHRAE-55 in the CBE tool. Future research must include envelope temperature measurements to accurately evaluate the heat source radiation’s effect. The prototype was measured in the cold season. How the model will work in other seasons with different envelopes is worth being validated in the future. AcuRite 5, 2023, Elitechlog, 2023, Getawair, 2023.
The raw data supporting the conclusion of this article will be made available by the authors, without undue reservation.
Conceptualization, PF and FD; methodology, PF, SN, and JP; software, MM; validation, PF, RG, and FD; investigation, PF, SN, and JP; data curation, PF and SN; writing—original draft preparation, PF and SN; writing—review and editing, FD and MM; visualization, SN, JP, and MM; supervision, PF, RG, and FD; project administration, PF; funding acquisition, PF. All authors contributed to the article and approved the submitted version.
The authors wish to thank CEU San Pablo University Foundation for the funds dedicated to the ARIE Research Group, through the Project Ref. EC01/0720- MGI22RGL provided by the CEU San Pablo University. Materials and student grants for this research were funded by Keene State College, Faculty Development Grant “Wigwam made with modern materials.”
The authors declare that the research was conducted in the absence of any commercial or financial relationships that could be construed as a potential conflict of interest.
All claims expressed in this article are solely those of the authors and do not necessarily represent those of their affiliated organizations, or those of the publisher, the editors and the reviewers. Any product that may be evaluated in this article, or claim that may be made by its manufacturer, is not guaranteed or endorsed by the publisher.
The Supplementary Material for this article can be found online at: https://www.frontiersin.org/articles/10.3389/fbuil.2023.1202965/full#supplementary-material
AcuRite 5, (2023). Capacity easy-to-read magnifying acrylic, rain gauge. Available online: https://www.acurite.com/shop-all/weather-instruments/rain-gauges/easy-read-5-magnifying-rain-gauge-00850.html.(accessed Feb 12, 2023)
Albadra, D., Vellei, M., Coley, D., and Hart, J. (2017). Thermal comfort in desert refugee camps: An interdisciplinary approach. Build. Environ. 124, 460–477. doi:10.1016/j.buildenv.2017.08.016
Ashrae, (2017). “ASHRAE-55 ANSI/ASHRAE standard 55,” in Thermal environmental conditions for human occupancy (Atlanta, GA, USA: ASHRAE).
Ashrae Guideline 14, (2014). Measurement of energy and demand savings. Atlanta, GA, USA: American Society of Heating, Ventilating, and Air Conditioning Engineers.
Ashrae, (2012). “Heating, ventilating, and air-conditioning systems and equipment,” in Tullie circle (Atlanta, GA, USA: ASHRAE).
Borge-Diez, D., Colmenar-Santos, A., Mur-Pérez, F., and Castro-Gil, M. (2013). Impact of passive techniques and clean conditioning systems on comfort and economic feasibility in low-cost shelters. Energy Build. 62, 414–426. doi:10.1016/j.enbuild.2013.03.032
Bozkaya, B., Li, R., and Zeiler, W. (2018). A dynamic building and aquifer co-simulation method for thermal imbalance investigation. Appl. Therm. Eng. 144, 681–694. doi:10.1016/j.applt.hermaleng.2018.08.095
Bushnell, D. (1922). Villages of the algonquian, siouan, and caddoan tribes west of mississipi. Washington, DC, USA: Government Printing Office.
Cbe, (2022). Thermal comfort tool. Available online: https://cbe.berkeley.edu/tool/cbe-thermal-comfort-tool/ (accessed Dec 17, 2022).
Crawford, C., Manfield, P., and McRobie, A. (2005). Assessing the thermal performance of an emergency shelter system. Energy Build. 37, 471–483. doi:10.1016/j.enbuild.2004.09.001
De la Torre, S., and Yousif, C. (2014). Evaluation of chimney stack effect in a new brewery using DesignBuilder-EnergyPlus software. Energy Procedia 62, 230–235. doi:10.1016/j.egypro.2014.12.384
Del Ama Gonzalo, F., Moreno Santamaría, B., and Burgos, M. J. M. (2023). Assessment of building energy simulation tools to predict heating and cooling energy consumption at early design stages. Sustainability 15 (3), 1920. doi:10.3390/su15031920
Dominguez, S., Fernandez-Aguera, J., Cesteros-García, S., and Gonzalez-Lezcano, R. (2020). Bad air can also kill: Residential indoor air quality and pollutant exposure risk during the COVID-19 crisis. Int. J. Environ. Res. Public Health 17, 7183. doi:10.3390/ijerph17197183
Efficiency Valuation Organization, (2012). Washington, DC, USA: Efficiency Valuation Organization.International performance measurement and verification Protocol: Concepts and options for determining energy and water savings
Elitechlog, (2023). RC-51H PDF Temperature & Humidity data logger. http://www.elitechlog.com/rc-51h-pdf-temperaturehumidity-data-logger/ (accessed Mar 8, 2023).
Epa, (2022). Revised air quality standards for particle pollution and updates to the air quality index. https://www.epa.gov/sites/default/files/2016-04/documents/2012_aqi_factsheet.pdf (accessed Dec 17, 2022).
Fanger, P. O. (1973). Assessment of man's thermal comfort in practice. Occup. Environ. Med. 30 (4), 313–324. doi:10.1136/oem.30.4.313
Fanger, P. O. (1970). Thermal comfort, analysis, and application in environmental engineering. Copenhagen, Denmark: Danish Technical Press.
Fantozzi, F., Lamberti, G., Leccese, F., and Salvadori, G. (2022). Monitoring CO2 concentration to control the infection probability due to airborne transmission in naturally ventilated University classrooms. Archit. Sci. Rev. 65 (4), 306–318. doi:10.1080/00038628.2022.2080637
Fawwaz Alrebei, O., Obeidat, L. M., Ma’bdeh, S. N., Kaouri, K., Al-Radaideh, T., and Amhamed, A. I. (2022). Window-windcatcher for enhanced thermal comfort, natural ventilation and reduced COVID-19 transmission. Buildings 12, 791. doi:10.3390/buildings12060791
Fernández Bandera, C., and Ramos Ruiz, G. (2017). Towards a new generation of building envelope calibration. Energies 10, 2102. doi:10.3390/en10122102
Getawair, (2023). TopTes TS-301 digital anemometer, wind speed meter with 2.26-inch LCD screen, air meter. https://www.getawair.com/products/element.
Getuhoo, (2022). Understanding VOC's and its effects on health. Available online: https://getuhoo.com/blog/home/understanding-vocs-and-its-effects-on-health/ (accessed Dec 17, 2022).
Ghio, A. J. (2017). Particle exposure and the historical loss of native American lives to infections. Am. J. Respir. Crit. Care Med. 195, 1673. doi:10.1164/rccm.201609-1810le
Gonzalo, F. d. A., Griffin, M., Laskosky, J., Yost, P., and González-Lezcano, R. A. (2022). Assessment of indoor air quality in residential buildings of new england through actual data. Sustainability 14, 739. doi:10.3390/su14020739
Holley, L. A. (2007). Tipis, tepees, teepees: History and design of the cloth tipi. 1st ed. Layton, UT, United States: Gibbs Smith Publisher.
Ibm, (2022). IBM maximo worker insights. Available online: https://www.ibm.com/docs/en/mwi?topic=shields-air-quality-shield.(accessed Nov 28, 2022)
ISO 7730, (2005). Ergonomics of the thermal environment- Analytical determination and interpretation of thermal comfort using calculation of the PMV and PPD indices and local thermal comfort criteria. (reviewed and confirmed in 2015. Geneva, Switzerland: International Organization for Standardization ISO.
Kabrein, H., Yusof, M. Z. M., Hariri, A., Leman, A. M., and Afandi, A. (2017). Improving indoor air quality and thermal comfort in office building by using combination filters. IOP Conf. Ser. Mater. Sci. Eng. 243, 012052. doi:10.1088/1757-899x/243/1/012052
Kidadl, (2022). Wigwams facts learn all about the Native American homes. https://kidadl.com/facts/wigwams-facts-learn-all-about-the-native-american-homes (accessed Nov 10, 2022).
Knight, P. V. (2017). Native American homes: From longhouses to wigwams (native American cultures. Milwaukee, Wisconsin: Gareth Stevens Pub.
Kristak, L., Igaz, R., and Ružiak, I. (2019). Applying the EDPS method to the research into thermophysical properties of solid wood of coniferous trees. Adv. Mater. Sci. Eng. 2019, 1–9. doi:10.1155/2019/2303720
Lamberti, G. “Critical overview of heat balance, adaptive, local discomfort models to predict thermal comfort in buildings,” in Proceedings of the IEEE International Conference on Environment and Electrical Engineering and 2021 IEEE Industrial and Commercial Power Systems Europe (EEEIC/ I&CPS Europe), Bari, Italy, September 2021. doi:10.1109/EEEIC/ICPSEurope51590.2021.9584714
Lawson, J. R., Walton, W. D., Bryner, N. P., and Amon, F. K. (2005). Estimates of thermal properties for fire fighters' protective clothing materials. Gaithersburg, Maryland: U.S. Department of Commerce Building and Fire Research Laboratory National Institute of Standards and Technology.
Lezcano, , and Burgos, (2021). Airflow analysis of the Haida plank house, a breathing envelope. Energies 14 (160), 4871. doi:10.3390/en14164871
Mazzeo, D., Matera, N., Cornaro, C., Oliveti, G., Romagnoni, P., and Santoli, L. (2020). EnergyPlus, IDA ICE and TRNSYS predictive simulation accuracy for building thermal behaviour evaluation by using an experimental campaign in solar test boxes with and without a PCM module. Energy Build. 212, 109812. doi:10.1016/j.enbuild.2020.109812
Montero Burgos, M. J., Sanchiz Álvarez de Toledo, H., González Lezcano, R. A., and Galán de Mera, A. (2020). The sedentary process and the evolution of energy consumption in eight native American dwellings: Analyzing sustainability in traditional architecture. Sustainability 12 (5), 1810. doi:10.3390/su12051810
Montgomery, D. (2000). “Native American crafts and skills,” in A fully illustrated Guide to wilderness living and survival. 2nd (Essex, CT, United States: Lyons Press).
Moran, F., Fosas, D., Coley, D., Natarajan, S., Orr, J., and Bani Ahmad, O. (2021). Improving thermal comfort in refugee shelters in desert environments. Energy Sustain. Dev. 61, 28–45. doi:10.1016/j.esd.2020.12.008
Moreno-Rangel, A., Sharpe, T., Musau, F., and McGill, G. (2018). Field evaluation of a low-cost indoor air quality monitor to quantify exposure to pollutants in residential environments. J. Sens. Sens. Syst. 7, 373–388. doi:10.5194/jsss-7-373-2018
Morgan, L. H. (1881). Houses and house-life of the American aborigines. Washington D.C, VA: Govt. Print. Off.
Nabokov, P., and Easton, R. (1989). Native American architecture. New York, NY, USA: Oxford University Press.
Native American houses, (2022). Native American houses. Available online: https://www.warpaths2peacepipes.com/native-american-houses/wigwam.htm.(accessed Nov 10, 2022)
Neymark, J., Judkoff, R., Knabe, G., Le, H. T., Dürig, M., Glass, A., et al. (2002). Applying the building energy simulation test (BESTEST) diagnostic method to verification of space conditioning equipment models used in whole-building energy simulation programs. Energy Build. 34 (9), 917–931. doi:10.1016/s0378-7788(02)00072-5
Ny State Gov, (2022). Department of health. Available online: https://www.health.ny.gov/environmental/indoors/air/pmq_a.htm.(accessed Nov 24, 2022)
Nyholm, E. (1981). The use of birch bark by the ojibwa Indians. Folk life festival. Michigan, US: Crafts, Indigenous Peoples.
Pilsworth, M. N. (1978). The calculation of heat loss from tents. Natick, MA, USA: United States Army Natick Research & Development Command.
Radhi, H. (2010). On the optimal selection of wall cladding system to reduce direct and indirect CO2 emissions. Energy 35, 1412–1424. doi:10.1016/j.energy.2009.11.026
Ruiz, G. R., and Bandera, C. F. (2017). Validation of calibrated energy models: Common errors. Energies 10, 1587. doi:10.3390/en10101587
Schwartz, S. (2009). Native American housing. New York, NY, USA: Gilder Lehrman Institute of American History.
Speck, F. G. (1922). Beothuk and micmac. New York, NY, USA: Museum of the American Indian Heye foundation: NYC.
Sunforger Tent Canvas, (2023). Available online https://www.bigduckcanvas.com/canvas-for-tents/army-duck/10-10-oz-60-sunforger-fire-retardant-tent-canvas (accessed Feb 26, 2023).
Tan, H., Wong, K. Y., Othman, M. H. D., Hong, Y. K., Roswanira, A. W., Garry, K. P. E., et al. (2022). Current and potential approaches on assessing airflow and particle dispersion in healthcare facilities: A systematic review. Environ. Sci. Pollut. Res. 29, 80137–80160. doi:10.1007/s11356-022-23407-9
The Building of a Wigwam, (2022). The building of a wigwam. Available online: https://www.youtube.com/watch?v=4JBBqBtcJlA.(accessed Nov 10, 2022)
Ullal, A., Aguacil, S., Vannucci, R., Yang, S., Pernot, J. G., Licina, D., et al. (2022). Comparing thermal performance of standard humanitarian tents. Energy Build. 264, 112035. doi:10.1016/j.enbuild.2022.112035
Wang, S., Yan, C., and Xiao, F. (2012). Quantitative energy performance assessment methods for existing buildings. Energy Build. 55, 873–888. doi:10.1016/j.enbuild.2012.08.037
Wigwam, (2022). Wigwam. Available online: https://www.newworldencyclopedia.org/entry/Wigwam.accessed Nov 10, 2022)
Keywords: native American shelter, indoor air quality (IAQ), building energy simulation, building environment, monitoring
Citation: Fowler P, Del Ama Gonzalo F, Newell S, Poolman J, Montero Burgos MJ and González Lezcano RA (2023) Assessment of indoor air quality and comfort by comparing an energy simulation and actual data in Native American shelters. Front. Built Environ. 9:1202965. doi: 10.3389/fbuil.2023.1202965
Received: 09 April 2023; Accepted: 09 May 2023;
Published: 24 May 2023.
Edited by:
Hasim Altan, Prince Mohammad bin Fahd University, Saudi ArabiaReviewed by:
Yorgos Spanodimitriou, University of Campania Luigi Vanvitelli, ItalyCopyright © 2023 Fowler, Del Ama Gonzalo, Newell, Poolman, Montero Burgos and González Lezcano. This is an open-access article distributed under the terms of the Creative Commons Attribution License (CC BY). The use, distribution or reproduction in other forums is permitted, provided the original author(s) and the copyright owner(s) are credited and that the original publication in this journal is cited, in accordance with accepted academic practice. No use, distribution or reproduction is permitted which does not comply with these terms.
*Correspondence: Paul Fowler, cGF1bC5mb3dsZXJAa2VlbmUuZWR1
Disclaimer: All claims expressed in this article are solely those of the authors and do not necessarily represent those of their affiliated organizations, or those of the publisher, the editors and the reviewers. Any product that may be evaluated in this article or claim that may be made by its manufacturer is not guaranteed or endorsed by the publisher.
Research integrity at Frontiers
Learn more about the work of our research integrity team to safeguard the quality of each article we publish.