
95% of researchers rate our articles as excellent or good
Learn more about the work of our research integrity team to safeguard the quality of each article we publish.
Find out more
ORIGINAL RESEARCH article
Front. Built Environ. , 22 May 2023
Sec. Sustainable Design and Construction
Volume 9 - 2023 | https://doi.org/10.3389/fbuil.2023.1196246
This article is part of the Research Topic Sustainable Urban Living with Adaptation Measures in Anticipation Against Climate Change View all 8 articles
 Dilan Glanz1*
 Husam Sameer1
 Daniela Göbel2Alexander Wetzel2Bernhard Middendorf2Clemens Mostert1Stefan Bringezu1
Considering the ambitious greenhouse gas emission reduction and efficient use of resource targets set by the Sustainable Development Goals and the importance of concrete structures to achieve these goals, there is an increasing need to study the environmental performance of different concrete production alternatives. Cement is one of the main building materials that contribute significantly to global warming; therefore, studying the environmental performance of innovative binders that can substitute the use of cement is highly recommended. This article investigates the climate, material, energy, and water footprints of four innovative mixtures of ultra-high-performance concrete (UHPC) with a binder made of alkali-activated materials in comparison with the one made of Portland cement. Footprint analysis is carried out within cradle-to-grave life cycle assessment boundaries. Within the life cycle assessment, the functional unit defines the quantification of the final product or service. The functional units of the UHPC were adapted for the comparability of concrete mixtures with different compressive strengths. The results show that UHPC made with an alkali-activated material has 32%–45% better performance in terms of a climate footprint and 19%–33% better performance in terms of material footprints, whereas a trade-off can be seen regarding 44%–83% higher energy footprints and 75%–146% higher water footprints. The disadvantages in energy and water footprints are caused by waterglass. When allocation is considered, mixtures with high silica fume content have higher environmental footprints.
With the constant growth of the global construction industry (Statista, 2022), achieving Sustainable Development Goals (SDGs) will significantly depend on infrastructure and real estate activities (Goubran, 2019). Concrete production is a significant contributor to worldwide greenhouse gas (GHG) emissions and use of resources. It is well known that Portland cement (PC) has a high climate footprint, not only due to the processing of the cement, but also due to emissions that originated from the production of its raw materials. This results in approximately 0.8 tons of CO2 per ton of Portland cement (Scrivener and Kirkpatrick, 2008; Cembureau, 2020). The standardized cements cover a broad variety of substitutional materials like fly ash, granulated blast-furnace slag, or limestone powder. These special cements decrease GHGs and show improved properties in terms of durability in some cases. Furthermore, there are also approaches using different binder types without any PC (Scrivener and Kirkpatrick, 2008). Alkali-activated materials (AAMs) form a very large field of these alternative binders. Since different aluminosilicate precursors, some with high calcium contents, can be used with activators such as alkali hydroxides, waterglasses, carbonates, sulfates, and aluminates, there is a wide range of these kinds of binders, which are also called geopolymers (Davidovits, 2015; Singh and Middendorf, 2020) or inorganic polymers (Pontikes et al., 2013). Due to the different types of precursors, it is helpful to name the main precursor for the binder type. The binders used in this research are based on ground granulated blast-furnace slag (GGBFS), activated by alkali-waterglass (alkali silicate).
The mix designs of concretes investigated are based on a UHPC, which is usually based on PC, silica fume, and fine quartz powder. UHPC gains its high performance in terms of high compressive strength and high durability from an optimized packing density and low porosity due to a low water–binder ratio and the ideal combination of reactive fines like silica fume (Schmidt et al., 2014). Although mixtures referred to as UHPC do not necessarily contain a coarse aggregate and would by definition be a mortar, these mixtures are referred to as concretes.
It was observed in previous investigations that the use of a certain amount of silica fume in combination with slag and a highly concentrated activator leads to good workability and a low water/binder (w/b) ratio could be realized (Wetzel and Middendorf, 2019; Wetzel et al., 2022). Notably, the performance of UHPC based on AAM (AAM-UHPC) is comparable to UHPC based on PC concerning compressive strength and microstructure such as porosity. The capillary porosity (0.03 µm–10 µm), which is essential for durability, is 2 vol% lower in the case of UHPC in general (Schmidt et al., 2014) and could be proven in the case of AAM-UHPC (Wetzel and Middendorf, 2019). Previous LCA studies of binders and cement in the literature debate the environmental footprint of the geopolymers due to the high environmental impacts of sodium silicate and sodium hydroxide (Habert et al., 2011; Van Den Heede and De Belie, 2012; Seto et al., 2017; Sameer et al., 2019; Timm et al., 2019). Although recent studies show that changes in the production of sodium silicate have led to lower environmental impacts such as the global warming impact (Komkova and Habert, 2023), neither energy footprints nor material footprints nor water footprints of geopolymer concretes have been assessed.
The main goal of the article is to study the climate, material, energy, and water footprints of four innovative mixtures of AAM-UHPC. The mixtures are designed to use new binder materials made of alkali-activated ground slag and silica fume and are optimized to reduce climate impacts. The results of the studied AAM-UHPC are compared with the conventional UHPC made of conventional PC.
The AAM-UHPC studied and optimized in this research is based on alkali-activated ground granulated blast-furnace slag and silica fume. The used activator solution was potassium waterglass or a combination of waterglass and hydroxide. Two different potassium waterglass solutions were used, the first one having a modulus (SiO2:K2O; mol%) of 3.9 and the second one 1.0. Furthermore, the main aspect of UHPC is low porosity, which is gained by adding a certain amount of fines following a packing density optimization. Beneath quartz powder, silica fume was used, which is a co-product of metallic silicon production.
The mixtures are prepared in intensive mixers with a volume of either 1 dm³ or 3 dm³. All measurements were carried out in a climate-controlled laboratory at 65% relative humidity and 20°C temperature. In the mixing process, the dry components are first mixed without the sand for 60 s, then the waterglass solution is added, and mixing continues for 180 s. The waterglass solution is then added to the mixer. After the dry components are removed from the residues on the mixing tool and the container, the sand is added and after another 150 s, the mixture is poured directly into the molds. After covering, the specimens were stored at 20°C and 65% RH. One day later, the specimens were demolded and stored in closed plastic bags at 20°C until testing. In addition to the setting time, the spreading flux was measured directly after mixing under standard conditions (20°C/65% RH).
The mix designs of the four AAM-UHPC (M1–M4) and the reference UHPC with conventional Portland cement (PC-ref.) are shown in Table 1.
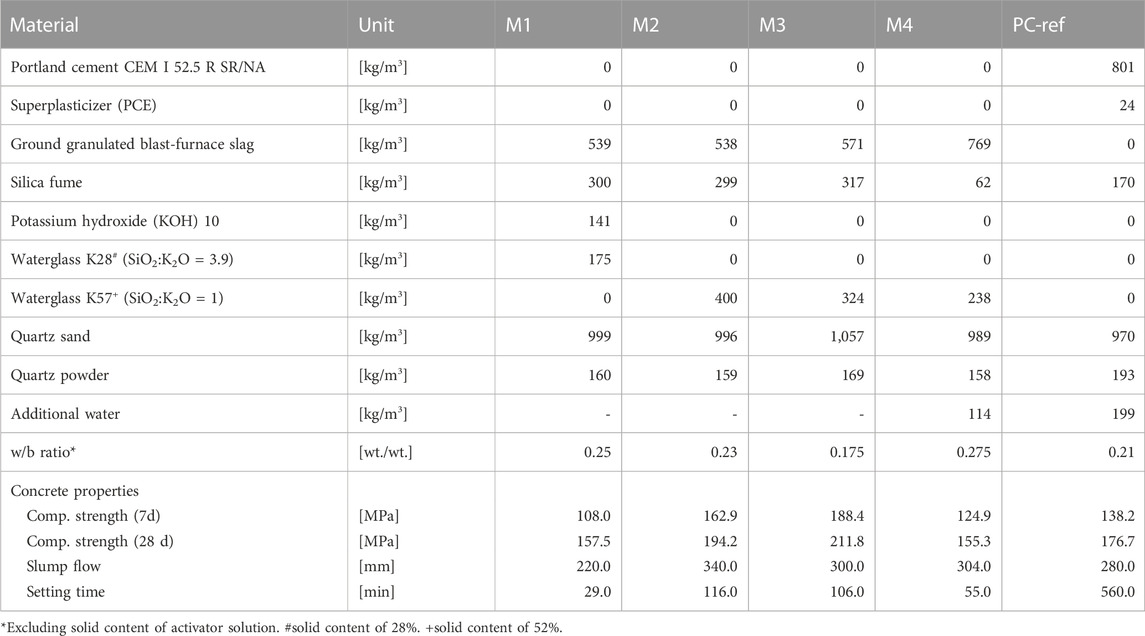
TABLE 1. Mixtures with ultra-high-performance concrete with alkali-activated materials (M1–M4) and PC-ref.
The properties of fresh and hardened concrete were investigated for different types of mixes. Mixture M1 comprised slag and silica fume as raw materials, silica sand and quartz powder were used as aggregates, and a mixture of waterglass and potassium hydroxide (KOH) was used as an activator solution (Wetzel and Middendorf, 2019). In mixture M2, a different type of waterglass solution was used (Wöllner K57N) with a solid content of 52% and a modulus (molar ratio SiO2:K2O) of 1, according to the manufacturer’s data. Evidently, the setting time improved to more than 100 min compared to M1, the compressive strength was increased, and the workability was increased, showing a yield value of 340 mm, although the water–binder ratio was reduced. It is well known that different types of activators influence the reactivity and rheology of the system, which is especially the case for highly alkaline activators and the combination with silica fume (Wetzel and Middendorf, 2019). Using a waterglass with a reduced modulus and higher alkalinity leads to enhanced workability and an increase in the setting time. Reducing the water–binder ratio (M3) resulted in a further increase in compressive strength. In M4, the content of silica fume and the concentration of waterglass solution were reduced to improve the economic and ecological improvement. Further descriptions of the characterization of raw materials and fresh and hardened concrete properties of mixtures M1 (Wetzel and Middendorf, 2019), M2–M3 (Wetzel et al., 2022), and the PC-ref. (Wiemer et al., 2020) can be found elsewhere. M4 represents a new mixture with a reduced content of silica fume and waterglass in order to reduce the climate footprint while keeping good properties in terms of fresh and hardened concrete.
Considering the mechanical performance, M4 shows the lowest compressive strength, but it still hits the requirements of UHPC in terms of compressive strength. As described by Wetzel and Middendorf (2019) and Wetzel et al. (2022), the shrinkage of the UHPC based on alkali-activated slag is much higher compared to the reference system based on PC. Therefore, the mixtures M1–M3 still need to be optimized to gain similar performance to PC-UHPC. Additionally, due to a different phase assemblage in the binder matrix, the durability of AAM-UHPC is supposed to be higher than that of PC-UHPC, especially for elevated temperatures or acid attacks.
The life cycle assessment (LCA) of UHPC with AAMs in comparison with UHPC with PC-ref. is carried out based on the life cycle stages, according to EN 15804 (EN 15804, 2020). The system boundaries include the cradle-to-gate product stage of concrete corresponding to modules A1–A3. Life cycle inventory (LCI) input and output environmental flows are shown in Figure 1. The ecoinvent 3.8 database (Ecoinvent, 2022a) is used with openLCA software (version 1.10.3) (GreenDelta, 2022) for LCA modeling.
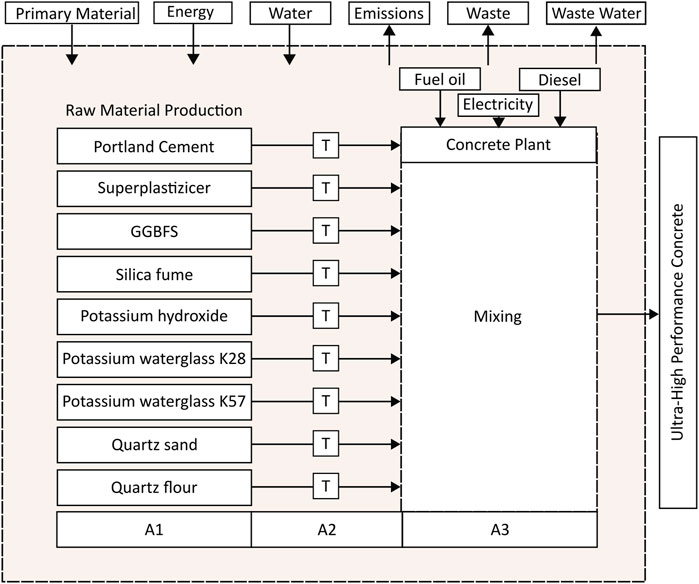
FIGURE 1. Diagram of life cycle assessment processes of cradle-to-gate of ultra-high-performance concrete with alkali-activated material and with Portland cement. GGBFS = ground granulated blast-furnace slag. T = transport.
The A1 life cycle stage of concrete represents the cradle-to-gate inventory (A1–A3) of its materials, for instance, A1–A3 production of cement. Differences in subsequent processes [transport and installation (A4–A5), use stage (B), and the end of life (C1–C4)] were neglected in this study.
Raw material production includes the extraction of raw materials (A1), transportation of raw materials (A2), and their production processes (A3), e.g., manufacturing of clinker and grinding in cement mills in the case of Portland cement. A superplasticizer is defined according to average global plasticizer production. GGBFS is a by-product of pig iron production, where blast-furnace slag is first granulated and then ground. Silica fume is a by-product of the production of silicon metal or ferrosilicon alloys.
The main routes to produce potassium waterglass are the furnace route and the hydrothermal route. Both metasilicates and silicates with a molar ratio between 2 and 2.5 are produced in a hydrothermal process (Vail, 1952; Fawer et al., 1999; Federal Environmental Agency, 2001). In the hydrothermal process, sand is dissolved in sodium hydroxide or potassium hydroxide. This process is carried out under high temperature and pressure in an autoclave. To produce metasilicates, the silicate solution is reacted again with sodium or potassium hydroxide. Metasilicate crystallizes, and its solid form is mixed to form an aqueous solution (58%). Processes for sodium silicate and sodium metasilicate are used as proxies for potassium waterglass production. The production processes of sodium silicates and potassium silicates are similar, except sodium hydroxide which is replaced by potassium hydroxide (Europe, 2004). The silicate production LCI data in ecoinvent are adjusted to match solutions with 52% and 28% solid contents.
To calculate the environmental footprints of potassium hydroxide, the ecoinvent process for liquid potassium hydroxide was used. The dataset represents the production of 1 kg of KOH in the form of 85.6% aqueous solution by the electrolysis of potassium chloride brine in electrolytic cells (Ecoinvent, 2022a). In the case study, a 56.1% aqueous solution is used. To achieve the required concentration, it is assumed that 0.655 kg of the base solution (85.6%) was used and diluted with 0.345 L of water.
The LCI of quartz flour production was estimated using data for quartz sand and milling processes of limestones. The transportation of concrete materials (module A2) is extracted from ecoinvent market activities, using average distances and modes of transport (Ecoinvent, 2022c). Concrete mixing is calculated according to former research conducted on environmental assessment of ultra-high-performance concrete (Sameer et al., 2019), considering the mixing of concrete and plant operation with 7.09 kWh of electricity, 0.09 L diesel, and 0.26 L light fuel oil per m³ of concrete.
The functional unit (FU) defines the quantification of the identified functions of the final product or service, such as the performance or characteristics of a product. Commonly, 1 m³ of concrete is chosen as the FU. When concrete with different functional properties is compared, a volumetric comparison does not reflect equivalent functions (Marinković, 2017). For this study, the FU is adapted by a factor calculated as the relation between the compressive strength of the alternative concrete (AAM-UHPC) and the base concrete (PC-ref.) shown in Table 1, based on the approach proposed by Marinković (2017) (see Eq. 1). The FU is specified as 1 m³-equivalent (m³-eq) of UHPC. The results of the life cycle impact assessment (LCIA) per FU are calculated as shown in Eq. 2.
The respective FU of AAM-UHPC and the reference concrete mixture is shown in Table 2.
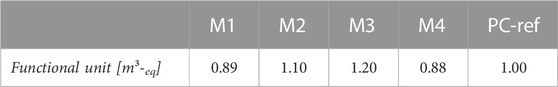
TABLE 2. Functional units of the mixtures M1–M4 and PC-ref.
The product systems include co-products from other product systems whose upstream processes are not normally included in the LCA. However, with the increasing use of these co-products, their market relevance in the manufacture of concrete products is growing. The choice of allocation procedures of industrial by-products as cement substitutes such as fly ash, blast-furnace slag, and silica fume has been discussed in few publications (Habert et al., 2011; Van Den Heede and De Belie, 2012; Seto et al., 2017; Timm et al., 2019). Habert et al. (2011), Timm et al. (2019), and Seto et al. (2017) evaluated mass allocation and economic allocation, agreeing that the allocation method has a significant impact on the results. Yet, it is unclear, which type of allocation is to be chosen. Van Den Heede and De Belie (2012) recommend economic allocation, when using industrial by-products as cement-replacing materials. The standards on life cycle assessments ISO 14044 (Din, 2021) outlines the strengths and weaknesses of allocation based on physical properties (e.g., volume, and mass) and allocations based on economic values. Accordingly, a sensitivity analysis should be conducted when several alternative allocation procedures are applicable (Habert et al., 2011; Din, 2021). The EN 15804, which standardizes the environmental product declarations of construction products, states that allocation must be based on physical characteristics if the difference in business revenue generated by the products is small (less than 1%). In all other cases, the allocation must be based on economic values.
The choice of the right allocation procedure, therefore, depends on the revenues generated by the industrial by-products. Nevertheless, market prices often vary over time and between different regions and market participants and are also subject to influences such as regulations, monopoly powers, and subsidies. In some cases, it may also be difficult to accurately determine market prices, especially for intermediate products (Din, 2021). Considering these uncertainties, the cut-off approach (no allocation) and physical and economic allocation have been conducted for GGBFS and silica fume and have been compared within sensitivity analysis.
Allocation factors are calculated according to the work of Habert (2013) using production ratios published by Fidjestøl and Dåstøl (2008). Silica fume as a by-product of metallurgical-grade silicon production (SF2) is considered. The production ratio of GGBFS from iron production is taken from the work of Chen et al. (2010). Market prices are used according to the ecoinvent database 3.8. (Ecoinvent, 2022b).
Table 3 shows the values used in the allocation of silica fume and GGBFS.
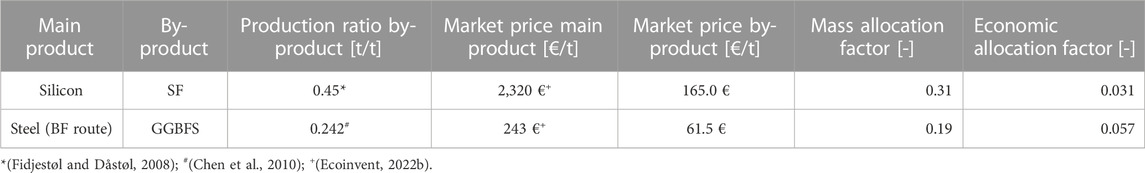
TABLE 3. Silica fume and ground granulated blast-furnace slag mass and economic allocation values considering silica fume from silicon production.
The environmental impacts of the concrete variants are evaluated in terms of four environmental product footprint categories: the climate footprint, the energy footprint, the material footprint, and the water footprint. The product footprints can be considered mid-point indicators in the LCA methodology (ISO, 2009).
In recent comparative assessment studies, the product climate footprint was applied together with the product material footprint (Mostert et al., 2018; Sameer and Bringezu, 2019; Turnau et al., 2020). For the calculation of the product water (scarcity) footprint, a new concept was proposed (Schomberg et al., 2021). Although resource footprints can account for more than 90% of the variation in the damage to areas of protection such as human health (Steinmann et al., 2017), their application is still predominantly performed for economy-wide studies (Cibulka and Giljum, 2020). The product climate footprint is calculated based on the indicator global warming impact (GWI) expressed in kg CO2 equivalents per FU. The characterization model global warming potential with a time horizon of 100 years (GWP100) by the Joint Research Centre (JRC) of the European Commission is applied (European Commission Joint Research Centre Institute for Environment and Sustainability (JRC-IES), 2011).
The product energy footprint is determined by the indicator cumulative energy demand (CED). The CED accounts for the life-cycle-wide direct and indirect energy consumption, including energy consumption for the extraction, production, and disposal of raw materials. The CED considers renewable and non-renewable energy resources (Huijbregts et al., 2010).
The product material footprint is defined by the indicators raw material input (RMI) and the total material requirement (TMR) (Mostert and Bringezu, 2019). Both indicators refer to the environmental impacts of the material input within LCA boundaries. The RMI measures the cumulative used raw materials for a specific product or service per FU, i.e., the used extraction. The extraction process of raw materials is always associated with unused extraction. The unused extraction is the primary material that is moved and disposed within the nature to extract raw materials. Unused extraction is not further processed and has no economic value, e.g., the overburden of a mine. The TMR measures the total extraction of the primary material from nature, as the sum of used and unused extraction.
The working group, “Water Use in Life Cycle Assessment” (WULCA) of the “UNEP-SETAC Life Cycle Initiative,” has developed a method for calculating the product water footprint (Boulay et al., 2018). The Available Water Remaining (AWARE) method can be used to determine the amount of water remaining in a catchment area or a country, less than human, animal, and plant water requirements. AWARE could address the potential vulnerability of a catchment area to water stress. For calculating the characterization factors, the variable availability minus demand (AMD) is used, which is made up of water availability minus the human and environmental requirements in relation to the reference area (Boulay et al., 2018).
The environmental footprint results of the AAM concrete mixtures M1–M4 and the PC reference concrete are shown in this section. First, a summary of the cradle-to-gate results are shown; second, the detailed results of climate, energy, material, and water footprints are shown according to modules A1, A2, and A3, and the contribution of the most relevant materials to module A1.
The LCA results of the AAM concrete mixtures M1–M4 in relation to the PC reference concrete are shown in Figure 2. The PC concrete is used as a reference depicting 0%, and the results of the M1–M4 mixtures are displayed in relation to the reference.
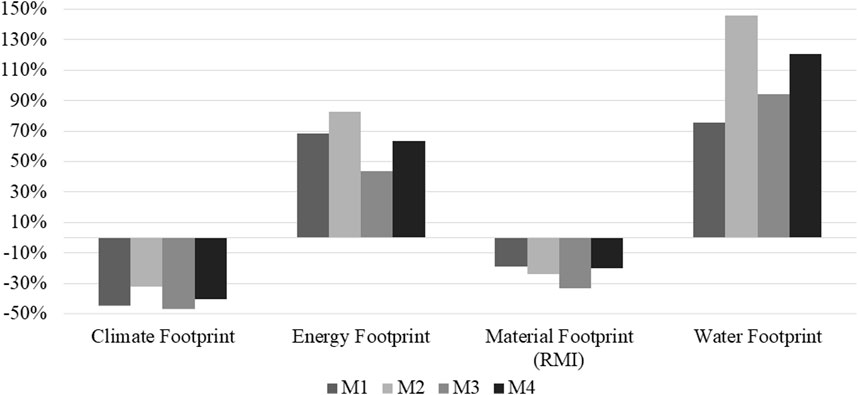
FIGURE 2. Comparison of climate, energy, material, and water footprints of the concrete mixtures M1–M4 (Portland cement reference PC-ref. = 0%). RMI: raw material input. Climate footprint of PC-ref. is dominated by the calcination process rather than energy consumption.
The results show the advantages of AAM in climate and material footprints opposing the disadvantages in energy and water footprints.
The GHG emissions of the cradle-to-gate processes of 1 m³eq AAM mixtures are 32% (M2) up to 47% (M3) lower than GHG emissions caused by the production of 1 m³ of the PC-ref. The material footprint of the AAM concrete mixtures is 19% (M1) up to 33% (M3) lower than the material footprints of the PC-ref. in terms of the RMI. Considering the raw material input and unused extraction, as reflected by the TMR, the material footprints are 26%–38% lower than the material footprint of the PC-ref (see supplementary material).
The energy footprints of the AAM mixtures exceed the results of the PC-ref. by 44% (M3)–83% (M2). The share of non-renewable energy is about 90% of the energy footprint (see supplementary material). Contrasting results between the climate footprint and energy footprint can be explained by the fact that the climate footprint of Portland cement production is not primarily due to energy consumption. In Portland cement production, 50%–60% of climate emissions are caused by the calcination process, where calcium carbonate (CaCO3) is converted into calcium oxide (CaO) and CO2 during burning (Mikulčić et al., 2016; Habert et al., 2020).
The water footprints of the alternative binder concretes are 75% (M1)–147% (M2) higher than the PC-ref. water footprint. Other than the climate footprint, the water footprint is correlating with the energy footprint. Overall concretes with low waterglass contents (M1) and high compressive strength (M3) have the best environmental performances of the AAM concrete mixtures.
The results consider the contribution of each life cycle module (material production A1, transport A2, and concrete mixing A3). As shown in the following sections, the results are dominated by material production (module A1), which makes up more than 90% of the climate and energy footprints and more than 96% of the material and water footprints. Therefore, the share contributions of the materials within A1 are additionally discussed. The complete result tables can be observed in the supplementary material.
The detailed climate footprint results of the AAM mixtures M1–M4 and the PC-ref. are shown in Figure 3.
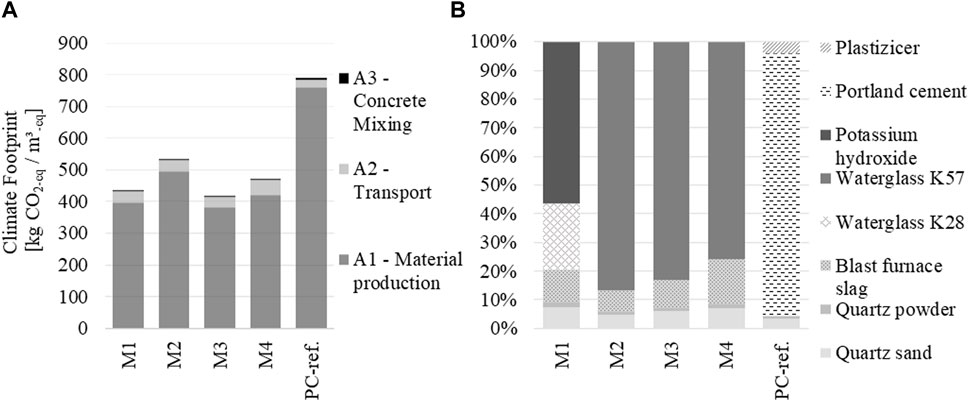
FIGURE 3. Climate footprint results of the ultra-high-performance concrete mixtures (M1–M4) and PC-ref. by material production, transport, and concrete mixing (A) and materials used for production (B).
The climate footprint of the PC-ref. material production amounts to 761 kg CO2-eq./m³ with Portland cement making up 88% of the GHG emissions. Material production for AAM concretes amounts to 383 CO2-eq./m³-eq (M3) up to 496 CO2-eq./m³-eq (M2). Regarding the mixture M1, potassium hydroxide is the main contributor to the climate footprint (56%), followed by waterglass K27 (23%). Regarding AAM mixtures M2–M4, potassium metasilicate (waterglass K57) is the main contributor to GHG emissions (76%–87%).
The detailed energy footprint results of AAM mixtures M1–M4 and the PC-ref. are shown in Figure 4.
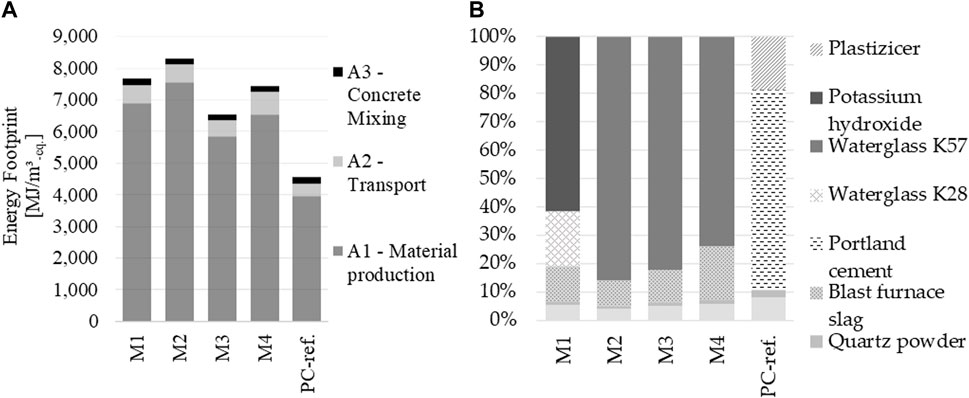
FIGURE 4. Energy footprint results of the ultra-high-performance concrete mixtures M1–M4 and PC-ref. by material production, transport, and concrete mixing (A) and materials used for production (B).
The energy footprint of PC-ref. material production (A1) is 3,973 MJ/m³−eq, which is also mainly (70%) determined by Portland cement. The cumulative energy demand of the material production of M1–M4 mixtures is within the range of 5,858 MJ/m³−eq (M3) up to 7.656 MJ/m³−eq (M2), mainly caused by the energy demand of potassium hydroxide production (62% of M1) and waterglass (74%–86% of M2–M4).
The detailed material footprint results of AAM mixtures M1–M4 and the PC-ref. are shown in Figure 5.
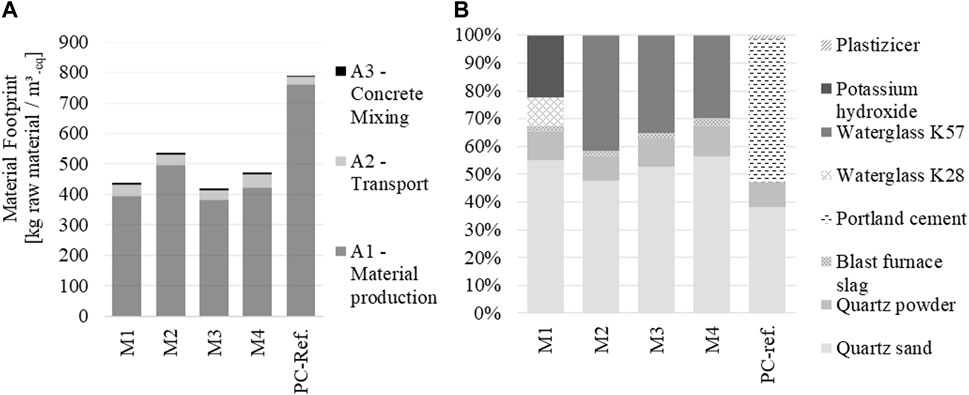
FIGURE 5. Material footprint based on raw material input results of the ultra-high-performance concrete mixtures M1–M4 and PC-ref. by material production, transport, and concrete mixing (A) and materials used for production (B).
The material footprints are determined by quartz sand. Quartz sand amounts to about 40% of the total mass of the mixtures M1–M4 and the PC-ref. Due to the use of secondary materials (GGBFS and silica fume), the material footprints of the mixtures M1–M4 are lower than the total mass of the mixtures per m³−eq. For example, 1 m³−eq of the mixture M3 weighs 2,034 kg and needs 1,804 kg of raw material (1,970 kg of primary material) for its production. In comparison, the direct material input of the PC-ref. is 2,357 kg/m³−eq and its material footprint sums up to 2,746 kg raw material (3,232 kg primary material) per m³−eq of concrete.
The detailed water footprint results of AAM mixtures M1–M4 and the PC-ref. are shown in Figure 6.
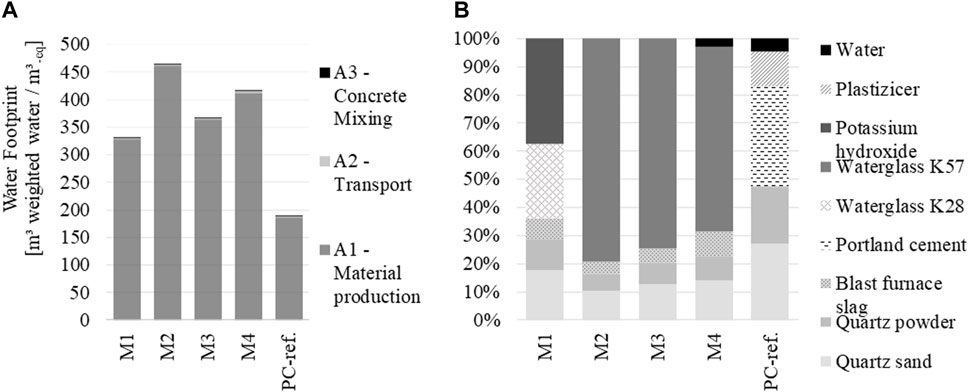
FIGURE 6. Water footprint results of the ultra-high-performance concrete mixtures M1–M4 and PC-ref. by material production, transport, and concrete mixing (A) and materials used for production (B).
For the material production of mixtures, M1–M4 328 (M1) up to 461 (M2) m³ of water, weighted by the availability at the reference area, are used. In comparison, 186 m³ weighted water is used for material production of the PC-ref. The water footprint results from the production of waterglass (67%–79% in mixtures M2–M4). Within the production of the materials for mixtures M1, potassium hydroxide and waterglass are the main contributors to the water footprint (37% and 27%, respectively).
Sensitivity analysis is conducted to determine the impact of allocation methods on the results. The relative footprint results of M1–M4 in relation to PC-ref. (0%) without allocation, with economic allocation, and with mass allocation are shown in Figure 7.
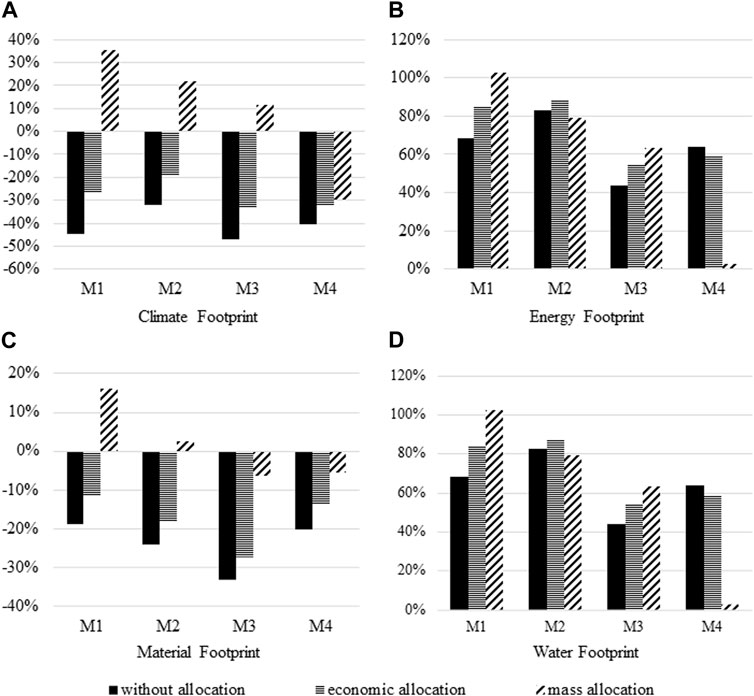
FIGURE 7. Climate (A), Energy (B), Material (C) and Water (D) Footprint results of the ultra-high-performance concrete mixtures M1-M4 and PC-ref. considering different allocation methods.
The UHPC concrete mixtures with alkali-activated M1–M4 have 32%–47% lower climate and material footprints and higher energy and water footprints compared to the PC-ref. without allocation. Considering economic allocation, the advantages of the AAM mixtures M1–M3 declined by 6–22 percentage points, and the disadvantage increased by 1–15 percentage points. For example, without allocation, the climate footprint of M1 is 45% lower than the climate footprint of the PC-ref., and with economic allocation, it is 26% lower; therefore, the advantage declines by 18 percentage points.
The energy footprint and water footprint of mixture M4 improved in relation to the PC-ref., when allocation is considered, especially with mass allocation. Without allocation, the energy footprint of mixture M4 is 64% higher than that of the PC-ref., while with mass allocation, its energy footprint is only 3% higher. Overall, with mass allocation, the results of the AAM-UHPC in comparison with the PC-ref. can change up to 80 percentage points (see relative climate footprint of M1).
Overall, the results of the sensitivity analysis confirm that in the comparative LCA of UHPC concrete, the allocation method can determine whether a new binder formula is better or worse than PC, considering the environmental footprints of the concrete. Still, economic allocation should be preferred, where the main products (steel and silicon) are the predominant source, if revenue in the production process is present. In this case, the effect of allocation is not critical for the comparison.
Footprint analysis of four concrete mixtures with alkali-activated materials (mixtures M1–M4) comparted to concrete with PC is carried out within the cradle-to-gate LCA boundaries. The functional unit of each mixture is adapted to represent equivalent functions of mixtures with different compressive strengths. Additionally, the mechanical properties of AAM-UHPC and PC-UHPC are comparable as shown by Wetzel et al. (2022). The workability, especially the lower setting of the AAM-based UHPC might be problematic due to applications. The effects of differences in durability, workability, and shrinkage were not considered within the LCA. Methods that integrate different properties, especially durability into the LCA, should be investigated for future LCA studies.
Within the scope of this LCA, the results show that AAM-UHPC has better performance in terms of climate and material footprints, whereas the trade-off can be seen regarding energy and water footprints. The disadvantages in energy and water footprints originated from the use of waterglass. However, it must be noted that the data on waterglass production are to be viewed as an approximation. The data used in this study are valid for the production of sodium waterglass based on production data from the year 1995. Recent studies show that the global warming impact of sodium silicate production has declined with new production technologies (Komkova and Habert, 2023). Although no current data are available for potassium waterglass, it can be assumed that lower values can also be assumed for potassium waterglass.
When environmental impacts of silicon production and steel production are allocated to silica fume and GGBFS, respectively, the allocation method can determine if an AAM mixture is better or worse than the PC-ref. With economic allocation, the relation between PC and AAM-UHPC results changes by 1–22 percentage points. Considering mass allocation, the differences are more drastic. Still, the results of the economic allocation should be preferred for the analysis.
Future studies should focus on the production processes of potassium waterglass with different chemical compositions (e.g., molar ratios). In addition, the comparability of sodium waterglass and potassium waterglass in terms of environmental impacts should be examined. Overall, mixtures with high compressive strength like M3 and low waterglass content like M1 show the best environmental performance of the examined AAM mixtures. Evaluation methods such as normalization, weighting, and ranking could be applied in future studies when the environmental impacts of AAM binders and PC are compared. This could show the significance of individual footprint results and would improve the assessment of opposing results of different footprint categories. Furthermore, future trends of steel production in furnaces should be considered when impacts of steel production are allocated to GGBFS.
The original contributions presented in the study are included in the article/Supplementary Material; further inquiries can be directed to the corresponding author.
HS and AW conceptualized and designed the analysis. AW and DGö contributed data and information on the AAM mixtures. DGl collected the data and performed the analysis. BM, CM, and SB provided critical feedbacks. All authors discussed the results and contributed to the final manuscript. All authors listed made a substantial, direct, and intellectual contribution to the work and approved it for publication.
The authors declare that the research was conducted in the absence of any commercial or financial relationships that could be construed as a potential conflict of interest.
All claims expressed in this article are solely those of the authors and do not necessarily represent those of their affiliated organizations, or those of the publisher, the editors, and the reviewers. Any product that may be evaluated in this article, or claim that may be made by its manufacturer, is not guaranteed or endorsed by the publisher.
The Supplementary Material for this article can be found online at: https://www.frontiersin.org/articles/10.3389/fbuil.2023.1196246/full#supplementary-material
Boulay, A., Bare, J., Benini, L., Berger, M., Lathuillière, M. J., Manzardo, A., et al. (2018). The WULCA consensus characterization model for water scarcity footprints: Assessing impacts of water consumption based on available water remaining (AWARE). Int. J. Life Cycle Assess. 23, 368–378. doi:10.1007/s11367-017-1333-8
Cembureau (2020). Portland cement (CEM I) produced in europe. Available at: https://cembureau.eu/media/3lplreko/epd-for-cement-cem-i.pdf (Accessed March 24, 2023).
Chen, C., Habert, G., Bouzidi, Y., Jullien, A., and Ventura, A. (2010). LCA allocation procedure used as an incitative method for waste recycling: An application to mineral additions in concrete. Resour. Conserv. Recycl 54, 1231–1240. doi:10.1016/j.resconrec.2010.04.001
Cibulka, S., and Giljum, S. (2020). Towards a comprehensive framework of the relationships between resource footprints, quality of life, and economic development. Sustainability 12, 4734. doi:10.3390/su12114734
Davidovits, J. (2015). Geopolymer chemistry and applications. 4th. Saint-Quentin: Institut Géopolymère, Geopolymer Institute.
DIN EN ISO 14044 ((2021)). “Umweltmanagement – Ökobilanz – anforderungen und Anleitungen,” in ISO 14044 (ISO 14044:2006 + amd 1:2017 + amd 2:2020) Germany: Deutsches Institut für Normung e.V.
Ecoinvent (2022a). ecoinvent. Available at: https://ecoinvent.org/(Accessed April 6, 2022).
Ecoinvent (2022b). Ecoinvent v3.8. Available at:https://ecoinvent.org/the-ecoinvent-database/data-releases/ecoinvent-3-8/.
Ecoinvent (2022c). Market Activities – ecoinvent (n.d). Available at: https://ecoinvent.org/the-ecoinvent-database/market-activities/(Accessed April 6, 2022).
EN 15804 (2020). “Sustainability of construction works – environmental product declarations – core rules for the product category of construction products,” in German version EN 15804:2012+A2:2019. Germany: Deutsches Institut für Normung e.V.
Europe, P. Q. (2004). Sodium and potassium silicates properties. Versatile compounds for your applications.
European Commission Joint Research Centre Institute for Environment and Sustainability (JRC-IES) (2011). ILCD handbook: Interational reference life cycle data system, recommendations for life cycle impact assessment in the European context. Luxemburg: Publication office of the European Commission.
Fawer, M., Concannon, M., and Rieber, W. (1999). Life cycle inventories for the production of sodium silicates. Int. J. Life Cycle Assess. 4, 207–212. doi:10.1007/BF02979498
Federal Environmental Agency (2001). Large volume solid inorganic chemicals: Sodium silicate. Germany: Feder Environmental Agency.
Fidjestøl, P., and Dåstøl, M. (2008). “The history of silica fume in concrete-from novelty to key ingredient in high performance concrete,” in Proceedings of the Congresso Brasileiro do Concreto, September 4–9, 2008.
Goubran, S. (2019). On the role of construction in achieving the SDGs. J. Sustain. Res. 1. doi:10.20900/jsr20190020
GreenDelta (2022). openLCA. Available at: https://www.openlca.org/.
Habert, G. (2013). A method for allocation according to the economic behaviour in the EU-ETS for by-products used in cement industry. Int. J. Life Cycle Assess. 18, 113–126. doi:10.1007/s11367-012-0464-1
Habert, G., D’Espinose De Lacaillerie, J. B., and Roussel, N. (2011). An environmental evaluation of geopolymer based concrete production: Reviewing current research trends. J. Clean. Prod. 19, 1229–1238. doi:10.1016/j.jclepro.2011.03.012
Habert, G., Miller, S. A., John, V. M., Provis, J. L., Favier, A., Horvath, A., et al. (2020). Environmental impacts and decarbonization strategies in the cement and concrete industries. Nat. Rev. Earth Environ. 1, 559–573. doi:10.1038/s43017-020-0093-3
Huijbregts, M. A. J., Hellweg, S., Frischknecht, R., Hendriks, H. W. M., Hungerbühler, K., and Hendriks, A. J. (2010). Cumulative energy demand as predictor for the environmental burden of commodity production. Environ. Sci. Technol. 44, 2189–2196. doi:10.1021/es902870s
ISO (2009). DIN EN ISO 14040 (2009) Umweltmanagement - Ökobilanz - Grundsätze und Rahmenbedingungen (ISO 14040:2006) Germany: Deutsches Institut für Normung e.V., 1–19.
Komkova, A., and Habert, G. (2023). Environmental impact assessment of alkali-activated materials: Examining impacts of variability in constituent production processes and transportation. Constr. Build. Mater 363, 129032. doi:10.1016/j.conbuildmat.2022.129032
Marinković, S. (2017). On the selection of the functional unit in LCA of structural concrete. Int. J. Life Cycle Assess. 22, 1634–1636. doi:10.1007/s11367-017-1379-7
Mikulčić, H., Klemeš, J. J., Vujanović, M., Urbaniec, K., and Duić, N. (2016). Reducing greenhouse gasses emissions by fostering the deployment of alternative raw materials and energy sources in the cleaner cement manufacturing process. J. Clean. Prod. 136, 119–132. doi:10.1016/j.jclepro.2016.04.145
Mostert, C., and Bringezu, S. (2019). Measuring product material footprint as new life cycle impact assessment method: Indicators and abiotic characterization factors. Resources 8, 61. doi:10.3390/resources8020061
Mostert, C., Ostrander, B., Bringezu, S., and Kneiske, T. (2018). Comparing electrical energy storage technologies regarding their material and carbon footprint. Energies (Basel) 11, 3386. doi:10.3390/en11123386
Pontikes, Y., Machiels, L., Onisei, S., Pandelaers, L., Geysen, D., Jones, P. T., et al. (2013). Slags with a high Al and Fe content as precursors for inorganic polymers. Appl. Clay Sci. 73, 93–102. doi:10.1016/j.clay.2012.09.020
Sameer, H., and Bringezu, S. (2019). Life cycle input indicators of material resource use for enhancing sustainability assessment schemes of buildings. J. Build. Eng. 21, 230–242. doi:10.1016/j.jobe.2018.10.010
Sameer, H., Weber, V., Mostert, C., Bringezu, S., Fehling, E., and Wetzel, A. (2019). Environmental assessment of ultra-high-performance concrete using carbon, material, and water footprint. Materials 12, 851. doi:10.3390/MA12060851
Schmidt, M., Fehling, E., Fröhlich, S., and Thiemicke, J. (2014). Sustainable building with ultra-high performance concrete-results of the German priority programme 1182 funded by deutsche forschungsgemeinschaft (DFG). Germany.
Schomberg, A. C., Bringezu, S., and Flörke, M. (2021). Extended life cycle assessment reveals the spatially-explicit water scarcity footprint of a lithium-ion battery storage. Commun. Earth Environ. 2, 11. doi:10.1038/s43247-020-00080-9
Scrivener, K. L., and Kirkpatrick, R. J. (2008). Innovation in use and research on cementitious material. Cem. Concr. Res. 38, 128–136. doi:10.1016/j.cemconres.2007.09.025
Seto, K. E., Churchill, C. J., and Panesar, D. K. (2017). Influence of fly ash allocation approaches on the life cycle assessment of cement-based materials. J. Clean. Prod. 157, 65–75. doi:10.1016/J.JCLEPRO.2017.04.093
Singh, N. B., and Middendorf, B. (2020). Geopolymers as an alternative to Portland cement: An overview. Constr. Build. Mater 237, 117455. doi:10.1016/j.conbuildmat.2019.117455
Statista, (2022). Global construction market size. Available at:https://www.statista.com/statistics/1290105/global-construction-market-size-with-forecasts/%0Ahttps://www.statista.com/statistics/1290105/global-construction-market-size-with-forecasts/#statisticContainer (Accessed February 14, 2023).
Steinmann, Z. J. N., Schipper, A. M., Hauck, M., Giljum, S., Wernet, G., and Huijbregts, M. A. J. (2017). Resource footprints are good proxies of environmental damage. Environ. Sci. Technol. 51, 6360–6366. doi:10.1021/acs.est.7b00698
Timm, J. F. G., Morales, M. F. D., and Passuello, A. (2019). Sensitivity analysis of life cycle impacts distribution methods choice applied to silica fume production. IOP Conf. Ser. Earth Environ. Sci. 323, 012131. doi:10.1088/1755-1315/323/1/012131
Turnau, S., Mignot, C. S., Mostert, C., and Bringezu, S. (2020). Material or fuel: Comparative cradle-to-grave climate and material footprint analysis for the use of methanol from recycled CO 2. Green Chem. 22, 8423–8443. doi:10.1039/D0GC02946G
Van Den Heede, P., and De Belie, N. (2012). Environmental impact and life cycle assessment (LCA) of traditional and “green” concretes: Literature review and theoretical calculations. Cem. Concr. Compos 34, 431–442. doi:10.1016/j.cemconcomp.2012.01.004
Wetzel, A., Göbel, D., Schleiting, M., Wiemer, N., and Middendorf, B. (2022). Bonding behaviour of steel fibres in UHPFRC based on alkali-activated slag. Materials 15, 1930. doi:10.3390/ma15051930
Wetzel, A., and Middendorf, B. (2019). Influence of silica fume on properties of fresh and hardened ultra-high performance concrete based on alkali-activated slag. Cem. Concr. Compos 100, 53–59. doi:10.1016/j.cemconcomp.2019.03.023
Keywords: construction, sustainable infrastructure, life cycle assessment, greenhouse gas emissions, material footprint, alkali-activated materials, concrete and cement
Citation: Glanz D, Sameer H, Göbel D, Wetzel A, Middendorf B, Mostert C and Bringezu S (2023) Comparative environmental footprint analysis of ultra-high-performance concrete using Portland cement and alkali-activated materials. Front. Built Environ. 9:1196246. doi: 10.3389/fbuil.2023.1196246
Received: 29 March 2023; Accepted: 02 May 2023;
Published: 22 May 2023.
Edited by:
Georgios Bartzas, National Technical University of Athens, GreeceReviewed by:
Ioanna Giannopoulou, National Technical University of Athens, GreeceCopyright © 2023 Glanz, Sameer, Göbel, Wetzel, Middendorf, Mostert and Bringezu. This is an open-access article distributed under the terms of the Creative Commons Attribution License (CC BY). The use, distribution or reproduction in other forums is permitted, provided the original author(s) and the copyright owner(s) are credited and that the original publication in this journal is cited, in accordance with accepted academic practice. No use, distribution or reproduction is permitted which does not comply with these terms.
*Correspondence: Dilan Glanz, ZGlsYW4uZ2xhbnpAdW5pLWthc3NlbC5kZQ==
Disclaimer: All claims expressed in this article are solely those of the authors and do not necessarily represent those of their affiliated organizations, or those of the publisher, the editors and the reviewers. Any product that may be evaluated in this article or claim that may be made by its manufacturer is not guaranteed or endorsed by the publisher.
Research integrity at Frontiers
Learn more about the work of our research integrity team to safeguard the quality of each article we publish.