
94% of researchers rate our articles as excellent or good
Learn more about the work of our research integrity team to safeguard the quality of each article we publish.
Find out more
ORIGINAL RESEARCH article
Front. Built Environ., 15 March 2023
Sec. Computational Methods in Structural Engineering
Volume 9 - 2023 | https://doi.org/10.3389/fbuil.2023.1144606
This article is part of the Research TopicApplications of Explainable AI to Civil EngineeringView all 7 articles
 J. A. Guzmán-Torres1*†
 F. J. Domínguez-Mota1,2‡
 W. Martínez-Molina1‡
 M. Z. Naser3‡
 G. Tinoco-Guerrero1‡
 J. G. Tinoco-Ruíz2‡
Damage assessment applied to reinforced concrete elements is one of the main activities of infrastructure maintenance tasks. Among these elements, the problem of corrosion in reinforced concrete is particularly critical and requires careful consideration. Annually, governments invest a large amount of economic resources in this activity. However, most methodologies for damage assessment rely on visual inspection, which may be subjectively interpreted, producing inconsistent results and requiring a considerable amount of time and resources. This study evaluates the performance of real-time object detection using You Only Look Once, version 3, for detecting corrosion damage in concrete structures. The architecture of YOLOv3 is based on a complex, but efficient, convolutional neural network fed by a dataset proposed and labeled by the authors. Two training stages were established to improve the model precision, using transfer learning with medium- and high-resolution training images. The test results show satisfactory concrete-corrosion detection through validation photographs and videos demonstrating the capabilities of explainable artificial intelligence and its applications in civil engineering.
Artificial intelligence (AI) applications have been growing in numerous fields of science and technology. Nowadays, several major approaches within the AI context, such as machine learning (ML) and deep learning (DL), are being developed and with a significantly large number of problems Naser (2023). Both methods are focused on unique kinds of analysis problems. Regression, classification, supervision, and recommendation are some of the most common issues. These techniques have been successfully implemented in different knowledge sectors and industries Guzmán-Torres et al. (2022). The latter tries to keep up with these technological implementations. As such a broad and essential sector for society, AI’s applications in construction are innumerable. However, this situation is usually a disadvantage in the construction sector because many variables make it difficult to control the assessment process Torres et al. (2020).
Civil engineering focuses on designing, constructing, supervising, and maintaining urban infrastructure. Undoubtedly, most of the existing infrastructure is built with reinforced concrete, which implies using the two most used materials in construction worldwide, concrete and steel Martinez-Molina et al. (2021); Guzmán-Torres et al. (2021e). For this reason, it is crucial to carry out damage assessment in reinforced concrete effectively, efficiently, and objectively.
Corrosion is one of the main problems impacting reinforced concrete infrastructure, which directly affects the structural backbone exposed to the natural elements from spalling problems and impacts the security and durability of reinforced concrete structures Castañeda-Valdéz and Rodriguez-Rodriguez (2014). Usually, there are different approaches to monitor damage on concrete structures, most of which are supported by visual inspection techniques. In most cases, this methodology becomes subjective. Consequently, it might need to be more consistent, in addition to the fact that a considerable amount of time and economic resources are needed to manage the evaluation of the current state of concrete structures Guzmán-Torres et al. (2022). On the other hand, when the inspection methods are not visual, electrochemical and non-destructive tests (NDTs) such as ultrasonic pulse velocity, electrical resistivity, carbonation resistance, and resonance frequencies are usually used, having produced acceptable results Bungey and Grantham (2006); Breysse et al. (2021); Smirnova et al. (2020). However, the use of these techniques requires sophisticated equipment and skilled labor. Also, the NDTs should be complemented with other techniques to provide a more comprehensive assessment of the concrete conditions. Some of the limitations in the use of NDTs are as follows:
• Interpretation of results. Usually, the NDT may require interpretation by trained professionals, and the operator’s skills can affect the results.
• Variability in concrete properties. The different conditions of the structures might affect the accuracy and reliability of NDT outcomes.
• Cost. NDT methods can be expensive, and the cost is related to the size of the structure to be analyzed.
• Surface conditions. For instance, the moisture grade can affect the results’ accuracy.
These limitations highlight the necessity of implementing direct and feasible methodologies like ML techniques.
The exciting field of computer vision (CV) emerges from DL theory, which focuses on vision systems that execute a specific task on images and videos. These tasks detect, classify, and segment objects into images, photographs, and videos. The state-of-the-art shows success stories from adopting AI methods to monitor concrete materials and structures. The current research shows multiple DL-related works involving typical analysis problems. Some of them are connected with the property prediction of concrete and its behavior when subject to different kinds of loads (compressive strength, tensile strength, and flexural strength), an analysis of mixtures that include natural organic polymers, and concrete materials that involve other properties Guzmán-Torres et al. (2021a); Tahwia et al. (2021); Guzmán-Torres et al. (2021d); Bui et al. (2018); Guzmán-Torres et al. (2021c); Naderpour et al. (2018); Yaseen et al. (2018); Deng et al. (2018); Behnood et al. (2017); Belyakov et al. (2021); Yakovlev et al. (2021); Tayeh et al. (2022); Zeyad et al. (2022).
Studies such as concrete analysis under extreme load conditions, corrosion risk estimations, methods for predicting resistance in concrete elements under the action of fire, and estimation of durability on concrete specimens have been performed with computational approaches Naser (2021a); Guzmán-Torres et al. (2021b); Naser and Kodur (2022); Naser (2021b); Guzmán-Torres (2022).
It is important to note that several notable works in machine learning should be considered as the use of these techniques continues to increase for various applications. For example, Solhmirzaei et al. (2020) presented a data-driven ML framework, which uses multiple ML algorithms to predict the failure mode and shear capacity of ultra-high-performance concrete (UHPC) beams. In addition, the importance of explainability in ML models is highlighted in a study by Cakiroglu et al. (2022). They developed data-driven ML models using 719 experiments to predict the axial compression capacity of rectangular concrete-filled steel tubular columns Cakiroglu et al. (2022).
The implementation of ML algorithms has increased the effective evaluation of infrastructure. In a recent study, Zhen Sun et al. (2022) proposed a method combining an ML approach to evaluate the effectiveness of the tuned mass dampers. The authors used seven ML techniques to generate the predictive models using properties such as temperature and wind as input data. In addition to this approach, standard algorithms that use artificial neural networks (ANNs) remain prevalent nowadays, as we can observe in a study by Hemmatian et al. (2023), where the maximum fiber pull-out force and corresponding bond slip are predicted using ANNs.
Other works include a graphical user interface (GUI) to aid practicing engineers in developing new technological tools. It is possible to appreciate the study by Hemmatian et al. (2023), where a simple GUI was developed to accurately estimate the shear strength of fiber-reinforced polymer-reinforced concrete beams. It demonstrated a high level of accuracy and excellent performance.
In parallel, AI has been considered for more complex approaches, such as the analysis of images in civil engineering through convolutional neural networks using segmentation, classification, and detection of failures on concrete surfaces Ranjbar et al. (2021); Wu et al. (2021); Dais et al. (2021); Yang et al. (2020); Kang et al. (2020); Mei et al. (2020); Tabernik et al. (2020); Zhang et al. (2020), Zhang et al. (2019); Feng et al. (2019); Liu et al. (2019); Choi and Cha (2019); Dung et al. (2019); Li et al. (2019); König et al. (2019); Liu et al. (2019); Bang et al. (2019); Chen et al. (2019); Silva and Lucena (2018); Zhang et al. (2018); Cha et al. (2018); Li et al. (2018); Jenkins et al. (2018); Dorafshan et al. (2018); Gopalakrishnan et al. (2017); Cha et al. (2017); this is one of the most elegant and impressive ways to represent pathologies, issues, and behavior related with infrastructure.
The study aims to demonstrate how some AI methods aid in spotting reinforced concrete damage, specifically corrosion damage. This is one of the most concerning problems in infrastructure nowadays. The approach used in this study, the followed steps, the advice of what hyperparameters must be changed in order to obtain a better performance, and the interpretability of the results produced by the model explain the ML model performance and make the implemented model more easily interpretable.
ML is helpful in structural damage detection because it can help identify and analyze complex patterns that are difficult for humans to detect. This study highlights the necessity of CV applications because it emphasizes the early detection of damage and aids in corrosion prevention, leading to increased safety, reliability, and cost savings. This study intends to demonstrate how concrete visual inspection and damage detection can be deployed in real-time, in contrast to other ML models which perform object detection in static images.
The analysis of this problem and its development is of great interest to the construction and maintenance sector to reduce the requirements of economic and human resources.
Corrosion of embedded reinforced steel is one of the main problems in concrete structures. It has become a crucial topic that requires the full attention of maintenance engineers who work with concrete structures, such as those who maintain bridges and roads Kessler et al. (1997).
The phenomenon of reinforcing steel oxidation significantly affects the functional properties of reinforced concrete, such as its adhesion. Additionally, this phenomenon induces crack generation and spalling problems over concrete surfaces, which compromises the structural integrity del Valle Moreno et al. (2001).
Corrosion is an expression often used in metal degradation because of the electrochemical process. It causes considerable damage to buildings, bridges, ships, and cars Chang and Goldsby (2013). The corrosion process might start when aggressive agents such as chlorides, sulfates, and carbon dioxide penetrate the concrete matrix Borges et al. (1998). In civil infrastructure, the metals are often used as ceramic reinforcement, as can be noticed in the reinforced concrete, metallic structures, liquids, gas pipelines, and electric installations coated with insulating polymers. In reinforced concrete, ferrous alloys—basically metals—are the predominant ones.
The corrosion might cause critical damage to reinforced concrete as cracks and spalling. These damages result in low performance of concrete structures and cause a considerable reduction in the deformation capacity of the reinforcing steel. These issues put at risk the security of the building. Thus, the preventive actions, evaluation, detection, and control of the corrosion process are of paramount interest Herrera et al. (2022).
To mitigate the issues of corrosion in concrete structures, new concrete structures must be designed by a durability criterion, avoiding resistance-based methods such as Duff Abrams and the ACI (American Concrete Institute) tables, which are relied upon for the resistance criterion. Instead of resistance criteria, the idea is to design mixtures by durability. The ACI provides a design method considering this approach. In the construction processes, many factors are involved in the mixture performance, but mainly, the durability is directly related to the water–cement ratio. The water–cement ratio equal to or lower than 0.44 produces ceramic matrices with a lower percentage of interconnected pores, thus reducing the probability of presenting corrosion problems.
The cost of controlling corrosion on the infrastructure may be translated into insecurity for users, building demolitions, and the need for new civil infrastructure, all of which require considerable energy and resources, both human and economic. Therefore, the accurate and efficient detection of corrosion in concrete structures is of great importance in the civil engineering field, and CV can be a valuable tool in this regard.
CV is a rapidly advancing field, made possible by recent refinements in AI and DL. As a society, we rely on technological tools to perform our daily activities efficiently, and CV applications have become universal in our everyday lives through the smart devices at our disposal. Facial recognition is an area in which CV projects have made significant progress. Smartphones, for instance, are increasingly better at recognizing faces to unlock themselves. CV is now a broad field that encompasses a wide range of techniques, including traditional CV, ML, and DL algorithms. Traditional CV algorithms rely on handcrafted features to extract and identify relevant information from images, whereas ML algorithms can be used to classify images or detect objects. One commonly used ML algorithm for these tasks is the support vector machine (SVM) technique. DL algorithms have demonstrated significant improvements in the precision of many CV applications, including object detection, image classification, and image segmentation.
Vision systems consist of two primary components: sensing devices, such as cameras, and interpreting devices, typically workstations or other computing devices. While the specific problems addressed by CV applications can vary, most vision systems use a sequence of distinct steps to process and analyze image data. These steps are commonly referred to as a CV pipeline, which involves acquiring input data, preprocessing the data, feature extraction, analysis, and recognition, and finally, the application of ML techniques to make predictions based on the information extracted from the image. Figure 1 illustrates the steps involved in a typical CV pipeline.
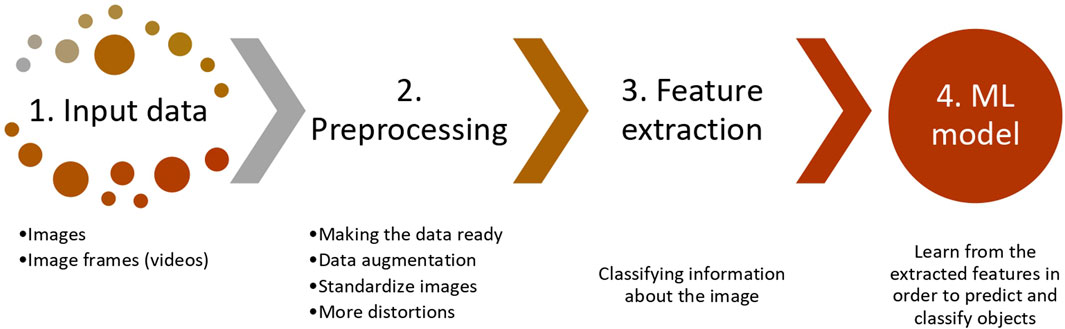
FIGURE 1. Computer vision pipeline.
Dealing with images or videos as input data is a typical routine in CV applications. For instance, if we refer to grayscale, it is possible to represent an image in matrix notation. CV approaches represent a grayscale photograph as a function of two variables, x and y, which define a two-dimensional area. A grid of pixels can represent a digital image. The pixel is the raw building block of an image. Each image consists of a set of pixels representing the light intensity in a given location in the photograph. When we look at an image or a photograph, we see objects, surfaces, colors, landscapes, and textures. However, that is not the case with computers. For computers, a grayscale image looks like a two-dimensional array of pixel values. Figure 2 represents an image with a size of 44 × 44. This size indicates the width and height of the image, where the figure has 44 horizontal and 44 vertical pixels. That means there is a total amount of 1,936 pixels, and each one in the array represents the brightness intensity in each pixel; 0 represents black, and 255 represents white.
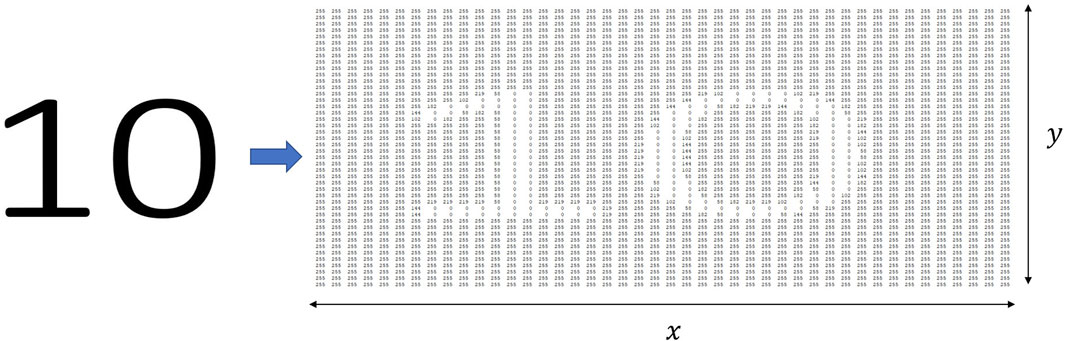
FIGURE 2. Image representation on computers.
The previous condition applies to grayscale images, but color images are different. In color images, instead of representing the pixel value with one number, the value is represented by three numbers: the intensity of red (R), green (G), and blue (B), representing the intensity of each color in the pixel. Therefore, the system is described in an RGB scheme.
YOLOv3 is an advanced and sophisticated algorithm for detecting real-time objects based on a single stage. This single-stage algorithm is supported on a complex CNN, which is a significant improvement over previous versions, such as YOLO Redmon et al. (2016) and YOLOv2 (YOLO9000) Redmon and Farhadi (2017); Figure 3, taken directly from a study by Zhao et al. (2020); itshows the general architecture of the YOLOv3 algorithm implemented in this study. YOLOv3 architecture is primarily based on Darknet-53, which contains 23 residual units He et al. (2016). Each residual unit includes a 3 × 3 convolutional operation and a 1 × 1 operation, and at the end of each residual unit, a layer is added between the input and output vectors. These residual units are responsible for calculating the convolutional feature maps over each complete image used as an input parameter in the model. Each convolutional layer contains three sequential layers: a convolution layer O’Shea and Nash (2015), a batch normalization layer Ioffe and Szegedy (2015), and a leaky rectified linear unit (ReLU) layer Maas et al. (2013).
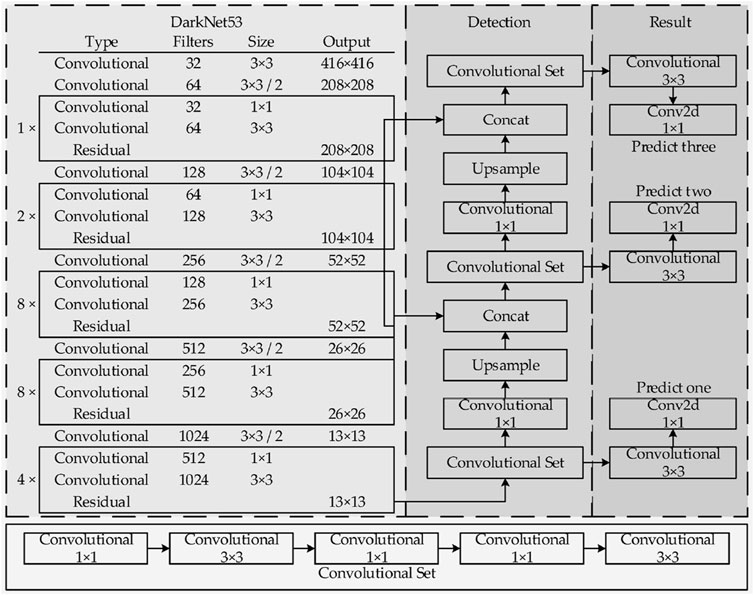
FIGURE 3. YOLOv3 architecture.
The YOLOv3 backbone is performed across five separate convolutional layers. Each convolutional layer works with a stride equal to two to reduce the feature map dimensionality and becomes more efficient in the operations performed during the training process. The ImageNet dataset Deng et al. (2009) is used to pre-train the backbone Darknet-53 Redmon (2013). It has proved that it is capable of producing paramount results compared to state-of-the-art feature extractors such as RetinaNet Lin et al. (2017), DSSD513 Fu et al. (2017), ResNet-101, and ResNet102 He et al. (2016), consuming less computational resources Redmon and Farhadi (1804).
First, YOLOv3 operates by splitting the input image within a grid of cells, where each one is responsible for predicting a bounding box and whether the bounding box center falls within it. Within this process, each grid cell forecasts a bounding box involving parameters such as x and y coordinates, the width and height, and the confidence. Furthermore, a class prediction is related to each cell. Eventually, the bounding boxes and the class probabilities map are combined into a final set of class labels and bounding boxes.
YOLOv3 predicts three bounding boxes at each grid cell on three output feature maps. A general rule is that each predicted box has one confidence variable represented by tc, four class variables (ti, i = 1, 2, 3, 4), and four coordinate variables (tx, ty, tw, th). All the predicted variables are transformed into the object’s confidence, the probability of each class, and the location to generate the predicted results Zhang et al. (2020). The object confidence C denotes the likelihood of a box containing an object, and this probability is computed using a sigmoid function, which is defined by the following equation.
Another meaningful task is the location prediction; YOLOv3 predicts the central coordinates of the bounding box, which is relative to the location of the grid cell in such a way that the center coordinates are between 0 and 1. Figure 4 shows that if the grid cell is offset from the upper-left corner of the image at (Cx, Cy), then the predicted bounding box has coordinates (bx, by).
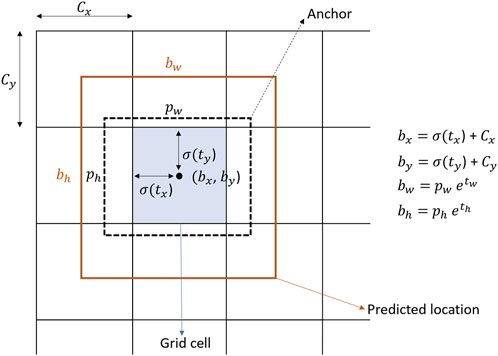
FIGURE 4. Bounding box, anchor, and location to the prediction box process.
The last fully connected layer of the model uses a softmax classifier to detect the object of interest, which, in this case, is corrosion damage in concrete structures. However, since this problem only detects corrosion damage, the output class corresponds to only one node. The softmax function transforms the output variables into a multi-class probability distribution, with each class corresponding to a different object category. Specifically, the model predicts the presence or absence of corrosion damage on reinforcing steel exposed to weathering by spalling damage or corrosion processes within the cementitious matrix.
In this study, the performance of the YOLOv3 model was evaluated utilizing established object classification metrics, including precision, recall, and F-score in all the stages, training, testing, and validation.
Precision is the ratio between the valid number of instances and the total retrieved instances, and it is determined by the following expression.
where TP and FP represent the true positive and the false positive numbers, respectively. Recall is related to the false negative FN and explain how many true predictions were established as false predictions; also, it is known as sensitivity, and its formulation is denoted by Eq. 3.
F-score aids to generalize the performance of a model with one metric. This metric uses precision and recall in a simple mathematical formulation. Its function is written as follows:
In addition to the aforementioned classification metrics, a detection indicator was applied to the model evaluation, Intersection over Union (IoU). The aim of the detection indicator is to evaluate how the YOLOv3 framework is performing the training and testing of corrosion images on concrete structures. The essence of the detection indicator can be summarized as follows; only the anchor with the highest value of the IoU with true prediction will be responsible for the object prediction. Mathematically, the IoU parameter is defined by
Thus, assessing Eq. 5, it is possible to notice that IoU is simply a ratio; therefore, Eq. 5 can be easily represented, as shown in Figure 5.
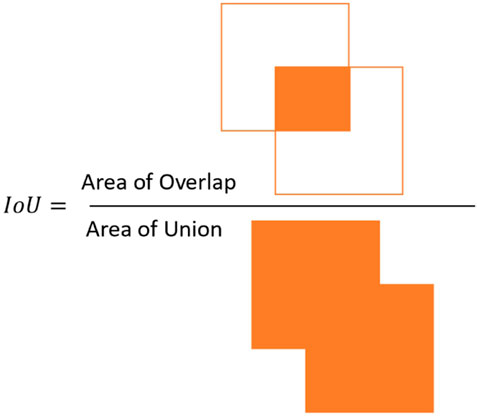
FIGURE 5. IoU representation.
Additionally, in the context of object detection metrics, we cannot avoid the implementation of important indicators such as average precision (AP), mean average precision (mAP), and the mean average precision 0.5 (mAP0.5). AP is a critical metric in object detection problems, and it is defined by the area under the precision–recall curve. The mAP is determined by averaging the AP overall classes or IoU thresholds. The parameter mAP0.5 is related to the mAP calculated for an IoU threshold of 50%, and the parameter mAP0.5:0.95 represents the average mAP calculated over IoU thresholds of 50%–95% in intervals of 5%.
Another aspect to be considered is that YOLOv3 uses the mean square error (MSE) loss function to train its neural network. It compares the predicted bounding box coordinates and class probabilities with the ground-truth annotations. The MSE loss function penalizes the network more severely for larger errors, which is desirable for object detection tasks where accurate bounding box predictions are crucial.
Using the MSE loss function in YOLOv3 also has the advantage of being computationally efficient, as it can be easily computed using vectorized operations. However, other object detection models may use different loss functions depending on the specific requirements of the task. The MSE is given by
where N is the number of samples, yi is the true value for sample i, and the
To address the insufficiency of an established image dataset about corrosion damage on concrete structures, this research provides a dataset of images built by the authors, CONCORNET2023. The image dataset contains 790 images, where each image denotes a particular concrete structure with some sign of corrosion damage.
The initial dataset was built using 159 images. However, the number of images was augmented introducing distortions in the initial dataset, achieving 790 images. It is possible to achieve CV tasks with a small dataset, but it can be more challenging compared to using a larger dataset. Training DL models for CV tasks requires a significant amount of labeled data to learn and generalize well. With a smaller dataset, the model may not be able to learn all the necessary features and patterns in the data, leading to overfitting or poor performance.
To overcome these challenges, there are several techniques that can be used to improve the performance of CV models with small datasets, such as data augmentation, transfer learning, and regularization. While these techniques can help improve the performance of models trained on small datasets, it is relevant to keep in mind that the model performance will ultimately be limited by the quality of the data available. Therefore, it is always recommended to collect as much high-quality data as possible to train robust and accurate CV models. For this study, data augmentation was implemented to address the small data issue.
All the images in CONCORNET2023 were captured using smartphones at different sites and places with random perspectives, angles, distances, and lighting conditions. These varieties or perturbations allow the generation of a robust model capable of detecting corrosion damage on concrete structures considering several circumstances. The image pixels range from 1,280 × 960 up to 12,400 × 12,400, i.e., the images contain different resolutions resulting in a challenging task for the model within the training stage at the moment of finding the minimal loss function value. Thus, the recognition of damaged elements in different conditions makes the model robust and flexible.
The input image size that YOLOv3 accepts by default is 416 × 416; however, it can also be trained and used with larger input sizes, such as 608 × 608 and 832 × 832. As described, the size of the images in CONCORNET2023 is bigger than the one established by YOLOv3. This can be addressed by setting the - -img parameter during the training process. For the case of interest of this article, this parameter was set as—img 832. It is worth mentioning that the input image size can be adjusted during training and inference using data augmentation and resizing techniques. This can improve the robustness and precision of the model for different input image sizes and aspect ratios. Figure 6 shows some representative photographs of the image dataset built and trained by the authors.
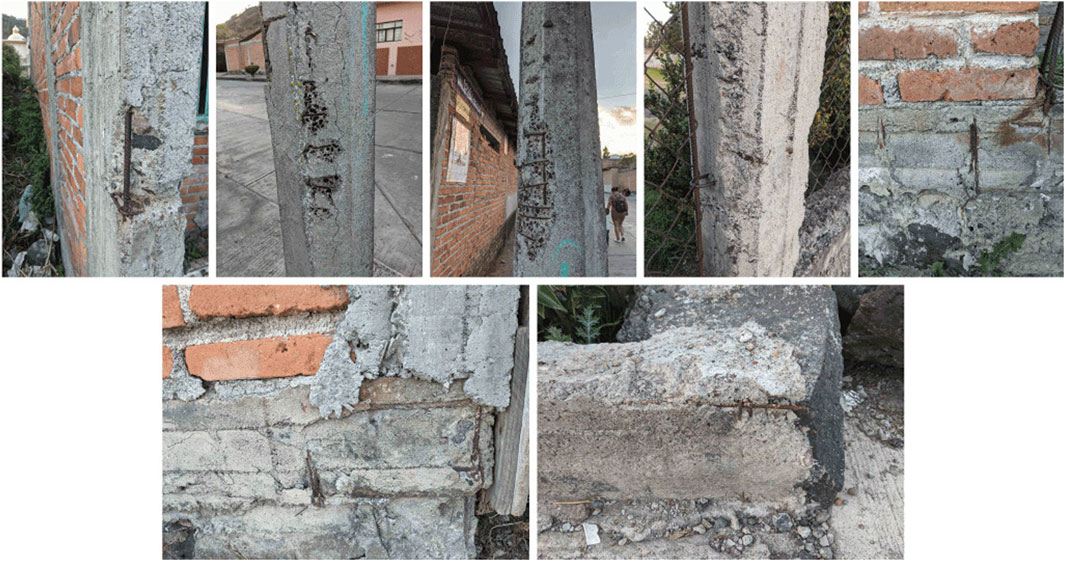
FIGURE 6. Representative images contained in CONCORNET2023.
The image collection is one of the most meaningful tasks in CV projects because the collected images will feed the model; therefore, they need to be correctly annotated or labeled. In this step, it is necessary to teach the model what is what (image labeling), and in consequence, the model learns to identify the object it has to detect. Undoubtedly, there are broadly open-access and non-open-access tools to perform the labeling image process. For this research, we used a traditional standard open-access method for labeling all the images, the LabelImg tool. This framework allows the user to visualize each image and manually generate a bounding box that delimits the object we want to identify in our detector. Figure 7 shows the LabelImg tool interface and the labeling process in some sample images.
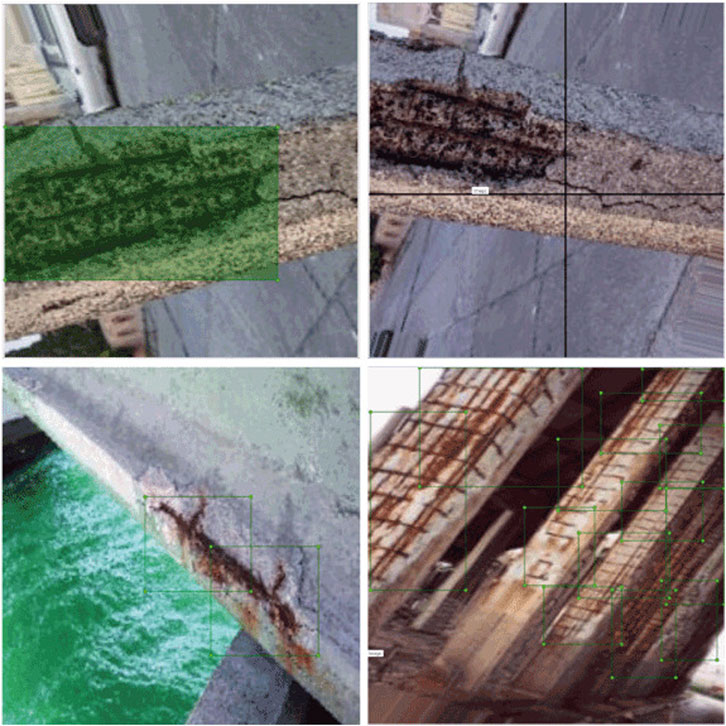
FIGURE 7. Labeling process of some representative images.
It is essential to generate reliable and robust models in the development processes of AI applications, and the availability of a great amount of data comes to aid in reaching this purpose. For this reason, it is necessary, in some cases, to consider increasing the image dataset, because the image conditions in the inference processes might differ from the considered conditions within the model training process. Therefore, it is crucial to add noise to the images to distort in unique forms the actual photographs and generate modified versions of theirs Elgendy (2020).
By introducing noise into the images, the model is trained and prepared to receive photographs with realistic and different conditions, which will feed the model to test its precision. These modifications include changes in light and brightness, object arrangement to be detected, different textures, offsets, angles, and rotations. Also, including distortion in the dataset helps increase the number of photographs.
The process of increasing the dataset is considered an efficient method of regularization and has become an indispensable step in the pipeline of CV problems to improve model performance. Figure 8 shows the effect of the introduction of noise in a sample image taken from the dataset built in this work. So, the parameters used to generate each modification in the data augmentation step are listed as follows:
• Channel shift = 15
• Horizontal flip = true
• Horizontal shift = 0.1
• Random rotation = 0.30
• Random zoom = [0.5, 1.0]
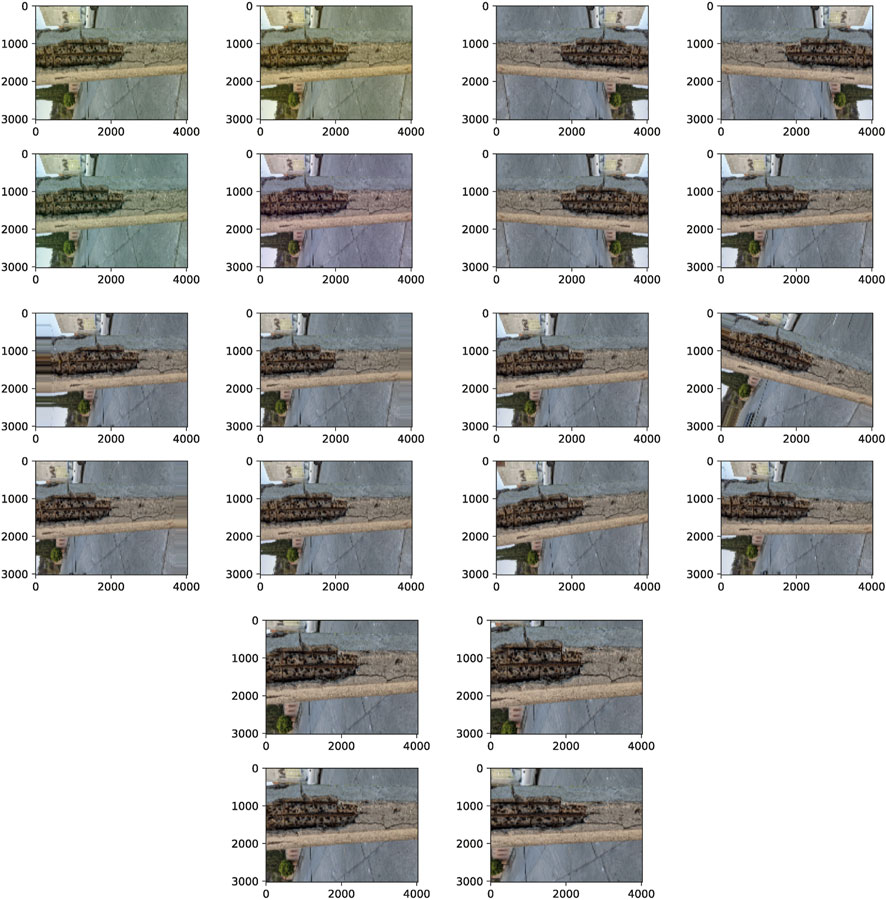
FIGURE 8. Data augmentation representation in a sample image with different distortions.
From Figure 8 and the parameter values used in each modification for augmenting image data listed previously, it is possible to remark that the introduced distortions in the images have a significant effect on them, and the model is trained using all of these perturbations.
The compilation processes were performed on a personal workstation with an Intel Core i7-8750H @ 2.20 GHz, 24 GB of random access memory, and an NVIDIA GTX 1050ti GPU with 4 GB of memory type GDDR5. The YOLOv3 framework used in this study is based on the Ultralytics YOLOv3 version, which is an open-source framework. The GPU-accelerated software environment is as follows: CUDA-11.5, cuDNN-7.6.5 matplotlib-3.2.2, numpy-1.18.5, opencv-python-4.1.2, Pillow-7.1.2, PyYAML-5.3.1, requests-2.23.0, scipy-1.4.1, torch-1.7.0, torchvision-0.8.1, tqdm-4.41.0, tensorboard-2.4.1, pandas-1.1.4, seaborn-0.11.0, and a wandb account.
It is crucial to highlight that to run the YOLOv3 framework satisfactorily, it is necessary to have a correct directories’ organization since the information that will be used (Images and labels) needs to be available according to the paths involved in the YOLOv3 framework.
YOLOv3 framework folder distribution includes a folder called data, which, in turn, contains different folders, of which, train, test, and val are of interest to us because these folders store the images that will be used as part of training, testing, and validation. Inside each folder previously mentioned, there are two folders, images and labels. The first one contains the photographs, whereas the folder named labels stores the corresponding text files of each one of the images stored in the images folder. Each text file must contain the coordinates of the location of the labeled object.
For the image distribution, the authors considered a standard split ratio of 80% for training, 10% for testing, and 10% for validation. Thus, 632 images were selected for training, and 79 images for testing and validation.
It is worth noting that all the images must be in a JPEG format. Otherwise, the model will generate an error in the compilation stage due to incompatibility with other formats. Within the root file of the YOLOv3 folder lie the scripts with which the model is executed. Without this correct organization, it will be impossible to run the model appropriately.
By training the YOLOv3 model, it is necessary to have in mind some hyperparameters that need to be tuned. By default, YOLOv3 proposes specific values for the different hyperparameters specified in the model and also offers various configurations for these hyperparameters. This configuration depends on the performance level that the user wants to obtain and the problem that will be addressed. By regular compilations, the documentation suggests using the hyp. scratch configuration, which presents the following settings.
• lr0: 0.01 ⇒ initial learning rate (SGD = 1E-2, Adam = 1E-3)
• lrf: 0.1 ⇒ final OneCycleLR learning rate (lr0 * lrf)
• momentum: 0.937 ⇒ SGD momentum/Adam beta1
• weight decay: 0.0005 ⇒ optimizer weight decay 5–4
• warmup epochs: 3.0 ⇒ warmup epochs (fractions ok)
• warmup momentum: 0.8 ⇒ warmup initial momentum
• warmup bias lr: 0.1 ⇒ warmup initial bias lr
• box: 0.05 ⇒ box loss gain
• cls: 0.5 ⇒ cls loss gain
• cls pw: 1.0 ⇒ cls BCELoss positive weight
• obj: 1.0 ⇒ obj loss gain (scale with pixels)
• obj pw: 1.0 ⇒ obj BCELoss positive weight
• iou t: 0.20 ⇒ IoU training threshold
• anchor t: 4.0 ⇒ anchor-multiple threshold
• fl gamma: 0.0 ⇒ focal loss gamma (efficientDet default gamma = 1.5)
• hsv h: 0.015 ⇒ image HSV-hue augmentation (fraction)
• hsv s: 0.7 ⇒ image HSV-saturation augmentation (fraction)
• hsv v: 0.4 ⇒ image HSV-value augmentation (fraction)
• degrees: 0.0 ⇒ image rotation ( ± deg)
• translate: 0.1 ⇒ image translation (± fraction)
• scale: 0.5 ⇒ image scale (± gain)
• shear: 0.0 ⇒ image shear (± deg)
• perspective: 0.0 ⇒ image perspective (± fraction), range 0–0.001
• flipud: 0.0 ⇒ image flip up–down (probability)
• fliplr: 0.5 ⇒ image flip left–right (probability)
• mosaic: 1.0 ⇒ image mosaic (probability)
• mixup: 0.0 ⇒ image mixup (probability)
• copy paste: 0.0 ⇒ segment copy paste (probability)
The training stage was carried out in two phases: the first one, following the default settings suggested by the framework, and the second one, adjusting the hyperparameters that were necessary for tuning. The first training stage was for observing how the model performed throughout the image dataset. However, the model performance through hundred iterations denoted the necessity of tuning hyperparameters such as the learning rate, the momentum, the patience, and the weight decay. All of them are hyperparameters that come in handy for overcoming overfitting problems.
Occasionally, using the default values of the YOLOv3 in the training stage works well. In most cases, this depends on the object intended to spot, remembering that hyperparameters proposed in the YOLOv3 framework were used for training the COCO dataset (a large-scale object detection, segmentation, and captioning dataset with several features) suggested by Microsoft Lin et al. (2014).
For the second stage of training, 30 hyperparameter combinations in the experiments were carried out to improve the model performance. The best proposal for the values of the hyperparameters that satisfactorily performed the task of detecting corrosion damage, at least for this work, is as follows:
• lr0: 0.0001 ⇒ initial learning rate (SGD = 1E-2, Adam = 1E-3)
• lrf: 0.01 ⇒ final OneCycleLR learning rate (lr0 * lrf)
• momentum: 0.937 ⇒ SGD momentum/Adam beta1
• weight decay: 0.005 ⇒ optimizer weight decay 5–4
• warmup epochs: 3.0 ⇒ warmup epochs (fractions ok)
• warmup momentum: 0.8 ⇒ warmup initial momentum
• warmup bias lr: 0.1 ⇒ warmup initial bias lr
• box: 0.05 ⇒ box loss gain
• cls: 0.5 ⇒ cls loss gain
• cls pw: 1.0 ⇒ cls BCELoss positive weight
• obj: 1.0 ⇒ obj loss gain (scale with pixels)
• obj pw: 1.0 ⇒ obj BCELoss positive weight
• iou t: 0.15 ⇒ IoU training threshold
• anchor t: 4.0 ⇒ anchor-multiple threshold
• fl gamma: 0.0 ⇒ focal loss gamma (efficientDet default gamma = 1.5)
• hsv h: 0.015 ⇒ image HSV-hue augmentation (fraction)
• hsv s: 0.7 ⇒ image HSV-saturation augmentation (fraction)
• hsv v: 0.4 ⇒ image HSV-value augmentation (fraction)
• degrees: 0.0 ⇒ image rotation (± deg)
• translate: 0.1 ⇒ image translation (± fraction)
• scale: 0.5 ⇒ image scale (± gain)
• shear: 0.0 ⇒ image shear (± deg)
• perspective: 0.0 ⇒ image perspective (± fraction), range 0–0.001
• flipud: 0.0 ⇒ image flip up–down (probability)
• fliplr: 0.5 ⇒ image flip left–right (probability)
• mosaic: 1.0 ⇒ image mosaic (probability)
• mixup: 0.07 ⇒ image mixup (probability)
• copy paste: 0.07 ⇒ segment copy paste (probability)
It is worth realizing that the previous configurations were implemented using the weights of the best epoch in the first stage of training, i.e., the use of partial transfer learning. The outcomes of the training stages will be discussed shortly in the next section. But for the moment, it is relevant to mention that the success of the training stage depends on many circumstances, such as the correct labeling process, the hyperparameter tuning during several experiments, and the robustness of the image dataset.
As previously mentioned, the training process was executed twice. The results of the first stage are presented in the following part, beginning with the box loss function and its corresponding box validation loss function in Figure 9. The figure demonstrates how the learning process occurred over 400 epochs.
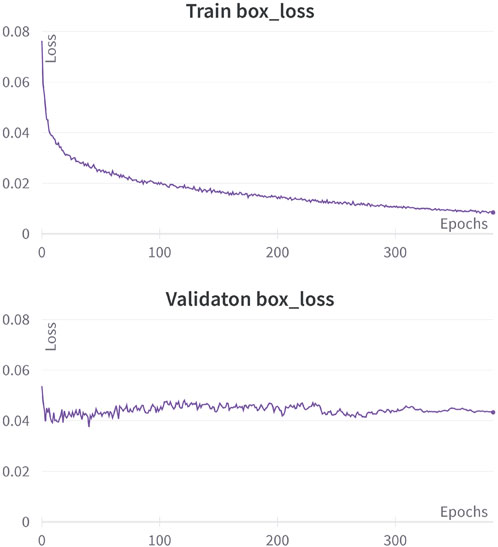
FIGURE 9. Training and validation performances in the box loss function during 400 epochs.
As depicted in Figure 9, the results from the initial training stage show a tangible overfitting problem during the first few epochs, with a noticeable divergence between the box loss function and the corresponding box validation loss function. It indicates that while the model is gaining knowledge during the training process, it is not reflecting this in the validation stage, thus leading to a performance gap between the two stages.
Similarly, Figure 10 also demonstrates an overfitting issue, with the training and validation graphs diverging as the training process proceeds. The primary goal of the training stage is to ensure a convergence between the training and validation performance or at least achieve equivalent performance, indicating that the model is capable of performing equally well in both training and validation instances.
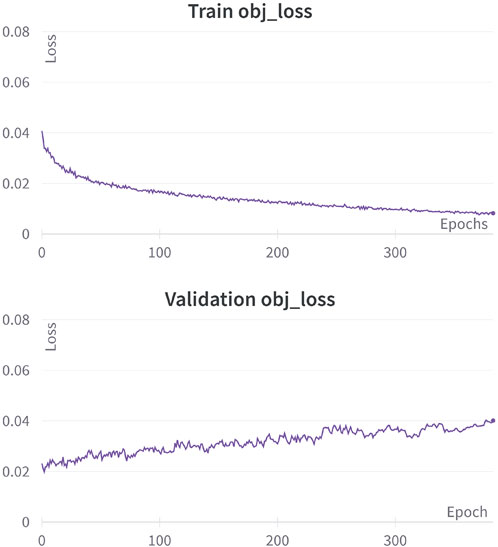
FIGURE 10. Training and validation performances in the object loss function during 31 epochs.
For YOLOv3, it is necessary to compute both loss functions, box and object. It is because the model calculates the loss for both elements since the first task is to detect the object in the photographs, and the second activity is to delimit it with a bounding box. The loss of the latter is compared with the size of the bounding box proposed in the labeled images.
In the second training stage, the overfitting problem was addressed to obtain an adequate performance in the validation set. This was possible due to the correct manipulation of the hyperparameters—denoted in the previous section—in the YOLOv3 framework. Both performances, training and validation, in box loss are depicted in Figure 11.
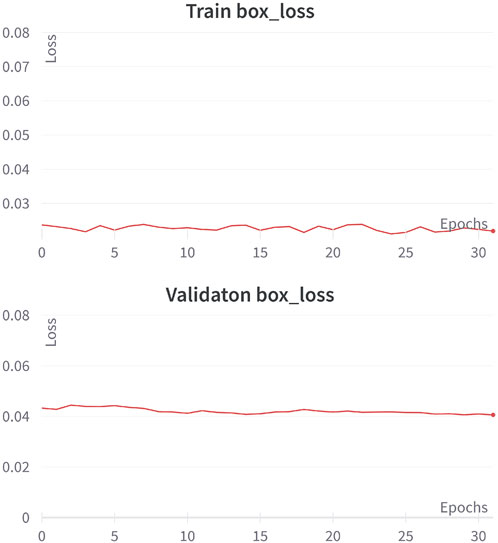
FIGURE 11. Training and validation performances in the box loss function during 31 epochs.
After adjusting the hyperparameters, the overfitting problem was successfully addressed, as can be observed in Figure 11, where the discrepancy between the training and validation loss values decreased to a negligible value of 0.01871 over 31 epochs. In the second training instance, a hyperparameter value of 20 was assigned to the patience parameter, which is a technique to mitigate overfitting. Specifically, the patience parameter monitors the validation loss and concludes the training process when the model fails to improve for a certain number of epochs (the patience value). As a result, the second training stage consisted of only 31 epochs.
Similar to the box element, the losses for the object were also computed and can be observed in Figure 12 for both the training and validation stages.
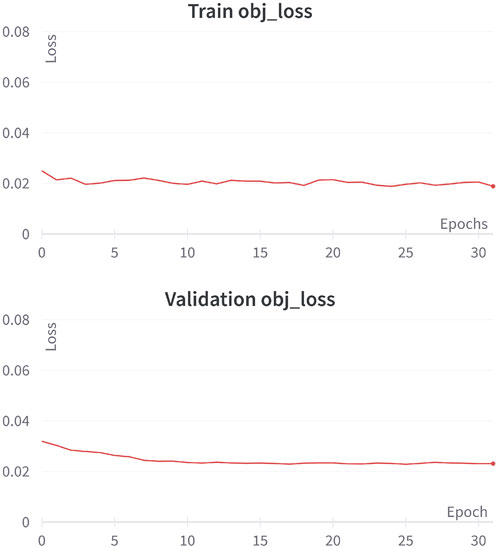
FIGURE 12. Training and validation performances in the object loss function during 31 epochs.
As demonstrated in the box element, and in the object element, there is no evidence of overfitting problems. The absence of overfitting problems can also be observed in the object element, with a minimal difference value of 0.00423 between the training and validation stages. The corresponding performance of both training stages is presented in Table 1, which includes the numerical values of other complementary metrics.
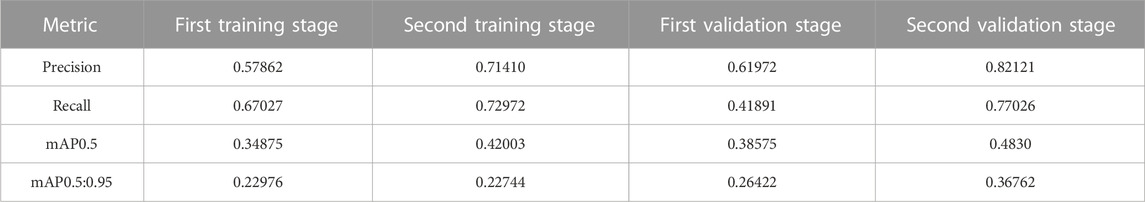
TABLE 1. Model performance for various metrics in both stages, first and second.
The results presented in Table 1 demonstrate the significance of hyperparameter tuning to achieve optimal model performance. The chosen hyperparameters successfully lead the model toward the correct prediction path, as evidenced by the low values of the loss functions. It is important to note that the model performance in terms of overall precision is 82.121%. The behavior of the hyperparameters is reflected in the accuracy of the detection objects, which will be presented shortly.
Real-time object detection systems are subject to variability, and their precision can be influenced by various factors. Nonetheless, it is a widely adopted practice to set the detection threshold at a minimum of 20% for real-time detection. Therefore, achieving a precision value of 82.121% is regarded as satisfactory.
Following the fine-tuning process, a robust detector for concrete-corrosion damage was successfully developed. Figure 13 reveals the capability of the built detector to identify areas that have been damaged by corrosion. All the photographs exhibit some level of corrosion damage, and the reinforcing steel is exposed to the natural environment. This type of corrosion damage is generally caused by spalling, which is a prevalent pathology in concrete with poor quality control and unsatisfactory designs.
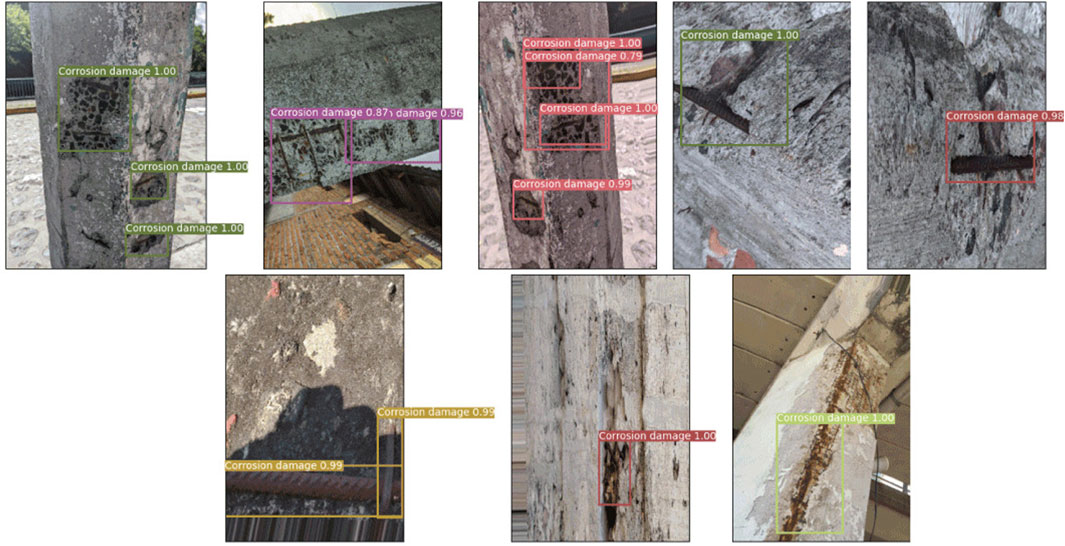
FIGURE 13. Corrosion damage localization on concrete structures using the built detector.
From the analysis of Figure 13, it is evident that the developed detector can effectively detect corrosion damage with high precision and confidence. The detected-element confidence levels are shown by the labels generated by the model, which consist of the term “corrosion damage” followed by a confidence value. The confidence value indicates the level of certainty with which the model identifies the element as a corroded area. A confidence value of 1.0 means that the model is 100% sure that the recognized object contains corrosion damage, and this trend is consistent across the other images.
In object detection with YOLO frameworks, it is common to observe confidence values that oscillate between 20% and 100%. This range is considered acceptable as detections are performed in real-time over dynamic or static elements, such as videos and images. Therefore, the confidence levels shown in Figure 13 are considered high and satisfactory.
The corrosion detector on concrete structures performs adequately by detecting the shape of steel bars, the coloration of corrosion (maroon, dark brown, and dark orange), and its combination with the gray color (the concrete color). However, the detector might fail in some object detection with corrosion merged with other elements or textures, as it is possible to notice in Figure 14.
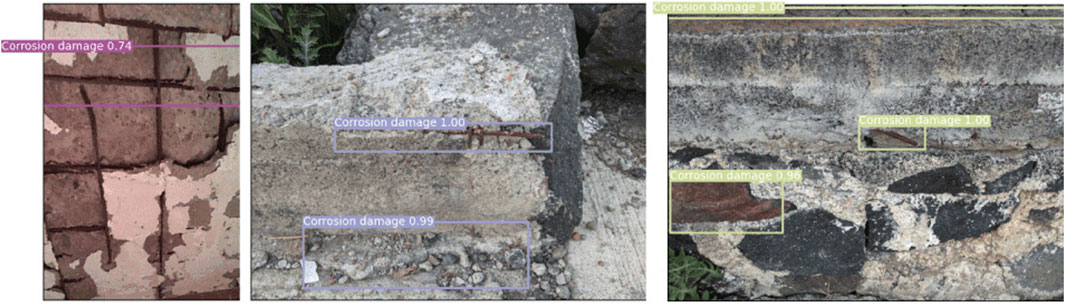
FIGURE 14. False positives and no satisfactory detection on concrete structures.
The precision of the YOLOv3 model for object detection can be affected by many factors, which are as follows:
• Training dataset size. The model precision improves with the size of the training dataset. Larger datasets provide more examples for the model to learn from.
• Hyperparameter selection. Hyperparameters, such as the learning rate, batch size, and anchor boxes, can affect the training process and the precision of the final model.
• Image quality. The quality of the input images, such as lighting conditions and image resolution, can affect the model’s ability to detect objects accurately.
• Choice of architecture. The YOLOv3 model architecture, such as the number of layers and the size of the input image, can affect the ability of the model to detect objects of different sizes and shapes.
The limitations of the model developed in this study can be mitigated through several measures. One possible solution is to increase the size of the dataset used to train the model. This approach would provide the model with a more diverse dataset and allow it to learn more robust features to detect corrosion in concrete structures.
Additionally, using a newer version of YOLO that can handle higher-resolution inputs might also improve the model’s accuracy. It will allow the model to capture finer details and enhance its ability to distinguish between corrosion and other textures or elements. These improvements will be addressed in future work to enhance the accuracy and robustness of the model.
Figure 14 highlights some limitations of the model trained in this work. In the first photograph, although there is corrosion damage in almost all of the area, the model only detects a specific spot. It could be because the corrosion is merged with white elements, which were not common in the training set. It indicates the necessity of more diverse data to train the model. In the second photograph, the model fails on the delimitation at the lower box. It detects a small corroded bar, but the bounding box is too large for the detected element. In the third photograph, the model fails to detect two objects: the top one is a steel mesh that simulates a mesh of reinforcing steel on a concrete element, and the bottom one is a rock with a color similar to the corroded bar. It is crucial to mention that even the human eye may find the third photograph challenging. However, in general terms, the model performs well on various concrete structures, as shown in Figure 13.
Nowadays, technological innovations are being applied to various fields of science. However, some crucial areas of national development still have not fully benefited from these innovations.
This research provides an image dataset that contains presentations of corrosion damage on concrete structures. The dataset is used to train a state-of-the-art framework called YOLOv3, which can detect corrosion damage on concrete structures. The framework hyperparameters were modified through several experiments to achieve the best performance of the model.
It is crucial to highlight that the images need to be cleaned and filtered to achieve a homogeneous distribution in the dataset used to train the model. Although the data distribution was heterogeneous (with different scales, varying capture devices, and sizes) in this work, the adjustment of the hyperparameters was useful for reducing and avoiding overfitting problems.
The results provided by the model with their respective modifications show that it is possible to spot the damage corrosion on concrete structures accurately. However, to build a more robust model, it is suggested to build a larger dataset (a task that will be addressed in future work).
Today, detecting corrosion tasks on concrete structures using mobile devices is a real challenge because the corrosion problem presents a wide range of features to be considered. These features include different color levels of the corrosion process, the correct detection of the spalling problem, coloration of the concrete that has stored corroded steel, accommodating patterns of the reinforced steel, the reinforced steel exposed over different surfaces, impregnated dust over the steel (which is common in concrete structures), and many others.
The corrosion damage problem on concrete structures is a topic that needs to be taken seriously by governments because it affects the infrastructure durability, increases maintenance costs, denotes a lack of correct designs, and indicates poor construction processes. Therefore, the advancements in the detection of corrosion on concrete structures made in this research are significant and relevant because they demonstrate that detecting corroded bars on concrete is achievable.
Next, the authors conclude with a list of the main findings in this research:
• The authors provide an image dataset for detecting corrosion damage on concrete structures using the YOLOv3 framework.
• Frameworks such as YOLOv3 are able to detect objects in different scenarios. However, the training process of a custom dataset requires a deeper analysis.
• Generally, when the model is trained as is (using the YOLO weights by default), the model suffers overfitting problems.
• The acquisition of the images for labeling and training the dataset must be in approximately the same conditions as possible.
• An exhaustive hyperparameter fine-tuning might lead to the best performance of the model.
• The advancements in the detection of corrosion on concrete structures made in this research contribute to the state-of-the-art for addressing this problem.
The datasets presented in this study can be found in online repositories. The names of the repository/repositories and accession number(s) can be found at: https://github.com/JaGuzmanT/CONCORNET2023, CONCORNET2023 repository, Public access.
All authors listed have made a substantial, direct, and intellectual contribution to the work and approved it for publication.
Universidad Michoacana de San Nicolás de Hidalgo and CONACYT provided funds for open-access publication fees, and the International Center for Numerical Methods in Engineering provided technical and academic support.
The authors thank AULA CIMNE-Morelia, CIC UMSNH, and CONACYT for their support for this research. Additionally, the authors would like to extend their appreciation to the reviewers for their insightful feedback and suggestions, which have significantly improved the quality of this manuscript.
The authors declare that the research was conducted in the absence of any commercial or financial relationships that could be construed as a potential conflict of interest.
All claims expressed in this article are solely those of the authors and do not necessarily represent those of their affiliated organizations, or those of the publisher, the editors, and the reviewers. Any product that may be evaluated in this article, or claim that may be made by its manufacturer, is not guaranteed or endorsed by the publisher.
Bang, S., Park, S., Kim, H., and Kim, H. (2019). Encoder–decoder network for pixel-level road crack detection in black-box images. Computer-Aided Civ. Infrastructure Eng. 34, 713–727. doi:10.1111/mice.12440
Behnood, A., Behnood, V., Gharehveran, M. M., and Alyamac, K. E. (2017). Prediction of the compressive strength of normal and high-performance concretes using m5p model tree algorithm. Constr. Build. Mater. 142, 199–207. doi:10.1016/j.conbuildmat.2017.03.061
Belyakov, N., Smirnova, O., Alekseev, A., and Tan, H. (2021). Numerical simulation of the mechanical behavior of fiber-reinforced cement composites subjected dynamic loading. Appl. Sci. 11, 1112. doi:10.3390/app11031112
Borges, P. C., Castillo, R. M., Carpio, J., Genescá, J., Helene, P. R., López, W., et al. (1998). Corrosión en estructuras de concreto armado: Teoria, inspección, diagnóstico, vida útil y reparaciones. Mexico: IMCYC.
Breysse, D., Romão, X., Gonçalves, A., Alwash, M., Balayssac, J. P., Biondi, S., et al. (2021). “How investigators can answer more complex questions about assess concrete strength and lessons to draw from a benchmark,” in Non-destructive in situ strength assessment of concrete (Springer), 219–277.
Bui, D. K., Nguyen, T., Chou, J. S., Nguyen-Xuan, H., and Ngo, T. D. (2018). A modified firefly algorithm-artificial neural network expert system for predicting compressive and tensile strength of high-performance concrete. Constr. Build. Mater. 180, 320–333. doi:10.1016/j.conbuildmat.2018.05.201
Bungey, J. H., and Grantham, M. G. (2006). Testing of concrete in structures. London: CRC Press. doi:10.1201/978148226468
Cakiroglu, C., Islam, K., Bekdaş, G., Isikdag, U., and Mangalathu, S. (2022). Explainable machine learning models for predicting the axial compression capacity of concrete filled steel tubular columns. Constr. Build. Mater. 356, 129227. doi:10.1016/j.conbuildmat.2022.129227
Castañeda-Valdéz, A., and Rodriguez-Rodriguez, M. (2014). Las pérdidas económicas causadas por el fenómeno de la corrosión atmosférica del acero de refuerzo embebido en el hormigón armado. Rev. CENIC. Ciencias Quím. 45, 52–59.
Cha, Y. J., Choi, W., and Büyüköztürk, O. (2017). Deep learning-based crack damage detection using convolutional neural networks. Computer-Aided Civ. Infrastructure Eng. 32, 361–378. doi:10.1111/mice.12263
Cha, Y. J., Choi, W., Suh, G., Mahmoudkhani, S., and Büyüköztürk, O. (2018). Autonomous structural visual inspection using region-based deep learning for detecting multiple damage types. Computer-Aided Civ. Infrastructure Eng. 33, 731–747. doi:10.1111/mice.12334
Chen, H., Lin, H., and Yao, M. (2019). Improving the efficiency of encoder-decoder architecture for pixel-level crack detection. IEEE Access 7, 186657–186670. doi:10.1109/access.2019.2961375
Choi, W., and Cha, Y. J. (2019). Sddnet: Real-time crack segmentation. IEEE Trans. Industrial Electron. 67, 8016–8025. doi:10.1109/tie.2019.2945265
Dais, D., Bal, I. E., Smyrou, E., and Sarhosis, V. (2021). Automatic crack classification and segmentation on masonry surfaces using convolutional neural networks and transfer learning. Automation Constr. 125, 103606. doi:10.1016/j.autcon.2021.103606
del Valle Moreno, A., Perez Lopez, T., and Martinez Madrid, M. (2001). El fenómeno de la corrosión en estructuras de concreto reforzado. Mexico: Instituto Mexicano del Transporte.
Deng, F., He, Y., Zhou, S., Yu, Y., Cheng, H., and Wu, X. (2018). Compressive strength prediction of recycled concrete based on deep learning. Constr. Build. Mater. 175, 562–569. doi:10.1016/j.conbuildmat.2018.04.169
Deng, J., Dong, W., Socher, R., Li, L. J., Li, K., and Fei-Fei, L. (2009). “Imagenet: A large-scale hierarchical image database,” in 2009 IEEE conference on computer vision and pattern recognition, Miami, FL, USA, 20-25 June 2009 (IEEE), 248–255.
Dorafshan, S., Thomas, R. J., and Maguire, M. (2018). Comparison of deep convolutional neural networks and edge detectors for image-based crack detection in concrete. Constr. Build. Mater. 186, 1031–1045. doi:10.1016/j.conbuildmat.2018.08.011
Dung, C. V., and Anh, L. D. (2019). Autonomous concrete crack detection using deep fully convolutional neural network. Automation Constr. 99, 52–58. doi:10.1016/j.autcon.2018.11.028
Feng, C., Zhang, H., Wang, S., Li, Y., Wang, H., and Yan, F. (2019). Structural damage detection using deep convolutional neural network and transfer learning. KSCE J. Civ. Eng. 23, 4493–4502. doi:10.1007/s12205-019-0437-z
Fu, C. Y., Liu, W., Ranga, A., Tyagi, A., and Berg, A. C. (2017). Dssd: Deconvolutional single shot detector. arXiv preprint arXiv:1701.06659.
Gopalakrishnan, K., Khaitan, S. K., Choudhary, A., and Agrawal, A. (2017). Deep convolutional neural networks with transfer learning for computer vision-based data-driven pavement distress detection. Constr. Build. Mater. 157, 322–330. doi:10.1016/j.conbuildmat.2017.09.110
Guzmán-Torres, J. A., Domínguez-Mota, F. J., and Alonso-Guzmán, E. M. (2021b). A multi-layer approach to classify the risk of corrosion in concrete specimens that contain different additives. Case Stud. Constr. Mater. 15, e00719. doi:10.1016/j.cscm.2021.e00719
Guzmán-Torres, J. A., Domínguez-Mota, F. J., and Alonso-Guzmán, E. M. (2021a). “Estimating the flexural strength of concrete using compressive strength as input value in a deep learning model,” in IOP conference series: Materials science and engineering (Elsevier), 012019.
Guzmán-Torres, J. A., Domínguez-Mota, F. J., Alonso-Guzmán, E. M., Martínez-Molina, W., and Ruiz, G. T. (2021c). A review of concrete performance employing a starch as addition using several regression techniques. Adv. Mater. Res. 1160, 1–14. doi:10.4028/www.scientific.net/amr.1160.1
Guzmán-Torres, J. A., Domínguez-Mota, F. J., Tinoco-Guerrero, G., Alonso-Guzmán, E. M., and Martínez-Molina, W. (2021d). Predicting the compressive strength based in ndt using deep learning. Spec. Publ. 350, 90–102.
Guzmán-Torres, J. A. (2022). Estimation of durability benchmark on concrete samples using artificial intelligence. Adv. Mater. Res. (Trans Tech Publ) 1168, 75–91. doi:10.4028/www.scientific.net/amr.1168.75
Guzmán-Torres, J. A., Naser, M., and Domínguez-Mota, F. J. (2022b). Effective medium crack classification on laboratory concrete specimens via competitive machine learning. Structures 37, 858–870. doi:10.1016/j.istruc.2022.01.061
Guzmán-Torres, J. A., Zalapa-Damian, A., Domínguez-Mota, F. J., and Alonso-Guzmán, E. M. (2021e). Data science and machine learning technique for predicting electrical resistivity in recycled concrete with nopal as addition. Adv. Eng. Forum 40, 43–62. doi:10.4028/www.scientific.net/AEF.40.43
Guzmán-Torres, J., Domínguez-Mota, F., Alonso-Guzmán, E., and Martínez-Molina, W. (2022a). Modeling tensile strength of concrete using support vector regression. Mater. J. 119, 25–37.
He, K., Zhang, X., Ren, S., and Sun, J. (2016). “Deep residual learning for image recognition,” in Proceedings of the IEEE conference on computer vision and pattern recognition, Las Vegas, NV, USA, 27-30 June 2016 (IEEE), 770–778.
Hemmatian, A., Jalali, M., Naderpour, H., and Nehdi, M. L. (2023). Machine learning prediction of fiber pull-out and bond-slip in fiber-reinforced cementitious composites. J. Build. Eng. 63, 105474. doi:10.1016/j.jobe.2022.105474
Herrera, J. A. M., Rivera, J. L. V., Méndez, R. V., and Borges, P. C. (2022). Comportamiento a flexión de vigas de concreto reforzado con parámetros electroquímicos asociados con un nivel de corrosión alto. Rev. ALCONPAT 12, 422–432. doi:10.21041/ra.v12i3.630
Ioffe, S., and Szegedy, C. (2015). “Batch normalization: Accelerating deep network training by reducing internal covariate shift,” in International conference on machine learning (Mountain view CA: PMLR), 448–456.
Jenkins, M. D., Carr, T. A., Iglesias, M. I., Buggy, T., and Morison, G. (2018). “A deep convolutional neural network for semantic pixel-wise segmentation of road and pavement surface cracks,” in 2018 26th European signal processing conference (EUSIPCO) (IEEE), 2120–2124.
Kang, D., Benipal, S. S., Gopal, D. L., and Cha, Y. J. (2020). Hybrid pixel-level concrete crack segmentation and quantification across complex backgrounds using deep learning. Automation Constr. 118, 103291. doi:10.1016/j.autcon.2020.103291
Kessler, R., Powers, R., and Lasa, I. (1997). “Cathodic protection using zinc sheet anodes and an ion conductive gel adhesive,” in Corrosion97 (New Orleans: NACE).
König, J., Jenkins, M. D., Barrie, P., Mannion, M., and Morison, G. (2019). “A convolutional neural network for pavement surface crack segmentation using residual connections and attention gating,” in 2019 IEEE International Conference on Image Processing (ICIP), Taipei, Taiwan, 26 August 2019 (IEEE), 1460–1464.
Li, S., Zhao, X., and Zhou, G. (2019). Automatic pixel-level multiple damage detection of concrete structure using fully convolutional network. Computer-Aided Civ. Infrastructure Eng. 34, 616–634. doi:10.1111/mice.12433
Li, Y., Li, H., and Wang, H. (2018). Pixel-wise crack detection using deep local pattern predictor for robot application. Sensors 18, 3042. doi:10.3390/s18093042
Lin, T. Y., Goyal, P., Girshick, R., He, K., and Dollár, P. (2017). “Focal loss for dense object detection,” in Proceedings of the IEEE international conference on computer vision (Venice, Italy: IEEE Xplore), 2980–2988.
Lin, T. Y., Maire, M., Belongie, S., Hays, J., Perona, P., Ramanan, D., et al. (2014). “Microsoft coco: Common objects in context,” in European conference on computer vision (Zurich, Switzerland: Springer), 740–755.
Liu, Y., Yao, J., Lu, X., Xie, R., and Li, L. (2019a). Deepcrack: A deep hierarchical feature learning architecture for crack segmentation. Neurocomputing 338, 139–153. doi:10.1016/j.neucom.2019.01.036
Liu, Z., Cao, Y., Wang, Y., and Wang, W. (2019b). Computer vision-based concrete crack detection using u-net fully convolutional networks. Automation Constr. 104, 129–139. doi:10.1016/j.autcon.2019.04.005
Maas, A. L., Hannun, A. Y., Ng, A. Y., et al. (2013). Rectifier nonlinearities improve neural network acoustic models. Proc. icml (Citeseer) 30, 3.
Martinez-Molina, W., Chavez-Garcia, H. L., Perez-Lopez, T., Alonso-Guzman, E. M., Arreola-Sanchez, M., Navarrete-Seras, M. A., et al. (2021). Effect of the addition of agribusiness and industrial wastes as a partial substitution of portland cement for the carbonation of mortars. Materials 14, 7276. doi:10.3390/ma14237276
Mei, Q., Gül, M., and Azim, M. R. (2020). Densely connected deep neural network considering connectivity of pixels for automatic crack detection. Automation Constr. 110, 103018. doi:10.1016/j.autcon.2019.103018
Naderpour, H., Rafiean, A. H., and Fakharian, P. (2018). Compressive strength prediction of environmentally friendly concrete using artificial neural networks. J. Build. Eng. 16, 213–219. doi:10.1016/j.jobe.2018.01.007
Naser, M. (2021a). An engineer’s guide to explainable artificial intelligence and interpretable machine learning: Navigating causality, forced goodness, and the false perception of inference. Automation Constr. 129, 103821. doi:10.1016/j.autcon.2021.103821
Naser, M., and Kodur, V. (2022). Explainable machine learning using real, synthetic and augmented fire tests to predict fire resistance and spalling of rc columns. Eng. Struct. 253, 113824. doi:10.1016/j.engstruct.2021.113824
Naser, M. (2023). Machine learning for all! benchmarking automated, explainable, and coding-free platforms on civil and environmental engineering problems. J. Infrastructure Intell. Resil. 2, 100028. doi:10.1016/j.iintel.2023.100028
Naser, M. (2021b). Mechanistically informed machine learning and artificial intelligence in fire engineering and sciences. Fire Technol. 57, 2741–2784. doi:10.1007/s10694-020-01069-8
O’Shea, K., and Nash, R. (2015). An introduction to convolutional neural networks. arXiv preprint arXiv:1511.08458.
Ranjbar, S., Nejad, F. M., and Zakeri, H. (2021). An image-based system for pavement crack evaluation using transfer learning and wavelet transform. Int. J. Pavement Res. Technol. 14, 437–449. doi:10.1007/s42947-020-0098-9
Redmon, J., Divvala, S., Girshick, R., and Farhadi, A. (2016). “You only look once: Unified, real-time object detection,” in Proceedings of the IEEE conference on computer vision and pattern recognition (Las vegas: IEEE xplore), 779–788.
Redmon, J., and Farhadi, A. (2017). “Yolo9000: Better, faster, stronger,” in Proceedings of the IEEE conference on computer vision and pattern recognition (Honolulu, Hawaii: IEEE xplore).
Redmon, J., and Farhadi, A. (1804). Yolov3: An incremental improvement. arXiv preprint arXiv:1804.02767.
Silva, W. R. L. d., and Lucena, D. S. d. (2018). Concrete cracks detection based on deep learning image classification. Proceedings 2, 489. doi:10.3390/ICEM18-05387
Smirnova, O., Kazanskaya, L., Koplík, J., Tan, H., and Gu, X. (2020). Concrete based on clinker-free cement: Selecting the functional unit for environmental assessment. Sustainability 13, 135. doi:10.3390/su13010135
Solhmirzaei, R., Salehi, H., Kodur, V., and Naser, M. (2020). Machine learning framework for predicting failure mode and shear capacity of ultra high performance concrete beams. Eng. Struct. 224, 111221. doi:10.1016/j.engstruct.2020.111221
Sun, Z., Feng, D. C., Mangalathu, S., Wang, W. J., and Su, D. (2022). Effectiveness assessment of tmds in bridges under strong winds incorporating machine-learning techniques. J. Perform. Constr. Facil. 36, 04022036. doi:10.1061/(asce)cf.1943-5509.0001746
Tabernik, D., Šela, S., Skvarč, J., and Skočaj, D. (2020). Segmentation-based deep-learning approach for surface-defect detection. J. Intelligent Manuf. 31, 759–776. doi:10.1007/s10845-019-01476-x
Tahwia, A. M., Heniegal, A., Elgamal, M. S., and Tayeh, B. A. (2021). The prediction of compressive strength and non-destructive tests of sustainable concrete by using artificial neural networks. Comput. Concr. 27, 21–28.
Tayeh, B. A., Hakamy, A., Amin, M., Zeyad, A. M., and Agwa, I. S. (2022). Effect of air agent on mechanical properties and microstructure of lightweight geopolymer concrete under high temperature. Case Stud. Constr. Mater. 16, e00951. doi:10.1016/j.cscm.2022.e00951
Torres, J. A. G., Mota, F. J. D., Alonso-Guzmán, E. M., Martínez-Molina, W., Ruiz, J. G. T., Chavez-Garcia, H. L., et al. (2020). Prediction of the tensile strength and electrical resistivity of concrete with organic polymer and their influence on carbonation using data science and a machine learning technique. Key Eng. Mater. 862, 72–77. doi:10.4028/www.scientific.net/kem.862.72
Wu, H., Zhong, B., Li, H., Love, P., Pan, X., and Zhao, N. (2021). Combining computer vision with semantic reasoning for on-site safety management in construction. J. Build. Eng. 42, 103036. doi:10.1016/j.jobe.2021.103036
Yakovlev, G., Polyanskikh, I., Belykh, V., Stepanov, V., and Smirnova, O. (2021). Evaluation of changes in structure of modified cement composite using fractal analysis. Appl. Sci. 11, 4139. doi:10.3390/app11094139
Yang, Q., Shi, W., Chen, J., and Lin, W. (2020). Deep convolution neural network-based transfer learning method for civil infrastructure crack detection. Automation Constr. 116, 103199. doi:10.1016/j.autcon.2020.103199
Yaseen, Z. M., Deo, R. C., Hilal, A., Abd, A. M., Bueno, L. C., Salcedo-Sanz, S., et al. (2018). Predicting compressive strength of lightweight foamed concrete using extreme learning machine model. Adv. Eng. Softw. 115, 112–125. doi:10.1016/j.advengsoft.2017.09.004
Zeyad, A. M., Magbool, H. M., Tayeh, B. A., de Azevedo, A. R. G., Abutaleb, A., and Hussain, Q. (2022). Production of geopolymer concrete by utilizing volcanic pumice dust. Case Stud. Constr. Mater. 16, e00802. doi:10.1016/j.cscm.2021.e00802
Zhang, A., Wang, K. C., Fei, Y., Liu, Y., Tao, S., Chen, C., et al. (2018). Deep learning–based fully automated pavement crack detection on 3d asphalt surfaces with an improved cracknet. J. Comput. Civ. Eng. 32, 04018041. doi:10.1061/(asce)cp.1943-5487.0000775
Zhang, C., Chang, C. C., and Jamshidi, M. (2020). Concrete bridge surface damage detection using a single-stage detector. Computer-Aided Civ. Infrastructure Eng. 35, 389–409. doi:10.1111/mice.12500
Zhang, J., Lu, C., Wang, J., Wang, L., and Yue, X. G. (2019). Concrete cracks detection based on fcn with dilated convolution. Appl. Sci. 9, 2686. doi:10.3390/app9132686
Keywords: artificial intelligence, civil engineering, corrosion damage detection, machine learning, YOLOv3
Citation: Guzmán-Torres JA, Domínguez-Mota FJ, Martínez-Molina W, Naser MZ, Tinoco-Guerrero G and Tinoco-Ruíz JG (2023) Damage detection on steel-reinforced concrete produced by corrosion via YOLOv3: A detailed guide. Front. Built Environ. 9:1144606. doi: 10.3389/fbuil.2023.1144606
Received: 14 January 2023; Accepted: 24 February 2023;
Published: 15 March 2023.
Edited by:
Tadesse Gemeda Wakjira, Okanagan Campus, CanadaReviewed by:
Muntasir Billah, University of Calgary, CanadaCopyright © 2023 Guzmán-Torres, Domínguez-Mota, Martínez-Molina, Naser, Tinoco-Guerrero and Tinoco-Ruíz. This is an open-access article distributed under the terms of the Creative Commons Attribution License (CC BY). The use, distribution or reproduction in other forums is permitted, provided the original author(s) and the copyright owner(s) are credited and that the original publication in this journal is cited, in accordance with accepted academic practice. No use, distribution or reproduction is permitted which does not comply with these terms.
*Correspondence: J. A. Guzmán-Torres, am9zZS5hbGJlcnRvLmd1em1hbkB1bWljaC5teA==
†These authors share first authorship
‡These authors have contributed equally to this work and share last authorship
Disclaimer: All claims expressed in this article are solely those of the authors and do not necessarily represent those of their affiliated organizations, or those of the publisher, the editors and the reviewers. Any product that may be evaluated in this article or claim that may be made by its manufacturer is not guaranteed or endorsed by the publisher.
Research integrity at Frontiers
Learn more about the work of our research integrity team to safeguard the quality of each article we publish.