
95% of researchers rate our articles as excellent or good
Learn more about the work of our research integrity team to safeguard the quality of each article we publish.
Find out more
METHODS article
Front. Built Environ. , 08 February 2023
Sec. Indoor Environment
Volume 9 - 2023 | https://doi.org/10.3389/fbuil.2023.1117992
This article is part of the Research Topic Global Excellence in Indoor Environment: 'North America' View all 4 articles
 Jovan Pantelic1*
 Sara Aristizabal1,2Qingyang Liu1Araliya Senerat1,3Young Joo Son1
 Kunjoon Byun1Linhao Li1
 Aidan Mullan4
 Rongpeng Zhang1,5
 Bruce D. Johnson6
 Nicholas Clements1,7
Air pollution makes an impact on cardio-pulmonary health. Since people spend over 90% of their time indoors, exposures to the indoor environment make the most significant impact on health. Among indoor sources, cooking emits the most particles that disperse through the residential indoor environment and expose occupants. We use fully controlled simulated residential modules to conduct exposure experiments. In the pilot study, participants stayed in modules for 1 week, and in the main study, 14 participants will stay in the module for 4 weeks. One module is operated as a classical US house air supply recommendation. The second module has an advanced control system that, alongside the standard air supply, activates air quality interventions: stove hood, portable air cleaners, bathroom exhaust and air flush (increasing air supply ∼3 times) as a function of the PM2.5 levels in the space. Environmental sensors based on Internet of Things technology simultaneously monitored Particulate Matter (PM2.5), CO2, Total Volatile Organic Compounds Relative Humidity and air temperature in all spaces and operated air quality interventions. Participant’s scheduled activities include morning and evening tasks, Monday through Friday. Participants may leave the module during the day. They will be asked to cook breakfast and dinner using lab-provided recipes. We measured each participant’s blood pressure, heart rate, and heart rate variability. Blood and urine samples were collected 3 times per participant in the pilot and will be collected 2 times a week in the main study. Up to 20 ml of blood and a minimum of 30 ml of urine will be sampled per collection. Analysis of blood and urine was performed for 8-hydroxy-2-deoxyguanosine (8-OHdG, urine), von Willebrand Factor (vWF, blood plasma), high sensitivity C-Reactive Protein (hsCRP, blood serum), Interleukin-6 (blood plasma), CD11b (blood), Fibrinogen (blood plasma), and Myeloperoxidase (blood serum). We conducted a Pilot for 2 weeks with 3 participants to test the study protocol and data collection. We adjusted the protocol for the main study based on the pilot results. Results showed that the proposed study protocol could be completed, and the methodology adopted in this study will provide valuable insights into the relationship between exposure to cooking particles and occupants' health.
Trial registration: Mayo Clinic IRB 20-007908.
Exposure to air pollutants (e.g., nanoparticles, PM2.5, O3, and NO2) significantly impacts public health (Burnett et al., 2018). Characterizing personal exposure is critical to understand the impact of air pollution on human health (Steinle et al., 2013; Tran et al., 2021). During the day, a person can be exposed to air pollution in the residential setting (Assimakopoulos et al., 2018; Tran et al., 2021), at the workplace (Saraga et al., 2014), during the commute (Karanasiou et al., 2014; Good et al., 2016), walking (Li et al., 2020) and in other indoor and outdoor environments (Levy et al., 2002). Personal exposure can be assessed with stationary environmental sensors on urban and building scale (Pantelic et al., 2022), but available air pollution level information might be far away from the actual exposure location (Pantelic et al., 2022). Personal air pollution exposures can be more accurately measured using portable air quality monitoring devices (Meng et al., 2009; de Kluizenaar et al., 2017; Sagona et al., 2018; Koehler et al., 2019), but personal monitors are relatively bulky and noisy; therefore, considering some of their limitations, this type of measurement is not feasible over long periods (Steinle et al., 2013). To overcome some of the urban scale challenges, studies have included Global Positioning System (GPS) information in the exposure analysis (Ma et al., 2019), either combining GPS information with ambient air pollution measurements or with personal air pollution monitoring devices.
Considering the urban population spends about 90% of their lives indoors (Klepeis et al., 2001), most air pollution exposure occurs inside the built environment (Hodas et al., 2016; Li Z. et al., 2017). The predominant sources of indoor air pollution in residences include building materials and volatile consumer products (e.g., cleaning products, scent diffusers) (TVOCs) (Derbez et al., 2018); ambient air brought in from outside (Qing et al., 2005; Xie and Zhao, 2018); occupant activities such as cooking (Wang et al., 2017; Chen et al., 2018a; Zhao and Zhao, 2018), personal care product use, and cleaning (Abt et al., 2000; Clements et al., 2018), human metabolic activity produces CO2 and other volatile bio-effluent emissions (Bivolarova et al., 2017; Persily and de Jonge, 2017; Weisel et al., 2017). Indoor exposure is commonly investigated using well-mixed environment assumption (Nazaroff, 2004). Previous studies have shown that using a well-mixed environment assumption leads to underestimating inhalation fraction and exposure 40–90% (Licina et al., 2017a), or even several times for some pollution sources (Pantelic and Tham, 2013). In buildings room airflow patterns (Pantelic and Tham, 2013), localized mechanically induced airflows (Pantelic et al., 2020), (Pantelic et al., 2009; Pantelic et al., 2015), or the thermal plume (Licina et al., 2014; Licina et al., 2015; Pantelic et al., 2020), can alter exposure patterns compared to data collected by room-level sensors (Corsi et al., 2007; Licina et al., 2017b). Some studies have considered this limitation and accounted for proximity to indoor sources (e.g., cooking locations) (Piedrahita et al., 2019), but proximity was accounted for in a static sense, neglecting the dynamics of human movement indoors. To overcome this limitation and account for the environment that is not well-mixed and dynamically changing proximity to the pollution source, we combined GPS and personal air pollution sampling for outdoor exposure evaluation and Real-Time Location Tracking System (RTLS) indoors with the indoor air pollution sensor grid for indoor exposure evaluation.
Indoor air quality controls include source control, ventilation for contaminant control and air cleaning (Godish, 2019). The stove hoods are effective source control that exhausts cooking emissions (Singer et al., 2017a; Sun et al., 2018). The air filtration using HEPA-filter and activated carbon-equipped portable air cleaners (PACs) is an effective air quality intervention when source control and ventilation prove inadequate and is particularly well-suited for zone-based automation (Cox et al., 2018). Indications of health improvement have been observed over multi-day and multi-week long periods for indoor air quality interventions that reduce Particulate Matter (PM), Total Volatile Organic Compounds (TVOC), and ozone. Indoor air quality controls investigated include improved central air system filtration, PACs, and air pollution source control. Outcomes shown to be improved through such interventions include cardiorespiratory health indicators in healthy adults (Chuang et al., 2017; Day et al., 2018; Fisk, 2018) and children (Madureira et al., 2015; Vicendese et al., 2015; Chen et al., 2017; Karakatsani et al., 2017; Chen et al., 2018b), cardiovascular health (Cui et al., 2018; Liu S. et al., 2018; Morishita et al., 2018; cheng et al., 2016; Baumgartner et al., 2018; Rumchev et al., 2018), cognitive health (Saenz et al., 2018), and asthma (Institute of Medicine, 2000; Habre et al., 2018).
Recent advancements in sensing technology have enabled the application of sensors like TVOC, PM2.5, O3, and NO2, with high granularity for monitoring (Kumar et al., 2016; Derbez et al., 2018; Schieweck et al., 2018; Demanega et al., 2021; Omidvarborna et al., 2021; Shen et al., 2021; Yang et al., 2021). A recent literature review of IoT-enabled technologies showed the potential for environmental control with IoT-enabled sensors and devices but also showed that regardless of the technical possibilities, no studies investigated their application and effectiveness (Pantelic et al., 2022). In the current study, we developed the air quality control ecosystem consisting of IoT-enabled air quality interventions and sensing. Methodology in the current study utilizes a cross-over design to examine the impact of cooking and cleaning emitted particles on cardiovascular and respiratory health during several weeks-long exposure events under two experimental conditions. One experimental condition implements conditions in a typical US multifamily residence, including a manual stove hood. The second experimental condition utilizes automated IoT-based air quality interventions that actively reduce air pollution exposure. Participants in the study would spend 4-week living in the Well Living Lab residential modules performing a prescribed set of activities every day except weekends when they are allowed to go home. The health impact will be evaluated by measuring blood and urine biomarkers and taking physiological measurements during the participant’s stay in the Well Living Lab residential modules. Occupants surveys were used to evaluate subjective perceptions of the environment, sleep quality and health. Detailed environmental measurements will be taken in parallel to the physiological measurements.
The study has two specific aims. Aim 1: This study aims to evaluate the impact of automated IAQ interventions on cardiopulmonary health compared to a standard residential environment. Participants will reside in the Well Living Lab residential apartments during non-work periods from Sunday evening to Friday afternoon. During participation in the study, biomarkers of oxidative stress, inflammation, and coagulation and cardiopulmonary measurements of blood pressure, heart rate, heart rate variability, lung function, and lung inflammation will be measured over four-week periods. Participants will spend 2 weeks in each of the conditions. Aim 2: Evaluate the impact of automated IAQ interventions on sleep quality and relationships between the human and indoor environment. In addition to cardiopulmonary health, environmental satisfaction, self-reported health symptoms, and sleep quality will be measured over four weeks to assess the impact of an automated IAQ intervention on relationships between human and indoor environments.
We tested the methodology in a pilot study with three participants and refined it for application in the main study. The current paper describes the application of the methodology in the pilot, presents results from the pilot, and discusses improvements implemented in a protocol for the main study.
This study will be conducted in the residential modules at the Well Living Lab (WLL) in Rochester, MN. The WLL creates realistic indoor environments that allow researchers to capture realistic, long-term human health, behavioral and environmental data in a highly controlled environment. For this study, two apartments built at the lab will each house one participant at a time for one month.
Each residential module simulates one-bedroom apartments with the floor area of 32.6 m2 (Figure 1). Both modules are equipped with electric stove and stove hood. The stove hood is installed above the stove and have ducted exhaust to the outside. In standard control mode, the stove hood will be turned ON manually, and in advanced control mode, the stove hood will be automated and triggered based on the environmental readings. Details of the operation are discussed in Section 2.5. Modules have 2 PACs (Blueair 480i, Blueair, Stockholm) located in the bedroom and between the kitchen and living room. In each module, participants were able to control air temperature. Windows in both modules are not operable. Ventilation is provided through the central HVAC system. IoT CO2, TVOC, and PM2.5 sensors are placed in the kitchen, living room, bedroom, and bathroom (Figure 2).
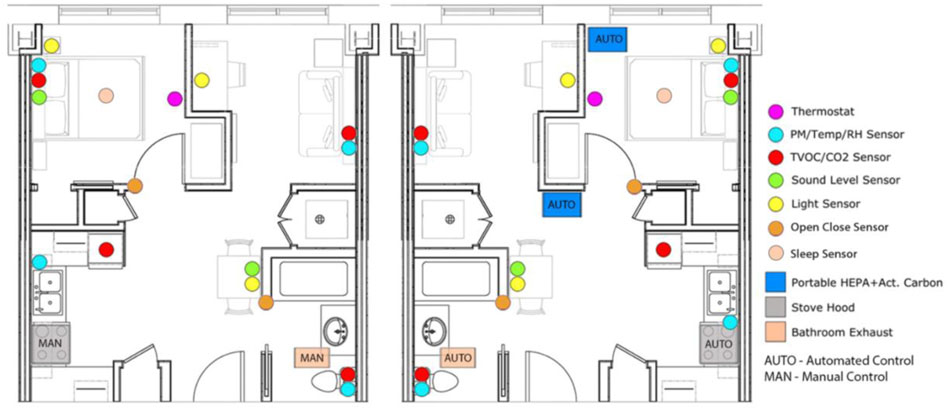
FIGURE 1. Residence layout.
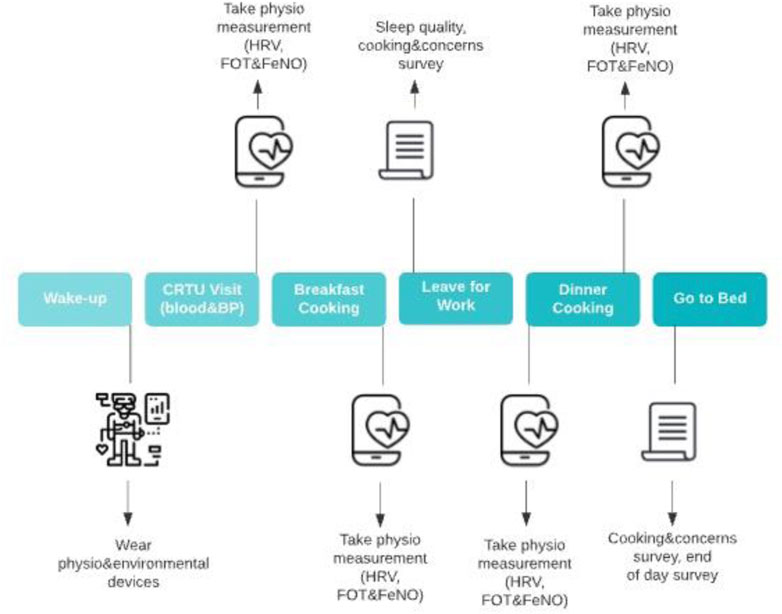
FIGURE 2. Daily schedule of study participant activities.
The study is designed to simulate occupant daily exposure with the focus on the indoor sources in the residential environment, specifically PM emitted during cooking and cleaning. Study is designed as a combination of exposures in controlled environment of simulated residential space and uncontrolled daily exposures outside the residential setup. Although exposure outside of the module is uncontrolled it is accounted for by personal exposure measurements. Each participant will be exposed to 2 sets of conditions in simulated residential environment in the crossover format. Half of the participants will spend first two weeks in the residential module operated with standard control and then we will change control mode to advanced and participants will spend another two weeks in those conditions. The second half of the participants will first start with advanced control conditions for two weeks and then we will change operation to standard control for the remaining two weeks. The main study will take place over 28 weeks, with a total of 14 participants that will spend 4 weeks each in the simulated residential environment. The pilot study was a shorter version of the main study, taking place over the period of 1 week per participants during the month of Jun, with a total of 3 participants. In the pilot we tested how participants carried out tasks defined in the study protocol (Figure 1). Schedule of daily activities is presented in Figure 1. Pilot provided insights on how study participants felt about the quantity and difficulty of the tasks they are asked to perform, surveys they need to take daily, equipment they needed to carry. The pilot study also serves to test data collection inside and outside the residential modules, collected and manually stored and collected using IoT and automatically stored. We tested how participants respond to the frequent blood and urine sample draws and how Mayo Clinic analyzes our samples.
The same as in the pilot, in the main study, participants will spend most of their non-work hours in the residential module. During their time in the module, they will cook breakfast and dinner each weekday and clean twice a week (Figure 2). During the workday and for a short period after the workday, participants can leave residential modules for a short period of time. The requirement for participants will be to stay in the module at least 1 h and 30 min after they have cooked dinner. A full schedule is detailed in the Appendix.
The residences simulate one-bedroom residential units with typical amenities, including a full kitchen, bathroom, bedroom, living room/office space, and laundry, as shown in Figure 2. In the residential modules, we measure T, RH, PM2.5 CO2, VOC, noise, and lux levels in the kitchen, bedroom, living room, and toilet. Alongside these environmental measurements, we will use Real Time Location System (RTLS) to map out participant locations in the residential modules. RTLS data will be paired with environmental data to accurately calculate indoor exposure to cooking emitted PM2.5. Previous findings by Lie et al. (Liu et al., 2022) from experiments conducted in the WLL residential modules suggest that the environment is not well mixed from the cooking emitted PM2.5. perspective and that pairing of the location to the sensor in that particular zone is necessary for accurate exposure calculation. Participants will also wear a PM2.5 personal sampler (SidePak, TSI, Shoreview, MN) while inside and outside the module and iPhone with GPS. GPS and personal sampler information will be paired for the correct apportionment of cooking emitted particles compared to the total daily exposure.
Table 1 outlines the experimental conditions and building system set points for the standard and advanced environmental control scenarios.
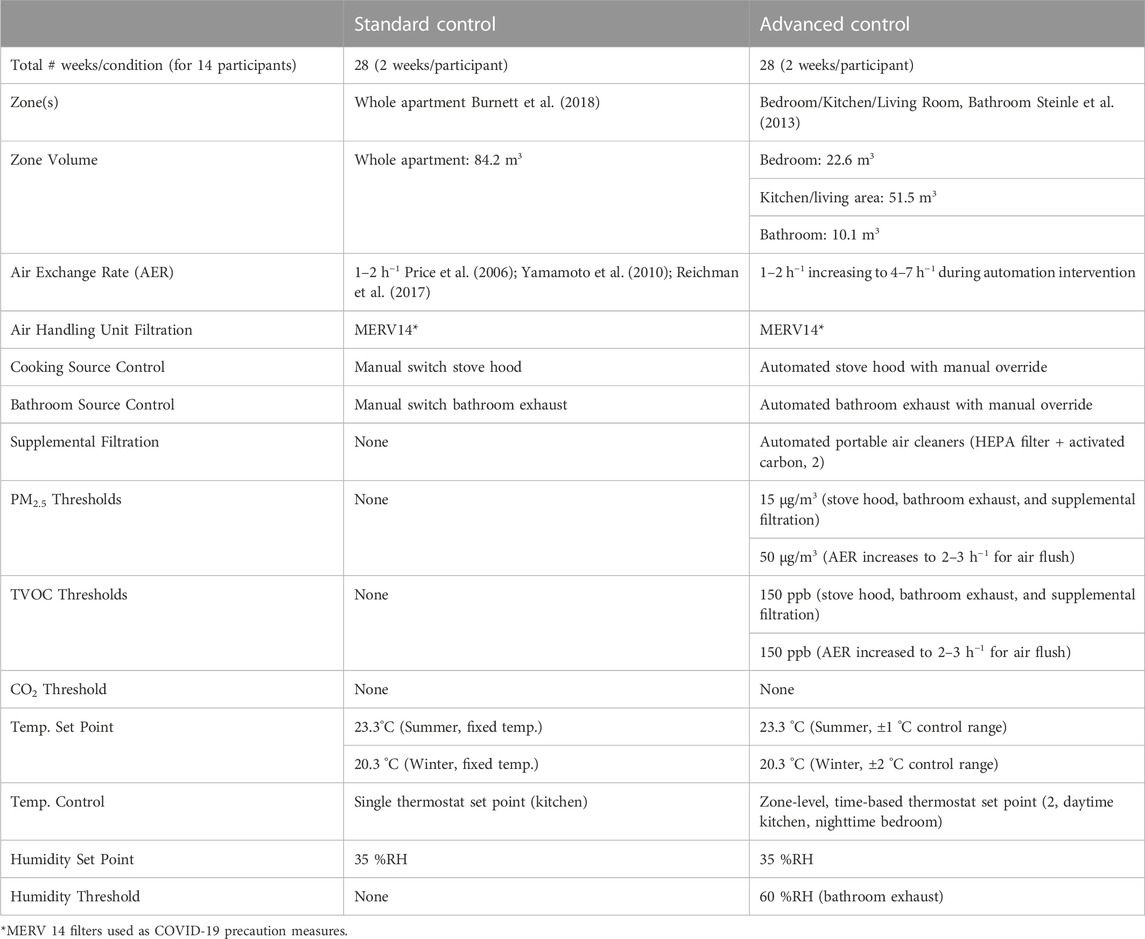
TABLE 1. Experimental design summary.
Cohort size estimates are based on a literature review of previous trials with similar aims, outcomes, and design. Detail description of statistical power and size effect is in section 2.12. At least 14 participants will individually reside in a residential module for four weeks, with a two-week observation period per condition. Participants aged 18 years and over will be recruited in Rochester, MN. Exclusion criteria includes smoking or having quit smoking <1 year prior; respiratory infection; signs and symptoms of obstructive pulmonary disease, asthma, heart failure or cardiac arrhythmia; use of corticosteroids anti-arrhythmic medication, beta-blockers, anti-inflammatory drugs or aspirin; women who are pregnant or intend to become pregnant during the duration of the study; and shift workers. Additional exclusion criteria include individuals who have not been fully vaccinated against SARS-CoV-2. Participants included in this study will be able to relocate to the Well Living Lab for 20 nights (4 weeks), fulfill scripted tasks (Figure 1), including cooking, cleaning, sample collection, and provide informed, written consent.
Participants will be recruited through five different approaches (Burnett et al., 2018): a mass e-mail recruitment (Steinle et al., 2013), word of mouth (Tran et al., 2021), a recruitment announcement posted on the Mayo Clinic Classifieds (Assimakopoulos et al., 2018), placing recruitment flyers on boards in Mayo Clinic buildings, and/or (Saraga et al., 2014) using Mayo Clinic’s social media webpage. All forms of recruitment will guide participants to complete a Qualtrics screening survey for the initial eligibility assessment.
A screening survey using Qualtrics will be used as the first step in determining eligibility among potential participants. The survey will have questions regarding demographics information (e.g., age, sex), contact information (e.g. name, email, and phone number) and preferred method of contact, occupational factors (e.g., current work department, job description), environmental characteristics of current home environment, health factors (e.g., use of medications known to impact the outcomes being observed), and exclusion criteria assessment.
Once a participant is successfully recruited and before the study participant moves in, biometric baseline measures will be collected and the participant will be trained on the schedule of activities, devices to be used during the study, module rules, and emergency procedures.
Participants scheduled activities include morning and evening tasks, Monday through Friday. Participants may leave the module during the day. They will be asked to cook breakfast and dinner using lab-provided recipes that are expected to emit significant concentrations of PM2.5 and TVOC, including oil-based frying (Yu et al., 2015; Gao et al., 2015; See and Balasubramanian, 2008; Buonanno et al., 2009; Olson and Burke, 2006; Torkmahalleh et al., 2012; Wallace et al., 2004; Abdullahi et al., 2013; Dennekamp, 2001; Poon et al., 2016; Li S. et al., 2017; Liu et al., 2018a; Dobbin et al., 2018; Liu et al., 2018b; Militello-Hourigan and Miller, 2018; Singer et al., 2017b). Food will be delivered when they move in and on a weekly basis. Participants will be able to cook additional food if desired but cooking methods will be restricted to boiling and using the microwave. Boiling is associated with low PM emission rates (See and Balasubramanian, 2008) and will result in lower unaccounted exposures. A microwave can only be used for food heating, because studies of emission rates suggest that this food preparation method can emit a lot of particles (Zhang et al., 2014). This restriction will minimize variability in cooking-related air pollutant exposures between participants. During Tuesday and Thursday evenings, participants will be asked to conduct cleaning activities known to generate particles like vacuuming (Sercombe et al., 2007; Knibbs et al., 2012; Avershina et al., 2015; Vicendese et al., 2015; Nazaroff, 2016) and TVOCs like wiping down surfaces after using a spray cleaning solution (Singer et al., 2006a; Singer et al., 2006b; Carslaw, 2013; Nørgaard et al., 2014; Carslaw et al., 2017; Shin et al., 2017; Fang et al., 2019). Some recent studies have also shown that several categories of cleaning products (e.g. bleach, botanical disinfectants, terpene-based cleaning agents) can initiate the formation of particles (Mattila et al., 2020; Jiang et al., 2021). Participants will be able to run the dishwasher and do laundry whenever necessary. They will be allowed to leave the residential module with the restriction that they have to stay in the module for 1 h and 30 min after they cook dinner. On Wednesdays and Fridays prior to cooking breakfast, the participant’s blood, urine, and blood pressure will be collected in the module by a Clinical Research and Trials Unit staff member. Sleeping and wake-up time will be flexible on all days, but activities that occur after waking up (e.g., HRV measurement, cooking breakfast, nurse visit) and prior to sleeping (e.g., HRV measurement, surveys) should occur in the scheduled order during the indicated periods. During the four-week study, participants are not required to stay in the module on Friday when they complete all their scheduled activities. Condition transitions will involve installing or removing PACs, initiating and ceasing filtration/ventilation control algorithms, and changing the air handling unit filter. Following the participant move-out after the fourth week, a professional cleaning service will clean the residential modules following COVID-19 disinfection protocol. More detailed information on participant schedule can be found in Supplementary Table A1.
Participants will be provided with a pre-programmed tablet using an WLL designed mobile application which will include their schedule of tasks for the week and an electronic checklist for the participant to indicate when a task is completed. The application was developed for participants to keep track of and check off all the scheduled activities they need to perform during each day. In addition, participants will be able to report if they engage in any additional cooking or cleaning activities that may not be part of the study protocol. This information will help us understand the frequency of unplanned events that may impact the study outcomes.
The air supply system servicing the residences consists of a single air handling unit where outdoor air mixes with return air after which mixture goes through the MERV14 filter cooling and heating coil before it is supplied to the residential modules. Each residence has a supply air variable air volume (VAV) terminal unit with reheat. The flow rates used in the pilot and main study are described in Table 1. MERV14 filter is installed in the AHU to reduce the risk of cross-contamination of particulate emissions and airborne pathogens (e.g., SARS-CoV-2).
Residential module with Standard Control operates as VAV system maintaining air temperature set point and has manual ON/OFF control of stove hood and bathroom exhaust. Advanced Control mode introduces automatically controlled air quality intervention strategies consisting of a stove hood, two PACs, bathroom exhaust, and an increased supply airflow rate. These interventions contain and remove PM2.5 (Liu et al., 2022) emitted during cooking. When PM2.5 concentrations of 15 μg/m3 or higher are detected in the kitchen, bathroom, bedroom, or living room, then the stove hood, bathroom exhaust, bedroom PAC, and living room PAC will turn ON, respectively (Figure 1). When the PurpleAir sensors detect an average of 3 consecutive measurements of PM2.5 < 6 μg/m3, then the corresponding devices will turn OFF. If any of the PurpleAir sensors detect PM2.5 concentration beyond 50 μg/m3, the supply airflow rate increases to 510 m3/h (“air flush” mode) to dilute the air pollution level. Setting the air flush to trigger at a higher threshold allows for stove hood, exhaust fans, and air cleaners to address emission events without altering the standard HVAC operation. Sensor details are in Supplementary Table A2. The outdoor air ratio (∼20%) will be maintained during air flush, rather than being set to fully open to prevent ducts from freezing during severe winter weather. The air supply system provides occupants the ability to control temperature setpoint within a set range ±3 °C using a slider located on the wall thermostat (BAPI 418MHZ). Humidity was maintained at 35% during the pilot and will be maintained at 35% during the main study. Details about the IoT connection of different components to the system is described in the Appendix.
In Figure 3 and Figure 4, we present results from the pilot study with standard and advanced control modes. Hourly box plots in Figure 3 show that the residential module with advanced control maintained lower PM2.5 levels in the module throughout the day and especially during scheduled cooking hours. Results in Figure 4 show that when meals with the same recipe were cooked in both residential modules, the module with the advanced control had lower peak concentration and shorter exposure time. Results in Figure 3 and Figure 4 suggest that participants were exposed to different levels of PM2.5 in the residential modules with the standard and advanced control. Results of the stove hood use show that stove hood was not used in the manual mode, while it was turned on during all the cooking activities when advanced controls were used.
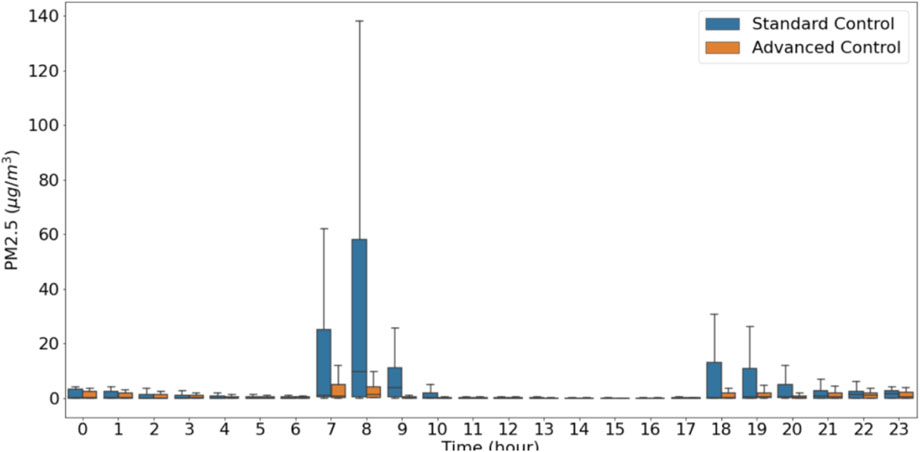
FIGURE 3. PM2.5 hourly concentration averages for the entire pilot duration.
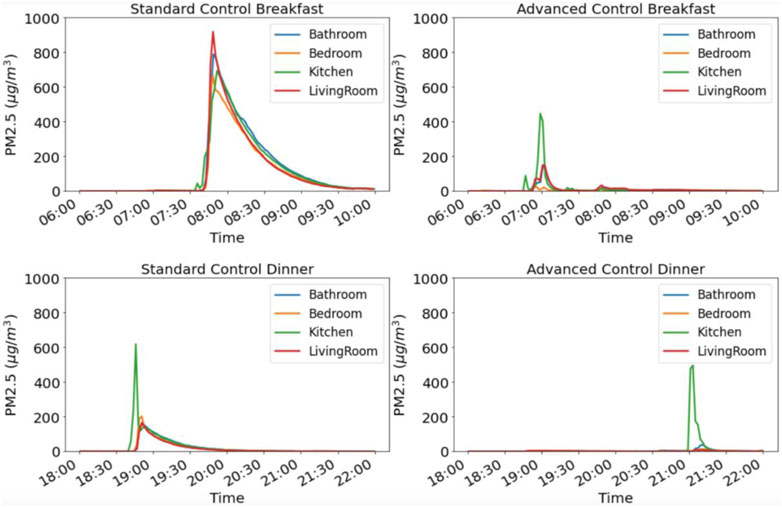
FIGURE 4. PM2.5 concentration profiles for breakfast and dinner cooking in the standard and automated residential module.
Environmental monitoring consists of room-level and personal PM2.5 monitoring (worn outside the module). Besides environmental monitoring we use RTLS and GPS to include participant location information in the exposure analysis. With the exposure analysis we would like to 1) accurately estimate exposure in the residential module using sensors placed in four locations in the module, and 2) provide insights into the relationship between cooking exposure at the residential module to other exposures that participants experience during the day (total exposure). Table 1 describes the environmental data collected in the pilot. The same data will be collected in the main experiment. Module-level sensor locations are included in Figure 2. Collocation calibration was performed for low-cost sensors for PM2.5, and TVOC. All CO2 sensors were calibrated using 3-point concentration collocation against research grade sensor (Li-Cor LI-840A, LI-COR Inc., Lincoln, NE).
RTLS was installed in the modules for localized occupant location tracking. The RTLS provides information of a participant’s location in specific areas of the module using a mesh network of antennas (WISER Systems, Inc., Raleigh, NC). 11 antenna nodes were installed along the module perimeters (Figure 4; Supplementary Figure A2). Antennas were placed with spacing less than 10 m apart, 2 m above floor for high tracking accuracy. The antennas formed a mesh matching with floor plans uploaded to the software and located signals from a beacon that a participant wore near the chest. In the pilot, the signals were collected whenever there was a zone change; in the main study, this will be changed to data collection every 10 s. Testing before and during the pilot demonstrated this as the best data collection strategy.
Each residential module is divided into 5 zones: cooking area, dining room, bedroom, living room, and bathroom (Figure 5A). RTLS zones correspond to the placement of PurpleAir sensors which enables location and inhaled air PM2.5 concentration coupling. The zone arrangement was tested against the ground truth data (Figure 5B) and demonstrated high accuracy. In the main study, we plan to calculate PM2.5 exposure based on proper pairing of the location and PM2.5 readings at that location. This information is incorporated into equation (1) that will be used to calculate exposure of participants in each residential module.
Where Cn,i is PM2.5 concentration at zone n detected by RTLS at time tn,j. Location n is detected by RTLS. Σti - is total time participant spend in a particular zone n. ΣΣtn,i is the total time participant spend in the residential module. p is inhalation rate.
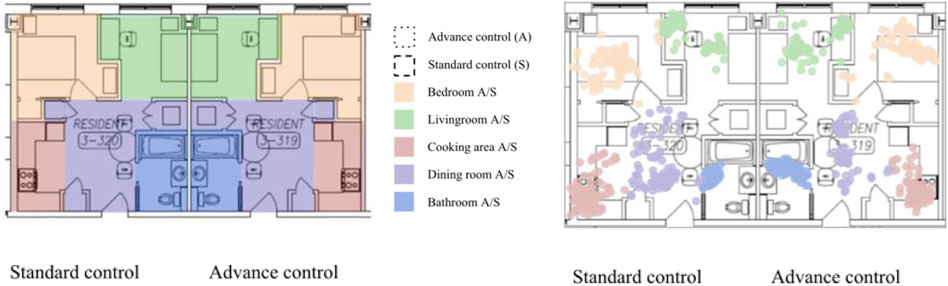
FIGURE 5. (A) RTLS zone configuration assignment for the main study; (B) and RTLS temporal readings: green dots–living room, purple dots–dining room, red dots–cooking area, blue dots–bathroom, orange dots–bedroom.
A custom iOS app was built for GPS tracking. The app collected longitude, latitude, speed, vertical, and horizontal accuracy, at most, once every minute. When the iPhone was in background mode, GPS data was collected only when the location changed greater than 500 m from its previous location and, at most, once every 5 minutes. GPS locations correspond to daily activities, including being home, commuting, walking/running, and working (at work). Daily PM2.5 profiles consist of exposures to air pollution in different locations. GPS data enables us to correctly apportion exposures to different locations. Analysis of the pilot GPS data was a two-step process (Burnett et al., 2018): determining whether the participant is in the module or outside of the module status and (Steinle et al., 2013); determining participant activities outside the module. A K-nearest neighbor model was developed to distinguish if a pair of longitude and latitude was in the module. The model was trained using GPS data collected inside and outside the module. Activities outside the module were determined by speed and distance change from the previous location. Distance change smaller than 100 m with 1–3-min duration was neglected. Speed lower than 1.5 km/h was classified as ‘no travel’; speed lower than 25 km/h was classified as ‘walking/running/cycling’; speed equal to or over 25 km/h was classified as ‘vehicle’.
Analysis of the pilot data in Figure 6A and Figure 6B demonstrated that GPS data could be used effectively to differentiate work environment, residential environment, and commute. Results in Figure 5A clearly distinguish between the work and residential module and show that vehicle was used for commuting between these locations. Results in Figure 5B showed differentiation can be made even if participants reside and work in the buildings next to each other and that commute was walking/running/cycling.
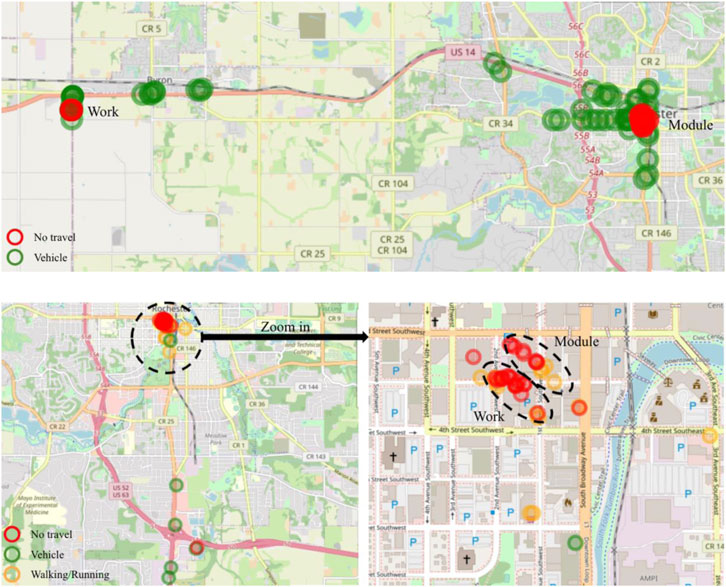
FIGURE 6. GPS depiction of activities for one of the pilot participants a) participant-1 b) participant-2.
Participants carried portable air quality monitors (TSI SidePak, Shoreview, MN) when they left the residential module. This allowed us to carry out nearly 24-h exposure measurements of PM2.5.
Results in Figure 7 show the distribution of exposures in and outside the modules for Standard and Advanced Control. Results show that for the module with Standard Control, exposure in the module is ∼50 ug/m3 compared to <10 ug/m3 in the module with Advanced Control. Results also show that the average PM2.5 concentrations participants were exposed outside of the module are very similar. When GPS information was coupled with the personal sampling, we could show exposure apportionment to the work environment, residential environment, and commute (Figure 8; Figure 9). Integrated concentration results in Figure 8 show that the module with advanced control work exposure was higher than in the residential module. This is a valuable result because it provides insights into exposure patterns during the evaluation of health effects. Results in Figure 9A show that in the module with standard control, over 95% of exposure occurred within the residential module, while commute and work contributed <5% of the total exposure. For the participant in the advanced control module (Figure 9B), ∼53% of the exposure took place at work, ∼44% took place in the residential module, and the rest was attributed to the commute.
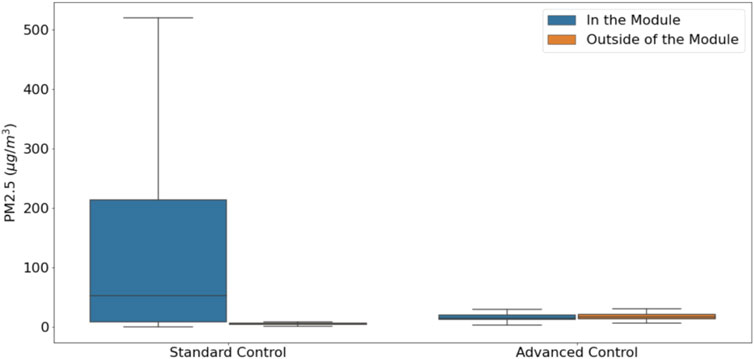
FIGURE 7. Average concentration participants were exposed to during the day in standard and advanced controlled residential modules.
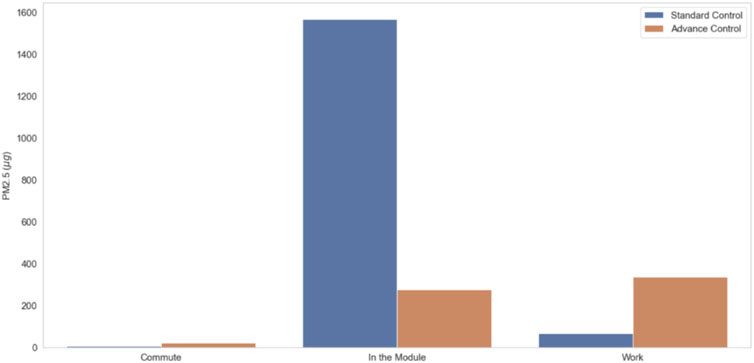
FIGURE 8. Integrated concentration during the commute, stay in the residential module and at work for standard and advanced control modules.
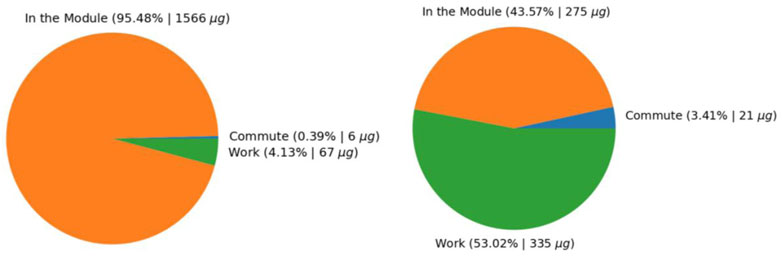
FIGURE 9. Apportionment of exposure to different environments and activities (A) Residential module with Standard control, (B) Residential module with advanced control.
During the pilot several surveys were administered to the participants once or multiple times. Baseline surveys regarding participants’ general background, home environment, and office environment were administered once before moving in and an exit survey was administered once after participants completed the study. During the participants’ stay, participants answered a set of surveys multiple times, including the COVID-19 screening, health symptoms and concerns associated with cooking and cleaning activity, and experience with the residential module at the end of the day (EoD).
Baseline surveys collect information about demographics, medications, sleep quality (Snyder et al., 2018), perceived stress (Cohen et al., 1983), wellbeing, general cooking habits, home characteristics assessment, work background, and office environment (Andersson, 1998). The exit survey collects feedback on participants’ experience on performing assigned tasks, satisfaction as a study participant, and the quality of instructions and schedule of tasks through the tablet. Health symptoms and concerns associated with sick building syndrome (SBS) were assessed daily after cooking. In the pilot the health symptoms and concerns questions were derived from the Emory Indoor Air Quality questionnaire. Health symptoms were assessed additionally in the morning and evening. In the symptoms question, if participants reported the presence of symptoms, they were subsequently asked to report the perceived intensity. After each cooking and cleaning event, participants were asked to fill out questions related to perceived air quality during and if the activity was performed according to the protocol. For example, if during cooking they followed a recipe or if during cleaning they only vacuumed or also performed surface cleaning.
At the end of the day on Monday through Thursday during the pilot, we collected data on participants’ general satisfaction with the residential module, perception, satisfaction, and sensation of indoor environment, environmental concerns, stress level, and caffeine consumption. The perceived quality of the indoor environment questions includes assessments of air quality, thermal comfort, light, and acoustic quality. Environmental concerns encompass questions regarding noise, fumes, temperature, and humidity. Thermal comfort was assessed following ASHRAE 55 methods and included a thermal sensation scale, a thermal comfort scale, and a question intended to estimate the amount of clothing being worn for estimating thermal insulation (Nørgaard et al., 2014). A subset of these questions was obtained from a recently developed residential comfort scale (Singer et al., 2006a). In addition, prior to visit of staff for blood draw on Tuesday and Thursday morning, participants completed the COVID-19 screening survey as a part of COVID-19 safety protocols.
Results presented in Table 2 show that during the pilot participants completed 100% of the repeating surveys. 2 out of 3 participants completed the exit survey, however, due to the technical issues, baseline surveys were not distributed. This result shows that during the pilot survey fatigue did not play an important role. The survey output results illustrated in Figure 10A depict IAQ perception differences between the 3 participants. Participant 3 was less satisfied with the IAQ in the residential module compared to other two participants. Results also show that Participant 3 experianced stronger negative impacted by the cooking fumes (Figure 10B).

TABLE 2. Response rate.
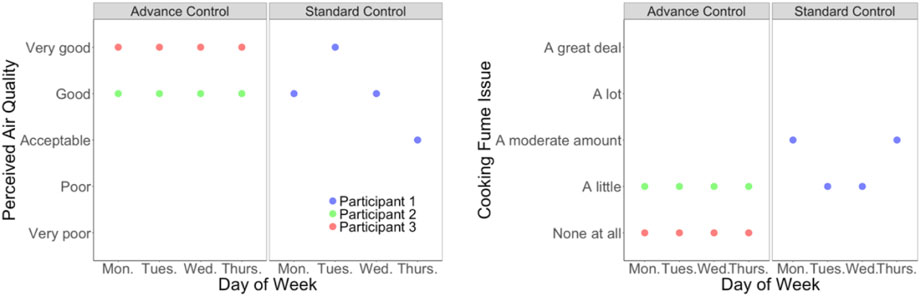
FIGURE 10. (A) Indoor air quality perception results and (B) cooking fume issues.
In the main study, we will adjust distribution of the surveys and survey questions. To minimize technical issues, baseline surveys and exit survey are integrated into the scheduled tasks. We simplified baseline, thermal comfort, and SBS-related symptoms and concerns questions so that we can focus more on perception of cooking exposure and daily activities as well as evaluation of each environment. After observing behaviors related to cooking activities, we included more questions about participants’ cooking habits and environments at home in the baseline survey. In addition, to understand possible differences in the perception of the environment, especially between the home and residential modules, the same questions regarding indoor environmental perception for the home, office, and residential modules are also included. Furthermore, we include questions related to commute and physical activities at the end of day and sleep quality in the morning to better assess each outcome of interest.
Several studies have shown that PM2.5 can play a role in oxidative stress, resulting in a change in 8-hydroxy-2-deoxyguanosine (8-OHdG) levels (Pan et al., 2011; Lin et al., 2013; Chuang et al., 2017). PM and TVOCs have also been seen to influence systemic inflammation through biomarkers interleukin-6 (IL-6), C-reactive protein (CRP), and fibrinogen (Lin et al., 2013; Karottki et al., 2014; Hassanvand et al., 2017). These physiological measures are important indicators to determine the impact of IAQ on cardiorespiratory health.
Two recent literature reviews identified various biomarkers in blood, urine, and saliva impacted by outdoor and indoor air pollution exposure (Senerat et al., 2021). Both reviews found that air quality affected multiple biomarkers in various body systems, including inflammation and oxidative stress. The IAQ review found four main biomarkers that consistently showed association with IAQ through various sources, including cooking (Pan et al., 2011; Lin et al., 2013; Chuang et al., 2017), (Pan et al., 2011; Lin et al., 2013; Karottki et al., 2014; Hassanvand et al., 2017). While numerous research studies show an association between IAQ and various human biomarkers, many of these studies range in settings, including restaurant kitchens, workplaces, or residential homes. These study limitations do not allow for a controlled environment to factor in confounding variables of the effects of IAQ on human biomarkers.
During the pilot, blood and urine were collected 2-3 times per participant. A mobile nursing unit collected these samples on Wednesday and Friday mornings for all three participants, and one participant provided baseline samples before move-in due to time constraints. Up to 20 ml of blood and a minimum of 30 ml of urine will be sampled per collection and stored in a fridge for subsequent analysis. Analysis was performed for seven biomarkers. Biomarkers tested in the pilot include 8-hydroxy-2-deoxyguanosine (8-OHdG, urine), vonWillebrand Factor (vWF, blood plasma), high sensitivity C-Reactive Protein (hsCRP, blood serum), Interleukin-6 (blood plasma), CD11b (blood), Fibrinogen (blood plasma), and Myeloperoxidase (blood serum).
In the main study, the same amount of blood and urine collected in the pilot will be collected up to 9 times per participant (four times per condition and one time as baseline). The same mobile nursing unit used in the pilot will collect these samples on Wednesday and Friday mornings during the participants’ four-week stay. In the main study, one blood and urine sample each will be collected one morning of the week before participants move into the residential modules as a baseline sample. Only six of the seven blood and urine biomarkers will be quantified per sample to detect changes in inflammation, coagulation, and oxidative stress pathways. We removed CD11b due to the lack of quantitative results provided by laboratory analysis. Biomarker levels will be tested at the Mayo Clinic Laboratories.
To assess the effect of indoor air pollution exposure on cardiovascular health, research studies have monitored changes in several physiological outcomes relevant to IAQ exposures, including diastolic and systolic blood pressure, heart rate, and HRV under different exposure conditions (Brook et al., 2010; Delfino et al., 2011; Kelly and Fussell, 2017).
During the pilot, sphygmomanometer-based blood pressure measurements (SphygBP) were collected 2 times per participant. In the main study, SphygBP will be collected in triplicate up to 8 times per participant (four times per condition) during the morning by a mobile nursing unit following each two-day exposure sequence. The average of the three closest measures at each time point will be recorded. A baseline measure of blood pressure was not collected during the pilot but will be collected in the main study on the Tuesday morning of the week prior to occupancy during the baseline blood and urine collection. Additionally, in the main study, semi-continuous measurements of blood pressure will be collected during periods of interest using an ambulatory blood pressure monitor (OnTrak 90227) on Tuesdays and Thursdays over a 4-week period. In the pilot and in the main study during mornings, ambulatory blood pressure will be measured every 15 min during a 2-h period, from 1 h before cooking to 1 h after cooking breakfast. During evenings, ambulatory blood pressure will also be measured during a 3-h period, from 30 min before cleaning or cooking to 1.5 h after cooking dinner.
In the pilot and during the main study, the BioNomadix Electrocardiogram (ECG) system (BIOPAC, United States) will measure continuous HR and HRV (ConHRV) two days per week (Monday and Wednesday) during waking hours (about 7:00 AM to 10:00 PM). Additionally, a Photoplethysmography (PPG) based sensor will be used to measure HRV and HR at four specific time points daily (Monday-Friday) to collect resting HRV (RestHRV) measurements: 1. Immediately after the participant wakes up, 2. After cooking breakfast, 3. Before cooking dinner, and 4. After cooking dinner. Resting HRV measurements will be collected after the participant has rested for 5 min (stabilization period) for approximately 10 min with the subject seated and as motionless as possible using spaced breathing. For HRV measurements taken throughout the day when participants are away from the modules, participants will be asked to report in an activity log the times they exercise and stress and anxiety levels. In the main study resting HRV readings will be collected on the same schedule from Tuesday to Friday before occupancy as a baseline measure. During the pilot, occupants performed most of the scheduled measurements. The pilot results showed that the participant completed all required biomatrix measurements. This was one of our major concerns, considering the number and strict schedule when they need to be performed. We will keep the same biomatrix measurement protocol during the main study. We included BP, HR, and HRV baseline measurements up to a week before moving into the module in the main study in an attempt to provide better base for observation of exposure effects.
To evaluate the impact of indoor air pollutants on respiratory health, researchers have used lung function measures and respiratory health questionnaires. The Force Oscillation Technique (FOT) has emerged as an alternative to spirometry for measuring lung function (Maugeri et al., 2017). FOT is a technically simple, minimally time-consuming, and accurate technique for characterizing respiratory mechanics (Faria et al., 2009). In addition to FOT and spirometry, measurements of concentrations of exhaled nitric oxide (FeNO) has been used to detect airway inflammation. Nitric oxide is a gas produced by the endothelial cells involved in the inflammation response, and the concentration of FeNO can be easily measured in an exhaled sample of breath. Measurements of inflammation of lung airways complements conventional lung function testing in the assessment of patients with non-specific respiratory symptoms (Taylor et al., 2006).
During the pilot, lung function and inflammation measurements were be collected in triplicate via the forced oscillation technique (FOT) and exhaled nitric oxide (FeNO), respectively, up to 32 times per participant. Participant collected collected these measurements during four scheduled periods. On Mondays, FOT and FeNO measurements were collected before and after cooking dinner. On Wednesdays, FOT and FeNO measurements were collected before and after cooking breakfast, as well as before and after cooking dinner. On Fridays, FOT and FeNO measurements were collected before and after cooking breakfast. The main study will use the same protocol. In the main study additional baseline lung function and inflammation measures will be collected on Tuesday morning prior to occupancy.
Although environmental air quality factors such as noise, temperature, and humidity have been shown to impact the sleep (Okamoto-Mizuno and Mizuno, 2012; Harding et al., 2019; Akiyama et al., 2021), there is limited research on the effect of ambient and indoor air pollution exposures and sleep health measures, including sleep duration, sleep quality, and the frequency of periods of wakefulness after sleep onset (Strøm-Tejsen et al., 2016; Canha et al., 2021). Strom-Tejsen et al. (Strøm-Tejsen et al., 2016), assessed the impact of bedroom CO2 levels on objectively measured sleep quality and sleepiness (Strøm-Tejsen et al., 2016). Improved sleep quality and a reduction in next-day sleepiness levels were observed in bedrooms with ventilation and, thus, a lower concentration of CO2 (∼835 ppm) compared to bedrooms with no ventilation and an average CO2 concentration of 2395 ppm. Similarly, Yu et al. (Yu et al., 2019), reported reductions in sleep duration (0.68 h of sleep), measured using subjective sleep questionnaires with increases in air pollution (PM2.5, PM10 and NO2) among students living in Beijing, China (Yu et al., 2019). To our knowledge, limited studies have investigated the impact on sleep following exposure to particles from cooking emissions.
A mattress-based sleep monitor, EMFIT QS (EMFIT, Finland), was used in the pilot to evaluate the association between exposure and individual sleep quality every night. The main study will include Dreem headband (Dreem, France) alongside EMFIT. We will assess metrics that includes total sleep time, time in bed, sleep onset, sleep onset latency, wake after sleep onset, sleep quality and HRV. As HRV is monitored with this device, in combination with the daytime wearable HRV biometric device, nearly 24 h of continuous HRV measurements will collected on certain days during the study. Measures of sleep will be averaged across each condition and compared using statistical analysis.
Figure 11 details the data that were collected in the pilot and will be collected in the main study, associated planned analyses for the main study data, and questions the study tries to answer. Linear mixed-effects models or similar modeling approaches will be used to assess differences between health and survey outcomes in two residential modules. ANOVA or similar will be used to assess differences between environmental conditions and occupants' behavior related to pollution control. Air Pollution Exposure models, which include occupant tracking, estimates of inhalation rate based on occupant activity, and environmental measurements will be used to assess differences in personal exposure between experimental conditions for health effect modeling.
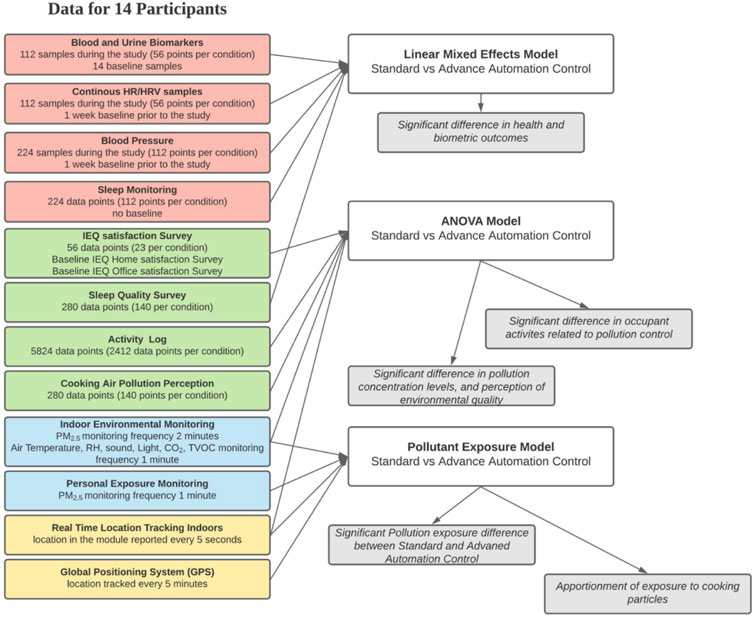
FIGURE 11. Data analysis plan.
All power calculations are performed assuming the use of a linear mixed effects model with a random intercept for participant and no random slope. We also assume that there are a total of 14 participants engaging with both ventilation conditions. Variables for which there are few measurements per participant per condition will have the lowest statistical power, whereas more frequently collected variables will have greater power.
We will collect blood and urine biomarkers four times per condition for each participant. This sample collection represents the lower limit in terms of collection frequency. For such variables with four measurements per participant per condition, we have 84% power to detect a difference of one standard deviation between the two conditions. This power decreases to 32% to detect a difference of one-half standard deviations.
Resting heart rate variability is collected four times per day, five days each week per condition. This gives us forty measurements per condition for each participant. With this collection frequency, we have >99% power to detect a difference of one standard deviation, and 94% power to detect a difference of one-half standard deviations.
In general, we will be well-powered to detect differences as small as one standard deviation. However, for smaller differences between conditions, only certain variables with a relatively high degree of collection frequency will be well-powered.
All data captured from environmental sensors, wearable devices, surveys/questionnaires, and information documented from the subject’s chart will be stored and processed in our secure data management and machine learning ecosystem residing on Mayo Clinic’s secure instance of Microsoft Azure Cloud. Data from environmental sensors, surveys, and other devices will be collected using data pipelines residing on Azure Cloud. The raw data being ingested is stored in Azure Data Lake Gen 2. The processed data will be stored in a secure Microsoft SQL database for analytical purposes. Streaming data will be available immediately for analytical and visualization purposes. The data from instruments and devices which do not stream data or do not have the ability to send data to Azure Cloud will be uploaded via a data management web application or scripts hosted on Microsoft Azure Cloud. Survey data will be uploaded via automated data pipeline to ingest the data from Qualtrics into Well Living Lab’s data repository residing on Microsoft Azure Cloud. Data visualization dashboards are created using the data stored in the SQL database for streaming and non-streaming data. The study dashboards ensure data collection is occurring from sensors and other various data sources.
The data storages are secure requiring two factor authentication for access. The data will not contain subject identifying information. Survey responses will be stored in a secure database (with restricted access limited to a few individuals listed on this protocol) once the subject has finished their period of active participation during relocation. Survey and questionnaire responses will be coded and de-identified upon collection to protect the subject’s privacy. Before being manually stored to the HIPAA compliant Mayo Server (to which our broader team has access), survey data will undergo a second layer of de-identification such that they will be reassigned a second subject ID number that further distances them from any remote possibility of being re-identified. Only the study coordinator will have access to the first and second set of subject ID numbers that can be used to re-identify participants. Any data that may be abstracted from the subject’s medical chart or that contains any identifiers will be stored in one of our on-site HIPAA compliant secure databases. Data management architecture is depicted in Supplementary Figure A2.
The Well Living Lab data storages are HIPAA compliant and secured by passwords and user restrictions. All subject information will be de-identified and the identifying key will not be shared with collaborators. All de-identified data will be backed up, and manual entry of data will be limited to minimize data entry errors. All subject data collected during the study will be stored indefinitely and may be used for future analysis.
Research protocol of the present study is designed to assess the impact of IAQ on human health through numerous health and environmental measures. Previous field studies with a similar focus faced significant challenges in controlling for various confounding factors. The current study will allow control and monitoring of environmental factors field studies do not have.
Pilot results showed that the module with advanced automation of indoor air quality interventions reduced occupant exposure to cooking emitted PM2.5 compared to the residential module with the standard control. Advanced control activated stove hood, PACs, bathroom exhaust, and increased air supply flow rate depend on the indoor PM2.5 concentration. The pilot study participants stayed in a module with advanced or standard automation. In the main study, each participant will spend 2 weeks in the modules operated in advanced control mode and 2 weeks in the module operated in standard control mode.
Personal exposure, PM2.5 continuous monitoring, GPS, and RTLS tracking are deployed for proper total exposure analysis and detail apportionment of exposure from different sources. The pilot study showed that the methodology deployed in the pilot can measure total exposure and that technical adjustments in the main study will be sufficient to apportion participants' exposure correctly. The limitation of the methodology applied in this study is the lack of measurement of the chemical composition of PM2.5. Particle size distribution is another important factor that affects human inhalation exposure. Devices used in the pilot measure overall PM2.5 and missing particle size distribution is a limitation in the calculation of the human respiratory tract deposition.
Due to the COVID-19 influenced changes and working from home mandates, some of the pilot participants worked from their own homes; therefore, we expect that some participants in the main study will also work from home. Current methodology will apportion exposure to this situation well, but it will be unknown how representative these exposure profiles will be and if exposure between modules with standard and advanced control will have sufficiently different profiles.
Biomarkers alongside biomatrix measurements represent the critical part of our study. These measurements will connect exposure and measurable health outcomes. In the main study, we will follow the same protocol as in the pilot of 2 times per week blood and urine collection. Due to recruitment challenges in the pilot, we didn’t collect two of the three blood and urine baseline samples from participants. In the main study, we will collect blood and urine samples from each participant a week prior to moving into the residential modules to represent a baseline. In the pilot, seven biomarkers were measured in blood and urine samples. CD11b lacked quantitative laboratory results; therefore, it will be removed from the main study. Due to the lack of baseline bold and urine sampling, pilot results didn’t show if biomarkers or biomatrix measurement differences will be correlated with the exposure differences.
In both the pilot and main study, we measure BP, HR and HRV. In the main study, we included baseline morning HR and HRV for all participants one week prior to moving into the module. This data collection protocol will produce a larger baseline dataset to compare to potential impacts of cooking on the BP, HR and HRV.
Usage of FeNO will have the same protocol in the main study as in the pilot. We have removed FOT from the main study due to the operational challenges.
Survey’s response rate was 100%, which suggest that participants did not experience survey fatigue. We restructured the pilot survey: we removed any momentarily environment assessments and asked participants to evaluate home, office, and residential module environment in a comparable way. Since we observed that participants didn’t use stove hood manually we included questions that address behavior in their home environment related to use of the stove hood and other interventions they might use to remove cooking particles (e.g., opening windows and doors to the outside). Since we observe that participants also work from home, we included survey questions on their work environment and they way they commute to the work. We removed some of the Sick Building Syndrome questions since it was challenging to compare replies due to varying office locations of participants. We included questions about their perception of cooking smells in the residential modules.
Sleep quality measurements tested in the pilot will be used in the main study as well with the addition of the Dreem headband.
The population of Rochester, MN, is ∼80% Caucasian and our inclusion of participants is limited to Mayo Clinic employees who have key card access to Mayo Clinic buildings, where the residential module are. The small sample size and length of intervention conditions are also limited in this study due to the number of residential modules available at the Well Living Lab and the limited time we are asking the participants to reside in the module.
Nevertheless, this research study holds strength in helping researchers gain more knowledge into the role of IAQ on an individual’s health and wellness through physiological, behavioral, biological, and environmental data.
The original contributions presented in the study are included in the article/Supplementary Material, further inquiries can be directed to the corresponding author.
The studies involving human participants were reviewed and approved by Mayo Clinic Institutional Review Board (Mayo Clinic IRB 20-007908). The patients/participants provided their written informed consent to participate in this study.
NC wrote and designed the study protocol and was a significant contributor in writing this manuscript. JP took over the study and made measurements that resulted in changes of original advanced control strategies. JP also led the effort in writing this manuscript. KB devised the pilot surveys that were amended after a pilot by KB, YJ, and JP. SA devised the HR, HRV, BP, and FOT/FeNO plan, AS devised the blood and urine biomarker plan, LL, RO, QL, NC, and JP devised the ventilation plan. CL, JC, BS, and NW devised the technology plan, and NW devised the data management plan. EH and CW were responsible for project management and participant coordination. All authors read and approved the final manuscript. QL and YJ performed pilot data analysis.
Research is funded by Panasonic and Delos™ Living LLC. The content of this work is solely the responsibility of the authors. Funders were not involved in study design.
We would like to acknowledge IT developments on the advanced control algorithms by Brant Stevens, IT developments related to the GPS, RTLS, and automated survey collection by Jeremiah Carlin. We would also like to acknowledge significant operation support by Eric Heins. We also would like to acknowledge involvement in the IRB process and study coordination by Cindy Cassidy.
Authors JP, AS, QL, SA, YS, BK, LL, ZR, and CN were employed by Well Living Lab, Inc., Rochester, MN, United States. Author AS was employed by Delos™ Living LLC, New York City, NY, United States.
The remaining authors declare that the research was conducted in the absence of any commercial or financial relationships that could be construed as a potential conflict of interest.
All claims expressed in this article are solely those of the authors and do not necessarily represent those of their affiliated organizations, or those of the publisher, the editors and the reviewers. Any product that may be evaluated in this article, or claim that may be made by its manufacturer, is not guaranteed or endorsed by the publisher.
The Supplementary Material for this article can be found online at: https://www.frontiersin.org/articles/10.3389/fbuil.2023.1117992/full#supplementary-material
Abdullahi, K. L., Delgado-Saborit, J. M., and Harrison, R. M. (2013). Emissions and indoor concentrations of particulate matter and its specific chemical components from cooking: A review. Atmos. Environ. 71, 260–294. doi:10.1016/j.atmosenv.2013.01.061
Abt, E., Suh, H. H., Allen, G., and Koutrakis, P. (2000). Characterization of indoor particle sources: A study conducted in the metropolitan boston area. Environ. Health Perspect. 108 (1), 35–44. doi:10.1289/ehp.0010835
Akiyama, Y., Miyake, E., Matsuzaki, R., Ogata, M., Tsuzuki, K., and Tanabe, S. (2021). Effect of thermal environment on sleep quality in actual bedroom in summer by sleep stages analysis. Jpn. Archit. Rev. 4 (1), 211–221. doi:10.1002/2475-8876.12187
Andersson, K. (1998). Epidemiological approach to indoor air problems*. Indoor Air 8 (S4), 32–39. doi:10.1111/j.1600-0668.1998.tb00005.x
Assimakopoulos, V. D., Bekiari, T., Pateraki, S., Maggos, T., Stamatis, P., Nicolopoulou, P., et al. (2018). Assessing personal exposure to PM using data from an integrated indoor-outdoor experiment in Athens-Greece. Sci. Total Environ. 636, 1303–1320. doi:10.1016/j.scitotenv.2018.04.249
Avershina, E., Ravi, A., Storrø, O., Øien, T., Johnsen, R., and Rudi, K. (2015). Potential association of vacuum cleaning frequency with an altered gut microbiota in pregnant women and their 2-year-old children. Microbiome 3, 65. doi:10.1186/s40168-015-0125-2
Baumgartner, J., Carter, E., Schauer, J. J., Ezzati, M., Daskalopoulou, S. S., Valois, M. F., et al. (2018). Household air pollution and measures of blood pressure, arterial stiffness and central haemodynamics. Heart 1–7, 1515–1521. doi:10.1136/heartjnl-2017-312595
Bivolarova, M., Kierat, W., Zavrl, E., Popiolek, Z., and Melikov, A. (2017). Effect of airflow interaction in the breathing zone on exposure to bio-effluents. Build. Environ. 125, 216–226. doi:10.1016/j.buildenv.2017.08.043
Brook, R. D., Rajagopalan, S., Pope, C. A., Brook, J. R., Bhatnagar, A., Diez-Roux, A. V., et al. (2010). Particulate matter air pollution and cardiovascular disease: An update to the scientific statement from the American heart association. Circulation 121 (21), 2331–2378. doi:10.1161/cir.0b013e3181dbece1
Buonanno, G., Morawska, L., and Stabile, L. (2009). Particle emission factors during cooking activities. Atmos. Environ. 43 (20), 3235–3242. doi:10.1016/j.atmosenv.2009.03.044
Burnett, R., Chen, H., Szyszkowicz, M., Fann, N., Hubbell, B., Pope, C. A., et al. (2018). Global estimates of mortality associated with long-term exposure to outdoor fine particulate matter. Proc. Natl. Acad. Sci. 115 (38), 9592–9597. doi:10.1073/pnas.1803222115
Canha, N., Teixeira, C., Figueira, M., and Correia, C. (2021). How is indoor air quality during aleep? A review of field studies. Atmosphere 12 (1), 110. doi:10.3390/atmos12010110
Carslaw, N. (2013). A mechanistic study of limonene oxidation products and pathways following cleaning activities. Atmos. Environ. 80, 507–513. doi:10.1016/j.atmosenv.2013.08.034
Carslaw, N., Fletcher, L., Heard, D., Ingham, T., and Walker, H. (2017). Significant OH production under surface cleaning and air cleaning conditions: Impact on indoor air quality. Indoor Air 27 (6), 1091–1100. doi:10.1111/ina.12394
Chen, C., Zhao, Y., and Zhao, B. (2018a). Emission rates of multiple air pollutants generated from Chinese residential cooking. Environ. Sci. Technol. 52 (3), 1081–1087. doi:10.1021/acs.est.7b05600
Chen, C., Li, C., Li, Y., Liu, J., Meng, C., Han, J., et al. (2018b). Short-term effects of ambient air pollution exposure on lung function: A longitudinal study among healthy primary school children in China. Sci. Total Environ. 645 (7), 1014–1020. doi:10.1016/j.scitotenv.2018.07.154
Chen, Y. C., Ho, W. C., and Yu, Y. H. (2017). Adolescent lung function associated with incense burning and other environmental exposures at home. Indoor Air 27 (4), 746–752. doi:10.1111/ina.12355
cheng, J. C., Sujen, H., and Liang, H. (2016). Association between indoor air pollutant exposure and blood pressure and heart rate in subjects according to body mass index. Sci. Total Environ. 539, 271–276. doi:10.1016/j.scitotenv.2015.08.158
Chuang, H. C., Ho, K. F., Lin, L. Y., Chang, T. Y., Hong, G. B., Ma, C. M., et al. (2017). Long-term indoor air conditioner filtration and cardiovascular health: A randomized crossover intervention study. Environ. Int. 106 (250), 91–96. doi:10.1016/j.envint.2017.06.008
Clements, N., Keady, P., Emerson, J., Fierer, N., and Miller, S. (2018). Seasonal variability of airborne particulate matter and bacterial concentrations in Colorado homes. Atmosphere 9 (4), 133. doi:10.3390/atmos9040133
Clements, N., Zhang, R., Jamrozik, A., Campanella, C., and Bauer, B. (2019). The spatial and temporal variability of the indoor environmental quality during three simulated office studies at a living lab. Lab. Build. 9 (3), 62. doi:10.3390/buildings9030062
Cohen, S., Kamarck, T., and Mermelstein, R. (1983). A global measure of perceived stress. J. health Soc. Behav. 24 (4), 385–396. doi:10.2307/2136404
Corsi, R. L., Siegel, J., Karamalegos, A., Simon, H., and Morrison, G. C. (2007). Personal reactive clouds: Introducing the concept of near-head chemistry. Atmos. Environ. 41 (15), 3161–3165. doi:10.1016/j.atmosenv.2006.07.054
Cox, J., Isiugo, K., Ryan, P., Grinshpun, S. A., Yermakov, M., Desmond, C., et al. (2018). Effectiveness of a portable air cleaner in removing aerosol particles in homes close to highways. Indoor Air 0–3, 818–827. doi:10.1111/ina.12502
Cui, X., Li, F., Xiang, J., Fang, L., Chung, M. K., Day, D. B., et al. (2018). Cardiopulmonary effects of overnight indoor air filtration in healthy non-smoking adults: A double-blind randomized crossover study. Environ. Int. 114, 27–36. doi:10.1016/j.envint.2018.02.010
Day, D. B., Xiang, J., Mo, J., Clyde, M. A., Weschler, C. J., Li, F., et al. (2018). Combined use of an electrostatic precipitator and a high-efficiency particulate air filter in building ventilation systems: Effects on cardiorespiratory health indicators in healthy adults. Indoor Air 28 (3), 360–372. doi:10.1111/ina.12447
de Kluizenaar, Y., Kuijpers, E., Eekhout, I., Voogt, M., Vermeulen, R. C. H., Hoek, G., et al. (2017). Personal exposure to UFP in different micro-environments and time of day. Build. Environ. 122, 237–246. doi:10.1016/j.buildenv.2017.06.022
Delfino, R. J., Staimer, N., and Vaziri, N. D. (2011). Air pollution and circulating biomarkers of oxidative stress. Air Qual. Atmos. Health 4 (1), 37–52. doi:10.1007/s11869-010-0095-2
Demanega, I., Mujan, I., Singer, B. C., Anđelković, A. S., Babich, F., and Licina, D. (2021). Performance assessment of low-cost environmental monitors and single sensors under variable indoor air quality and thermal conditions. Build. Environ. 187, 107415. doi:10.1016/j.buildenv.2020.107415
Dennekamp, M. (2001). Ultrafine particles and nitrogen oxides generated by gas and electric cooking. Occup. Environ. Med. 58 (8), 511–516. doi:10.1136/oem.58.8.511
Derbez, M., Wyart, G., Le Ponner, E., Ramalho, O., Ribéron, J., and Mandin, C. (2018). Indoor air quality in energy-efficient dwellings: Levels and sources of pollutants. Indoor Air 28 (2), 318–338. doi:10.1111/ina.12431
Dobbin, N. A., Sun, L., Wallace, L., Kulka, R., You, H., Shin, T., et al. (2018). The benefit of kitchen exhaust fan use after cooking - an experimental assessment. Build. Environ. 135, 286–296. doi:10.1016/j.buildenv.2018.02.039
Fang, L., Norris, C., Johnson, K., Cui, X., Sun, J., Teng, Y., et al. (2019). Toxic volatile organic compounds in 20 homes in Shanghai: Concentrations, inhalation health risks, and the impacts of household air cleaning. Build. Environ. 157, 309–318. doi:10.1016/j.buildenv.2019.04.047
Faria, A. C. D., Lopes, A. J., Jansen, J. M., and Melo, P. L. (2009). Evaluating the forced oscillation technique in the detection of early smoking-induced respiratory changes. Biomed. Eng. online 8, 22. doi:10.1186/1475-925x-8-22
Fisk, W. J. (2018). How home ventilation rates affect health: A literature review. Indoor Air 28 (4), 473–487. doi:10.1111/ina.12469
Gao, J., Jian, Y., Cao, C., Chen, L., and Zhang, X. (2015). Indoor emission, dispersion and exposure of total particle-bound polycyclic aromatic hydrocarbons during cooking. Atmos. Environ. 120, 191–199. doi:10.1016/j.atmosenv.2015.08.030
Good, N., Mölter, A., Ackerson, C., Bachand, A., Carpenter, T., Clark, M. L., et al. (2016). The Fort Collins Commuter Study: Impact of route type and transport mode on personal exposure to multiple air pollutants. J. Expo. Sci. Environ. Epidemiol. 26 (4), 397–404. doi:10.1038/jes.2015.68
Habre, R., Zhou, H., Eckel, S. P., Enebish, T., Fruin, S., Bastain, T., et al. (2018). Short-term effects of airport-associated ultrafine particle exposure on lung function and inflammation in adults with asthma. Environ. Int. 118, 48–59. doi:10.1016/j.envint.2018.05.031
Harding, E. C., Franks, N. P., and Wisden, W. (2019). The temperature dependence of sleep. Front. Neurosci. 0, 336. doi:10.3389/fnins.2019.00336
Hassanvand, M. S., Naddafi, K., Kashani, H., Faridi, S., Kunzli, N., Nabizadeh, R., et al. (2017). Short-term effects of particle size fractions on circulating biomarkers of inflammation in a panel of elderly subjects and healthy young adults. Environ. Pollut. 223, 695–704. doi:10.1016/j.envpol.2017.02.005
Hodas, N., Loh, M., Shin, H. M., Li, D., Bennett, D., McKone, T. E., et al. (2016). Indoor inhalation intake fractions of fine particulate matter: Review of influencing factors. Indoor Air 26, 836–856. doi:10.1111/ina.12268
Institute of Medicine (2000). Clearing the air: Asthma and indoor air exposures. Washington, D.C: National Academies Press, 456.
Jiang, J., Ding, X., Tasoglou, A., Huber, H., Shah, A. D., Jung, N., et al. (2021). Real-time measurements of botanical disinfectant emissions, transformations, and multiphase inhalation exposures in buildings. Environ. Sci. Technol. Lett. 8 (7), 558–566. doi:10.1021/acs.estlett.1c00390
Karakatsani, A., Samoli, E., Rodopoulou, S., Dimakopoulou, K., Papakosta, D., Spyratos, D., et al. (2017). Weekly personal ozone exposure and respiratory health in a panel of Greek schoolchildren. Environ. Health Perspect. 125 (7), 077017–7. doi:10.1289/ehp635
Karanasiou, A., Viana, M., Querol, X., Moreno, T., and de Leeuw, F. (2014). Assessment of personal exposure to particulate air pollution during commuting in European cities—recommendations and policy implications. Sci. Total Environ. 490, 785–797. doi:10.1016/j.scitotenv.2014.05.036
Karottki, D. G., Bekö, G., Clausen, G., Madsen, A. M., Andersen, Z. J., Massling, A., et al. (2014). Cardiovascular and lung function in relation to outdoor and indoor exposure to fine and ultrafine particulate matter in middle-aged subjects. Environ. Int. 73, 372–381. doi:10.1016/j.envint.2014.08.019
Kelly, F. J., and Fussell, J. C. (2017). Role of oxidative stress in cardiovascular disease outcomes following exposure to ambient air pollution. Free Radic. Biol. Med. 110, 345–367. doi:10.1016/j.freeradbiomed.2017.06.019
Klepeis, N. E., Nelson, W. C., Ott, W. R., Robinson, J. P., Tsang, A. M., Switzer, P., et al. (2001). The national human activity pattern survey (NHAPS): A resource for assessing exposure to environmental pollutants. J. Expo. Sci. Environ. Epidemiol. 11 (3), 231–252. doi:10.1038/sj.jea.7500165
Knibbs, L. D., He, C., Duchaine, C., and Morawska, L. (2012). Vacuum cleaner emissions as a source of indoor exposure to airborne particles and bacteria. Environ. Sci. Technol. 46 (1), 534–542. doi:10.1021/es202946w
Koehler, K., Good, N., Wilson, A., Mölter, A., Moore, B. F., Carpenter, T., et al. (2019). The Fort Collins commuter study: Variability in personal exposure to air pollutants by microenvironment. Indoor Air 29 (2), 231–241. doi:10.1111/ina.12533
Kumar, P., Martani, C., Morawska, L., Norford, L., Choudhary, R., Bell, M., et al. (2016). Indoor air quality and energy management through real-time sensing in commercial buildings. Energy Build. 111, 145–153. doi:10.1016/j.enbuild.2015.11.037
Levy, Ji, Dumyahn, T., and Spengler, J. D. (2002). Particulate matter and polycyclic aromatic hydrocarbon concentrations in indoor and outdoor microenvironments in Boston, Massachusetts. J. Expo. Sci. Environ. Epidemiol. 12 (2), 104–114. doi:10.1038/sj.jea.7500203
Li, L., Mullan, A. F., and Clements, N. (2020). Exposure to air pollution in indoor walkways of a suburban city. Build. Environ. 183, 107171. doi:10.1016/j.buildenv.2020.107171
Li, S., Gao, J., He, Y., Cao, L., Li, A., Mo, S., et al. (2017). Determination of time- and size-dependent fine particle emission with varied oil heating in an experimental kitchen. J. Environ. Sci. (China) 51, 157–164. doi:10.1016/j.jes.2016.06.030
Li, Z., Wen, Q., and Zhang, R. (2017). Sources, health effects and control strategies of indoor fine particulate matter (PM 2.5): A review. Sci. Total Environ. 586, 610–622. doi:10.1016/j.scitotenv.2017.02.029
Licina, D., Melikov, A., Sekhar, C., and Tham, K. W. (2015). Human convective boundary layer and its interaction with room ventilation flow. Indoor Air 25 (1), 21–35. doi:10.1111/ina.12120
Licina, D., Pantelic, J., Melikov, A., Sekhar, C., and Tham, K. W. (2014). Experimental investigation of the human convective boundary layer in a quiescent indoor environment. Build. Environ. 75, 79–91. doi:10.1016/j.buildenv.2014.01.016
Licina, D., Tian, Y., and Nazaroff, W. W. (2017a). Inhalation intake fraction of particulate matter from localized indoor emissions. Build. Environ. 123, 14–22. doi:10.1016/j.buildenv.2017.06.037
Licina, D., Tian, Y., and Nazaroff, W. W. (2017b). Emission rates and the personal cloud effect associated with particle release from the perihuman environment. Indoor Air 27 (4), 791–802. doi:10.1111/ina.12365
Lin, L. Y., Chuang, H. C., Liu, I. J., Chen, H. W., and Chuang, K. J. (2013). Reducing indoor air pollution by air conditioning is associated with improvements in cardiovascular health among the general population. Sci. Total Environ. 463–464, 176–181. doi:10.1016/j.scitotenv.2013.05.093
Liu, Q., Son, Y. J., Li, L., Wood, N., Senerat, A. M., and Pantelic, J. (2022). Healthy home interventions: Distribution of PM2.5 emitted during cooking in residential settings. Build. Environ. 207, 108448. doi:10.1016/j.buildenv.2021.108448
Liu, S., Chen, J., Zhao, Q., Song, X., Shao, D., Meliefste, K., et al. (2018). Cardiovascular benefits of short-term indoor air filtration intervention in elderly living in Beijing: An extended analysis of BIAPSY study. Environ. Res. 167, 632–638. doi:10.1016/j.envres.2018.08.026
Liu, T., Wang, Z., Huang, D. D., Wang, X., and Chan, C. K. (2018a). Significant production of secondary organic aerosol from emissions of heated cooking oils. Environ. Sci. Technol. Lett. 5 (1), 32–37. doi:10.1021/acs.estlett.7b00530
Liu, T., Wang, Z., Wang, X., and K Chan, C. (2018b). Primary and secondary organic aerosol from heated cooking oil emissions. Atmos. Chem. Phys. 18 (15), 11363–11374. doi:10.5194/acp-18-11363-2018
Ma, J., Tao, Y., Kwan, M. P., and Chai, Y. (2019). Assessing mobility-based real-time air pollution exposure in space and time using smart sensors and GPS trajectories in beijing. Ann. Am. Assoc. Geogr. 110 (2), 434–448. doi:10.1080/24694452.2019.1653752
Madureira, J., Paciência, I., Rufo, J., Ramos, E., Barros, H., Teixeira, J. P., et al. (2015). Indoor air quality in schools and its relationship with children’s respiratory symptoms. Atmos. Environ. 118, 145–156. doi:10.1016/j.atmosenv.2015.07.028
Mattila, J. M., Arata, C., Wang, C., Katz, E. F., Abeleira, A., Zhou, Y., et al. (2020). Dark chemistry during bleach cleaning enhances oxidation of organics and secondary organic aerosol production indoors. Environ. Sci. Technol. Lett. 7 (11), 795–801. doi:10.1021/acs.estlett.0c00573
Maugeri, L., Levra, S., Mellano, E., Dassetto, D., Piccioni, P., Bugiani, M., et al. (2017). Forced Oscillation Technique (FOT) vs spirometry for assessing the impact of environmental exposure in children. Eur. Respir. J. 50, PA1180. doi:10.1183/1393003.congress-2017.PA1180
Meng, Q. Y., Spector, D., Colome, S., and Turpin, B. (2009). Determinants of indoor and personal exposure to PM2.5 of indoor and outdoor origin during the RIOPA study. Atmos. Environ. 43 (36), 5750–5758. doi:10.1016/j.atmosenv.2009.07.066
Militello-Hourigan, R. E., and Miller, S. L. (2018). The impacts of cooking and an assessment of indoor air quality in Colorado passive and tightly constructed homes. Build. Environ. 144, 573–582. doi:10.1016/j.buildenv.2018.08.044
Morishita, M., Adar, S. D., D’Souza, J., Ziemba, R. A., Bard, R. L., Spino, C., et al. (2018). Effect of portable air filtration systems on personal exposure to fine particulate matter and blood pressure among residents in a low-income senior facility. JAMA Intern. Med. 48824, 1350–1358. doi:10.1001/jamainternmed.2018.3308
Nazaroff, W. W. (2004). Indoor particle dynamics. Indoor Air 14 (7), 175–183. doi:10.1111/j.1600-0668.2004.00286.x
Nørgaard, A. W., Kudal, J. D., Kofoed-Sørensen, V., Koponen, I. K., and Wolkoff, P. (2014). Ozone-initiated VOC and particle emissions from a cleaning agent and an air freshener: Risk assessment of acute airway effects. Environ. Int. 68, 209–218. doi:10.1016/j.envint.2014.03.029
Okamoto-Mizuno, K., and Mizuno, K. (2012). Effects of thermal environment on sleep and circadian rhythm. J. Physiological Anthropol. 31 (1), 14. doi:10.1186/1880-6805-31-14
Olson, D. A., and Burke, J. M. (2006). Distributions of PM2.5 source strengths for cooking from the Research Triangle Park particulate matter panel study. Environ. Sci. Technol. 40 (1), 163–169. doi:10.1021/es050359t
Omidvarborna, H., Kumar, P., Hayward, J., Gupta, M., and Nascimento, E. G. S. (2021). Low-cost air quality sensing towards smart homes. Atmosphere 1212 (4), 453453. doi:10.3390/atmos12040453
Pan, C. H., Shih, T. S., Chen, C. J., Hsu, J. H., Wang, S. C., Huang, C. P., et al. (2011). Reduction of cooking oil fume exposure following an engineering intervention in Chinese restaurants. Occup. Environ. Med. 68 (1), 10–15. doi:10.1136/oem.2009.049767
Pantelic, J., Liu, S., Pistore, L., Licina, D., Vannucci, M., Sadrizadeh, S., et al. (2020). Personal CO2 cloud: Laboratory measurements of metabolic CO2 inhalation zone concentration and dispersion in a typical office desk setting. J. Expo. Sci. Environ. Epidemiol. 30 (2), 328–337. doi:10.1038/s41370-019-0179-5
Pantelic, J., Nazarian, N., Miller, C., Meggers, F., Lee, J. K. W., and Licina, D. (2022). Transformational IoT sensing for air pollution and thermal exposures. Front. Built Environ. 8, 971523. doi:10.3389/fbuil.2022.971523
Pantelic, J., Sze-To, G. N., Tham, K. W., Chao, C. Y. H., and Khoo, Y. C. M. (2009). Personalized ventilation as a control measure for airborne transmissible disease spread. J. R. Soc. Interface 6 (6), S715–S726. doi:10.1098/rsif.2009.0311.focus
Pantelic, J., and Tham, K. W. (2013). Adequacy of air change rate as the sole indicator of an air distribution system’s effectiveness to mitigate airborne infectious disease transmission caused by a cough release in the room with overhead mixing ventilation: A case study. HVAC&R Res. 19 (8), 947–961. doi:10.1080/10789669.2013.842447
Pantelic, J., Tham, K. W., and Licina, D. (2015). Effectiveness of a personalized ventilation system in reducing personal exposure against directly released simulated cough droplets. Indoor Air 25 (6), 683–693. doi:10.1111/ina.12187
Persily, A., and de Jonge, L. (2017). Carbon dioxide generation rates for building occupants. Indoor Air 27, 868–879. doi:10.1111/ina.12383
Piedrahita, R., Coffey, E. R., Hagar, Y., Kanyomse, E., Verploeg, K., Wiedinmyer, C., et al. (2019). Attributing air pollutant exposure to emission sources with proximity sensing. Atmosphere 10 (7), 395. doi:10.3390/atmos10070395
Poon, C., Wallace, L., and Lai, A. C. K. (2016). Experimental study of exposure to cooking emitted particles under single zone and two-zone environments. Build. Environ. 104, 122–130. doi:10.1016/j.buildenv.2016.04.026
Price, P. N., Shehabi, A., Chan, R. W., and Gadgil, A. J. (2006). Indoor-outdoor air leakage of apartments and commercial buildings. California: lawrence berkeley national laboratory.
Qing, Y. M., Turpin, B. J., Korn, L., Weisel, C. P., Morandi, M., Colome, S., et al. (2005). Influence of ambient (outdoor) sources on residential indoor and personal PM2.5 concentrations: Analyses of RIOPA data. J. Expo. Analysis Environ. Epidemiol. 15 (1), 17–28. doi:10.1038/sj.jea.7500378
Reichman, R., Shirazi, E., Colliver, D. G., and Pennell, K. G. (2017). US residential building air exchange rates: New perspectives to improve decision making at vapor intrusion sites. Environ. Sci. Process. Impacts 19 (2), 87–100. doi:10.1039/c6em00504g
Rumchev, K., Soares, M., Zhao, Y., Reid, C., and Huxley, R. (2018). The association between indoor air quality and adult blood pressure levels in a high-income setting. Int. J. Environ. Res. Public Health 15 (9), 2026. doi:10.3390/ijerph15092026
Saenz, J. L., Wong, R., and Ailshire, J. A. (2018). Indoor air pollution and cognitive function among older Mexican adults. J. Epidemiol. Community Health 72 (1), 21–26. doi:10.1136/jech-2017-209704
Sagona, J. A., Weisel, C. P., and Meng, Q. (2018). Accuracy and practicality of a portable ozone monitor for personal exposure estimates. Atmos. Environ. 175, 120–126. doi:10.1016/j.atmosenv.2017.11.036
Saraga, D. E., Volanis, L., Maggos, T., Vasilakos, C., Bairachtari, K., and Helmis, C. G. (2014). Workplace personal exposure to respirable PM fraction: A study in sixteen indoor environments. Atmos. Pollut. Res. 5 (3), 431–437. doi:10.5094/apr.2014.050
Schieweck, A., Uhde, E., Salthammer, T., Salthammer, L. C., Morawska, L., Mazaheri, M., et al. (2018). Smart homes and the control of indoor air quality. Renew. Sustain. Energy Rev. 94, 705–718. doi:10.1016/j.rser.2018.05.057
See, S. W., and Balasubramanian, R. (2008). Chemical characteristics of fine particles emitted from different gas cooking methods. Atmos. Environ. 42 (39), 8852–8862. doi:10.1016/j.atmosenv.2008.09.011
Senerat, A. M., Manemann, S. M., Clements, N. S., Brook, R. D., Hassett, L. C., and Roger, V. L. (2021). Biomarkers and indoor air quality: A translational research review. J. Clin. Transl. Sci. 5 (1), e39. doi:10.1017/cts.2020.532
Sercombe, J. K., Liu-Brennan, D., Causer, S. M., and Tovey, E. R. (2007). The vertical distribution of house dust mite allergen in carpet and the effect of dry vacuum cleaning. Int. J. Hyg. Environ. Health 210 (1), 43–50. doi:10.1016/j.ijheh.2006.06.006
Shen, H., Hou, W., Zhu, Y., Zheng, S., Ainiwaer, S., Shen, G., et al. (2021). Temporal and spatial variation of PM2.5 in indoor air monitored by low-cost sensors. Sci. Total Environ. 770, 145304. doi:10.1016/j.scitotenv.2021.145304
Shin, H. M., McKone, T. E., and Bennett, D. H. (2017). Model framework for integrating multiple exposure pathways to chemicals in household cleaning products. Indoor Air 27 (4), 829–839. doi:10.1111/ina.12356
Singer, B. C., Destaillats, H., Hodgson, A. T., and Nazaroff, W. W. (2006a). Cleaning products and air fresheners: Emissions and resulting concentrations of glycol ethers and terpenoids. Indoor Air 16 (3), 179–191. doi:10.1111/j.1600-0668.2005.00414.x
Singer, B. C., Coleman, B. K., Destaillats, H., Hodgson, A. T., Lunden, M. M., Weschler, C. J., et al. (2006b). Indoor secondary pollutants from cleaning product and air freshener use in the presence of ozone. Atmos. Environ. 40 (35), 6696–6710. doi:10.1016/j.atmosenv.2006.06.005
Singer, B. C., Delp, W. W., Black, D. R., and Walker, I. (2017a). Measured performance of filtration and ventilation systems for fine and ultrafine particles and ozone in an unoccupied modern California house. Indoor Air 27 (4), 780–790. doi:10.1111/ina.12359
Singer, B. C., Pass, R. Z., Delp, W. W., Lorenzetti, D. M., and Maddalena, R. L. (2017b). Pollutant concentrations and emission rates from natural gas cooking burners without and with range hood exhaust in nine California homes. Build. Environ. 122 (2), 215–229. doi:10.1016/j.buildenv.2017.06.021
Snyder, E., Cai, B., DeMuro, C., Morrison, M. F., and Ball, W. (2018). A new single-item sleep quality scale: Results of psychometric evaluation in patients with chronic primary insomnia and depression. J. Clin. Sleep. Med. 14 (11), 1849–1857. doi:10.5664/jcsm.7478
Steinle, S., Reis, S., and Sabel, C. E. (2013). Quantifying human exposure to air pollution—moving from static monitoring to spatio-temporally resolved personal exposure assessment. Sci. Total Environ. 443, 184–193. doi:10.1016/j.scitotenv.2012.10.098
Strøm-Tejsen, P., Zukowska, D., Wargocki, P., and Wyon, D. P. (2016). The effects of bedroom air quality on sleep and next-day performance. Indoor Air 26 (5), 679–686. doi:10.1111/ina.12254
Sun, L., Wallace, L. A., Dobbin, N. A., You, H., Kulka, R., Shin, T., et al. (2018). Effect of venting range hood flow rate on size-resolved ultrafine particle concentrations from gas stove cooking. Aerosol Sci. Technol. 52 (12), 1370–1381. doi:10.1080/02786826.2018.1524572
Taylor, D. R., Pijnenburg, M. W., Smith, A. D., and De Jongste, J. C. (2006). Exhaled nitric oxide measurements: Clinical application and interpretation. Thorax 61 (9), 817–827. doi:10.1136/thx.2005.056093
Torkmahalleh, M. A., Goldasteh, I., Zhao, Y., Udochu, N. M., Rossner, A., Hopke, P. K., et al. (2012). PM 2.5 and ultrafine particles emitted during heating of commercial cooking oils. Indoor Air 22 (6), 483–491. doi:10.1111/j.1600-0668.2012.00783.x
Tran, P. T. M., Adam, M. G., Tham, K. W., Schiavon, S., Pantelic, J., Linden, P. F., et al. (2021). Assessment and mitigation of personal exposure to particulate air pollution in cities: An exploratory study. Sustain. Cities Soc. 72, 103052. doi:10.1016/j.scs.2021.103052
Vicendese, D., Dharmage, S. C., Tang, M. L. K., Olenko, A., Allen, K. J., Abramson, M. J., et al. (2015). Bedroom air quality and vacuuming frequency are associated with repeat child asthma hospital admissions. J. Asthma 52 (7), 727–731. doi:10.3109/02770903.2014.1001904
Wallace, L. A., Emmerich, S. J., and Howard-Reed, C. (2004). Source strengths of ultrafine and fine particles due to cooking with a gas stove. Environ. Sci. Technol. 38 (8), 2304–2311. doi:10.1021/es0306260
Wang, L., Xiang, Z., Stevanovic, S., Ristovski, Z., Salimi, F., Gao, J., et al. (2017). Role of Chinese cooking emissions on ambient air quality and human health. Sci. Total Environ. 589, 173–181. doi:10.1016/j.scitotenv.2017.02.124
Weisel, C. P., Fiedler, N., Weschler, C. J., Ohman-Strickland, P. A., Mohan, K. R., McNeil, K., et al. (2017). Human symptom responses to bioeffluents, short-chain carbonyls/acids, and long-chain carbonyls in a simulated aircraft cabin environment. Indoor Air 27 (6), 1154–1167. doi:10.1111/ina.12392
Xie, Y., and Zhao, B. (2018). Chemical composition of outdoor and indoor PM 2.5 collected during haze events: Transformations and modified source contributions resulting from outdoor-to-indoor transport. Indoor Air 28 (6), 828–839. doi:10.1111/ina.12503
Yamamoto, N., Shendell, D. G., Winer, A. M., and Zhang, J. (2010). Residential air exchange rates in three major US metropolitan areas: Results from the relationship among indoor, outdoor, and personal air study 1999â-2001. Indoor Air 20 (1), 85–90. doi:10.1111/j.1600-0668.2009.00622.x
Yang, T., Zhao, L., Li, W., Wu, J., and Zomaya, A. Y. (2021). Towards healthy and cost-effective indoor environment management in smart homes: A deep reinforcement learning approach. Appl. Energy 300, 117335. doi:10.1016/j.apenergy.2021.117335
Yu, H., Chen, P., Gordon, S. P., Yu, M., and Wang, Y. (2019). The association between air pollution and sleep duration: A cohort study of freshmen at a university in beijing, China. Int. J. Environ. Res. Public Health 16 (18), 3362. doi:10.3390/ijerph16183362
Yu, K. P., Yang, K. R., Chen, Y. C., Gong, J. Y., Chen, Y. P., Shih, H. C., et al. (2015). Indoor air pollution from gas cooking in five Taiwanese families. Build. Environ. 93 (P2), 258–266. doi:10.1016/j.buildenv.2015.06.024
Zhang, Q., Avalos, J., and Zhu, Y. (2014). Fine and ultrafine particle emissions from microwave popcorn. Indoor Air 24 (2), 190–198. doi:10.1111/ina.12069
Zhao, Y., and Zhao, B. (2018). Emissions of air pollutants from Chinese cooking: A literature review. Build. Simul. 11 (5), 977–995. doi:10.1007/s12273-018-0456-6
8-OHdG 8-hydroxy-2-deoxyguanosine
ANS pulmonary autonomic nervous system
ASHRAE American Society of Heating Refrigeration and Air-conditioning Engineers
COPD chronic obstructive pulmonary disease
DBP diastolic blood pressure
EoD end of the day
FeNO fractional exhaled nitric oxide
FOT Force Oscillation Technique
GPS Global Positioning System
HEPA High-Efficiency Particulate Filtration
HR heart rate
HRV heart rate variability
HVAC Heating, Ventilation, and Air Conditioning
IAQ Indoor Air Quality
IL-6 interleukin-6
IoT the Internet of Things
PAC Portable Air Cleaner
PM particulate matter
RTLS Real-Time Location Tracking System
SBP systolic blood pressure
TVOC total volatile organic compound
UFP Ultra Fine Particles
VOC volatile organic compound
CRP C-reactive protein
WASO wakefulness after sleep onset
WLL Well Living Lab
SBS Sick Building Symptoms
vWF vonWillebrand Factor
hsCRP high sensitivity C-Reactive Protein
SphygBP sphygmomanometer-based blood pressure
PPG Photoplethysmography
Keywords: indoor, outdoor pollution, indoor air, respiratory health, pulmonary health, Iot senors, air quality intervention, controls
Citation: Pantelic J, Aristizabal S, Liu Q, Senerat A, Son YJ, Byun K, Li L, Mullan A, Zhang R, Johnson BD and Clements N (2023) The impact of automated control of indoor air pollutants on cardiopulmonary health, environmental comfort, sleep quality in a simulated apartment: A crossover experiment protocol. Front. Built Environ. 9:1117992. doi: 10.3389/fbuil.2023.1117992
Received: 07 December 2022; Accepted: 17 January 2023;
Published: 08 February 2023.
Edited by:
Zhihong Pang, Louisiana State University, United StatesReviewed by:
Jinglin Jiang, Purdue University, United StatesCopyright © 2023 Pantelic, Aristizabal, Liu, Senerat, Son, Byun, Li, Mullan, Zhang, Johnson and Clements. This is an open-access article distributed under the terms of the Creative Commons Attribution License (CC BY). The use, distribution or reproduction in other forums is permitted, provided the original author(s) and the copyright owner(s) are credited and that the original publication in this journal is cited, in accordance with accepted academic practice. No use, distribution or reproduction is permitted which does not comply with these terms.
*Correspondence: Jovan Pantelic, am92YW4ucGFudGVsaWNAZGVsb3MuY29t
Disclaimer: All claims expressed in this article are solely those of the authors and do not necessarily represent those of their affiliated organizations, or those of the publisher, the editors and the reviewers. Any product that may be evaluated in this article or claim that may be made by its manufacturer is not guaranteed or endorsed by the publisher.
Research integrity at Frontiers
Learn more about the work of our research integrity team to safeguard the quality of each article we publish.