 Jun Ge
 Hiroshi Nakashima2
- 1Department of Automotive Engineering, School of Engineering, Anhui Agricultural University, Hefei, China
- 2Division of Environmental Science and Technology, Graduate School of Agriculture, Kyoto University, Kyoto, Japan
- 3Division of Environmental Science and Technology, Graduate School of Bioresources, Mie University, Tsu, Japan
In order to know the effect of varied grousers on the reaction of soil, the reaction of soil by a plate at different angles of inclination using the two-dimensional discrete element method (DEM) has been investigated. Either the simulation or the experiment, a flat iron plate with 5 × 77 × 100 (mm) was used, and the inclination angle between the plate and the soil surface ranged from 0 to 60 degrees with 15-degree intervals. According to the result, the cohesive soil model introduced in the 2D DEM could successfully replicate the experimental results considering the effects of different inclination angles of the plate and the values of the root mean square error between the simulation and the experiment were found as 6.62, 36.60, 58.63, 60.84, and 66.25 N for inclination angles from 0 to 60 degrees in the horizontal direction. Moreover, the RMSE values of 127.91, 216.06, 75.88, 110.40, and 25.49 N were obtained for the vertical direction. Overall, a minimal discrepancy was observed between the results of DEM simulation and those of experiments in the vertical component of reaction force when the inclination angle of the plate was increased.
1 Introduction
Soil reaction to running gears or tools contacting with terrain has been one of popular research subjects in terramechanics. Tractive performance should be improved for off-road vehicles, and, similarly, the resistance force on a soil-working tools needs to be reduced from a viewpoint of economical utilization of fossil fuels (Dechao & Yusu, 1992; Naderi-Boldaji et al., 2014; Yang et al., 2014; Johnson et al., 2015; Ge et al., 2016; Jiang et al., 2018).
When we focus on an interaction between soil and grouser, the soil reaction on the grouser plate has been studied by applying a semi-empirical, or parametric, approach (Bekker, 1956; Bekker, 1960; Bekker, 1969; Wong, 2001; Tiwari et al., 2010). The effect of link pitch for rigid link tracks was analyzed, and the longer link pitch caused an increase in the pull coefficient (Gao & Wong, 1993; Wong, 2010). The most effective gross traction was reported to be obtained with a ratio of grouser pitch to height in the range of 3–4 (Hata & Hosoi, 1981). Muro et al. (1988) confirmed experimentally that the ratio of grouser pitch to height to be about 3.2 to obtain maximum tractive effort in cohesive soil by using model track. By applying the parametric approach, a bounding limit of grouser height for maximum gross tractive effort was also reported (Wang et al., 2002; Wong & Huang, 2006). In addition, the effect of inclination angle on loads has also been studied in other research areas, such as Ou Scholars investigated the responses of inclined loaded piles in layered foundations, this paper proposes a generalized solution based on the principle of Minimum Potential Energy, the study is different from the object of this paper, and the research idea is the same (Ou et al., 2022).
With recent development of computer technology (Zang and Zhao, 2013), the discrete element method (DEM) proposed by Cundall & Strack (1979) has become popular for studies on contact interactions in terramechanics to fully consider the discontinuous nature of soil (Smith & Peng, 2013). For soil-grouser interactions, Oida et al. (1997) first analyzed the interaction between a single grouser shoe and cohesive soil by DEM. By adjusting the density of the element and the spring constant for contact model, they could obtain a result of gross traction comparable to their experimentally obtained results. Asaf et al. (2006), Asaf et al., 2007) applied a commercially available DEM code, PFC2D, to the analysis of link-track performance, and reported that the maximum shear stress showed linearly increasing behavior with grouser height up to 26 mm. By applying a quasi-2D experiment where a soil model of consisting of aluminum cylinders of two radii, Nakashima et al. (2015) showed that their in-house 2D DEM analysis could reproduce the experimentally obtained results of gross tractive effort. Moreover, the effect of open spaces between grousers on the gross traction of a track shoe was investigated by 2D DEM (Hettiaratchi et al., 1966; Yokoyama et al., 2020).
In general, a typical vertical grouser on the track shoe has often been studied previously as stated above (Keen et al., 2013; Zhang et al., 2018). There is also other type of grouser, called triangle grouser, used especially for weak soil condition. The prediction of gross traction for this type of grouser has not yet been studied sufficiently.
Since the oblique face of triangle grouser has two roles---one for supporting contact load and the other for generating gross traction, the observation of these vertical penetration and horizontal translation using an inclined plate should bring an insight into the interaction between the oblique face of triangle grouser and soil. As the first attempt for the numerical observation on an interaction of the triangle grouser, DEM may be applied to vertical penetration and then to horizontal translation of inclined plate. Vertical penetration of inclined plate becomes similar to plate penetration test in parametric approach when the angle of inclination is set to 0 deg (Yong & Hanna, 1977). Moreover, the horizontal translation of inclined plane resembles to the cutting of soil by flat tool when the rake angle is set smaller or equal to 90 deg (Hermawan et al., 1996; Hermawan et al., 1997; Watyotha et al., 2001). As recently studied by Murino Kobayakawa, the relationships between different rake angles and drag force changes of plates is explored using DEM from the certain point of the variation of the local volume fraction inside the shear band. And then, the reason for the observed change in drag force is explained by using a three-dimensional wedge model (Kobayakawa et al., 2020), Many previous reports could be found for such rake angles for soil-tool interactions, such as buckets (Cleary, 1998; Kuczewski & Piotrowska, 1998; Coetzee et al., 2007), plane tool (Momozu et al., 2003; Tanaka et al., 2007; Ono et al., 2013; Jiang et al., 2017; Kobayakawa et al., 2018), bulldozer blade (Shmulevich et al., 2007; Tsuji et al., 2012), and subsoiler implement (Chen et al., 2013; Wang et al., 2019a).
The properties of soil are always affected by the consisted elements (Coetzee, 2016; Coetzee, 2017). Moreover, Ono et al. (2013) investigated the effects of elemental shape on the cutting resistance of soil by a narrow flat blade using 3D DEM. Wang et al. (2019b) also investigated that the varying particle radii affected soil subsoiler interactions in the DEM models and the 7-mm-radius particles were recommended as the best choice for the Hertz-Mindlin contact with a bonding model.
The purpose of this study is to investigate the effect of the inclination angle of a flat plate on the soil reaction in the plate penetration and translation processes using 2D DEM with a cohesive soil model. Since the computational load is still high for 3D DEM, the 2D DEM was applied in this study (Nishiyama et al., 2016). For calibration of DEM parameters and comparison of accuracy, previous experimental data on plate penetration has been used.
2 Materials and methods
2.1 Plate penetration experiments
A flat iron plate measuring 5 mm × 77 mm × 100 mm (thickness, length, and width, respectively) was used for the experiment. The plate was set at different angles of inclination and the vertical and horizontal soil reaction were detected using the extended octagonal ring transducer.
A schematic diagram of the device is shown in Figure 1. As shown in the figure, the plate was driven by a hydraulic cylinder, the force and displacement of which were detected by an extended octagonal force sensor (stress concentration type) and a displacement transducer, respectively. The device was also used for validation experiments. The soil was sandy loam, which was prepared from the experimental farm field of Mie University. A direct shear test was carried out to measure the internal and external coefficient of friction, adhesive and cohesive strength. Table 1 lists the parameters of the test soil. The plate experiment was only carried out once for every inclined plate condition.
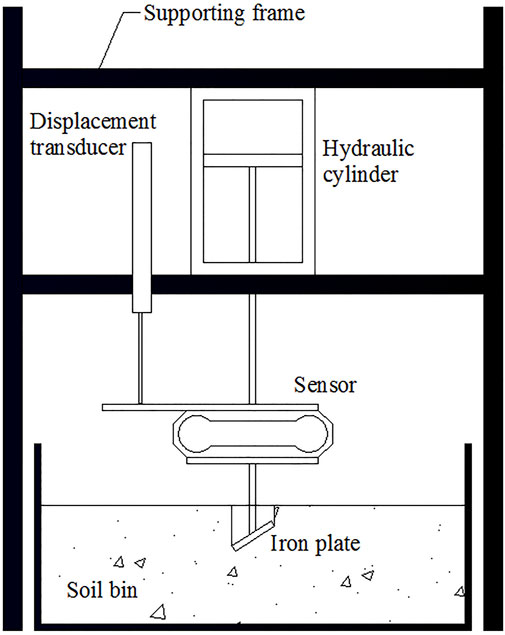
FIGURE 1. Schematic diagram of the experimental device for plate penetration experiments.
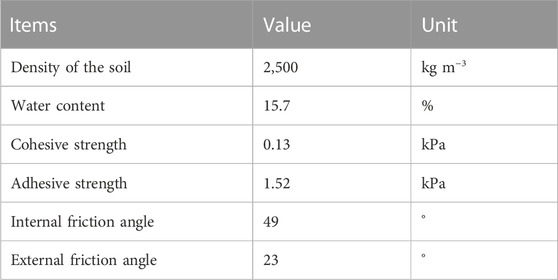
TABLE 1. Soil physical parameters in the experiment.
2.2 Cohesive soil model
The soil model was first established and calibrated to give a solid foundation to the experiment (Du et al., 2017; Chi & Kushwaha, 1990; Coetzee, 2019). To calibrate the soil model, we carried out a series of tentative penetration tests. The banding and algorithm model of the compound particles of soil clumps were decided at the beginning.
In general, in DEM, the contact forces between non-cohesive solid particles can be expressed as the Voigt model, as shown in Figure 2, where Cn and Kn are the coefficients of damping and elasticity in the normal direction, respectively, and Cs and Ks are the coefficients of damping and elasticity in the tangential direction, respectively.
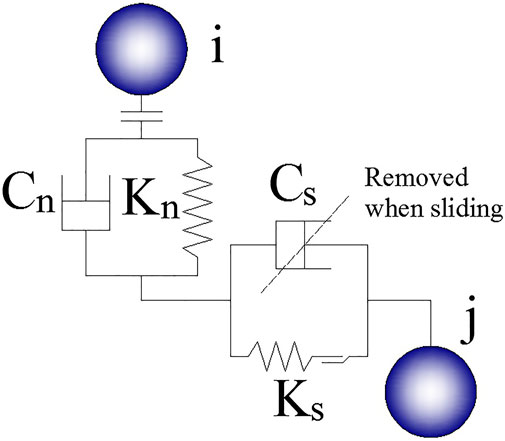
FIGURE 2. Voigt model for non-cohesive soil model.
The local coordinate system is defined as in Figure 3. A global Cartesian coordinate system x-y and a relatively moving local coordinate system us-un have been established. Based on the Voigt model and the coordinate system, the contact forces exerted on the particle i could be expressed as Eqs 1, 2:
where Fn represents the normal force, un represents the displacement and vn represents the velocity in the normal direction.
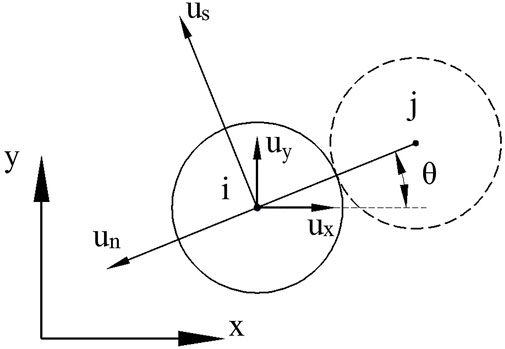
FIGURE 3. Definition of the local coordinate system in DEM.
Similarly, the tangential contact force can be expressed as follows:
where Fs represents the tangential force, μ represents the friction coefficient, fn represents the normal force, vs represents the tangential velocity component, Δx1 represents the previous displacement of particle i and Δx represents the variation quantity in the tangential direction.
There is also a rolling resistance moment M, which could be represented by Eq. 3:
where α is the coefficient of resistance moment, and b is half the contact length (Sakaguchi, 1995).
However, the target soil in the present study is a cohesive one, and cohesive soil model should be introduced, where soil particles may be clumped together by liquid bridges, as in Figure 4A. In this study, a simple model using a cohesive force fc has been added (Bui, Kobayashi, Fukagawa, Wells, 2009) (see Figure 4B).
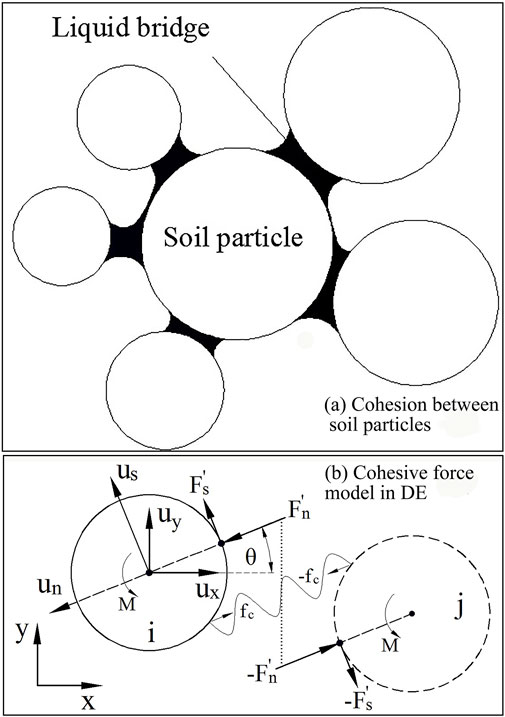
FIGURE 4. Cohesion betweens soil particles and according DE model.
The cohesive force
in which φ is the internal friction angle between the particles.
The motions of an arbitrary element should be governed by Newton’s second law for the DEM algorithm. If there is an element d, the specific calculation of the motions can be expressed by Eq. 6:
in which md, Id,
2.2.1 Analysis of the movement and forces of the plate
The plate used for penetration tests had a dimension of 5 mm × 77 mm × 100 mm (thickness, length and width, respectively). A schematic diagram of the plate movement with its inclination angle is shown in Figure 5.

FIGURE 5. Movement and the description of the plate in the soil bin.
As shown in Figure 5, the depth of penetration in the simulated tests corresponds to previous experimental tests that used sandy clay. The forces and moment of a single particle can be calculated with Eqs 3–5. If there are m particles in contact with the plate, the resultant force enacted on the plate can be expressed as follows:
where
2.3 Calibration of DEM parameters
2.3.1 Behaviour of the soil model
Figure 6 shows the result of the collapse simulation test for the non-cohesive soil model and the cohesive soil model. The initial configurations of the soil models were both at a scale of 270 mm × 500 mm (height × length), and cells had the dimensions of 100 mm × 100 mm. The cohesive force coefficient
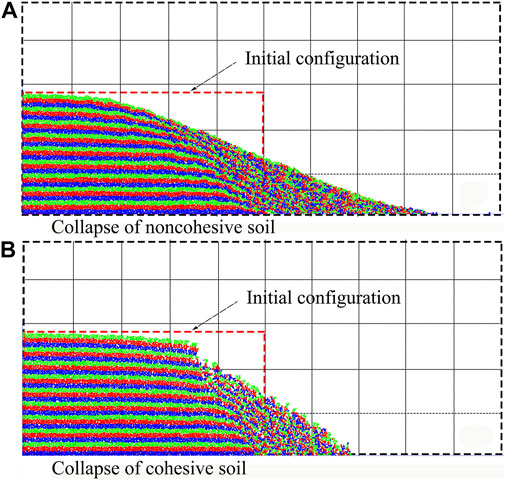
FIGURE 6. Behaviour of soil according to the DEM simulation. (A) Collapse of noncohesive soil. (B) Collapse of cohesive soil.
2.3.2 Calibration of the soil parameters
To calibrate the DEM parameters, series of penetration tests were deployed through a plate with a 0° inclination angle. The device and instruments were as same as those which were introduced in Section 2.1.
2.4 Data processing in DEM
In this study, the dimensions of the numerical soil bin were set at a length of 0.5 m, a width of 0.3 m and a height of 0.9 m. Three different radii of particles, 3.0, 2.0, and 1.2 mm, were put into the soil bin at a ratio of 1:2:3 according to the number of particles. The total number of particles for each DEM was approximately 9400. Initially, the particles were distributed randomly in the soil bin with no overlaps. The time step could be estimated using Eq. 8 and was 1 × 10⁻⁵ s in this study. Because of the existence of gravity, particles went down freely and piled up, as shown in Figure 7.
where Δt represents the timestep, mmin represents the minimum mass of element.
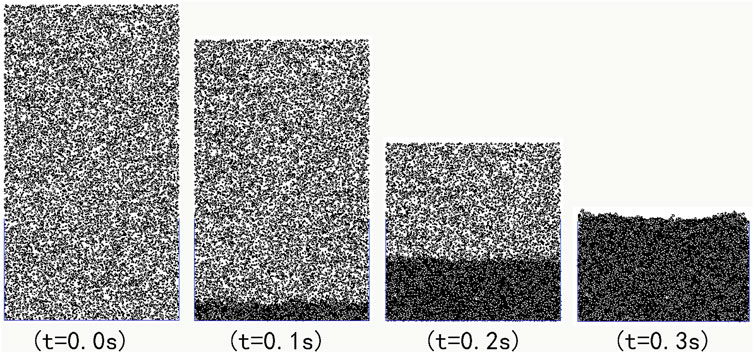
FIGURE 7. Soil particles down freely in the soil bin at t = 0.0, 0.1, 0.2, 0.3 s, respectively.
As Figure 7 shows, the soil particles were uniformly and randomly distributed in the soil bin at the initial stage. At 0.3 s, the packing procedure was completed when the soil surface was at a height of approximately 270 mm, and the bulk density became approximately 2,011.0 kg·m−3. According to the global coordinate established in Figure 5, the reaction force of soil on the plate can be decomposed into two directions: the horizontal one, fx, and the vertical one, fy.
3 Results and discussion
3.1 Result of calibration
As shown in Figure 8, gravity acceleration of 1 G (−9.81 m·s−2) was employed in DEM runs 2, 6, 7 and 8, and an increased gravity of 2 G was exerted on the particles in DEM runs 1, 3, 4 and 5. Meanwhile, the normal stiffness was changed from 2.5 × 10⁴ to 5.0 × 10⁴ kPa. According to Figure 8, a series of trial tests were carried out using the established 2D DEM model. Supplementary Table S2 summarises the root-mean-square error (RMSE) of the results between the laboratory experiment and the DEM simulation. From this table, the moduli of the soil in DEM run 2 was determined for DEM, where the normal stiffness was 1.0 × 10⁵ N·m−1 and the tangential stiffness was 2.5 × 10⁴ N·m−1, whereas the density of the model soil was set to 2,500 kg·m−3 and the coefficient of friction was set to 0.8.
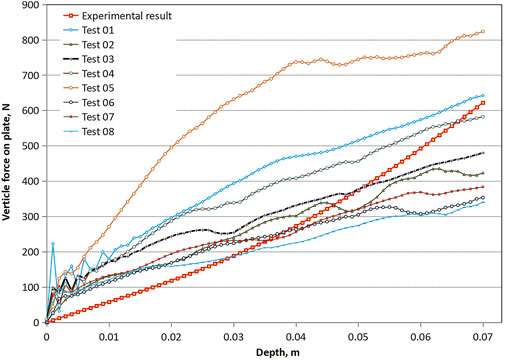
FIGURE 8. A series of trial runs for determining the parameters of the in-house program.
3.2 Soil reaction on inclined plate
As in Figure 9, the soil particles were settled in the soil bin. Then, the plate penetrated the soil at a speed of 0.01 m·s−1. The behaviour of the soil particles and the plate at the 70-mm penetration depth at different inclined angles are depicted in Figures 10A−E.
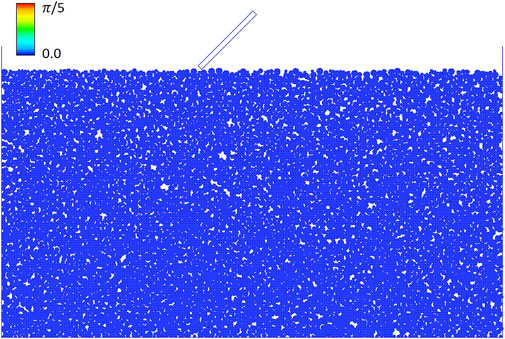
FIGURE 9. Initial configuration of the soil and the plate model in DEM calculation.
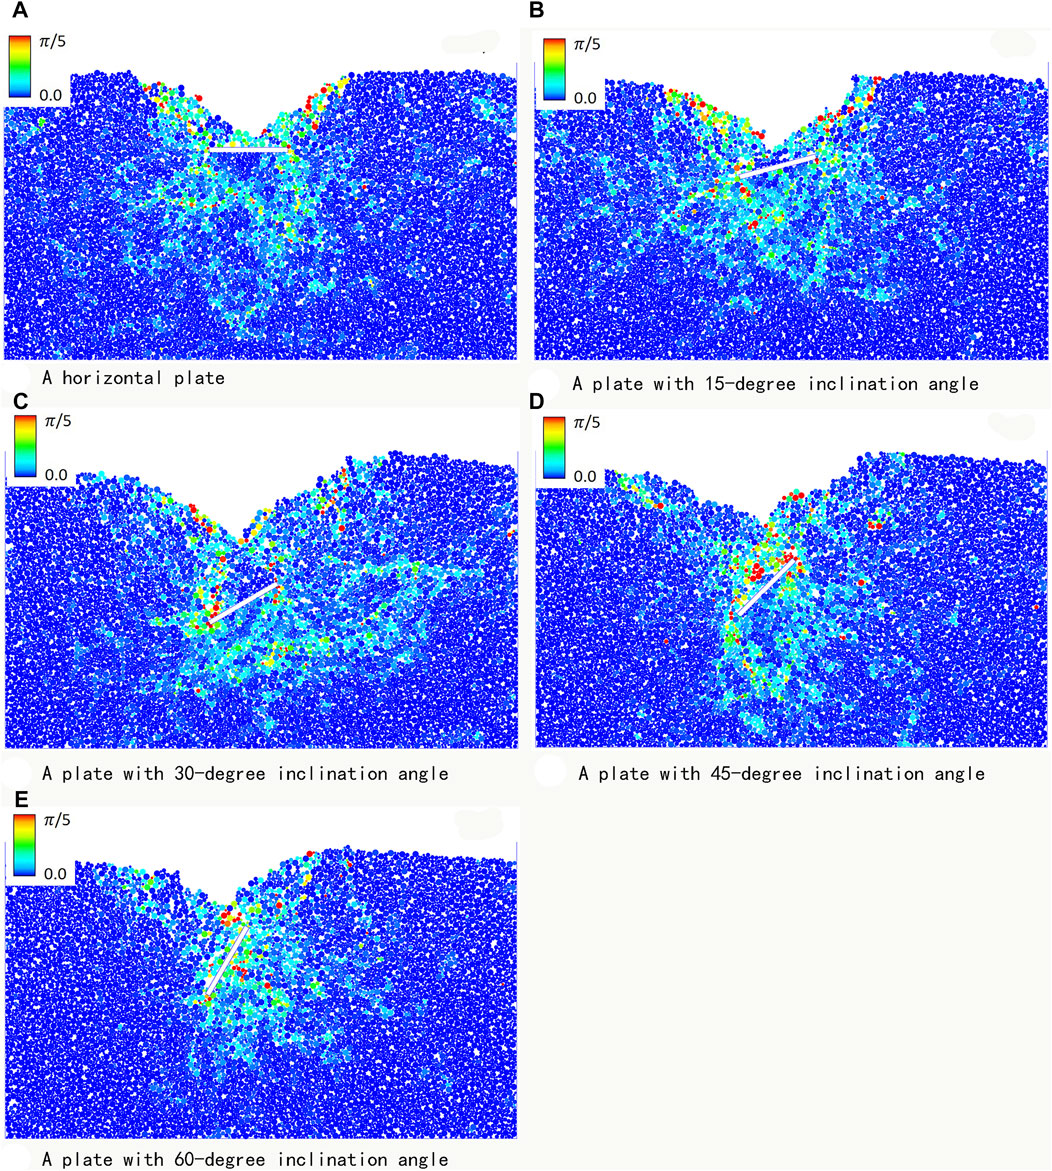
FIGURE 10. Penetration band formation of soil elements when plate varied inclination angles. (A) A horizontal plate. (B) A plate with 15-degree inclination angle. (C) A plate with 30-degree inclination angle. (D) A plate with 45-degree inclination angle. (E) A plate with 60-degree inclination angle.
The figure shows that the colours of the soil particles are related to its angular velocity: the redder the colour, the higher the angular velocity.
Figures 12–15, show comparisons of fx and fy between the simulation and experimental results.
In these figures, the simulation is named as Sim.01, Sim.02, and Sim.03. To compare the results of the experiment and the simulation, the average value of the three simulations has been calculated at each equivalent depth of the experiment.
As shown in Figure 11, the simulation well replicated the experiment in all plate reaction forces before the penetration depth of 40 mm when the inclination angle of the plate was 0°.
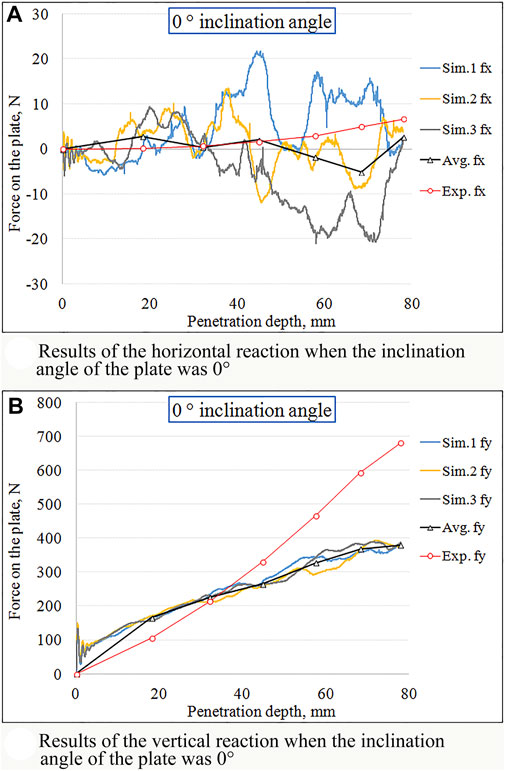
FIGURE 11. Soil reaction varying with penetration depth by horizontal plate. (A) Results of the horizontal reaction when the inclination angle of the plate was 0°. (B) Results of the vertical reaction when the inclination angle of the plate was 0°.
For the horizontal force fx, the results of the experiment and the simulation were all close to nil N when the plate was sinking into the soil. In the experiment, the vertical force fy proportionally increased with the increasing depth of penetration, and the maximum value reached 680.9 N at a depth of 78 mm.
In comparison, the vertical force of the simulation increased more slowly with the increase in the depth of penetration, and the average maximum force was 393.7 N at a depth of 72.4 mm. For the plate with 0° angle of inclination, the RMSE of fx was 4.57 N and that of fy was 85.0 N. Figure 12 shows the results for the plate with a 15° inclination angle.
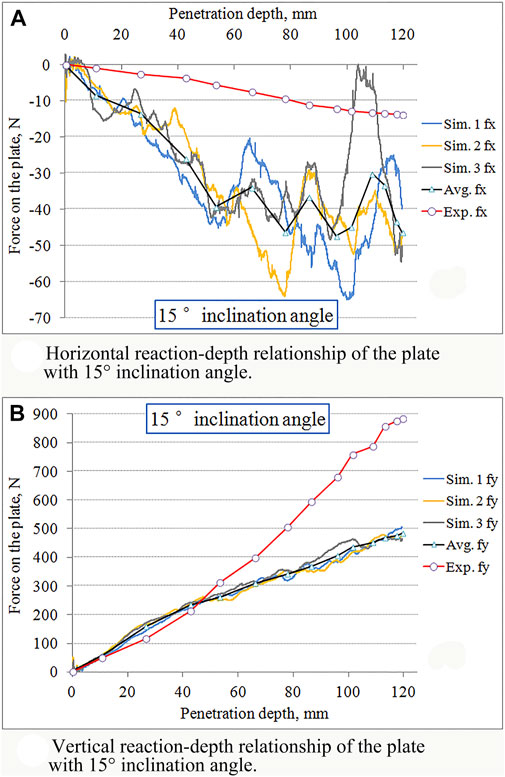
FIGURE 12. Soil reaction varying with penetration depth by 15° inclined plate. (A) Horizontal reaction-depth relationship of the plate with 15° inclination angle. (B) Vertical reaction-depth relationship of the plate with 15° inclination angle.
In the case of the plate with 15° inclination, the maximum depth of penetration in the experiment and simulation was 120 mm. As can be seen in Figure 12. At a depth of 120 mm, the minimum fx was −13.9 N for the experiment and −48.9 N at a 94.7 mm depth for the average DEM result. The RMSE of the fx component was 25.88 N.
In the vertical direction, all force components fy lie in a positive quadrant, The fy components in the experiment and the simulation increased along with an increased depth of penetration. At a depth of 120 mm, the maximum value was 885.2 N for the experiment, and at a depth of 119.5 mm, 483.1 N for the average simulation result. The RMSE of the fy component was 216.06 N.
The result for the plate with 30° angle is shown in Figure 13. As the figure shows, the maximum penetration depth was 145 mm for either the experiment or the simulation.
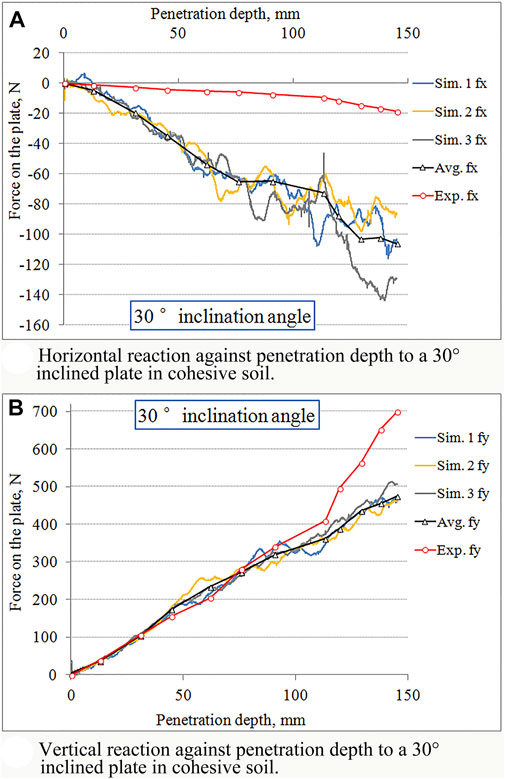
FIGURE 13. Reaction against penetration depth to a 30° inclined plate in cohesive soil. (A) Horizontal reaction against penetration depth to a 30° inclined plate in cohesive soil. (B) Vertical reaction against penetration depth to a 30° inclined plate in cohesive soil.
For the x-axis force component, the results of both the experiment and the simulation decreased with an increased plate depth. At a depth of 145 mm, the minimum fx in the experiment was −18.9 N, while the minimum in the simulation reached −111.2 N at 140.9 mm. Almost all the fx values in the simulation were less than those of the experiment when the plate penetrated the soil. Although the plate’s inclination angle was increased in 15° increments, the fx components between the plates of 15° and 30° were close to each other in the experiment. However, the simulation results reveal an obvious situation of descent on the force-depth relation when increased the penetration depth. The RMSE of the fx component was 59.95 N, which means that there is a large margin of disagreement between the results of the experiment and the simulation.
In the y-axis direction, the force component has a maximum value of 700.4 N at a 145-mm depth in the experiment and 479.0 N at a 143.4-mm depth in the average simulation result. The RMSE of the fy component was 100.25 N, implying that the results of these two methods were closer to each other than the result at the inclination angle of 15°. Nevertheless, they matched each other until 110-mm depth; then, there was an increasing deviation.
Figure 14 shows the results of the reaction to a 45° angle of inclination. As the figure demonstrates, although the horizontal force component for the experiment was less than that of the 15° and 30° angles at the same depth, there were still no significant changes.
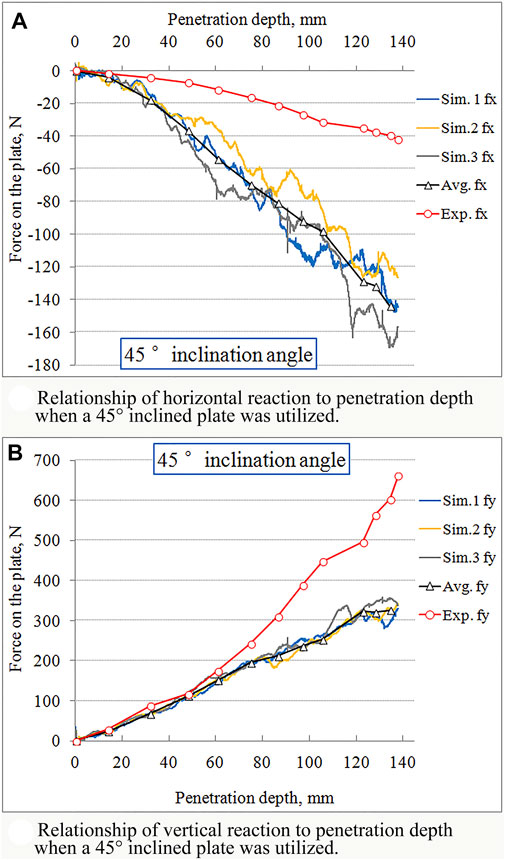
FIGURE 14. Soil reaction varying with penetration depth by 45° inclined plate. (A) Relationship of horizontal reaction to penetration depth when a 45° inclined plate was utilized. (B) Relationship of vertical reaction to penetration depth when a 45° inclined plate was utilized.
The lowest fx value of this 45° angled plate at a depth of 138 mm was −42.2 N for the experiment and −146.0 N at 136.4 mm depth for the average DEM result. Essentially, the fx component decreased with the increased penetration depth for both the experiment and the simulation.
The force component along y-axis increased proportionally with the increase of the penetration depth for either the experiment or the simulation. When the penetration depth was 138 mm, the vertical force was 661.5 N, the highest value in the experiment. Similarly, the highest value for the fy component in the average simulation result was 337.5 N at a depth of 137.6 mm. The RMSE was 163.1 N for the vertical force components. The vertical force component was replicated well in advance of the depth at 60 mm (Figure 14B). Thus, the experimental result shows a more rapid increase than that in the simulation.
The result of the reaction to a 60° angle of inclination is shown in Figure 15. The horizontal force fx on the plate in the experiment slightly decreased when the plate was penetrating the soil; by contrast, fx in the simulation decreased rapidly with the increased depth of penetration. Specifically, the minimum value for the experiment was −32.9 N at a depth of 130 mm, whereas the minimum for the simulation was −115.8 N at a 129.1-mm depth.
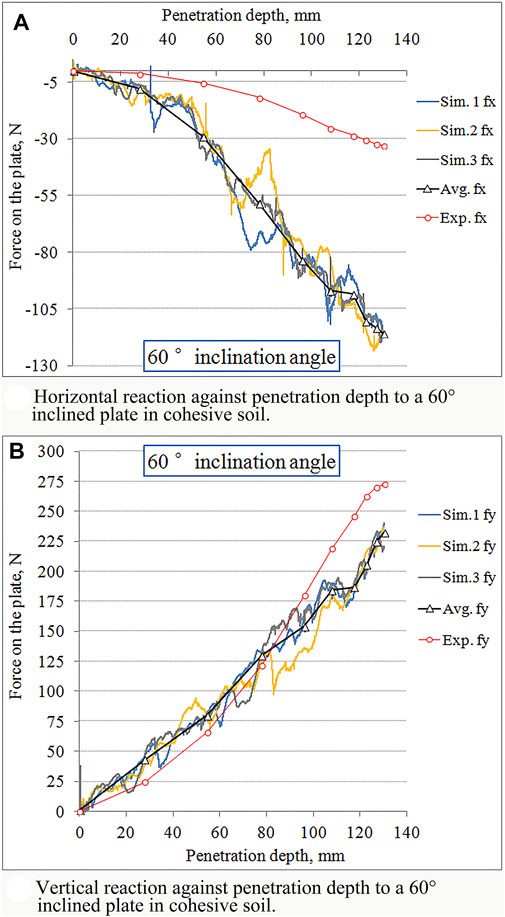
FIGURE 15. Soil reaction varying with penetration depth by 60° inclined plate. (A) Horizontal reaction against penetration depth to a 60° inclined plate in cohesive soil. (B) Vertical reaction against penetration depth to a 60° inclined plate in cohesive soil.
In Figure 15B, the simulation tests have similar results and close values to those of the experiment when they were at the same depth. Similar to the case in the previous tests of other angles of inclination, the greater the penetration depth, the larger the value of the vertical force components for the plate inclined at 60°. The maximum value was 272.3 N at 130 mm for the experiment and 232.9 N at 130 mm for the average simulation. As the results of the simulation and experiment matched well, the RMSE was 35.7 N for the vertical force.
In sum, if the plate penetrated at an equal depth, the greater the inclination angle of the plate, the lower the amount of vertical force; nevertheless, the horizontal force was increased in the negative direction according to the simulation results. In terms of the RMSE values, the vertical force has been simulated more effectively than the horizontal force. The reason for this phenomenon is perhaps the different shapes of the soil clumps that formed beneath the plate that moved together with the plate in the simulation and experiments. In addition, the experiment was under the 3D condition, and DEM was under the 2D condition. Because of the difference in degrees of freedom between 2D and 3D, the particles’ movement may cause different reactions in the vertical and horizontal directions. These differences lead to different replicated performances in the simulations of the vertical and horizontal force components. The results suggest that the 2D DEM disagreed with the experiment for fx; meanwhile, the 2D DEM agreed well in advance of the 40-mm depth between them for fy.
4 Concluding remarks
In this study, a DEM soil model was calibrated using the results of an experiment on the penetration of a plate with no inclination. After this, a series of simulation tests were carried out on the penetration of the plate inclined at angles between 0° and 60°. Based on the global coordinate system, the reaction force on the plate has been broken down into horizontal and vertical components, and the results were compared with that of the experiment. From the comparison, the following conclusions can be drawn:
(1) The 2D DEM approach could be sufficient for the demands of researching the soil reaction forces acting on a plate, which were affected by different angles of inclination. The whole process was performed successfully in this study.
(2) The cohesive soil model introduced in the 2D DEM could successfully replicate the experimental results considering the effects of different inclination angles of the plate, and from the RMSE values, the results of the soil reaction in the DEM simulation in the vertical force component were more accurate than those of the horizontal force component.
(3) Base on the limitation in this study, the greater the inclination angle of the plate, the lower the amount of vertical reaction force; whereas, horizontal force insensitively affected by the plate’s movement.
Data availability statement
The raw data supporting the conclusion of this article will be made available by the authors, without undue reservation.
Author contributions
JG, the corresponding author, is in charge of parts like data processing, and program compiling. HN, supervise the study. XW, provided the experimental data.
Funding
This research was partly supported by China Scholarship Council (CSC) and Entrepreneurship and Innovation Program of Hefei.
Acknowledgments
Appreciation also extends to HN for the supervision and XW for the experimental results.
Conflict of interest
The authors declare that the research was conducted in the absence of any commercial or financial relationships that could be construed as a potential conflict of interest.
Publisher’s note
All claims expressed in this article are solely those of the authors and do not necessarily represent those of their affiliated organizations, or those of the publisher, the editors and the reviewers. Any product that may be evaluated in this article, or claim that may be made by its manufacturer, is not guaranteed or endorsed by the publisher.
Supplementary material
The Supplementary Material for this article can be found online at: https://www.frontiersin.org/articles/10.3389/fbuil.2023.1107635/full#supplementary-material
References
Asaf, Z., Rubinstein, D., and Shmulevich, I. (2007). Determination of discrete element model parameters required for soil tillage. Soil & Tillage Res. 92, 227–242. doi:10.1016/j.still.2006.03.006
Asaf, Z., Rubinstein, D., and Shmulevich, I. (2006). Evaluation of link-track performances using DEM. J. Terramechanics 43, 141–161. doi:10.1016/j.jterra.2004.10.004
Bekker, M. G. (1969). Introduction to terrain-vehicle systems. Ann Arbor: The University of Michigan Press. Chapter 1.
Bekker, M. G. (1960). Off-the-road locomotion. Ann Arbor, MI, USA: The University of Michigan Press.
Bekker, M. G. (1956). Theory of land locomotion. Ann Arbor, Michigan: The University of Michigan Press. Chapter 4.
Bui, H. H., Kobayashi, T., Fukagawa, R., and Wells, J. C. (2009). Numerical and experimental studies of gravity effect on the mechanism of lunar excavations. J. Terramechanics 46 (3), 115–124. doi:10.1016/j.jterra.2009.02.006
Chen, Y., Munkholm, L. J., and Nyord, T. (2013). A discrete element model for soil-sweep interaction in three different soils. Soil & Tillage Res. 126, 34–41. doi:10.1016/j.still.2012.08.008
Chi, L., and Kushwaha, R. L. (1990). A non-linear 3-D finite element analysis of soil failure with tillage tools. J. Terramechanics 27 (4), 343–366. doi:10.1016/0022-4898(90)90033-i
Coetzee, C. J. (2016). Calibration of the discrete element method and the effect of particle shape. Powder Technol. 297, 50–70. doi:10.1016/j.powtec.2016.04.003
Coetzee, C. J. (2019). Particle upscaling: Calibration and validation of the discrete element method. Powder Technol. 344, 487–503. doi:10.1016/j.powtec.2018.12.022
Coetzee, C. J. (2017). Review: Calibration of the discrete element method. Powder Technol. 310, 104–142. doi:10.1016/j.powtec.2017.01.015
Coetzee, C. J., Basson, A. H., and Vermeer, P. A. (2007). Discrete and continuum modelling of excavator bucket filling. J. Terramechanics 44, 177–186. doi:10.1016/j.jterra.2006.07.001
Cundall, P. A., and Strack, O. D. L. (1979). A discrete numerical model for granular assemblies. Geotechnique 29 (1), 47–65. doi:10.1680/geot.1979.29.1.47
Dechao, Z., and Yusu, Y. (1992). A dynamic model for soil cutting by blade and tine. J. Terramechanics 29 (3), 317–327. doi:10.1016/0022-4898(92)90003-3
Du, Y., Gao, J., Jiang, L., and Zhang, Y. (2017). Numerical analysis on tractive performance of off-road wheel steering on sand using discrete element method. J. Terramechanics 71, 25–43. doi:10.1016/j.jterra.2017.02.001
Gao, Y., and Wong, J. Y. (1993). “A computer-aided method for design and performance evaluation of vehicles with righd link tracks,” in Proceedings of 11th intl. Conf. ISTVS. Lake tahoe, 76–85.
Ge, J., Wang, X., and Kito, K. (2016). Comparing tractive performance of steel and rubber single grouser shoe under different soil moisture contents. Int. J. Agric. Biol. Eng. 9 (2), 11–20.
Hata, S., and Hosoi, T. (1981). “On the effects of lug pitch upon the tractive effort about track-laying vehicles,” in Proceedings of 7th intl. Conf (Calgary: ISTVS), 255–262.
Hermawan, W., Oida, A., and Yamazaki, M. (1996). Measurement of soil reaction forces on a single movable lug. J. Terramechanics 33 (2), 91–101. doi:10.1016/0022-4898(96)00008-0
Hermawan, W., Oida, A., and Yamazaki, M. (1997). The characteristics of soil reaction forces on a single movable lug. J. Terramechanics 34 (1), 23–35. doi:10.1016/s0022-4898(97)00015-3
Hettiaratchi, D. R. P., Witney, B. D., and Reece, A. R. (1966). The calculation of passive pressure in two-dimensional soil failure. J. Agric. Eng. Res. 11 (2), 89–107. doi:10.1016/s0021-8634(66)80045-8
Jiang, M. J., Dai, Y. S., Cui, L., and Xi, B. L. (2018). Experimental and DEM analyses on wheel-soil interaction. J. Terramechanics 76, 15–28. doi:10.1016/j.jterra.2017.12.001
Jiang, M. J., Xi, B. L., Arroyo, M., and Rodriguez-Dono, A. (2017). DEM simulation of soil-tool interaction under extraterrestrial environmental effects. J. Terramechanics 71, 1–13. doi:10.1016/j.jterra.2017.01.002
Johnson, J. B., Kulchitsky, A. V., Duvoy, P., Iagnemma, K., Senatore, C., Arvidson, R. E., et al. (2015). Discrete element method simulations of Mars Exploration Rover wheel performance. J. Terramechanics 62, 31–40. doi:10.1016/j.jterra.2015.02.004
Keen, A., Hall, N., Soni, P., Gholkar, M. D., Cooper, S., and Ferdous, J. (2013). A review of the tractive performance of wheeled tractors and soil management in lowland intensive rice production. J. Terramechanics 50 (1), 45–62. doi:10.1016/j.jterra.2012.08.001
Kobayakawa, M., Miyai, S., Tsuji, T., and Tanaka, T. (2020). Interaction between dry granular materials and an inclined plate (comparison between large-scale DEM simulation and three-dimensional wedge model). J. Terramechanics 90, 3–10. doi:10.1016/j.jterra.2019.08.006
Kobayakawa, M., Miyai, S., Tsuji, T., and Tanaka, T. (2018). Local dilation and compaction of granular materials induced by plate drag. Phys. Rev. E 98, 052907.
Kuczewski, J., and Piotrowska, E. (1998). An improved model for forces on narrow soil cutting tines. Soil Tillage Res. 46 (3–4), 231–239. doi:10.1016/s0167-1987(98)00101-9
Momozu, M., Oida, A., Yamazaki, M., and Koolen, A. J. (2003). Simulation of a soil loosening process by means of the modified distinct element method. J. Terramechanics 39, 207–220. doi:10.1016/s0022-4898(03)00011-9
Muro, T., Omoto, K., and Futamura, M. (1988). Traffic performance of a bulldozer running on a weak terrain–-vehicle model test. Proc. JSCE 397 (VI-9), 151–157. doi:10.2208/jscej.1988.397_151
Naderi-Boldaji, M., Alimardani, R., Hemmat, A., Sharifi, A., Keyhani, A., Tekeste, M. Z., et al. (2014). 3D finite element simulation of a single-tip horizontal penetrometer–soil interaction, Part II: Soil bin verification of the model in a clay-loam soil. Soil & Tillage Res. 144, 211–219. doi:10.1016/j.still.2014.03.008
Nakashima, H., Yoshida, T., Wang, X. L., Shimizu, H., and Miyasaka, J. (2015). Comparison of gross tractive effort of a single grouser in two-dimensional DEM and experiment. J. Terramechanics 62, 41–50. doi:10.1016/j.jterra.2015.03.004
Nishiyama, K., Nakashima, H., Yoshida, T., Ono, T., Shimizu, H., Miyasaka, J., et al. (2016). 2D FE–DEM analysis of tractive performance of an elastic wheel for planetary rovers. J. Terramechanics 64, 23–35. doi:10.1016/j.jterra.2015.12.004
Oida, A., Schwanghart, H., Ohkubo, S., and Yamazaki, M. (1997). “Simulation of soil deformation under a track shoe by the DEM,” in Proceedings of 7th European conf. ISTVS. Ferrara, 155–162.
Ono, I., Nakashima, H., Shimizu, H., and Miyasaka, J. (2013). Investigation of elemental shape for 3D DEM modeling of interaction between soil and a narrow cutting tool. J. Terramechanics 50 (4), 265–276. doi:10.1016/j.jterra.2013.09.001
Ou, Q., Zhang, L., Ding, X., and Wang, C. (2022). Response of inclined loaded pile in layered foundation based on principle of minimum potential Energy. Int. J. Geomechanics 22 (7), 04022090.
Sakaguchi, H. (1995). Pattern formation in granular media. Doctoral Dissertation. Faculty of Agriculture, Kyoto University.
Shmulevich, I., Asaf, Z., and Rubinstein, D. (2007). Interaction between soil and a wide cutting blade using the discrete element method. Soil & Tillage Res. 97, 37–50. doi:10.1016/j.still.2007.08.009
Smith, W., and Peng, H. (2013). Modeling of wheel-soil interaction over rough terrain using the discrete element method. J. Terramechanics 50, 277–287. doi:10.1016/j.jterra.2013.09.002
Tanaka, H., Oida, A., Daikoku, M., Inooku, K., Sumikawa, O., Nagasaki, Y., et al. (2007). “DEM simulation of soil loosening process caused by a vibrating subsoiler,” in Agricultural engineering international: The CIGR ejournal manuscript PM 05 010. Vol. IX.
Tiwari, V. K., Pandey, K. P., and Pranav, P. K. (2010). A review on traction prediction equations. J. Terramechanics 47 (3), 191–199. doi:10.1016/j.jterra.2009.10.002
Tsuji, T., Nakagawa, Y., Matsumoto, N., Kadono, Y., Takayama, T., and Tanaka, T. (2012). 3-D DEM simulation of cohesive soil-pushing behavior by bulldozer blade. J. Terramechanics 49 (1), 37–47. doi:10.1016/j.jterra.2011.11.003
Wang, X., Gao, P., Yue, B., Shen, H., Fu, Z., Zheng, Z., et al. (2019a). Optimisation of installation parameters of subsoiler’ wing using the discrete element method. Comput. Electron. Agric. 162, 523–530. doi:10.1016/j.compag.2019.04.044
Wang, X. L., Ito, N., and Kito, K. (2002). Studies of grouser shoe dimension for optimum tractive performance (part 2)–-effect on thrust, rolling resistance and traction. J. Jpn. Soc. Agric. Mach. 64 (4), 55–60. in Japanese.
Wang, X., Zhang, S., Pan, H., Zheng, Z., Huang, Y., and Zhu, R. (2019b). Effect of soil particle size on soil-subsoiler interactions using the discrete element method simulations. Biosyst. Eng. 182, 138–150. doi:10.1016/j.biosystemseng.2019.04.005
Watyotha, C., Gee-Clough, D., and Salokhe, V. M. (2001). Effect of circumferential angle, lug spacing and slip on lug wheel forces. J. Terramechanics 38 (1), 1–14. doi:10.1016/s0022-4898(00)00008-2
Wong, J. Y. (2010). Terramechanics and off-road vehicle engineering: Terrain behavior, off-road vehicle performance and design 2nd ed. UK: Elsevier. Chapter 2.
Wong, J. Y., and Huang, W. (2006). “Wheels vs. tracks”–A fundamental evaluation from the traction perspective. J. Terramechanics 43, 27–42. doi:10.1016/j.jterra.2004.08.003
Yang, Y., Sun, Y., and Ma, S. (2014). Drawbar pull of a wheel with an actively actuated lug on sandy terrain. J. Terramechanics 56, 17–24. doi:10.1016/j.jterra.2014.07.002
Yokoyama, A., Nakashima, H., Shimizu, H., and Miyasaka, J. (2020). Effect of open spaces between grousers on the gross traction of a track shoe for lightweight vehicles analyzed using 2D DEM. J. Terramechanics 90, 31–40. doi:10.1016/j.jterra.2019.10.004
Yong, R. N., and Hanna, A. W. (1977). Finite element analysis of plane soil cutting. J. Terramechanics 14 (3), 103–125. doi:10.1016/0022-4898(77)90010-6
Zang, M., and Zhao, C. (2013). “Numerical simulation of rigid wheel running behavior on sand terrain,” in 2013 5th APCOM & 4th ISCM. Singapore.
Keywords: discrete element method, soil reaction, plate penetration, cohesive soil, inclination angle
Citation: Ge J, Nakashima H and Wang X (2023) Understanding of penetrating resistance on an inclined plate to cohesive soil using two-dimensional discrete element method. Front. Built Environ. 9:1107635. doi: 10.3389/fbuil.2023.1107635
Received: 30 November 2022; Accepted: 16 February 2023;
Published: 06 March 2023.
Edited by:
Nuno Cristelo, University of Trás-Os-Montes and Alto Douro, PortugalReviewed by:
Chongpu Zhai, Xi’an Jiaotong University, ChinaPeyman Aela, Beijing Jiaotong University, China
Copyright © 2023 Ge, Nakashima and Wang. This is an open-access article distributed under the terms of the Creative Commons Attribution License (CC BY). The use, distribution or reproduction in other forums is permitted, provided the original author(s) and the copyright owner(s) are credited and that the original publication in this journal is cited, in accordance with accepted academic practice. No use, distribution or reproduction is permitted which does not comply with these terms.
*Correspondence: Jun Ge, Z2VqdW5haGF1QGFoYXUuZWR1LmNu