 Andres Ramos
 Sébastien Huclin
 José Pablo Chaves1
- 1Institute for Research in Technology, ICAI School of Engineering, Universidad Pontificia Comillas, Madrid, Spain
- 2Basque Centre for Climate Change (BC3), Leioa, Spain
This paper proposes three dimensions relevant to the flexibility assessment: power gradient (i.e., ramps), power during critical hours, and energy available at different timescales. A two-phase procedure analyzes an electric system’s flexibility to cope with renewables’ integration. The first step determines the margin on the three flexibility metrics. The second one runs a cost-based operation model to determine how these dimensions are covered. The ramp margin computed shows that a critical net demand ramp happens when solar power reduces its generation, but the projected Spanish system in 2030 can still cope with this upward ramp. Different flexible technologies cover the weekly energy variation of the net demand (demand minus non-dispatchable generation). This shows the high contribution of storage hydro and open-loop pumped-hydro storage to this variation. Flexible technologies supply upward and downward ramps of the net demand. Batteries and new closed-loop pumped-hydro storage are the storage technologies that contribute the most to these net-demand ramps. We also show that existing and new closed-loop pump-hydro storage generate more in the critical net-demand hours, having a high capacity factor, almost double the batteries.
1 Introduction
Nowadays, power systems are under tremendous pressure to be decarbonized to reach different targets imposed by clean energy policies. For example, in the European Green Deal (European Commission, 2019) and Fit for 55 legislative packages, the EU and its member states are committed to cutting net greenhouse gas emissions in the EU by at least 55% by 2030, compared to 1990 levels. In 2030, 40% of the total energy consumption must be generated by renewable energy sources (VRES). One key element for achieving these goals is to increase the share of renewable generation (mainly solar photovoltaics (PV) and wind) for producing electricity. These types of renewables are not controllable or inflexible. Their integration requires other flexible technologies such as combined cycle gas turbines (CCGT), storage hydro, pumped-storage hydro, battery, solar thermal (or concentrated solar power CSP), demand side response (DSR), electric vehicle (EV) with or without a vehicle to grid (V2G) possibility, and power to hydrogen (P2H).
The phasing out of fossil fuel power plants, coupled with the increasing share of renewable energy, stands as a challenge for the System Operator according to the security of supply during peak hours (Denholm et al., 2020)1. Indeed, firm capacity was traditionally provided by thermal and hydroelectric technologies. Given that the energy mix will introduce recent technologies such as batteries, it is necessary to know how the different technologies will respond to the several needs of the power system2.
Although firmness assessment methods already exist (Madaeni, Sioshansi, and Denholm, 2013), they should be adapted since they are based on the availability of thermal and hydropower technologies. Authors in (Agency for the Cooperation of Energy Regulators, 2020; Ministerio para la Transición Ecológica y el Reto Demográfico, 2020) argue that firm capacity should be assessed jointly with the operational flexibility of power systems.
This paper analyzes how the different generating (e.g., CCGT) and storage technologies (pumped-storage hydro, battery, or solar thermal) play a role in integrating renewables by providing firmness and operational flexibility in 2030 to the Spanish system.
The main contributions of the paper are:
• propose an operational flexibility assessment method in two phases: a) to analyze ex-ante the margin of the different flexibility dimensions and, b) to determine how flexibility dimensions are covered with the various technologies;
• assessing and analyzing the flexibility contribution of each type of storage;
• application to the Spanish power system for 2030, where a high share of wind and solar generation is expected;
• sensitivity analysis of reduced hydro inflows.
The paper is organized as follows. Section 2 presents the metrics for flexibility assessment. Section 3 describes the Spanish case study characteristics for 2030 and the required flexibility needs. Section 4 presents the modeling results and how the flexibility needs are expected to be provided in the Spanish system in 2030. Section 5 concludes.
2 Flexibility assessment
To analyze the contribution of the storage technologies to the system operation, we must first introduce the definition of operational flexibility as the ability of the system to withstand the uncertainty and variability in generation and electricity demand while maintaining the desired reliability at an affordable cost (Impram, Varbak Nese, and Oral, 2020). We analyze the long-medium-term system operation with a time scope from several weeks to several years representing only the operation of the generation and storage assets (Hadi et al., 2022).
Once assumed this definition is, the next question is to define a framework to measure it: which dimensions of operational flexibility can be defined or how to measure them? Since power systems will be mainly composed of inflexible technologies, the requirements of the power system, its capabilities, and the contributions of the flexible technologies to the operational flexibility of the power system are assessed respectively to the net demand3 (Heggarty et al., 2020).
(Huclin et al., 2023) propose a conceptual framework for jointly analyzing power systems’ firmness and operational flexibility. They split the analysis among system requirements (Which flexibilities the system needs), capabilities (How much operational flexibility does the system have?), and contributions (Who and in what dimensions is the flexibility provided?). Applying the discrete Fourier transform to the net demand, the authors (Huclin et al., 2023) found that half a day, a day, and a week are the relevant time scopes for analyzing the operational flexibility dimensions in several European countries.The results obtained by (Huclin et al., 2022) are in line with similar studies focused on power system operational flexibility (Heggarty et al., 2020; Saarinen and Tokimatsu, 2021). A similar flexibility assessment framework is presented in (Lannoye, Flynn, and O’Malley, 2012). Some metrics to measure the system flexibility were proposed by (Cochran et al., 2014; Ulbig and Andersson, 2015).
It has been shown that an increased share of RES increases the range of variation of the net demand and, consequently, the flexibility requirement (Heggarty et al., 2019; Saarinen and Tokimatsu, 2021). Flexibility assessment in power systems is essentially based on these three main dimensions that measure the ability of the system to follow and balance generation with demand, see (Ulbig and Andersson, 2015; Heggarty et al., 2019):
a) Power gradient. Ramps [MW/h]
It corresponds to the power variation per unit of time. In systems with enough quick-response generation (e.g., hydropower), the time interval to analyze this metric can be 1 hour. Only systems with no generation of this type may need to deal with shorter time intervals of minutes or seconds. The primary metrics are upward and downward hourly (bi-hourly, tri-hourly) ramps of the net power demand. Analysis of other time intervals (e.g., 6 h) for the ramps for several European countries is found in (Huber, Dimkova, and Hamacher, 2014).
b) Power [MW]
In the short-term, this metric deals with the demand-supply balance at any point, with the procurement of operating reserves for balancing the short-term uncertainty due to forecast errors in generation or demand. In the medium term (weeks to months), the availability of enough generation to supply the demand is defined by the unit firmness4, which is the contribution of each unit during the critical periods5, in this paper, approximated as the peak (net) demand hours. In the long term, system adequacy is usually measured by deterministic indexes like the reserve margin (RM) or probabilistic ones like the expected energy not served (EENS), and loss of load probability (LOLP), (Billinton and Li, 1994).
c) Energy [MWh]
Integrating the demand along different time intervals (e.g., day, week, season) defines the system requirements. The net energy variation for those intervals is linked to the system storage needs and flexible generation. It can be easily observed that the demand, hydro, wind, and solar generation have strong seasonal behavior (Red Eléctrica de España, 2021). Therefore, the net energy demand will be affected, as also the flexibility requirements.
From a more practical point of view, ENTSO-e (European Network of Transmission System and Operators for Electricity, 2022a) suggests two flexibility metrics (ramps and scarcity periods) as the starting point to analyze at a European scale. They mention that ramps can be especially critical at sunset in regions with large PV generation and simultaneous demand increases. Besides, they also propose the analysis of 5-day scarcity periods (e.g., dunkelflaute, an anticyclonic gloom where almost no wind and solar energy is generated) to analyze extended periods with low weather-dependent generation.
Other potential flexibility metrics associated with real-time system operation (e.g., inertia, rate of change of frequency, area control error, etc.) or related to transfer capacities and congestion management among areas, voltage control, and power quality and other system services are out of the scope of this paper.
In this paper, we propose these two phases for assessing the operational flexibility in an electric system:
a) Margin analysis
This phase answers the question: Does the system have enough operational flexibility? For that purpose and any dimension, a margin based on the system availability of the product (i.e., net ramp, net load, net energy) and the system requirements is computed:
For example, the upward ramp margin will be the ratio between the sum of the available upward ramps of the flexible technologies and the maximum upward ramp of the net demand.
b) Flexibility in system operation
How much is the contribution of each technology to each flexibility product? The system operation is simulated by an operational model that determines the optimal operation of the system, i.e., the use of the generation and storage resources to satisfy the demand considering all the operating constraints of the generation and storage units. The model considers the limitations of thermal units (ramp up/down, minimum up/down time, minimum load, must run, etc.), hydro scheduling of hydropower plants and reservoirs, battery management constraints (e.g., state of charge and charging, and discharging processes), and operating reserve requirements. It is genuinely relevant to consider all these constraints, given that the model must represent the system operation as realistically as possible.
3 Spanish case study
The Spanish National and Climate Plan NECP (Ministerio para la Transición Ecológica y el Reto Demográfico, 2020) proposes the pathway to reach the emission reduction and increase in renewable production required for achieving the European energy policies. A similar consistent exercise is done in the National Trends scenario of the Ten-Year Network Development Plan 2022 by ENTSO-e (European Network of Transmission System and Operators for Electricity, 2022a). These studies analyze horizons 2030, 2040, and 2050. For the paper’s case study, we have selected the first horizon, 2030, as the more realistic. The case study’s wind, solar, and demand data have been taken from the TYNDP 2022 (European Network of Transmission System and Operators for Electricity, 2021). We have updated the CO2 price to 140 €/tCO2 according to the last estimations made by ENTSO-e in July 2022 (European Network of Transmission System and Operators for Electricity, 2022b).
In Table 1, we present a summary of the installed capacity and production for the different technologies according to the TYNDP 2022 and the objective scenario of the NECP. The operation in the TYNDP is represented for three scenarios (called climate years). The last row of the table shows the peak demand (left) and the installed capacity (right).
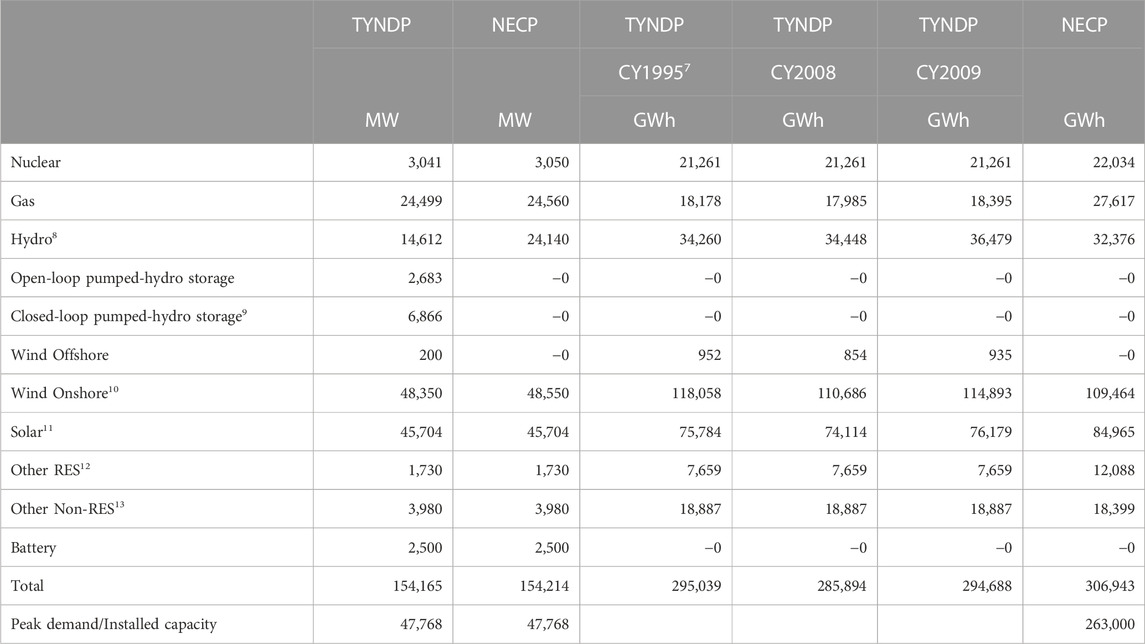
TABLE 1. Installed capacity and energy produced for the objective scenario 2030 for the Spanish system6.
We have considered for the Spanish power system 3 nuclear power plants, 50 CCGTs, 50 storage hydro programming units, three open-loop pumped-hydro storage (OL-PHS), and ten closed-loop pumped-hydro storage (CL-PHS). Solar PV and solar thermal, and wind are aggregated for all units.
3.1 Flexibility requirements
As mentioned in the introduction, one of the critical issues in power systems with large-scale solar PV penetration is the upward ramp of the net demand due to the sharp decrease of solar production at sunset. In this section, we compute the margin for the upward and downward hourly ramps as an example of the ex-ante margin analysis. Table 2 presents the maximum upward and downward ramps for 2019, the latest year with regular electrical demand. The estimated ramps for the demand, wind, solar PV, and run-of-the-river hydro, are taken from the TYNDP 2022, the climate year 1995. The ramps for solar thermal assume a generation profile corresponding to a mean solar year. The ramps of the net demand for 2030 are computed based on the hourly profile of this net demand subtracting from the demand hour by hour the non-dispatchable renewable generation (i.e., wind, solar PV, and run-of-the-river hydro).
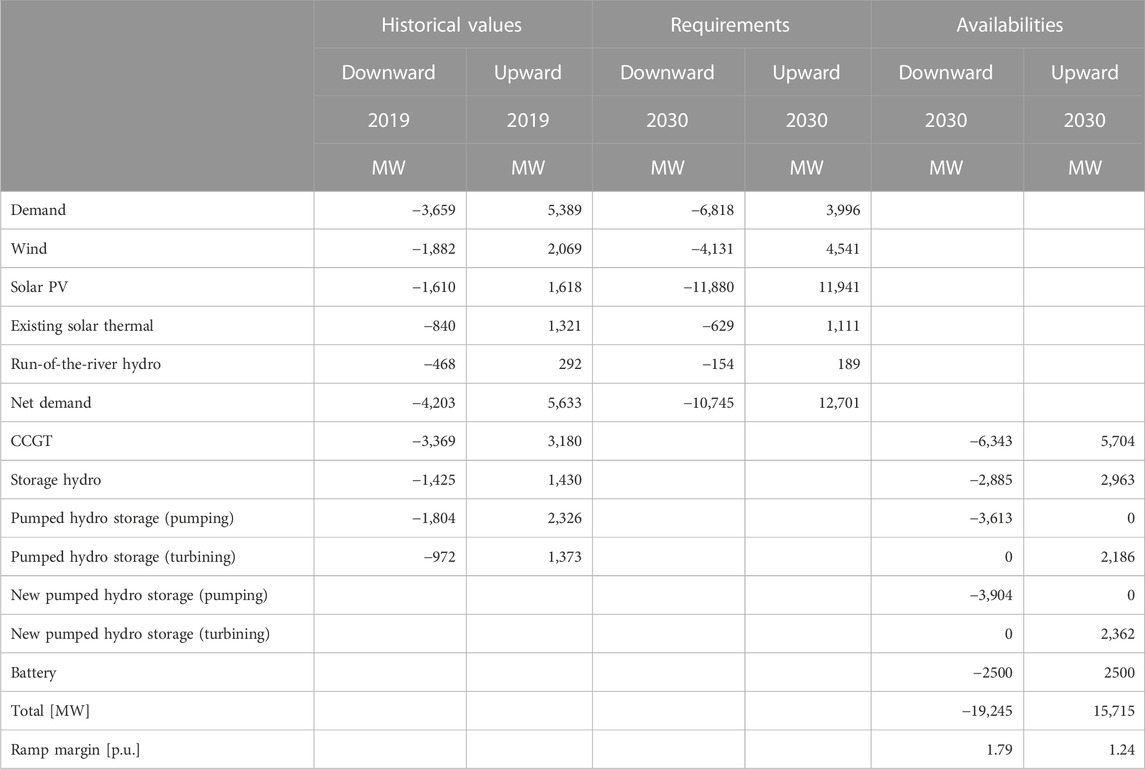
TABLE 2. Upward and downward ramps.
In the ramp margin assessment, we ignore the potential support from the neighbor systems (i.e., interconnections), France, and Portugal to be conservative in the analysis6.
For ramp availability, we7 review the reasonable maximum contribution of each technology8. The maximum historical downward and upward ramps of the CCGT9 (data taken from (Red Eléctrica de España, 2021) for 2014 up to 2022) have been −5,083 and 4,571 MW, respectively, with a maximum historical production of 17,669 MW. Given that the CCGT installed capacity is 24,500 MW and assuming a 10% derate due to forced outages, we consider that 22,050 MW will be constantly available and, applying the same proportion of the ramps to the maximum historical production, we can conservatively estimate the CCGT ramp availability as −6,343 and 5,704 MW.
For the storage hydro ramps, whose data have been taken from (Red Eléctrica de España, 2021) for 2011 up to 2019, we assume the quantiles 0.5% and 99.5% of downward and upward historical hourly ramps, which implies that generation can provide them at any hydrologic year.
The maximum historical downward and upward ramps of the existing pumped-storage hydro, whose data have been taken from (Red Eléctrica de España, 2021) for 2011 up to 2019, have been −2,233 and 3,613 MW ramps when pumping and −2,181 and 2,186 MW ramps when turbining, with a maximum historical consumption of 4,538 MW out of 5,983 MW installed and production of 4,215 MW.
New pumped-storage hydropower plants are scheduled before 2030. Applying the same proportion of the old ones, we can estimate the downward and upward ramps as −2,233 and 3,613 MW ramps when pumping as −3,904 MW and 2,362 MW when turbining.
The maximum historical downward and upward ramps of the existing solar thermal10 (data taken from (Red Eléctrica de España, 2021) for 2014 up to 2022) have been −1,228 and 1,391 MW, respectively, with a maximum historical11 production of 2,222 MW out of 2,300 MW installed12. However, it can be seen from Figure 1 that existing solar thermal is partially13 dispatchable, i.e., able to store energy even during the night, thing its output ramps. Figure 1 represents six centroids obtained by the k-means algorithm that condenses all the solar thermal production of a year. Ramps at sunrise are higher than at sunset due to the existing solar thermal storage capacity. We consider that newly installed solar thermal with 9 h of storage capacity will be able to move its output out of the critical upward ramping hours of the net demand. Consequently, we have not considered this ex-ante margin analysis.
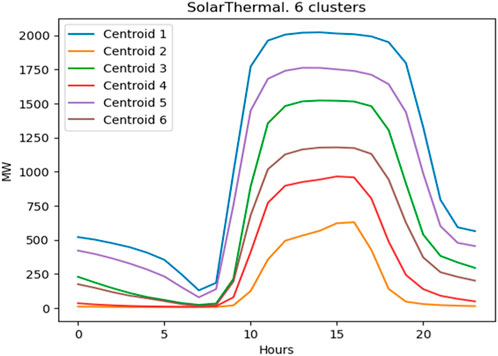
FIGURE 1. Six centroids for historical solar thermal output for 2014–2022.
The ramp requirements are computed based on the net demand ramps, which in 2030 will reach similar values to solar PV ramps, see Table 2. Figure 2 shows the estimated hourly ramps for the year 2030, and we can observe that comparable ramps appear during several-year periods. Positive values are upward ramps (i.e., demand increase), and negative ramps are the opposite. In the fall season, we observe the maximum positive and negative values. The maximum positive ramp happens around 17 h, and the minimum negative ramp at 9 h. These extreme ramps are due to a decrease (increase) in solar PV and, consequently, a sharp increase (decrease) in net demand.
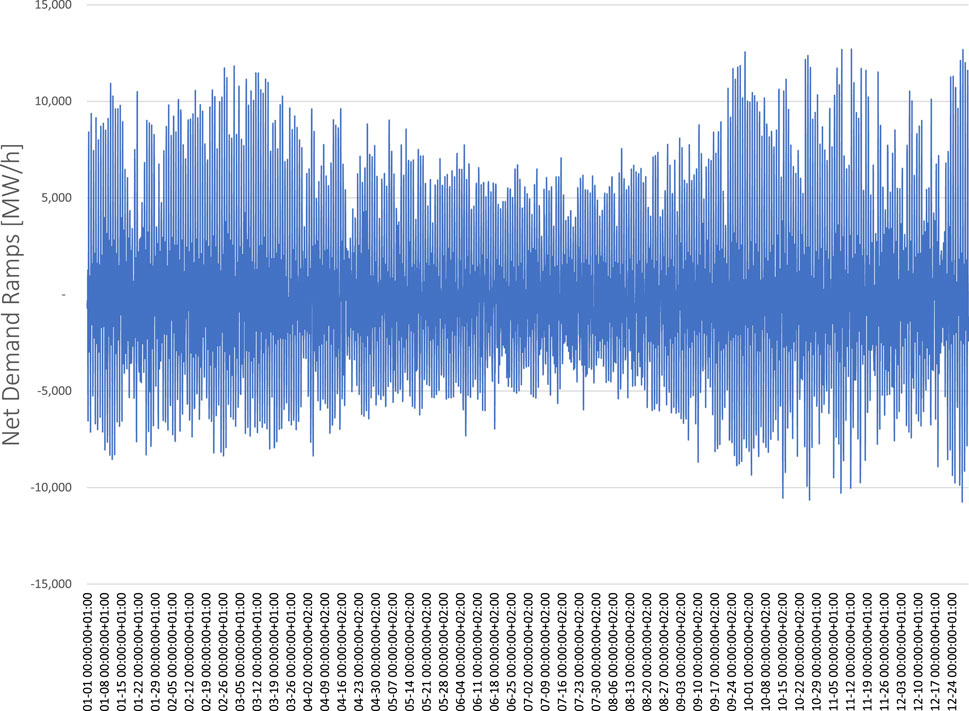
FIGURE 2. Estimated hourly ramps of the net demand for the year 2030.
Considering the system availability and requirements, the ramp margin is 179% for downward ramps and 124% for upward ones, which means that in 2030 the upward ramp can stress the system but is still manageable.
4 Modeling results: flexibility provision by different technologies
Now, we assess the deployment of the system flexibility by simulating the system operation from an economic point of view. We use the openTEPES model (Ramos, Quispe, and Lumbreras, 2022). This optimization-based model determines the hourly dispatch of the different generating units with all the detailed operating constraints to minimize the total system variable cost.
Table 3 and Figure 3 summarize the output of each technology in 2030. Wind generation has the highest energy share, followed by solar PV, CCGT, and nuclear. Then, several storage technologies, such as storage hydro, pumped-hydro storage, and solar thermal, also have essential production. According to these numbers, hydro, wind, and solar renewable generation satisfies 75% of the demand.
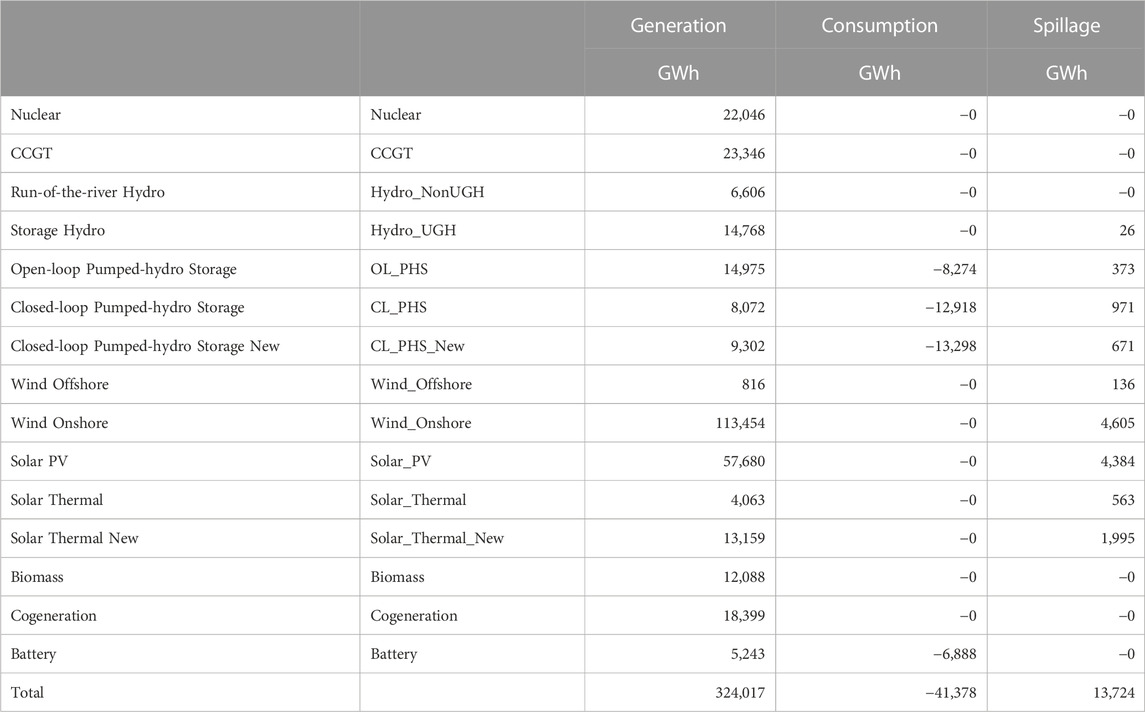
TABLE 3. Energy output for each technology.

FIGURE 3. Energy output in GWh and corresponding share for each technology.
Figure 4 shows the capacity factor of each technology, which is the energy produced divided by the installed capacity time and the year hours. The capacity factor of the PHS is higher than that of the battery, which means that the PHS’s significant storage capability overcomes the battery’s higher efficiency14. Similar observations were made by (Huclin et al., 2022).
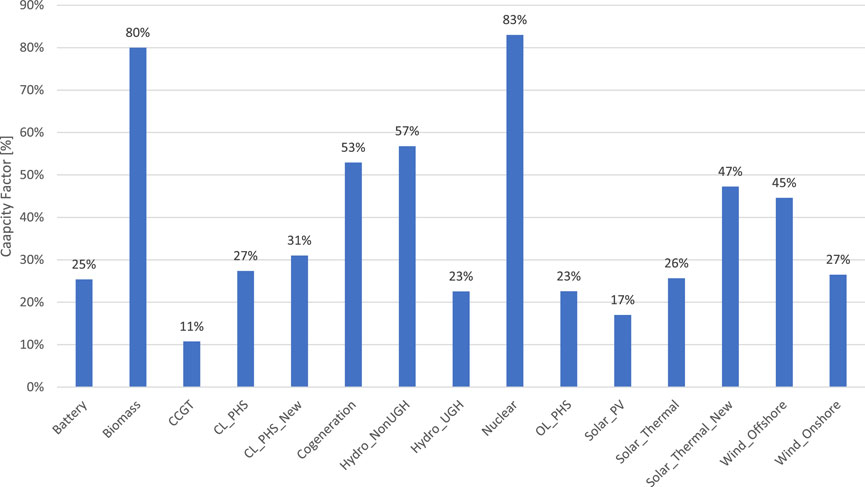
FIGURE 4. The capacity factor for each technology.
4.1 Power gradient. Ramps
Figure 5 shows the contribution of each technology to the downward and upward ramps and the ramps of the net demand. For each upward and downward ramp of the hourly net demand, we compute the contribution of each flexible technology, and then we take the mean for the entire year. As shown in Figure 5, the battery absorbs on average (for all the hours of a year) 700 MW of the upward and downward ramps; the new OL-PHS captures around 750 MW, and the existing OL-PHS around 550 MW of each one. Batteries can quickly adapt their production to the change in the net demand. OL-PHS can also play an essential role in the net demand variability but to a lesser extent. Figure 6 shows the box plot of downward and upward ramps provided by each technology, and the large dispersion of the values reaching some of them ±3000 MW can be seen.
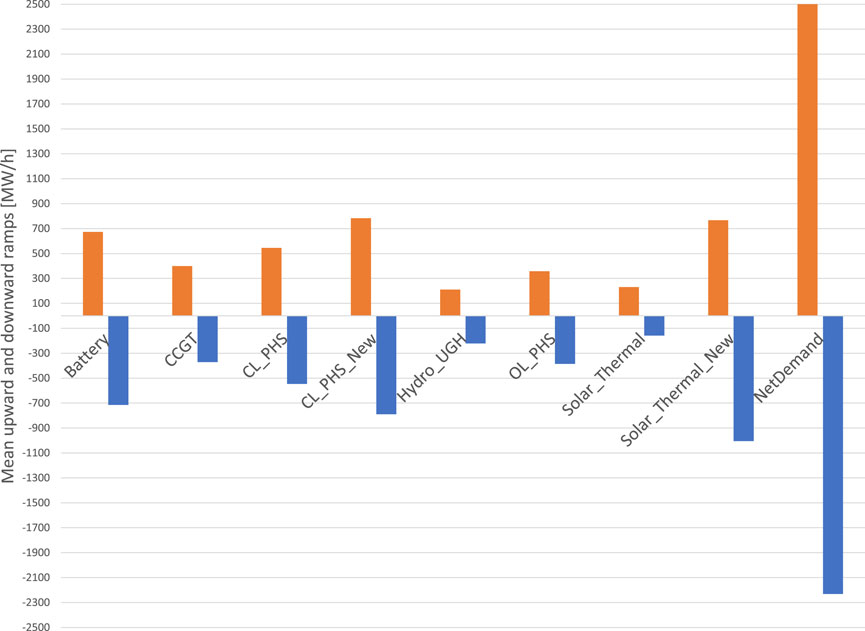
FIGURE 5. The mean value of downward and upward ramps of flexible technologies and for the net demand.
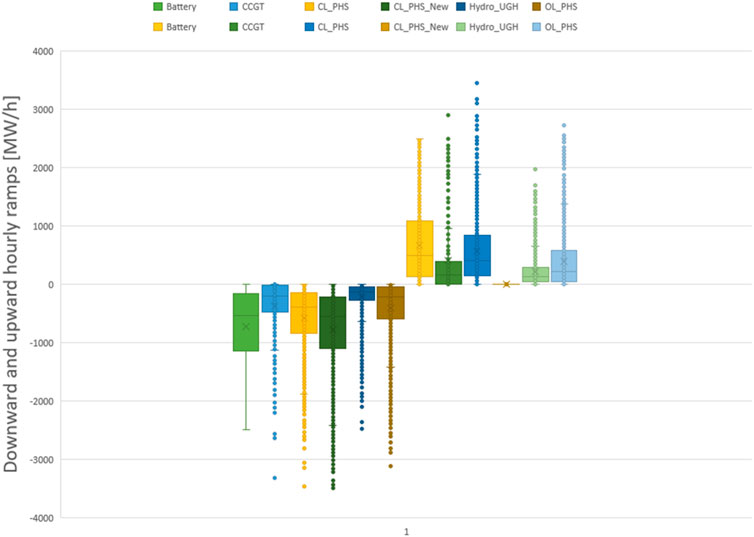
FIGURE 6. Box plot of downward and upward hourly ramps of flexible technologies.
4.2 Power. Firmness
In this section, we analyze the contribution of each technology to the net demand, especially in the potentially critical hours of the net demand. On the left side of it is almost constant for the battery, we present the net and peak demand ratio. The net demand exceeds 60% of the peak demand in a few hours, and it is negative in almost 2000 h, allowing storing of energy on a daily/weekly cycle. It is almost constant for the battery (right) shows the capacity factor of technologies based on a reduced number of critical hours (The blue bars show the capacity factor based on the highest 300 h, orange bars show the same metrics based on the 600 highest hours of the net demand, and grey bars show the annual capacity factor based on 8760 h) with the most significant values of the net demand. This is a capacity credit approximation-based method called the capacity factor-based approximation method (Madaeni, Sioshansi, and Denholm, 2013). As observed, the existing and new PHS (i.e., CL-PHS and OL-PHS) have a capacity factor of 50%–60%, while the battery holds a 25% capacity factor. This operation indicates that the contribution of the PHS is strongly oriented to produce at the critical net demand hours, given their flexibility and storage capability. Additionally, the capacity factor of PHS decreases significantly as the number of hours considered increases, while it is almost constant for the battery. It is almost constant for the battery shows the ordered net demand capacity factor (left) and capacity factor for each storage technology in the15 300 or 600 peak hours of the net demand (right)16.
A similar conclusion is obtained by (Huclin et al., 2022), which determines the contribution of each storage technology to the system’s firmness.
4.3 Weekly energy
The energy demanded every week changes throughout the year. We can observe higher demands in winter and summer weeks and moderate values in spring and fall. When considering the non-dispatchable technologies (run-of-the-river hydro, solar PV, and wind), we can observe that the resulting net demand also changes over the year. Still, the previous pattern is no longer valid because of the variation of each non-dispatchable technology.
By taking the difference between the energy of a particular week and the mean weekly energy, we analyze the variation of energy needed per week and the contribution of each technology. However, instead of dealing with energy in GWh, we convert this to weekly power in MW divided by 168 h. Higher values concerning the mean value reach 4000 MW (672 GWh in a week, approximately 10% of the weekly demand), while lower values are −3000 MW (−504 GWh weekly). Figure 7 presents how this variation of the net demand concerning its mean annual value along the 52 weeks is satisfied with variations of the different flexible technologies for their mean yearly production. For example, Figure 7 shows a high contribution of the open-loop pumped-hydro storage (OL-PHS) over many weeks. Besides, the storage hydro (Hydro-UGH) absorbs negative variations in the year’s first half and primarily positive variations in the second half, in grey in the figure. The opposite happens with the battery and the existing and new closed-loop pumped-hydro storage (CL-PHS).
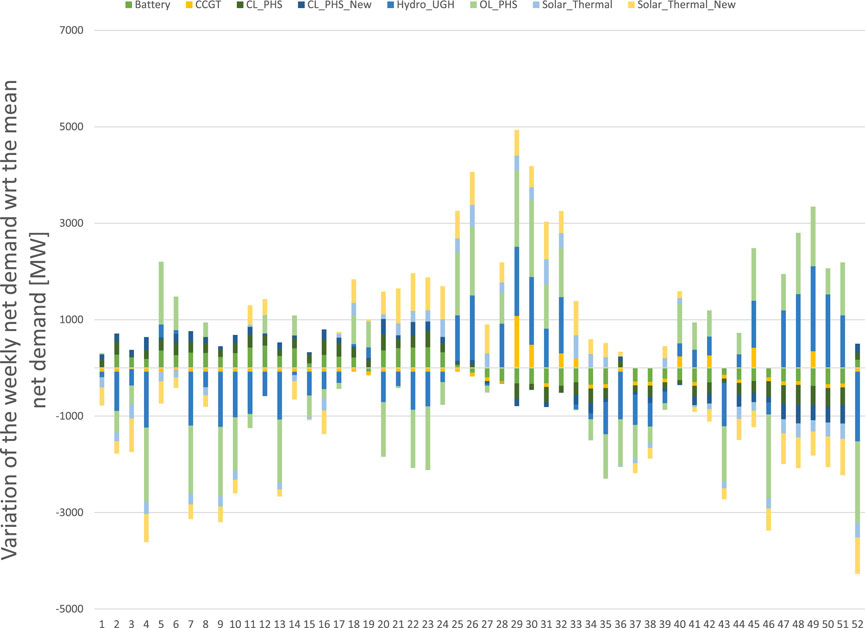
FIGURE 7. Contribution of each flexible technology to the variation of the weekly net demand with respect to the mean net demand.
Figure 8 shows the box plot of the weekly variation over the year of each technology to adapt its production to the variation of the net demand. Battery, CCGT, storage hydro, and OL-PHS have a slight negative median value while existing and new closed-loop pumped-hydro storage have a positive one. The whiskers of the OL-PHS are approximately ±1700 MW, i.e., there is a week where the output of this technology is very high, 1700 MW above its annual mean, and another week where the output is meager, 1700 MW below its yearly mean. Storage hydro and OL-PHS absorb most of the weekly variation of the net demand, followed by the contribution of batteries and CL-PHS.
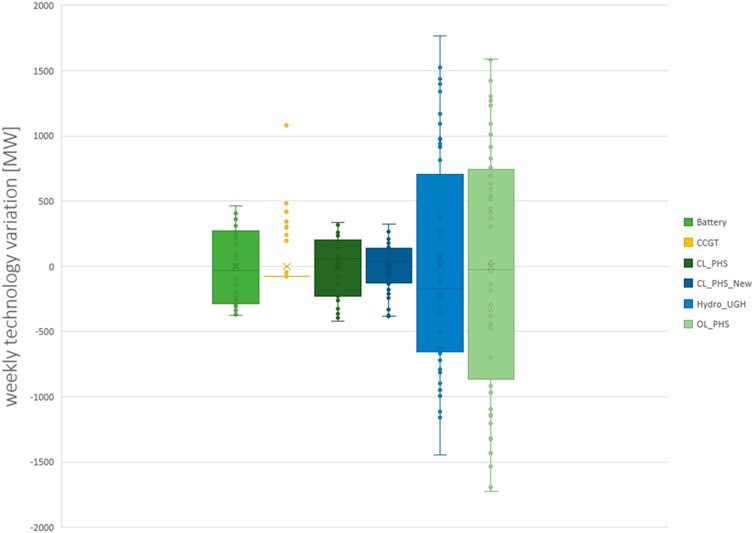
FIGURE 8. Weekly variation of each technology.
Figure 9 shows the ratio between the mean annual variation of each technology concerning its installed capacity, i.e., how the weekly variation of the net demand imposes variation of flexible technologies and how much of the technology is used on an annual average (the bars) and minimum (yellow squares) and maximum (grey circles) weekly variations. It can be observed that the maximum weekly variations are incredibly high (reaching almost 80%) for battery and CL-PHS. We can see also that the CCGT shows extremely low values. This is due to the high installed capacity of 24.5 GW, far higher than other storage technologies.
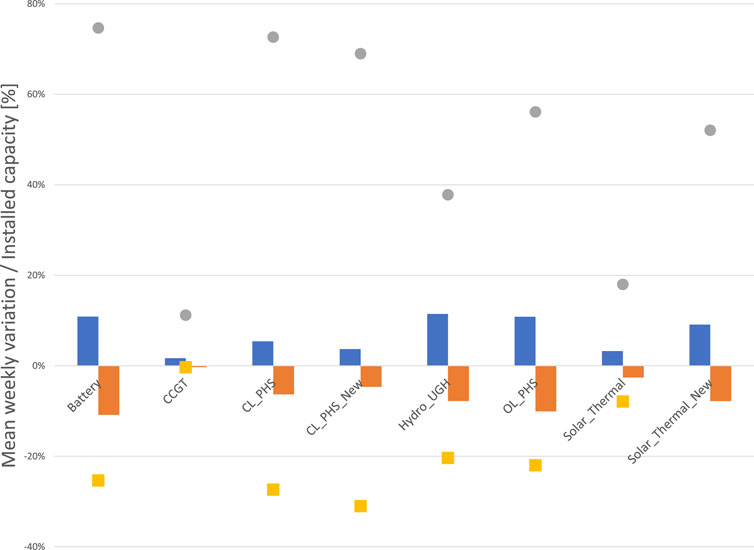
FIGURE 9. Mean weekly variation of each technology with respect to its installed capacity.
4.4 Sensitivity analysis: lower hydro inflows
Hydro generation plays a crucial role in providing flexibility to the system in two dimensions: i) it can quickly update its production to the hourly variation of the demand, and ii) it can store a large amount of energy. We have studied a case where the natural inflows have been reduced by 25%. Although in a very dry year in Spain, natural hydro inflows can be as small as half of the average year, this case study shows how the system behaves with a reduction in hydro generation.
As seen in Table 4, hydro production from run-of-the-river, storage hydro, and open-loop pumped-hydro storage in this dry year is reduced from 36,349 GWh of the average one to 28,693 GWh (Red Eléctrica de España, 2021). Consumption in storage by hydro units and batteries decreases from 41,378 GWh to 35,377 GWh, 15%. At the same time, curtailment of RES and spillage from storage reduces from 13,724 GWh to 11,399 GWh, 17%. Variable operation cost increases by 2.5%.

TABLE 4. Energy output for each technology in a dry year.
Although there is a reduction in hydro inflows, the storage systems (hydro and batteries) and CCGT contribution to the upward and downward ramps do not change dramatically, which means that these technologies are still responsible for absorbing the more significant variations in net demand, as seen in Figure 10. These small changes are due to the different hydro scheduling of natural hydro inflows.
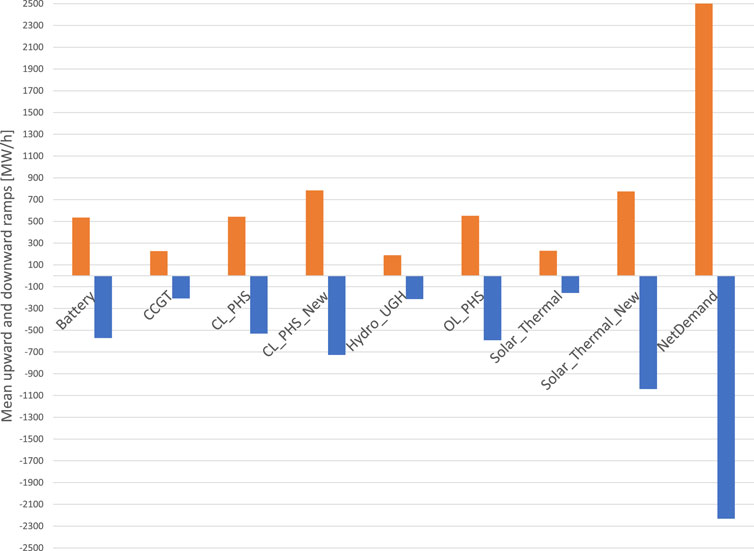
FIGURE 10. The mean value of downward and upward ramps for several technologies and the net demand.
We can also observe a similar behavior to the previous Figure 7, where the contribution of each technology to the weekly variation of the net demand. In Figure 11, the main contributors are OL-PHS (dark green bars) and storage hydro (yellow bars), as in the average hydro case study.
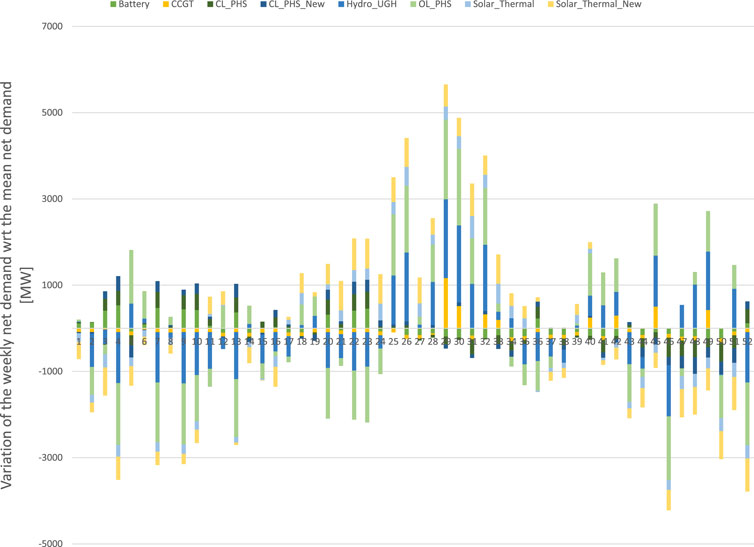
FIGURE 11. Contribution of each technology to the variation of the weekly net demand with respect to the mean net demand in a 25% drier year.
Both observations for the drier15 case reinforce the robustness of the flexible technologies in providing these variations for ramps and weekly net demand16.
5 Conclusion
In the paper, we have proposed three dimensions relevant to the flexibility assessment: power gradient, power, and energy available at different timescales. A two-phase procedure will analyze an electric system’s flexibility to cope with renewables’ integration. The first step, ex-ante, determines the margin on any dimension, and the second runs a cost-based operation model to determine how these dimensions are covered.
Upward and downward ramps of the net demand will increase dramatically in the Spanish system in 2030 due to high wind and solar share. These high ramps introduce new challenges to the operation of flexible technologies (CCGT, storage hydro, open-loop and closed-loop pumped-hydro storage, and batteries). A ramp margin of 120% in 2030 is enough to consider that the system will cope with the high ramp due to the decrease in solar PV generation at sunset or a reduction in the generation to cope with the sunrise.
Net demand ramps are evenly provided by different flexible technologies, with batteries and new CL-PHS being the main contributors.
Although the annual capacity factors of the hydro storage technologies barely exceed 20%, they enormously increase to +50% in the critical net demand hours, showing their high contribution to the system firmness. On the contrary, batteries can only play a minor role in system firmness due to their limited storage capacity.
Storage hydro and open-loop pumped-hydro storage provide weekly variation of the net demand, while other technologies contribute slightly.
The markets and the remuneration of flexibility services should incentivize the investments and the proper operations of different technologies to provide the flexibility needs of power systems highly dominated by non-dispatchable resources.
Data availability statement
The raw data supporting the conclusion of this article will be made available by the authors, without undue reservation.
Author contributions
The AR has written the paper and made the model run. The SH helped develop the concept presented and reviewed the manuscript. The JC has collaborated to analyze the results and review the manuscript. All authors contributed to the article and approved the submitted version.
Funding
This research has been carried out thanks to the Spanish Ministry of Economy and Competitiveness MINECO through BC3 María de Maeztu excellence accreditation MDM-2017-0714 Maria de Maeztu Grant. The research has also benefited from the funding of the RETOS COLABORACIÓN program of the Spanish Ministry of Science and Innovation and the Spanish State Research Agency (project “Platform of innovative models to accelerate the energy decarbonization of the economy (MODESC),” with reference number RTC2019- 007315-3).
Acknowledgments
This research has been conducted thanks to the Spanish Ministry of Economy and Competitiveness MINECO through the BC3 María de Maeztu excellence accreditation MDM-2017-0714 Maria de Maeztu Grant.
Conflict of interest
The authors declare that the research was conducted in the absence of any commercial or financial relationships that could be construed as a potential conflict of interest.
Publisher’s note
All claims expressed in this article are solely those of the authors and do not necessarily represent those of their affiliated organizations, or those of the publisher, the editors and the reviewers. Any product that may be evaluated in this article, or claim that may be made by its manufacturer, is not guaranteed or endorsed by the publisher.
Abbreviations
ACER, Agency for the cooperation of energy regulators; CSP, Solar thermal or concentrated solar power; CCGT, Combined cycle gas turbines; CL-PHS, Closed-loop pumped-hydro storage; DSR, Demand side response; EENS, Expected energy not served; ENTSO-e, European Network of Transmission System and Operators for Electricity; EU, European Union; EV, Electric vehicle; LOLP, Loss of load probability; MINECO, Ministry of Economy and Competitiveness; NECP, National and Climate Plan; OL-PHS, Open-loop pumped-hydro storage; P2H, Power to hydrogen; PV, Solar photovoltaics; RM, Reserve margin; TYNDP, Ten-Year Network Development Plan; V2G, Vehicle to grid; VRES, Variable renewable energy sources.
Footnotes
1https://www.consilium.europa.eu/en/infographics/fit-for-55-eu-emissions-trading-system/
2https://www.consilium.europa.eu/en/infographics/fit-for-55-how-the-eu-plans-to-boost-renewable-energy/
3Net demand is the demand minus the inflexible (non-dispatchable) generation (e.g., solar PV, wind, small-hydro or run-of-the-river hydro).
4In the long term, it is usually called capacity credit.
5Critical periods are usually associated to high net demand values but can also consider extreme events (severe draughts, polar weather, extreme hot temperatures, etc.)
6The reference scenario in the TYNDP is the mainland Spanish system, while the NECP deals with the national Spanish system (including Balearic and Canary Islands). That’s the reason for the small discrepancies.
7The TYNDP 2022 considers three climate years that affect the demand, hydro, wind, and solar generation.
8Includes storage (10,972 MW) and run-of-the-river (3,640 MW) hydro.
9Includes existing (3,300 MW) and foreseen (3,566 MW) closed-loop pumped-hydro storage.
10Includes existing (27,370 MW) and foreseen (21,180 MW) onshore wind power.
11Includes existing and foreseen solar PV (15,550 and 22,854 MW, respectively) and solar thermal (2,300 and 5,500 MW, respectively).
12Other RES corresponds to biomass.
13Other Non-RES corresponds to cogeneration.
14We have considered a charge/discharge efficiency of 90% for the battery, 70% for the existing CL-PHS, and 75% for the new CL-PHS.
15The upward and downward ramps have been 3,180 and −3,369 MW respectively in the last 9 years with a maximum production of 10,178 MW.
16The historical amount of energy reserves in the reservoirs have had a range between 4,500 and 14,500 GWh.
References
Agency for the Cooperation of Energy Regulators (2020). Methodology for the European Resource Adequacy Assessment. https://www.acer.europa.eu/Official_documents/Acts_of_the_Agency/Individual%20decisions%20Annexes/ACER%20Decision%20No%2024-2020_Annexes/ACER%20Decision%2024-2020%20on%20ERAA%20-%20Annex%20I.pdf.
Billinton, R., and Li, W. (1994). Reliability assessment of electric power systems using Monte Carlo methods. Boston, MA, USA: Springer US. doi:10.1007/978-1-4899-1346-3
Cochran, J., Miller, M., Zinaman, O., Milligan, M., Arent, D., Palmintier, B., et al. (2014). Flexibility in 21st century power systems. NREL/TP-6A20-61721. Golden, CO, United States: National Renewable Energy Laboratory NREL. doi:10.2172/11306301130630
Denholm, P., Jacob, N., Gagnon, P., and Cole, W. (2020). The Potential for Battery Energy Storage to Provide Peaking Capacity in the United States. Renew. Energy 151, 1269–1277. doi:10.1016/j.renene.2019.11.117
Energia (2021). Proyecto de Orden Por La Que Se Crea Un Mercado de Capacidad En El Sistema Eléctrico Español. https://energia.gob.es/_layouts/15/HttpHandlerParticipacionPublicaAnexos.ashx?k=24974.
Entso-E (2022b). Implementation Guidelines for TYNDP 2022 Based on 3rd ENTSO-E Guideline for Cost Benefit Analysis of Grid Development Projects. https://eepublicdownloads.blob.core.windows.net/public-cdn-container/tyndp-documents/TYNDP2022/public/CBA-IG.pdf.
Entso-E (2022a). TYNDP 2022 Scenario Report Version April 2022. https://2022.entsos-tyndp-scenarios.eu/.
Esios (2022). Sistema de Información Del Operador Del Sistema. https://www.esios.ree.es/en.
European Commission (2019). A European Green Deal. https://ec.europa.eu/info/strategy/priorities-2019-2024/european-green-deal_en#documents.
European Network of Transmission System and Operators for Electricity (2021). Assessment of Future Flexibility Needs. https://eepublicdownloads.azureedge.net/clean-documents/Publications/Position%20papers%20and%20reports/2021/ENTSO-E%20Position%20Paper%20on%20the%20assessement%20of%20future%20flexibility%20needs%20211019.pdf.
Hadi, M. B., Moeini-Aghtaie, M., Khoshjahan, M., and Dehghanian, P. (2022). A Comprehensive Review on Power System Flexibility: concept, services, and products. IEEE Access 10, 99257–99267. doi:10.1109/ACCESS.2022.3206428
Heggarty, T., Bourmaud, J.-Y., Girard, R., and Kariniotakis, G. (2020). Quantifying Power System Flexibility Provision. Appl. Energy 279, 115852. doi:10.1016/j.apenergy.2020.115852
Heggarty, T., Bourmaud, J.-Y., Girard, R., and Kariniotakis, G. (2019). Multi-Temporal Assessment of Power System Flexibility Requirement. Appl. Energy 238, 1327–1336. doi:10.1016/j.apenergy.2019.01.198
Huber, M., Dimkova, D., and Hamacher, T. (2014). Integration of Wind and Solar Power in Europe: assessment of flexibility requirements. Energy 69, 236–246. doi:10.1016/j.energy.2014.02.109
Huclin, S., Chaves, J. P., Ramos, A., Rivier, M., Freire-Barcelo, T., Martin-Martinez, F., et al. (2022). Exploring the Roles of Storage Technologies in the Spanish Electricity System with High Share of Renewable Energy. Energy Rep. 8, 4041–4057. doi:10.1016/j.egyr.2022.03.032
Huclin, S., Ramos, A., Chaves, J. P., Matanza, J., and Gonzalez-Eguino, M. (2023). A Methodological Approach for Assessing Flexibility and Capacity Value in Renewable-Dominated Ower Systems: A Spanish Case Study in 2030. Available at https://ssrn.com/abstract=4435075.
Impram, S., Nese, S. V., and Oral, B. (2020) Challenges of Renewable Energy Penetration on Power System Flexibility: a survey, Energy Strategy Rev 31, 100539. doi:10.1016/j.esr.2020.100539
Lannoye, E., Flynn, D., and O’Malley, M. July 2012, “Power System Flexibility Assessment — State of the Art.” In Proceedings of the IEEE Power Energy Soc. General Meet, San Diego, CA, USA, 1–6. doi:10.1109/PESGM.2012.6345375
Madaeni, S. H., Sioshansi, R., and Paul, D. (2013). Comparing Capacity Value Estimation Techniques for Photovoltaic Solar Power. IEEE J. Photovoltaics 3 (1), 407–415. doi:10.1109/JPHOTOV.2012.2217114
Ministerio para la Transición Ecológica y el Reto Demográfico (2020). Plan Nacional Integrado de Energía y Clima (PNIEC) 2021-2030. https://www.miteco.gob.es/images/es/pnieccompleto_tcm30-508410.pdf.
Ramos, A., Quispe, E., and Lumbreras, S. (2022). OpenTEPES: open-source transmission and generation expansion planning. Softwarex 18, 101070. doi:10.1016/j.softx.2022.101070
Red Eléctrica de España (2021). Renewable Energy Report 2020. https://www.ree.es/en/datos/publications/renewable-energy-report/2020-report.
Saarinen, L., and Tokimatsu, K. (2021). Flexibility metrics for analysis of power system transition - a case study of Japan and Sweden - ScienceDirect. https://www.sciencedirect.com/science/article/pii/S0960148121001282?via%3Dihub.
Keywords: flexibility assessment, flexibility margin analysis, firmness, ramps, net demand
Citation: Ramos A, Huclin S and Chaves JP (2023) Analysis of different flexible technologies in the Spain NECP for 2030. Front. Built Environ. 9:1065998. doi: 10.3389/fbuil.2023.1065998
Received: 10 October 2022; Accepted: 26 September 2023;
Published: 09 October 2023.
Edited by:
Izuru Takewaki, Kyoto Arts and Crafts University, JapanReviewed by:
Fabio Maria Montagnino, The Cyprus Institute, CyprusDomenico Laforgia, Yale University, United States
Copyright © 2023 Ramos, Huclin and Chaves. This is an open-access article distributed under the terms of the Creative Commons Attribution License (CC BY). The use, distribution or reproduction in other forums is permitted, provided the original author(s) and the copyright owner(s) are credited and that the original publication in this journal is cited, in accordance with accepted academic practice. No use, distribution or reproduction is permitted which does not comply with these terms.
*Correspondence: Andres Ramos, YW5kcmVzLnJhbW9zQGNvbWlsbGFzLmVkdQ==