 Norhan Bayomi
 John E. Fernandez
95% of researchers rate our articles as excellent or good
Learn more about the work of our research integrity team to safeguard the quality of each article we publish.
Find out more
ORIGINAL RESEARCH article
Front. Built Environ. , 04 April 2023
Sec. Urban Science
Volume 9 - 2023 | https://doi.org/10.3389/fbuil.2023.1025480
This article is part of the Research Topic Adaptive Planning of Built Environment Under Public Health and Environmental Risks View all 6 articles
One of the major climate threats is extreme heat events, as they pose significant risks to public health that are well documented in the epidemiologic literature. The effects of extreme heat events have been evident over the past years by several extreme heat events worldwide. With the growing concerns of future heat exposure, numerous studies in the literature have developed heat vulnerability indices based on determinants that have heat-related impacts. However, there has been limited guidance on heat vulnerability assessment that accounts for the impacts of the characteristics of the built environment and changes in population dynamics over time. This paper focuses on developing the methodology for heat vulnerability assessment in urban areas using System Dynamics (SD) based on integrating three levels of the physical urban environment: the urban level, the building level, and the human adaptive capacity to heat exposure. We examine the viability of using SD modeling as an approach to examine the key drivers in heat vulnerability assessment in urban areas. Thus, the paper assesses the dynamic relationship between heat vulnerability components, namely, Susceptibility, Exposure, Coping Capacity, and Adaptive Capacity, and their effect on increased or decreased vulnerability under extreme heat events. The paper concludes with an applied case study in Cairo, Egypt, to test the use of the SD approach in assessing heat vulnerability in urban settings. Results from the proposed SD model confirm the underlying hypothesis that vulnerability from heat exposure is dynamically linked to the coping and adaptive capacity of the surrounding built environment with the urban population’s socioeconomic characteristics. The main contribution of this approach is that it allows for parallel examination of the effect of the human system that simulation models cannot include and the performance of the built environment system that epidemic heat vulnerability studies cannot capture.
The IPCC Working Group II Assessment report outlined the first synthesis of vulnerability as a function of susceptibility, exposure, and adaptive capacity (Füssel and Klein, 2006). Between 2007 and 2014, the perspective on vulnerability has altered to define exposure as a spatial concept tied to the surrounding physical space (Jurgilevich et al., 2017). In climate change science, vulnerability is used to indicate the impact of a climate hazard that depends on the rate and magnitude, duration of exposure, the system’s susceptibility, and adaptive capacity (Clark W et al., 2000). Accordingly, studies have attempted to develop a framework for vulnerability assessment that considers vulnerability as a function of Susceptibility (S), Exposure (E), and adaptive capacity (AC). These four components are assessed and combined to capture the vulnerability of a climate hazard (UNFCCC, 2016). In this paper context, vulnerability is considered a function of an urban area’s susceptibility (S) to heat exposure and its coping capacity (CC) to account for short-term effects from heat exposure, and the adaptive capacity (AC) to adapt with heat exposure on the long-term, where vulnerability is calculated using Equation 1 as follows:
V represents vulnerability, S is the susceptibility, CC is coping capacity, AC is the adaptative capacity, and n is the number of indicators used. This notion of vulnerability is consistent with the Third National Climate Assessment of vulnerability: “Vulnerability is a function of the character, magnitude, and rate of climate variations to which a system is exposed, its sensitivity and adaptive capacity” (Groffman et al., 2014). In the urban context, vulnerability is denoted as context-specific, determined by the urban system’s physical characteristics, and by an individual’s behavior to adapt to heat exposure. Based on this definition, vulnerability is an endogenous characteristic of the urban systems and is determined by its adaptive capacity and susceptibility. The relationship between exposure, susceptibility, and adaptive capacity that determine vulnerability is illustrated in Figure 1.
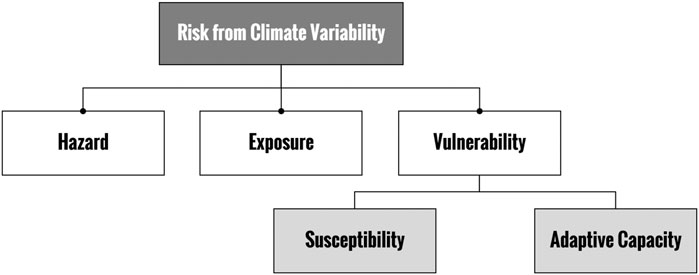
FIGURE 1. Relationship between exposure, susceptibility, and adaptive capacity in formulating vulnerability.
Hazard represents the potential occurrence of natural or human-induced climate events or impacts that may cause damage to the system, loss of life, loss of property, infrastructure, or limit the provision of essential services (Intergovernmental Panel on Climate Change (IPCC), 2013). This paper considers heatwave events as the climate-related hazard affecting the urban system. Exposure represents the presence of urban population, infrastructure, economic activities, or physical assets in settings that heat exposure can adversely affect (Sharma et al., 2016).
Susceptibility depicts two main components: a) the urban system’s physical ability to withstand exposure and related impacts, including access to adaptation means that can influence an individual’s ability to cope with heat exposure, and b) physiological and socioeconomic characteristics of the urban population that increase individuals’ risk under heat exposure (Kuras et al., 2017). Susceptibility represents the urban system’s specific properties that need to be considered during the development of adaptation strategies.
Adaptive capacity and coping capacity generally include both long-term and short-term capacity to cope and adapt to heat exposure. Coping capacity is defined as “the ability of people, organizations, and systems, using available skills and resources to face and manage adverse conditions emergencies or disasters which can contribute to the reduction of disaster risks.” (UNISDR, 2009). On the other hand, adaptive capacity is “the ability of a system to adjust to climate change to moderate potential damages, to take advantage of opportunities or to cope with the consequences.” (Intergovernmental Panel on Climate Change (IPCC), 2013). In this sense, an urban area’s adaptive capacity is determined by the ability to adjust to heat exposure in the long term. In contrast, coping capacity is represented by the available urban services (at the building scale or the urban scale) that enable populations to manage and overcome extreme conditions in the short-term range. This implies that after heat exposure brings changes to the urban system in the form of susceptibility, it will try to adjust to such changes to reduce potential damage using available resources represented as the adaptive capacity. Adaptive capacity is similar to susceptibility as it is a characteristic feature of the urban system. For instance, availability of heat-relief amenities, health services, and availability of open space depict the urban system’s adaptive capacity.
Studies on heat vulnerability assessment have relied significantly on large-scale quantitative information that does not fully capture the complexity of urban conditions or vulnerable populations (Brown and Walker, 2008). For example, a study by Romero et al. (Romero-lankao et al., 2012) has identified 13 factors in the relationship between urban vulnerability and temperature exposure. The study included human factors such as population density, age, income level, race, education, medical condition, social support, heat acclimatization, adaptation-related parameters such as access to cooling amenities and air conditioning units, and exposure magnitude represented as temperature level. However, there has been limited research on the empirical relationship between urban population susceptibility, heat exposure, and the effects of the surrounding physical environment (Arbuthnott et al., 2016). Thus, this paper examines SD’s applicability in examining the dynamic relationship between heat exposure, urban population, and the built environment. The purpose is to understand the key drivers behind increased or decreased vulnerability in a given urban setting and how these drivers can play a role in identifying suitable adaptation strategies. The proposed approach is an exploratory concept to assess how SD can be integrated into heat vulnerability assessment to allow for parallel examination of various complex parameters.
This paper reviews components of heat vulnerability and their indicators in an urban setting and how they can be implemented in a system dynamics modeling approach to examine heat vulnerability in an urban setting. The first section will describe the main indicators for susceptibility, coping, and adaptive capacity to develop a system dynamics model to estimate heat vulnerability in an urban setting. The second section discusses the proposed system dynamic model’s applicability in examining heat vulnerability in urban areas through an applied case study in Cairo, Egypt. The objective is to identify the main factors critical in assessing heat vulnerability in urban settings in the short and long term.
The temperature conditions under which heat stress can become risky to human health vary depending on the climate, the physical built environment, and population groups. Therefore, defining heat vulnerability would need to capture different conditions and dynamic relationships between climatic conditions, population, and physical urban space to develop and implement effective heat management strategies (Loughnan et al., 2010). This section outlines indicators of susceptibility, exposure, and adaptive capacity under extreme heat exposure in the urban context that is critical for heat vulnerability assessment.
Environmental conditions that pose threats to human health can occur both at the building level, indoors, and at the urban scale, outdoors (McGregor and Vanos, 2018). Numerous indices have been developed in the literature to assess heat stress for outdoor environmental factors and the human body (Havenith and Fiala, 2016). One of the most utilized indices is the universal Thermal Climate Index (UTCI). UTCI is a bioclimatic index that describes heat stress conditions exposed to the human body by accounting for a combination of meteorological factors, physiological parameters, and clothing requirements (Jendritzky et al., 2012). A study by Pappernberger et al. (Di Napoli et al., 2019) found that UTCI has proven helpful in forecasting and detecting potential heat stress up to 10 days in advance. UTCI is divided into ten classes ranging from extreme heat stress to extreme cold stress (Young, 2021). This paper considers UTCI as an indicator of outdoor heat exposure. We consider the number of consecutive hours spent outdoors where UTCI is above the comfort range (>32°C) as an indicator of outdoor exposure that can limit an individual’s ability to perform outdoor activities or go outside when indoor conditions exceed thermal comfort levels. We chose a threshold of 32°C based on a study by Pantavou et al. (Pantavou et al., 2018) that examined the range of thermal indices across warm climates and found that a range between 32°C–45°C is the range of UTCI that represents strong heat stress.
Various heat stress indices have been developed for indoor heat exposure to assess heat stress and thermal comfort. Sen and Nag (Sen and Nag, 2019) have evaluated the majority of heat stress indices developed throughout the literature to identify which indices are most suitable to assess indoor conditions for potential health risks. The study outlines that rational indices such as Standard Effective Temperature (SET) and Esk (Evaporation Through skin) are useful indicators for heat stress as they account for environmental and behavioral factors. SET has also been developed as a metric to identify livable temperatures in buildings in case of power loss or limited access to the air-conditioning system (Wilson, 2006). This paper considers SET as an indicator of heat exposure indoors. Given its prominent use as a heat threshold as part of passive survivability assessment in buildings, we consider hours where SET above 30°C an indicator of heat exposure indoors as part of heat vulnerability assessment. The threshold of 30°C is considered as the threshold of uncomfortable conditions where the human body temperature starts to fluctuate between 36.5–36.6 causing sweating (Auliciems and Szokolay, 2014).
To identify factors that contribute to the high susceptibility of an urban environment to heat, we consider a set of indicators of susceptibility that can be divided into three classes: 1) individual factors, 2) health factors, and 3) socioeconomic factors that would limit an individual’s ability to cope with heat exposure.
The literature on the individual factors linked to heat vulnerability identified numerous factors strongly linked to increased heat risk. These factors specify characteristics of individuals such as age, gender, race, and social isolation (Minson et al., 1998; Schladera et al., 2017; Engelland et al., 2020).
A) Age: Around 84 studies covering the period between 1970 and 2008 have consistently reported increased heat-related mortality with age during extreme heat events (Bark, 1998; Stafoggia et al., 2006). For example, during the 2003 European heatwave, heat-related mortality increased by 40%–100% in adults older than 65, compared to 20%–30% in middle-aged adults between 35 and 64 years (Fouillet et al., 2006; Robine et al., 2008). Children under 5 years have also been found to be more vulnerable to heat exposure, mainly due to their cognitive and immune immaturity compared to adults (American Public Health Association (APHA), 2016). In this sense, we have considered age as one of the primary indicators of human susceptibility to heat exposure, especially for populations older than 65 or younger than 5. We present age susceptibility as a normalized range between 0 and 1, where 0 indicates not susceptible, and one refers to being susceptible based on age.
B) Genders: The literature on the relationship between heat vulnerability and mortality has consistently shown that elderly populations are at higher risk than their younger counterparts (Gover, 1938; Minson et al., 1998; Schlader et al., 2015; Engelland et al., 2020). Around 84 studies covering the period between 1970 and 2008 have consistently reported increased heat-related mortality with age during extreme heat events (Bark, 1998; Stafoggia et al., 2006). Recent studies have shown that age plays a significant role in human susceptibility to heat exposure (Mayrhuber et al., 2018; Haines and Ebi, 2019; Watts et al., 2019). Early evidence was confirmed during the 2003 European heatwave with a toll of around 70,000 heat-related deaths. In France, heat-related mortality increased by 40%–100% in adults older than 65, compared to 20%–30% in middle-aged adults between 35 and 64 years (Fouillet et al., 2006; Robine et al., 2008). Research by Kenny et al. (Kenny et al., 2010; Kenny et al., 2017) has identified that increased heat vulnerability with aging is mainly explained by body thermoregulation impairment and failure to maintain stable blood pressure under extreme heat exposure. There are also findings of increased death rates and dehydration risks among infants during extreme heat exposure (Tourneux et al., 2009; WHO, 2011). This is linked to their immature thermoregulation capacity, small blood volume, and body mass. Children under 5 years have also been more vulnerable to heat exposure, mainly due to their cognitive and immune-system immaturity compared to adults (American Public Health Association (APHA), 2016). In this sense, we have considered age one of the primary indicators for human susceptibility to heat exposure, especially for populations older than 65 or younger than 5 years. We represented age susceptibility as a normalized range between 0 and 1, where 0 indicates not susceptible, and one refers to being susceptible based on age.
C) Race: Ethnic identity and race are often linked to increased heat-related vulnerability and morbidity (Ebi, 2004; Gosling et al., 2009; Ye et al., 2012; Zanobetti et al., 2013). For instance, a study conducted in New York City found that a population of color has an increased heat vulnerability (Klein Rosenthal et al., 2014). During the Chicago heatwave in 1995, Klinenberg (Klinenberg, 2003) reported that most heat-related deaths were from people of color. Another study has examined the Asian population and has found a relatively lower heat vulnerability (Basu et al., 2012). On the contrary, other studies have not found a relationship between ethnicity and heat vulnerability (Anderson and Bell, 2009). Other related factors in driving the relationship between ethnicity and heat vulnerability, such as community racial composition and neighborhood social structure represented in community groups or individual residents leading social and climatic efforts at the neighbourhood level, are reported in other studies as factors associated with heat-related (Uejio et al., 2011). Several studies in the United States found that racial differences in heat exposure tolerance were attributable to distal characteristics related to income level, poor nutrition, or limited physical health (Taylor, 2006; Yardley et al., 2011; Hansen et al., 2013). Other related parameters are also associated with the surrounding built environment, such as poor building thermal performance, sparse vegetation, or limited access to air conditioning units (Harlan et al., 2006; Ruiz et al., 2013). Although numerous studies have identified a strong relationship between ethnicity and increased heat-related vulnerability, race should be considered a proxy for cultural isolation. For example, ethnicity can drive reluctance to commute to a cooling community center due to a lack of standard social norms or cultural background similarities (Schwartz, 2005; Sampson et al., 2013). Therefore, we consider race as a factor for heat vulnerability assessment for available social community structure, where race without surrounding social structure is represented as one for susceptible and race with support from surrounding social systems as 0, indicating not susceptible.
D) Social isolation: In several heat vulnerability studies, social isolation was linked to increased health effects during heatwaves (Klinenberg, 2003). Literature has reported that individuals living alone, single, unmarried, or widowed were at higher risk of extreme temperature exposure (Fouillet et al., 2006; Hansen et al., 2011; Bouchama et al., 2012; Mayrhuber et al., 2018). Klinenberg (Klinenberg, 2003) has also reported increased death among residents living alone during the 2005 Chicago heat. Social isolation is also linked to increased heat vulnerability due to the direct effect on cognitive, physical, or mental impairment. Therefore, we consider social isolation as a factor in increased susceptibility, where any family size less than two residents indicate isolation and thus is represented by one for susceptible.
Several studies have identified an association between specific health characteristics and increased heat risk (Basu, 2009; Gosling et al., 2009; Oudin Åström et al., 2011; Turner et al., 2012; Ye et al., 2012; Kravchenko et al., 2013; Yardley et al., 2013). Health factors related to increased susceptibility to heat exposure include medical condition, physical disability, drug or alcohol abuse, and mental health. Thus, we consider any pre-existing health condition, drug or alcohol abuse, and mental health as one to reflect being susceptible to heat exposure.
A) Medical condition: Studies have found that cardiovascular problems, diabetes, and respiratory disorders have contributed to the increased risk from heat exposure (Bouchama et al., 2012; Nitschke et al., 2013; Tran et al., 2013; Zanobetti et al., 2013; Zhang et al., 2013). Other studies have confirmed the relationship between pre-existing conditions and hospital visits during extreme heat events (Foroni et al., 2007; Pillai et al., 2014). Therefore, we consider pre-existing medical conditions as one of the primary human susceptibility to heat exposure (Gronlund, 2014).
B) Physical disability: Multiple inequalities increase climate change vulnerability in populations with disabilities (Gaskin et al., 2017). Research findings have shown that people with disabilities experience greater pain and fatigue during extreme temperatures (Field et al., 2012). These people are more vulnerable due to their limited access to adaptation and mitigation responses, reducing their resilience to extreme heat. Several studies have also identified sensory and physical impairment as contributing factors to increasing vulnerability to heat exposure (Baker, 2002; Maltais et al., 2004). Finally, limited evidence was found that associates increased vulnerability in population with sensory impairments or intellectual disability; however, these populations are still considered susceptible compared to healthy individuals in the sense of not comprehending the surrounding risks or acting to adapt (Gosling et al., 2009; Lazrus et al., 2012; Christensen, 2013).
C) Drug or alcohol abuse: Studies have found a relationship between heat exposure risk and alcohol consumption [(Trang et al., 2016)]. The increased use of alcohol was found to affect thermoregulation under high temperatures and, consequently, increase heat vulnerability. In addition, recent studies have shown increased use of alcohol consumption and drug abuse during heatwave events, driving higher susceptibility for people with alcoholism or drug abuse history (Hansen et al., 2008; Cusack et al., 2011).
D) Mental health: Exposure to high temperatures may affect the body’s thermoregulation threshold due to acute reactions such as stress hormone release due to excessive exposure (Simister and Cooper, 2005). A recent study (Xu et al., 2020) reported a strong relationship between mental health and heat vulnerability, specifically for people suffering from mental diseases such as stress, depression, anxiety, dementia, and schizophrenia. Additionally, people with poor mental health are generally less able to take adaptive or protective measures under high temperatures (Lee et al., 2018). Also, evidence from other studies (Hansen et al., 2008; Nitschke et al., 2013) showed that sensory perception of heat is strongly affected by mental conditions, thereby increasing heat vulnerability (Martin-Latry et al., 2007; Nordon et al., 2009; Hajat et al., 2010; Hansen et al., 2011; Martinez et al., 2020).
Studies on heat risk assessment in the United States have found poverty and income level are related to heat-associated risks at the neighborhood level (Vescovi et al., 2005; Bell et al., 2008; Henderson et al., 2013). Individual affordability primarily drives the association between income level and heat vulnerability to pay for high electricity bills due to increased use of AC or transportation cost to go to a cooling shelter (Sheridan, 2007; Hansen et al., 2011; Banwell et al., 2012; Sampson et al., 2013). Other related risk drivers can be associated with limited individual access to adequate healthcare during a heatwave event, which is strongly tied to income level (Bouchama et al., 2012). Previous studies have found a relationship between hospital visits during heatwaves and lack of access to private health insurance, increasing vulnerability to heat exposure (Zhang et al., 2013).
During the Chicago heatwave in 1995, access to a community support system was found to be one of the significant drivers of heat adaptation and reduced heat-related morbidity (Klinenberg, 2003). Community support is critical in promoting coping and adaptation actions such as cooling behaviors, communicating concerns during heatwaves, or supporting socially isolated populations. Studies in the United States (O’Neill et al., 2005) and Europe (Michelozzi et al., 2005; Borrell et al., 2006) found a relationship between heat-related morbidity and education level. Like race and ethnicity, education attainment is relatively linked to other heat-related vulnerability drivers such as income level and occupation. High-educated populations are more likely to understand the types of protective measures needed under extreme heat exposure. Therefore, we consider that the socioeconomic factors related to heat susceptibility include income level, access to healthcare (represented as access to health insurance), community support (represented as the available communication resources on heatwaves risks, and community support for socially isolated populations), and educational level (represented by completing high school degree).
Coping capacity denotes the population’s ability to cope, manage and adapt to heat risk in the short term. In the urban context, coping capacity can be represented by urban and building-scale resources contributing to an individual’s ability to cope with heat exposure and overcome potential risks. Heat vulnerability studies have identified that commuting to cooler places, such as cooling shelters during high-temperature exposure, can act as a cooling resource, especially during heatwaves (Bouchama et al., 2012; Sampson et al., 2013). In this paper, we consider access to cooling shelters within walking distance of 500 m as an indicator of the population’s coping capacity at the urban level. Heatwaves significantly threaten the reliability and stability of power supply systems in cities. Increased temperature directly affects electricity demand with the increased use of air conditioners to cope with indoor overheating, leading to generation disruption and blackouts at high costs for human health and economies (Prezant et al., 2005; Gotanda et al., 2015). During heat exposure, vulnerable adults who rely on the power supply are even more challenged beyond just access to air conditioning units. The elderly population is more vulnerable to blackouts, especially those who use power for medical needs or those with limited mobility (Behr and Diaz, 2013; Gamble et al., 2013). Air conditioning and ventilation play a significant role in providing comfortable environmental conditions under heat exposure; thus, we focus on access to mechanical cooling means, the number of hours where natural ventilation can be utilized, and access to backup power during blackouts as indicators of urban population coping capacity at the building level. Access to backup power can help maintain access to mechanical cooling means such as fans or air conditioning units and limit the risks related to medical support for vulnerable elderly residents.
Understanding existing access to resources to cope with heat exposure is vital in heat vulnerability assessment and identification of heat adaptation strategies. Studies on heat vulnerability in the United States reported that health services and travel distance’s geographical location play a significant role in increased heat-related morbidity (Anggraini et al., 2019). In an urban context, vegetation can help reduce heat-related risks by providing shading and reducing temperature through evapotranspiration. Also, green spaces can help people adapt to extreme heat due to their ability to reduce the surrounding temperature and provide access to drinking fountains (Önder and Akay, 2014; Maragno et al., 2020). We consider proximity to a healthcare service, open spaces, cooling shelters, and parks within walking distance of 12 miles (1.6 km) as three key indicators for adaptive capacity.
Various heat stress indices have been developed to assess heat stress and thermal comfort. These indices guide both building design and operation to provide comfort. Auliciems and Szokolay (Auliciems and Szokolay, 2014) reviewed and evaluated 11 heat indices commonly used to assess heat stress. Over the past few decades, various indices have been developed based on environmental factors; others are based on environmental and human factors (Brake and Bates, 2002). A review by Bethea and Parsons (Bethea and Parsons, 2002) has grouped thermal comfort indices into three main categories: 1) rational indices (heat balance), 2) empirical indices (physiological), and 3) direct indices (environmental). Figure 2 summarizes indices included in this study and other studies examined in the literature review to assess heat stress in indoor environments.
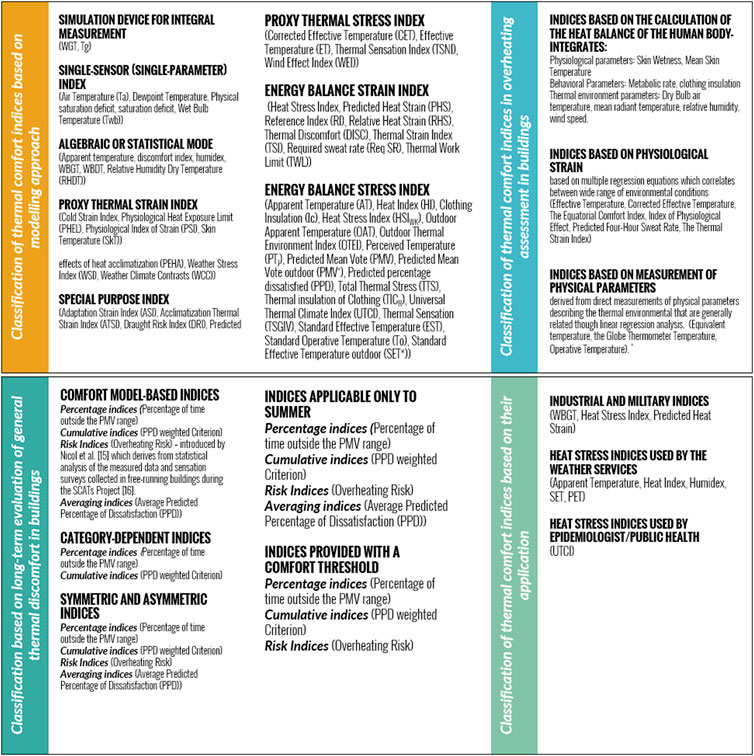
FIGURE 2. Different Heat stress indices and their classification (developed by the author based on (Brake and Bates, 2002; Blazejczyk et al., 2012; Auliciems and Szokolay, 2014; Urban and Kyselý, 2014; Holmes et al., 2016; Sen and Nag, 2019)
The dynamic relationship between exposure components in the built environment and associated vulnerability has received only modest attention in the existing literature (Hallegatte and Corfee-Morlot, 2011; Slobodan and Simonović, 2012; Dilling et al., 2015). The relationship between heat vulnerability and urban development manifests feedback relationships between heat exposure, available urban resources for adaptation, social system characteristics, and the surrounding built environment. We use system dynamics as a modeling approach to examine and outline the structure of these governing relationships. System dynamics (SD) is an operative approach utilized mainly to reveal relationships of complex systems for their non-linearity, time delay, and structure (Bala et al., 2018). SD describes both quantitive and qualitative causal relationships between the system’s variables. These relationships can either be positive when variables proportionally change or negative when they change inversely (Slobodan and Simonović, 2012).
The evaluation of urban community vulnerability to heat is a multidimensional dynamic problem. Thus, the model presented in this paper examines this problem by capturing the environmental, social, and behavioral dimensions subject to vulnerability induced by heat exposure. Furthermore, the model expands the feedback system between exposure, susceptibility, coping capacity, adaptive capacity, and associated vulnerability within the neighborhood as the system’s boundary. The purpose of the developed model is to: a) extend the field of system dynamic analysis to explore urban and building performance and heat vulnerability by examining the interactions between the physical urban system and the human system in response to heat exposure, and b) demonstrate the structural relationship between heat exposure sub-components and their influences on different factors of susceptibility in driving or reducing vulnerability within the urban boundary.
The core foundation of the proposed model’s mechanism in capturing the relationship between heat vulnerability, exposure, and adaptive capacity is presented through a causal loop diagram shown in Figure 3. The causal loop diagram’s left side indicates the impact of global climate variability on increased heat exposure. The right part represents impacts on the urban system vulnerability defined in susceptibility and adaptive capacity. Thus, the upper right part of the diagram represents the urban response to heat exposure (urban performance) as the ability of an urban system to adapt to extreme heat through the provision of health services, heat-relief amenities, and quality of housing stock. The lower right side depicts the human system response to heat exposure as a function of population characteristics that drive susceptibility. Urban performance also affects susceptibility, as poor infrastructure and an old building stock can increase susceptibility. In contrast, susceptibility can be reduced by improving the urban adaptive capacity through improving urban performance. This dynamic relationship between susceptibility and adaptive capacity governs the vulnerability level. Risk arises from the potential impact of future climate hazards, which is a future heatwave in this context.
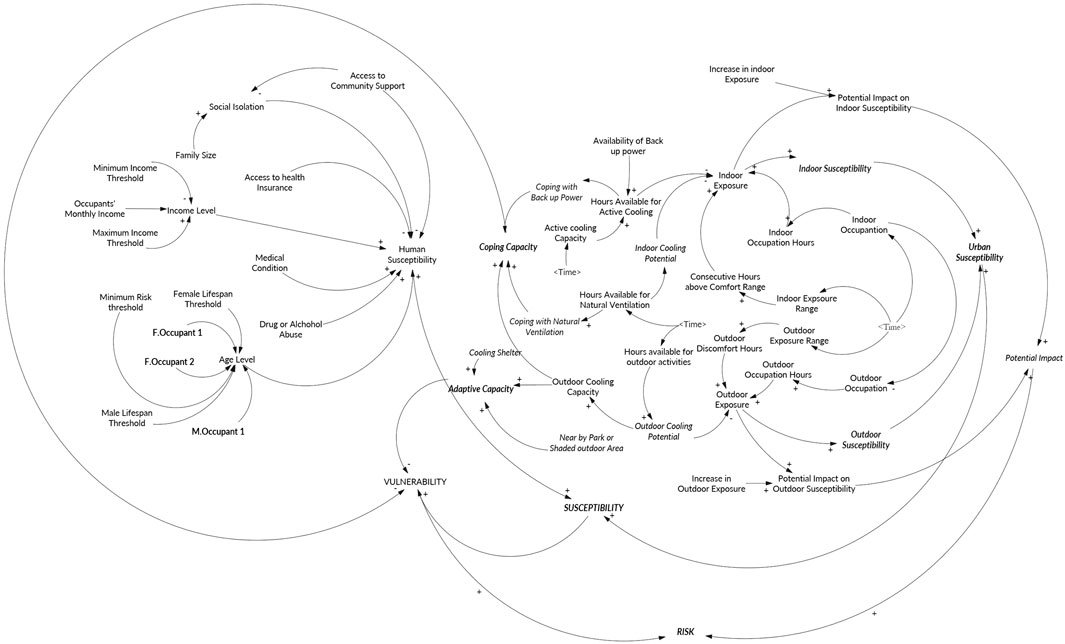
FIGURE 3. Causal loop diagram between heat exposure, susceptibility, and adaptive capacity in heat vulnerability assessment.
The model expands the feedback system between exposure, susceptibility, adaptive capacity, and associated vulnerability within the neighborhood as the system’s boundary. For example, as heat exposure increases, pre-existing health conditions can exacerbate due to heat stress, leading to increased susceptibility in a reinforcing pattering. This relationship is balanced by providing cooling options represented by the adaptive capacity. The model development is comprised of three main phases.
• Structuring phase: aims to identify main variables and their sub-components. The objective is to understand the vulnerability of who and caused by what;
• Scenario analysis: the purpose of scenario analysis is first to examine the validity of the hypothesized feedback loops and to identify any critical factors shaping the development of the model;
• System perspective: offers a representation of the system dynamic behavior and feedback mechanisms exhibited in the scenario analysis. The system perspective phase addresses simulation outputs and outlines feedback loops driving the results to clarify knowledge and understanding of the system and outline policies that will improve system behavior.
The proposed model consists of various vulnerability dimensions aggregated under exposure, susceptibility, coping capacity, and adaptive capacity. Each component is divided into subcomponents based on the specificity of vulnerability assessment in urban contexts. The multidimensionality of heat vulnerability is quantified using sets of indicators as proxies combined into a composite index reflecting the overall vulnerability score. Table 1 outlines the main components of vulnerability and related sub-components used as inputs for the heat vulnerability model.
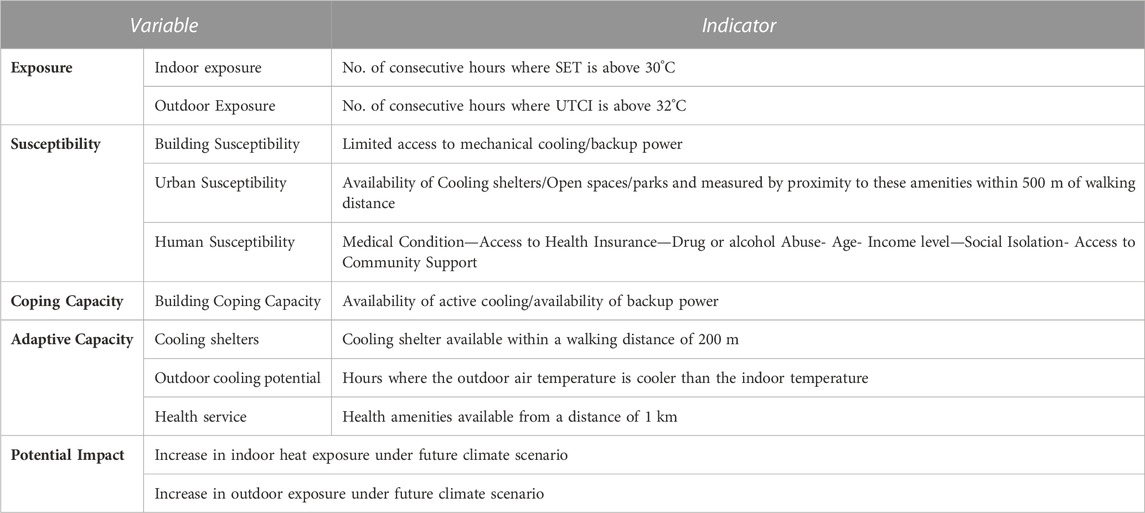
TABLE 1. System variables and their indicators.
The model’s structure is based on integrating two types of data sets as model inputs: 1) primary data from households to construct susceptibility and associated sub-components, and 2) hourly simulation for indoor and outdoor climatic conditions using energy simulation models. By using energy simulation models, we account for the impacts of the physical characteristics of the surrounding urban environment that can either increase or lessen the magnitude of potential heat exposure and refrain the depending only on climate models that do not account for exposure at the micro-scale. Vulnerability assessment revolves around four primary dimensions, namely, Exposure (E), Susceptibility (S), Coping Capacity (CC), and Adaptive Capacity (AC). These are dynamically interconnected and system-specific as follows:
Vulnerability = Ƒ(Exposure; Susceptibility; Coping Capacity; Adaptive capacity).
The relationship between all four vulnerability components is governed by the local characteristics represented in the urban system (surrounding built environment and urban population) at the neighborhood level. The details of each element and its direct and indirect relationship to overall vulnerability are outlined in Table 2.
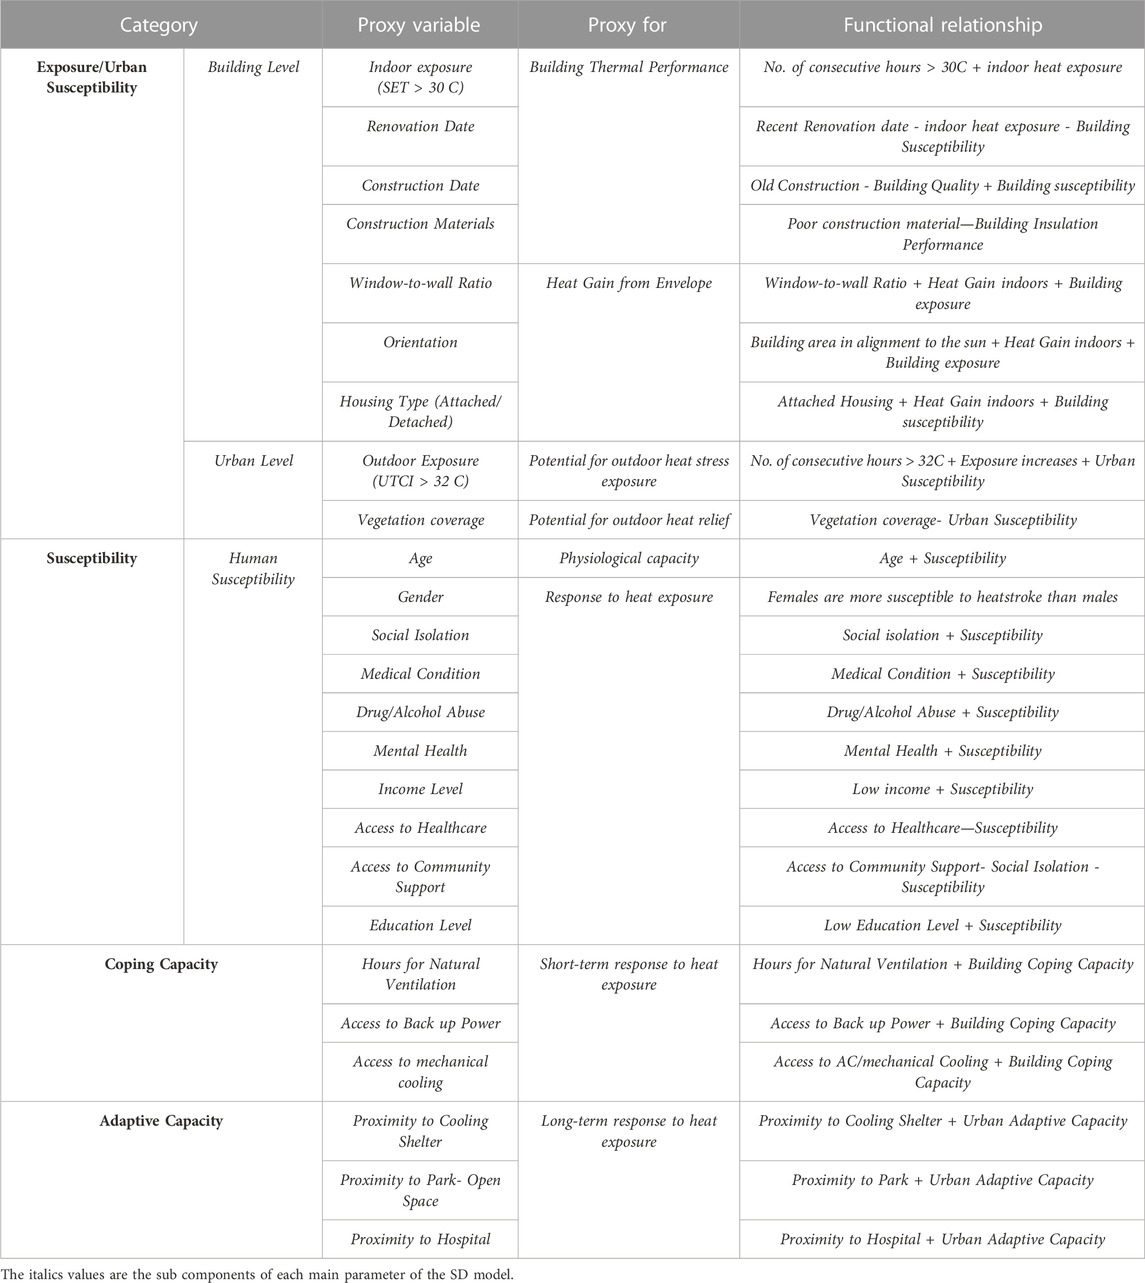
TABLE 2. Description of major and sub-components of heat vulnerability Assessment model.
Heat exposure is considered in the model as a function of indoor and outdoor exposure that occurs when people go outside for a cooling outlet if it gets too warm inside. In assessing exposure, we consider the number of consecutive hours based on findings in the literature on how prolonged exposure can drive heat-related health impacts using SET for indoor exposure and UTCI for outdoor exposure, discussed in Section 2 in this paper (Pyrgou et al., 2017; Kenny et al., 2019a). Susceptibility comprises three main components: a) building susceptibility, b) urban susceptibility, and c) human susceptibility. The mathematical foundation of the model’s key components is described in depth in the Supplementary materials. Figure 4 describes the cause-effect relationship and the system structure between the various elements of heat vulnerability and related sub-components. The dynamic hypothesis is that when exposure increase, increases in both urban susceptibility and human susceptibility will contribute to an increase in vulnerability. These effects can only be balanced by improving coping capacity (either reducing exposure to changes in the physical urban space or increasing access to behavioral adaptation measures) at the building scale and the urban scale. The mathematical formulation of the model is explained in depth in the Supplementary material section 3 and Supplementary Table A-S2.
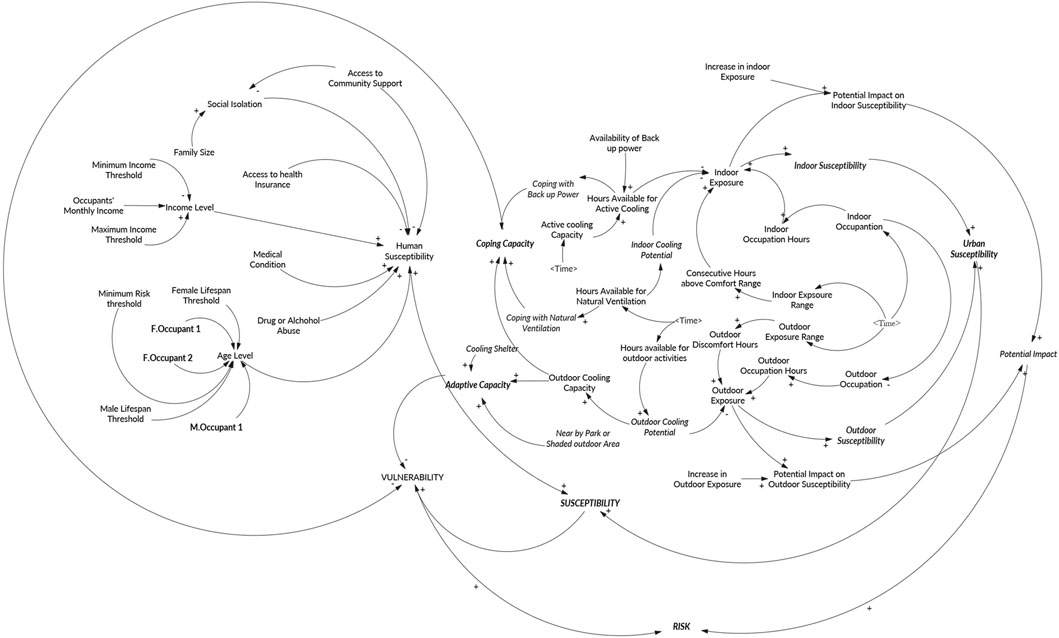
FIGURE 4. Structure of heat vulnerability SD model.
The proposed SD model will provide a unique advantage in assessing vulnerability by extending the model boundary to address any additional questions or problems. The model is based on the following assumptions:
1. For simplicity, access to backup power has no restrictions;
2. The relevant time horizon is the warmest week in the summer;
3. Changes in coping and adaptive capacity are immediate, with no impact from policy delay or availability of funding resources.
A multi-family building in a low-income neighborhood in Cairo, Egypt, is examined in the SD model described above. We chose a low-income neighborhood in Cairo, Egypt, called AlDarb Al Ahmar. The area has three archetypes: i) historical buildings from the 1700s, ii) buildings from the late 20th century and iii) buildings from the period between 2010 and 2014. The total studied area is 2.8 acres, and specifically selected for its unique architectural character, diversity of building types, and economic challenges. Living standards are primarily considered low-income, where air conditioning units are not common and rarely installed. Ceiling fans and portable fans are the most common apparatus used for ventilation. Historical buildings represent around 72% of the existing building stock in Al Darb AlAhmar. Therefore, we choose a multi-family historical building of three floors as a representative model of the building stock in the study area. Characteristics of building envelopes in archetype were identified from an on-site survey by Aga Khan (Aga Khan Foundation, 2013) and Attia’s database for Egypt’s construction materials (Attia and Wanas, 2012) and summarized in Table 3. The floor area of the residence examined in the study has an average area of 80 m2, a rectangular floor plan with an orientation north-west, and the window-to-wall ratio is 18%.
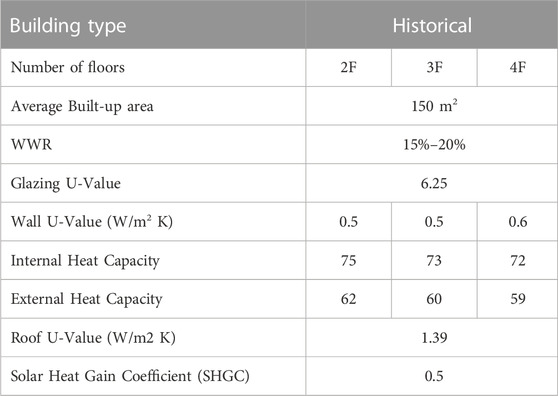
TABLE 3. Construction material characteristics for historical archetypes in Al Darb AlAhmar.
Onset Hobo data loggers were installed in the developed archetypes from July 6th to July 12th and August 8th to August 15th. Indoor temperature and relative humidity readings are used to analyze indoor climatic conditions and validate simulation results. The accuracy of the temperature loggers used was ±0.21°C from 0°C to 50°C, Relative Humidity accuracy: ±2% from 20% to 80% typical to a maximum of ±4.5%; below 20% and above 80% ± 6% typical). All loggers were placed in the zones with sufficient air movement and away from internal heat sources and solar radiation (Figure 5). The outdoor air temperature was collected from the nearest weather station, located 4.9 km away from the analysis area. Outdoor temperature readings indicated high temperatures from July 7th until 12 July 2018. Indoor wind speed samples were measured in 20 representative buildings without ceiling fans, indicating a low indoor air movement with an average indoor wind speed across the 20 samples of 0.2 m/s and between ∼0.2–0.5 m/s at the urban canyon level. Samples were taken at 8 p.m. to examine if natural ventilation would impact indoor cooling potentials.
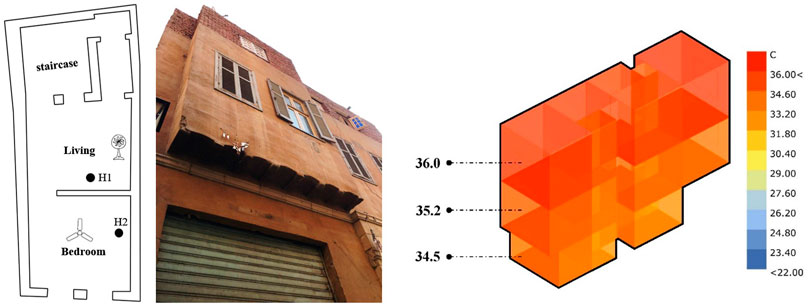
FIGURE 5. Left, An example floor plan for a representative archetype and location of the Hobo data logger, Right, hourly operative temperature simulation for the warmest summer week (19th to 25th of August).
Two simulations were executed for the representative case study: hourly simulation for SET for the warmest summer week in Cairo, Egypt (from August 15th to August 22nd) and UTCI using Energy Plus simulation Engine with respect to the surrounding urban block within a diameter of 500 m. The outputs of the simulations were then implemented as exposure indicators in the SD model.
To define how the occupants react to heat exposure, we developed a survey for 300 residents to understand types of heat adaption behaviors, both indoor (using ceiling fans, opening windows, or using window blinds) and outdoor (going to a nearby park, sitting in front of the house, or sitting on top of the roof) derived from site observations. The survey also included demographic information (age, sex), socioeconomic (average monthly income), and years living in AlDarb Al Ahmar neighbourhood (Table 4). The survey included average occupancy rates, type of equipment, and occupancy and ventilation schedule. All this information was implemented in the SD model to define the availability of cooling means and identify how hours spent indoors and outdoors during the warmest summer week. Results from the survey are described in Section 4 of the Supplementary materials.
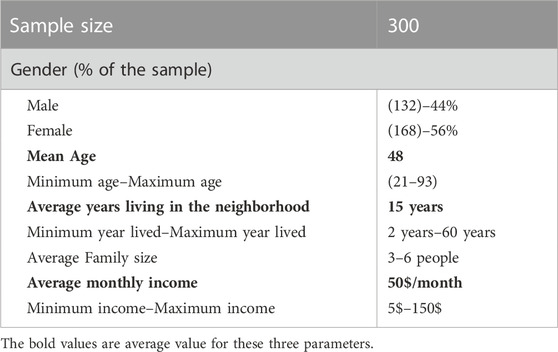
TABLE 4. Summary of the survey subjects of residential occupants in the study area.
The site survey indicated an average occupancy density of three–six persons per apartment. Therefore, we considered that the average occupancy density per apartment is three people per apartment for the test case. We have also identified that 20% of the survey are between 60 and 80 years old, with 42% living alone, reflecting the presence of social isolation. We have also accounted for blackout hours using the assumption of the presence of backup power (represented by a backup power generator) with no constraints to provide mechanical cooling.
Figure 6 illustrates the simulated indoor air temperature and recorded air measurements. Data from buildings’ surveys and questionnaires were used to calibrate the simulation model with actual conditions. The simulation’s mean square root error decreased substantially after adding the 300 sample site survey data. The survey was tailored to address information such as occupancy times and the number of equipment owned. All these data we arranged by archetype and added to the simulation model. The simulation output for the representative building shows that in highly-dense urban areas with no air conditioning access, the indoor heat exposure represented around 90% of the day was above the thermal comfort range (SET> 30OC). Also, the daily indoor maximum temperature is generally more than 30°C, which is large enough to drive potential health impacts, specifically for highly susceptible populations such as elderly residents and infants.
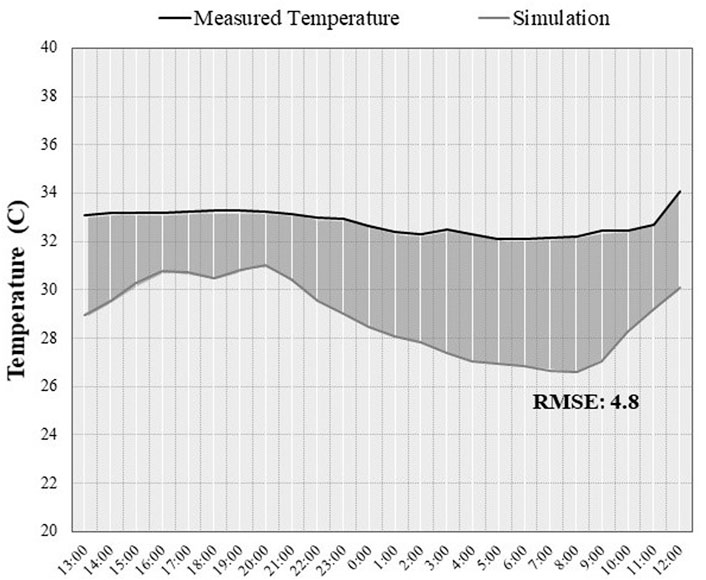
FIGURE 6. Simulation results for indoor air temperature and recorded summer measurements.
SD model simulations were performed using a daily time step. All SET and UTCI simulation inputs were integrated into the model as inputs for 7 days of simulations representing the climatic conditions of the warmest summer week. The heat vulnerability model presented in Figure 4 above is implemented in the Vensim software package, allowing for easy modification in the system structure and simulations of different scenarios. In addition, information on human susceptibility was collected as part of the 300-site survey data. Here we used the data for a representative family of three members (female 55 years old, female 75 years old, and male 62 years old) and were used as inputs to SD simulations. To validate the model’s performance, we test the model formulation under two scenarios: i) extreme scenario where there is no access to coping and adaptation resources, and ii) adaptation scenario that encompasses full access to adaptation amenities, cooling shelters and parks, and complete availability of backup power and ventilation at the building level. Figure 7 compares the results between the two examined scenarios. It can be noted that under the extreme scenario, vulnerability is at the maximum value of 1.0, while under the full adaptation scenario, vulnerability approaches 0, validating the hypotheses of the model dynamic relationships.
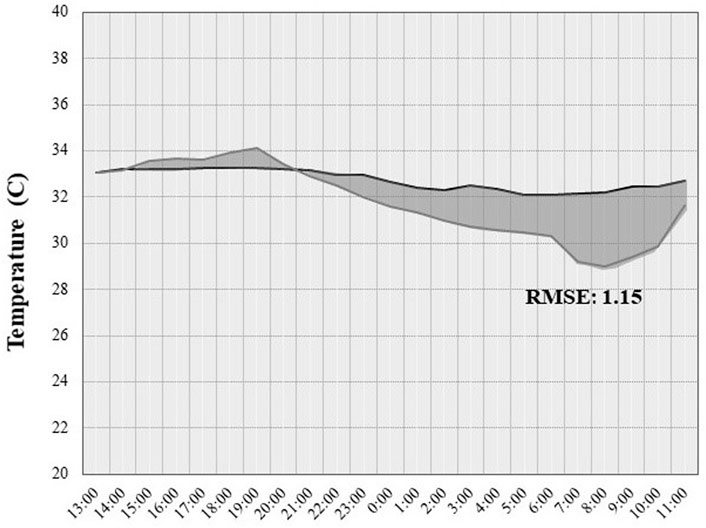
FIGURE 7. Top, coping capacity, adaptive capacity, and related vulnerability under the extreme scenario. Bottom, results of adaptation scenario.
Next, we test the model under the extreme vulnerability scenario, assuming all factors contributing to social vulnerability equal to one to imply an extreme condition of high susceptibility. The extreme vulnerability scenario shows that although indoor and outdoor exposure is not high throughout the day, vulnerability is high due to a lack of access to coping and adaptation measures and socioeconomic factors. These results imply that even under moderate exposure, a population can still be considered vulnerable due to other related socioeconomic factors such as age, disability, low income, medical condition, and living in an urban setting that is highly susceptible. This is mainly due to a lack of coping and adaptation services such as cooling spaces, access to a power supply, and proximity to health services, which can drive their vulnerability to heat exposure. These results confirm other findings in the literature during the 2003 European heatwave (Fouillet et al., 2006) and during the Chicago heatwave in 1995 (Semenza et al., 1996a; Semenza et al., 1996b) on how socioeconomic conditions can significantly influence population vulnerability. Figure 8 illustrates the model output for the warmest summer week in the examined archetype and values for susceptibility, coping capacity, adaptive capacity, and associated vulnerability.
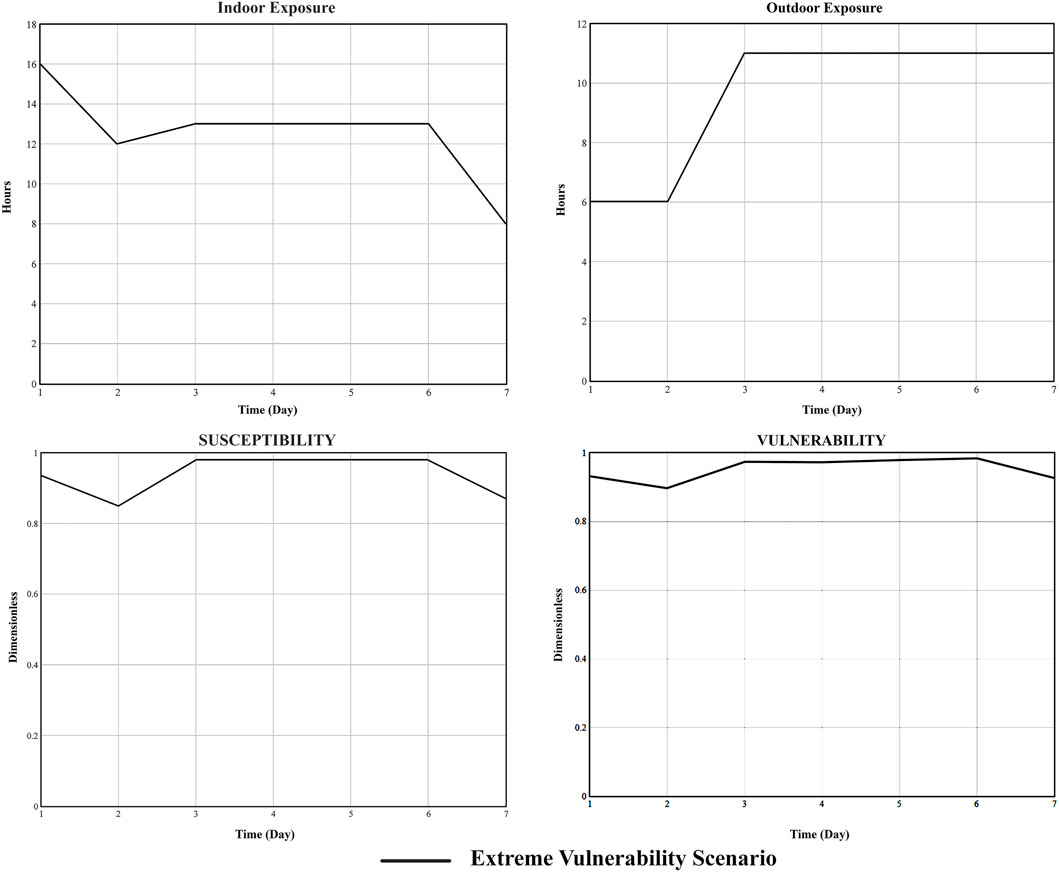
FIGURE 8. Results for the extreme vulnerability scenario and indoor and outdoor exposure (no. of consecutive hours where exposure is above comfort threshold) from the simulation model.
Next, we ran simulations for the coping capacity (cc) scenario to examine the effect of improved coping mechanisms at the building scale. Here, we introduce access to backup power for three consecutive hours daily as a measure of coping capacity, assuming an extreme blackout scenario. In the summertime for the past 5 years, Cairo has been experiencing a series of blackouts that can last up to five consecutive hours during the daytime from increased demand for air conditioning. Figure 9 graphically visualizes the coping capacity results in the reference scenario (extreme vulnerability) and coping capacity scenario (access to backup power). As expected, the examined scenario shows lower values for vulnerability under the same socioeconomic characteristics. Also, improvement in the urban susceptibility profile as a result of reduced susceptibility at the building scale. The total susceptibility is considered relatively close due to impacts from socioeconomic factors of the population. Results from the CC scenario underline that during heat exposure, the magnitude of vulnerability can vary significantly from one household, which can substantially affect policy planning through understanding which area to prioritize and what sectors of the population.
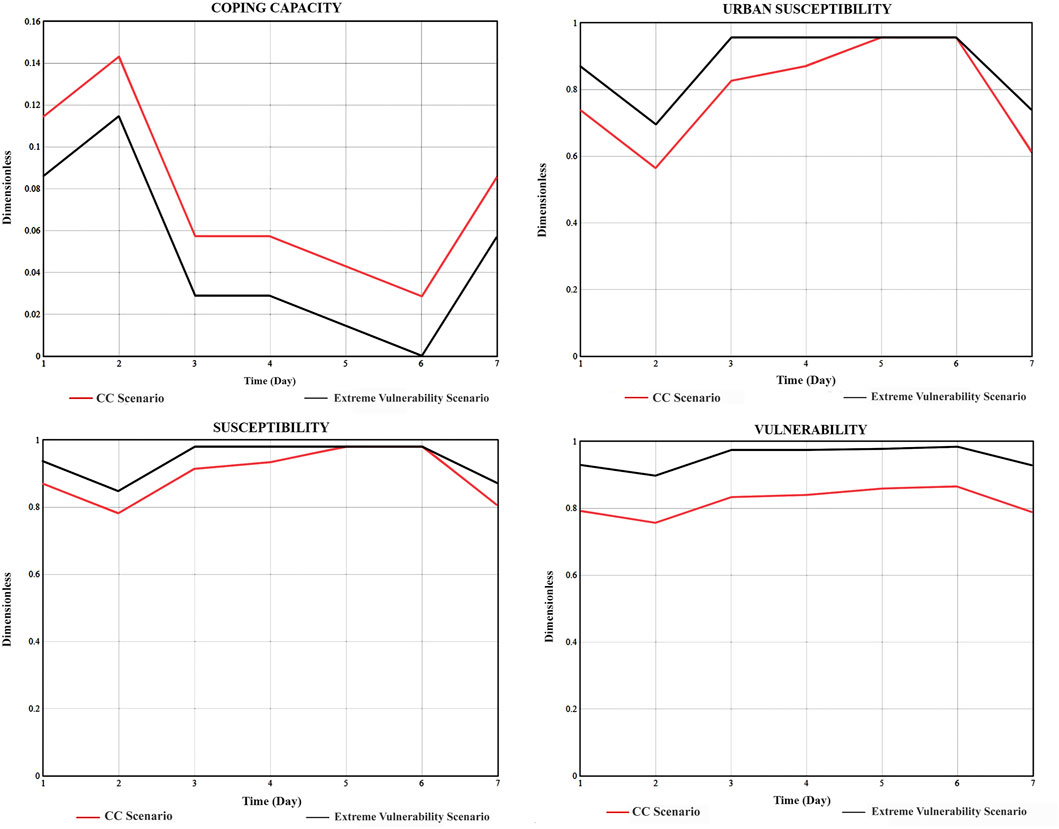
FIGURE 9. Results of Coping Capacity Scenario (CC) compared to reference scenario (Extreme vulnerability).
For the Adaptive Capacity and Coping Capacity (AC/CC) scenario, we introduce backup power access at the building scale and access to a nearby cooling shelter to examin effect on both building and urban block level. We also change access to community groups in human susceptibility to examine how eliminating social isolation can influence vulnerability. Results show a significant reduction in vulnerability compared to the other two scenarios, as illustrated in Figure 10. Also, we model the potential impact as an increase in indoor and outdoor exposure by 30% to assess risk levels. As a result, there is a reduction in the overall susceptibility (urban and human) and significant improvement in both adaptive and coping capacity. Finally, these results indicate how integrating the social aspect of policy design would influence vulnerability, such as improving social network structures to assist the socially isolated population.
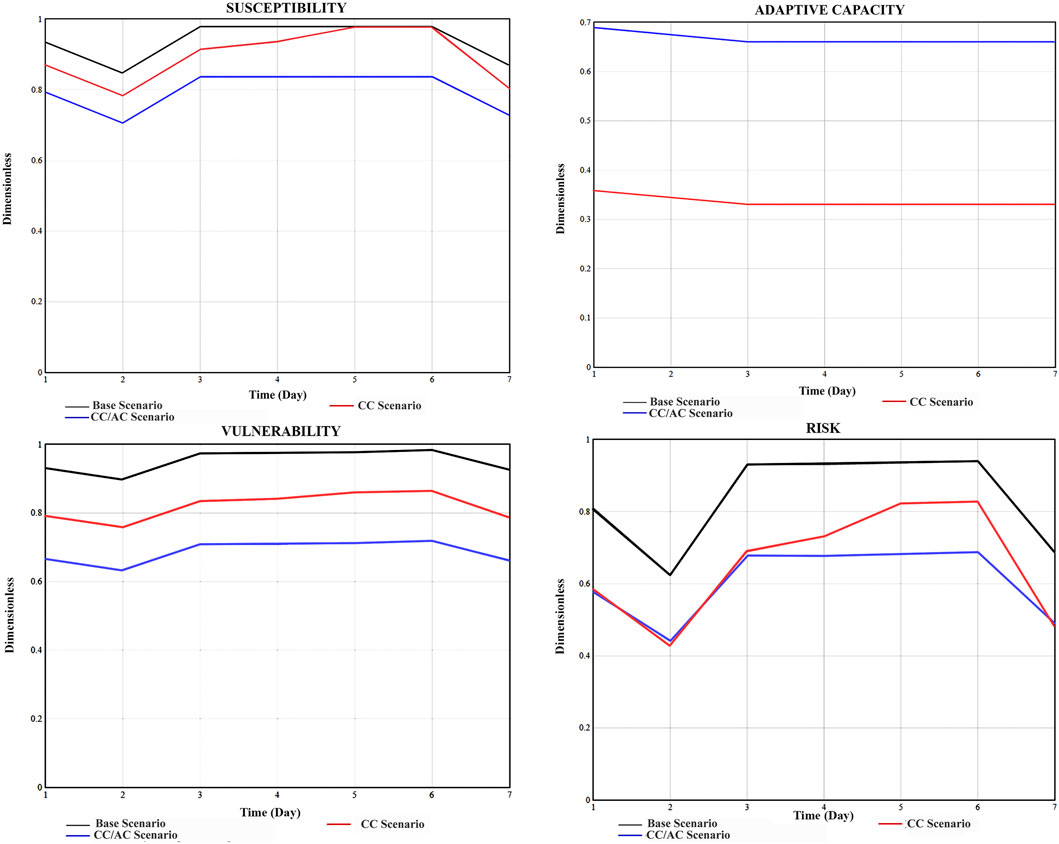
FIGURE 10. Results of the three examined scenarios for susceptibility, adaptive capacity, vulnerability, and related risks.
This is because the population can be considered vulnerable to heat exposure, but with access to coping and adaptation measures, risk can be significantly mitigated. This ties back to the dynamic hypotheses of coping and adaptative capacity and reducing vulnerability and risk levels. For example, suppose a population is considered highly vulnerable, but the potential impact on future heat exposure is relatively lower. In that case, risk levels will not be as high as vulnerability, as shown in Figure 10 below. Therefore, we calculated risk here as an increase in the magnitude of vulnerability due to a potential impact from heat exposure (R = potential impact * vulnerability). We assume the potential impact of future extreme heat events as a value of 50% to examine the potential increase in vulnerability and related risk.
These results indicate that the surrounding built environment’s physical characteristics play a significant role in driving exposure magnitude and the potential impact that defines risk levels. These relationships are often not fully explored in heat vulnerability assessment. Most of the focus is oriented to the socioeconomic characteristics alone or large urban scale risk assessment that does not fully capture these micro dynamics occurring at the building scale and surrounding urban amenities. Results from the proposed SD model confirm the underlying hypothesis that vulnerability and risk from heat exposure are dynamically linked to the coping and adaptive capacity of the surrounding built environment with the urban population’s socioeconomic characteristics. Using the SD approach allows the parallel examination between the performance of the built environment that socioeconomic-based vulnerability studies cannot examine with the characteristics of the human system that building simulation models cannot capture. Findings from the model indicate that exposure occurring at both the building and urban levels can significantly influence the potential risk due to future overheating if there are no measures to improve the coping and adaptive capacity of the human system. Also, vulnerability assessment requires a more in-depth examination of socioeconomic characteristics alongside surrounding urban amenities to reduce and mitigate potential heat exposure risks. These findings imply that a large-scale assessment would need to be coupled with a detailed evaluation of heat exposure dynamics at the building scale and how individuals interact with the surrounding urban services to assess which areas need to be prioritized in adaptation policies.
To examine the model sensitivity to different parameters in human susceptibility, we ran sensitivity analysis for three independent inputs; age, income, and gender under Extreme Vulnerability Scenario. Here, we vary the values of each parameter in two cases. For age, we calculate the average vulnerability for all family members of age 65 and those below 65. For income, we test for the highest income level ($300/month) for AlDarb AlAhmar and the lowest income range ($25/month). Finally, for gender, we test two cases: i) all family members are females, and ii) all are males. Results from the sensitivity analysis are summarized in table 5 below. From the sensitivity analysis, we found that changes in gender and age did not significantly impact the model; however, income level has impacted the average vulnerability due to its effect on coping capacity through affordability of mechanical cooling means.
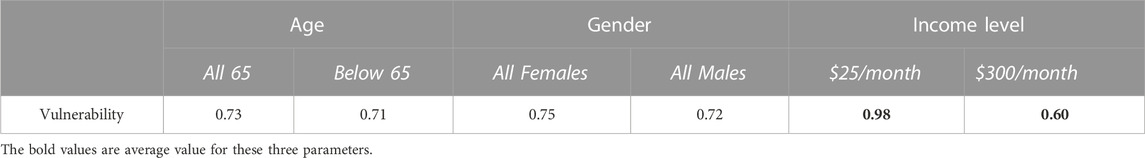
TABLE 5. Sensitivity of Vulnerability for Age, Income, and Gender at the extreme vulnerability scenario.
The urban population’s socioeconomic factors are still vital in heat vulnerability assessment; however, they need to be coupled with information on the built environment’s impacts. Such data can provide a more comprehensive evaluation of highly exposed areas, highly vulnerable areas, or areas at risk. Besides, social susceptibility indices can provide a sense of which sectors of the population to assist and prioritize during extreme heat events. This paper uses SD modeling to develop a quantification approach for heat vulnerability assessment in urban settings. The main contribution of this paper is to develop an approach that allows for parallel examination of the effect of both the human system and the built environment system on heat vulnerability. Furthermore, incorporating building and urban characteristics of the areas that accommodate susceptible populations will help facilitate and underline the most suitable adaptation strategies and preparedness for future heatwaves, as highlighted in the case study, through improving access to urban adaptive capacity and reducing social isolation.
Previous studies on heat vulnerability assessment established a framework that explored heat risk association with UHI (Tomlinson et al., 2011; Ramamurthy et al., 2017) and health risks from indoor overheating and mapping heat vulnerability populations using socioeconomic characteristics (Maller and Strengers, 2011; Pyrgou et al., 2017). However, the most recent findings from the literature report a limited knowledge of the effects of heat exposure on vulnerable populations (Lancet, 2015; Kenny et al., 2019b). This study provides an approach to examine different parameters that play a role in increased or decreased vulnerability, taking into account the characteristics of the surrounding built environment, urban population, and resources available for coping and adaptation. The hypothesis behind the proposed model is that the dynamic relationship between susceptibility and adaptive capacity governs the vulnerability level for a given urban population. Using SD allows for parallel examination of the effect of both parameters on vulnerability under various exposure scenarios, as shown through the paper. The main limitation of the model is the effect of different components of human susceptibility such as race, social isolation, and access to community support. Yet, a better understanding of the magnititude of these factors on overall vulnerability will improve such analysis using SD.
Other studies that explored the us of SD modelling in examining climate change risks focused on exsmining effects for different policies without the quantification of potential increased or decrased in heat-related risks. For example, Dare (Dare, 2021) developed a system dynamics modeelling approach to assist in the development of heat island mitigation policies qualitively without a deeper quantification of heat-related mortality reduction. The approach proposed in this paper outline a quantitive approach on how SD can be implemented to examine heat risks. The main limitation with the model is the simplification of the social dimension of the urban residents charachteristics. Future research may address this gap by feeding the model with actual large scale data to validate the effect of different socioeconomic parameters on heat vulnerability.
The proposed analysis of heat vulnerability in low-income urban communities reveals the relative importance of the dynamic relationship of the urban population’s interaction with the surrounding built environment in heat risk management. Furthermore, the possibility of enhancing social-urban resilience to heat exposure and improving urban capacity is vital when considering heat adaptation strategies. The study results in the following issues to assess heat exposure impacts and adaptation mechanisms of low-income urban communities.
1) Strategies to address coping capacity impacts: The SD model results suggest that building physical characteristics significantly beget exposure and causes an increase in vulnerability levels. Therefore, building retrofit can significantly mitigate the impacts of heat exposure at the building level. In addition to building retrofit measures, improving coping capacity such as access to a backup power supply in the case of blackouts and access to clean water for hydration will enhance the individual’s ability to cope with heat exposure, especially in low-income urban areas.
Thus, several strategies can be implemented to improve coping capacity by altering the thermal performance of the building. In situations of prolonged and extreme heat exposure, buildings’ thermal capacity to regulate heat plays a significant role in preventing or reducing potential risks to human health. One of the strategies to reduce heat gain from the building envelope level is vertical greening and green roofs. For example, findings in the literature show that green roofs generated indoor cooling 0.5°C to 2.0°C and contributed to a reduction in annual energy consumption (de Munck et al., 2018). Also, there are less invasive strategies like using white roofs in buildings with limited access to AC that can reduce indoor air temperature on the top floor by 1°C–2°C during extreme heatwaves.
Also, cool façade materials can contribute to indoor heat prevention and are considered among the straightforward measures to mitigate heat exposure impacts. It has been found that cool façade materials can reduce the indoor operative temperature by 0.5°C–1.6°C and external surface temperature by more than 6°C (Morini et al., 2016). Active cooling strategies can also be used for heat adaptation intervention at the building scale, such as mechanical free cooling, mechanical cooling, and direct cooling. Earth tube is one of the free cooling strategies that draw air through earth tubes buried in the ground, thus providing the potential to provide cooler air into indoor spaces.
2) Improved urban services to strengthen adaptive capacity: The physical specification of the surrounding urban space act as a catalyst and can make communities more vulnerable to heat exposure, as was denoted in the extreme vulnerability scenario presented in the case study. Therefore, there is a need for strategies to address susceptibility created by low urban services.
Numerous strategies can target improving the population’s capacity against heat exposure. These strategies aim to improve occupants’ awareness of coping with heat exposure, such as heat-related social programs (cooling shelters and assistance programs to subsidize electricity bills for low-income populations) and social networks at the neighborhood level. These strategies primarily target reducing human vulnerability against heat exposure through three main pathways and can be categorized into three types as follows:
A) First, strategies to improve access to heat adaptation amenitie: These strategies aim to increase access to heat adaptation resources at both the building level, such as access to AC at the building level through energy subsidies in collaboration with local energy programs and at the urban level by increasing access to public cooling shelters through information campaigns to raise awareness about locations of nearest cooling centers.
B) Second, strategies to decrease poverty-related vulnerability: These strategies aim to decrease socioeconomic inequalities, the number of households below the poverty line, and increase employment rates in low-income communities. They also aim to improve urban services for low-income communities, such as public transportation, to reduce residential segregation and thus promote job stability.
C) Third, strategies to decrease social isolation: Vulnerability due to social isolation is tackled by strengthening community social networks such as active monitoring programs that aim to improve social relationship networks or neighborhood-based programs to visit and communicate and visit most vulnerable populations (elderly, elderly living alone, elderly with medical history) during extreme heat events.
Finally, access to resources for adaptation governs potential health outcomes during extreme weather events. In this context, social capital plays a crucial role in residents’ survival during extreme weather events and can positively accelerate the recovery process and long-term adaptation plans. Numerous approaches to improve social capital, such as community currency to encourage involvement and strengthen trust between community members and time banking programs, have been proven effective in building social ties. Also, improving the community’s collective role through engagement in planning and supporting existing social structure can either be individuals or community groups that actively lead efforts in adaptation strategies at the neighborhood level.
The original contributions presented in the study are included in the article/Supplementary Material, further inquiries can be directed to the corresponding author.
NB: conceptualization, methodology, investigation, visualization, data curation, writing and editing. JF: conceptualization, methodology, investigation, visualization, review and editing, and supervision.
This research is supported by the Massachusetts Institute of Technology.
The authors declare that the research was conducted in the absence of any commercial or financial relationships that could be construed as a potential conflict of interest.
All claims expressed in this article are solely those of the authors and do not necessarily represent those of their affiliated organizations, or those of the publisher, the editors and the reviewers. Any product that may be evaluated in this article, or claim that may be made by its manufacturer, is not guaranteed or endorsed by the publisher.
The Supplementary Material for this article can be found online at: https://www.frontiersin.org/articles/10.3389/fbuil.2023.1025480/full#supplementary-material
Aga Khan Foundation (2013). Historic cities support programme. Sites J 20Th Century Contemp French Stud.
American Public Health Association (APHA) (2016). Making the connection: Climate changes children’s health.
Anderson, B. G., and Bell, M. L. (2009). Weather-related mortality: How heat, cold, and heat waves affect mortality in the United States. Epidemiology 20, 205–213. doi:10.1097/EDE.0b013e318190ee08
Anggraini, A. R., Oliver, J., Repasky, M., and Beuming, T. (2019). Improved docking of polypeptides with glide. J. Chem. Inf. Model 53, 1689–1699. doi:10.1021/ci400128m
Arbuthnott, K., Hajat, S., Heaviside, C., and Vardoulakis, S. (2016). Changes in population susceptibility to heat and cold over time: Assessing adaptation to climate change. Environ. Heal A Glob. Access Sci. Source 15, S33–S70. doi:10.1186/s12940-016-0102-7
Attia, S., and Wanas, O. (2012). The database of Egyptian building envelopes (debe): A database for building energy simulations. Madison, Wisconsin: Fifth Natl. Conf. IBPSA-USA, 96–103.
Baker, D. G. (2002). Multiple sclerosis and thermoregulatory dysfunction. J. Appl. Physiol. 92, 1779–1780. doi:10.1152/japplphysiol.01251.2001
Bala, B. K., Arshad, F. M., and Noh, K. M. (2018). System dynamics: Modelling and simulation. Springer, 287.
Banwell, C., Dixon, J., Bambrick, H., Edwards, F., and Kjellström, T. (2012). Socio-cultural reflections on heat in Australia with implications for health and climate change adaptation. Glob. Health Action 5, 19277–19284. doi:10.3402/gha.v5i0.19277
Bark, N. (1998). Deaths of psychiatric patients during heat waves. Pyshiatric Serv. 49, 1088–1090. doi:10.1176/ps.49.8.1088
Basu, R. (2009). High ambient temperature and mortality: A review of epidemiologic studies from 2001 to 2008. Environ. Heal A Glob. Access Sci. Source 8, 40. doi:10.1186/1476-069X-8-40
Basu, R., Pearson, D., Malig, B., Broadwin, R., and Green, R. (2012). The effect of high ambient temperature on emergency room visits. Epidemiology 23, 813–820. doi:10.1097/EDE.0b013e31826b7f97
Behr, J. G., and Diaz, R. (2013). Disparate health implications stemming from the propensity of elderly and medically fragile populations to shelter in place during severe storm events. J. Public Heal Manag. Pract. 19, S55–S62. doi:10.1097/PHH.0b013e318297226a
Bell, M. L., O’Neill, M. S., Ranjit, N., Borja-Aburto, V. H., Cifuentes, L. A., and Gouveia, N. C. (2008). Vulnerability to heat-related mortality in Latin America: A case-crossover study in são paulo, Brazil, santiago, Chile and Mexico city, Mexico. Int. J. Epidemiol. 37, 796–804. doi:10.1093/ije/dyn094
Bethea, D., and Parsons, K. (2002). The development of a practical heat stress assessment methodology for use in UK industry stress assessment methodology for use in UK industry. Res. Rep. 008, 214.
Blazejczyk, K., Epstein, Y., Jendritzky, G., Staiger, H., and Tinz, B. (2012). Comparison of UTCI to selected thermal indices. Int. J. Biometeorol. 56, 515–535. doi:10.1007/s00484-011-0453-2
Borrell, C., Marí-Dell’Olmo, M., Rodríguez-Sanz, M., Garcia-Olalla, P., Caylà, J. A., Benach, J., et al. (2006). Socioeconomic position and excess mortality during the heat wave of 2003 in Barcelona. Eur. J. Epidemiol. 21, 633–640. doi:10.1007/s10654-006-9047-4
Bouchama, A., Dehbi, M., Mohamed, G., Matthies, F., Shoukri, M., and Menne, B. (2012). Prognostic factors in heat wave related deaths: A meta-analysis. Arch. Intern Med. 167, 2170–2176. doi:10.1001/archinte.167.20.ira70009
Brake, R., and Bates, G. (2002). A valid method for comparing rational and empirical heat stress indices. Ann. Occup. Hyg. 46, 165–174. doi:10.1093/annhyg/mef030
Brown, S., and Walker, G. (2008). Understanding heat wave vulnerability in nursing and residential homes. Build. Res. Inf. 36, 363–372. doi:10.1080/09613210802076427
Christensen, J. J. (2013). Hurricane preparedness of community-dwelling dementia. Diss. Abstr. Int. Sect. A Humanit Soc. Sci.
Clark W, C., Jager, J., and Corell, R. (2000). Assessing vulnerability to global environmental risks. Taylor & Francis.
Cusack, L., de Crespigny, C., and Athanasos, P. (2011). Heatwaves and their impact on people with alcohol, drug and mental health conditions: A discussion paper on clinical practice considerations. J. Adv. Nurs. 67, 915–922. doi:10.1111/j.1365-2648.2010.05551.x
Dare, R. (2021). A system dynamics model to facilitate the development of policy for urban heat island mitigation. Urban Sci. 5, 19. doi:10.3390/urbansci5010019
de Munck, C., Lemonsu, A., Masson, V., Le Bras, J., and Bonhomme, M. (2018). Evaluating the impacts of greening scenarios on thermal comfort and energy and water consumptions for adapting Paris city to climate change. Urban Clim. 23, 260–286. doi:10.1016/j.uclim.2017.01.003
Di Napoli, C., Pappenberger, F., and Cloke, H. L. (2019). Verification of heat stress thresholds for a health-based heat-wave definition. J. Appl. Meteorol. Climatol. 58, 1177–1194. doi:10.1175/JAMC-D-18-0246.1
Dilling, L., Daly, M. E., Travis, W. R., Wilhelmi, O. V., and Klein, R. A. (2015). The dynamics of vulnerability: Why adapting to climate variability will not always prepare us for climate change. Wiley Interdiscip. Rev. Clim. Chang. 6, 413–425. doi:10.1002/wcc.341
Engelland, R. E., Hemingway, H. W., Tomasco, O. G., Olivencia-Yurvati, A. H., and Romero, S. A. (2020). Neural control of blood pressure is altered following isolated leg heating in aged humans. Am. J. Physiol. - Hear Circ. Physiol. 318, H976–H984. doi:10.1152/ajpheart.00019.2020
Field, C. B., Barros, V., Stocker, T. F., Dahe, Q., Jon Dokken, D., Ebi, K. L., et al. (2012). Managing the risks of extreme events and disasters to advance climate change adaptation: Special report of the intergovernmental panel on climate change. Manag Risks Extrem Events Disasters Adv Clim Chang Adapt Spec Rep Intergov Panel Clim Chang 9781107025, 1–582. doi:10.1017/CBO9781139177245
Foroni, M., Salvioli, G., Rielli, R., Goldoni, C. A., Orlandi, G., Sajani, S. Z., et al. (2007). A retrospective study on heat-related mortality in an elderly population during the 2003 heat wave in Modena, Italy: The Argento Project. Journals Gerontol. - Ser. A Biol. Sci. Med. Sci. 62, 647–651. doi:10.1093/gerona/62.6.647
Fouillet, A., Rey, G., Laurent, F., Pavillon, G., Bellec, S., Guihenneuc-Jouyaux, C., et al. (2006). Excess mortality related to the August 2003 heat wave in France. Int. Arch. Occup. Environ. Health 80, 16–24. doi:10.1007/s00420-006-0089-4
Füssel, H. M., and Klein, R. J. T. (2006). Climate change vulnerability assessments: An evolution of conceptual thinking. Clim. Change 75, 301–329. doi:10.1007/s10584-006-0329-3
Gamble, J. L., Hurley, B. J., Schultz, P. A., Jaglom, W. S., Krishnan, N., and Harris, M. (2013). Climate change and older Americans: State of the science. Environ. Health Perspect. 121, 15–22. doi:10.1289/ehp.1205223
Gaskin, C. J., Taylor, D., Kinnear, S., Mann, J., Hillman, W., and Moran, M. (2017). Factors associated with the climate change vulnerability and the adaptive capacity of people with disability: A systematic review. Weather Clim. Soc. 9, 801–814. doi:10.1175/WCAS-D-16-0126.1
Gosling, S. N., Lowe, J. A., McGregor, G. R., Pelling, M., and Malamud, B. D. (2009). Associations between elevated atmospheric temperature and human mortality: A critical review of the literature. Clim. Change 92, 299–341. doi:10.1007/s10584-008-9441-x
Gotanda, H., Fogel, J., Husk, G., Levine, J. M., Peterson, M., Baumlin, K., et al. (2015). Hurricane sandy: Impact on emergency department and hospital utilization by older adults in Lower Manhattan, New York (USA). Prehosp Disaster Med. 30, 496–502. doi:10.1017/S1049023X15005087
Gover, M. (1938). Mortality during periods of excessive temperature. Public Health Rep. 53, 1122–1143. doi:10.2307/4582590
Groffman, P. M., Kareiva, P., Carter, S., Grimm, N. B., Lawler, J., Mack, M., et al. (2014). Ch. 8: Ecosystems, biodiversity, and ecosystem services. Climate Change Impacts in the United States: The Third National Climate Assessment. vol. 841.
Gronlund, C. J. (2014). Racial and socioeconomic disparities in heat-related health effects and their mechanisms: A review. Curr. Epidemiol. Rep. 1, 165–173. doi:10.1007/s40471-014-0014-4
Haines, A., and Ebi, K. (2019). The imperative for climate action to protect health. N. Engl. J. Med. 380, 263–273. doi:10.1056/nejmra1807873
Hajat, S., O’Connor, M., and Kosatsky, T. (2010). Health effects of hot weather: From awareness of risk factors to effective health protection. Lancet 375, 856–863. doi:10.1016/S0140-6736(09)61711-6
Hallegatte, S., and Corfee-Morlot, J. (2011). Understanding climate change impacts, vulnerability and adaptation at city scale: An introduction. Clim. Change 104, 1–12. doi:10.1007/s10584-010-9981-8
Hansen, A., Bi, L., Saniotis, A., and Nitschke, M. (2013). Vulnerability to extreme heat and climate change: Is ethnicity a factor? Glob. Health Action 6, 21364. doi:10.3402/gha.v6i0.21364
Hansen, A., Bi, P., Nitschke, M., Pisaniello, D., Newbury, J., and Kitson, A. (2011). Perceptions of heat-susceptibility in older persons: Barriers to adaptation. Int. J. Environ. Res. Public Health 8, 4714–4728. doi:10.3390/ijerph8124714
Hansen, A., Bi, P., Nitschke, M., Ryan, P., Pisaniello, D., and Tucker, G. (2008). The effect of heat waves on mental health in a temperate Australian City. Environ. Health Perspect. 116, 1369–1375. doi:10.1289/ehp.11339
Harlan, S. L., Brazel, A. J., Prashad, L., Stefanov, W. L., and Larsen, L. (2006). Neighborhood microclimates and vulnerability to heat stress. Soc. Sci. Med. 63, 2847–2863. doi:10.1016/j.socscimed.2006.07.030
Havenith, G., and Fiala, D. (2016). Thermal indices and thermophysiological modeling for heat stress. Compr. Physiol. 6, 255–302. doi:10.1002/cphy.c140051
Henderson, S. B., Wan, V., and Kosatsky, T. (2013). Differences in heat-related mortality across four ecological regions with diverse urban, rural, and remote populations in British Columbia, Canada. Can. Heal Place 23, 48–53. doi:10.1016/j.healthplace.2013.04.005
Holmes, S. H., Phillips, T., and Wilson, A. (2016). Overheating and passive habitability: Indoor health and heat indices. Build. Res. Inf. 44, 1–19. doi:10.1080/09613218.2015.1033875
Intergovernmental Panel on Climate Change (IPCC) (2013). IPCC, 2013: Climate change 2013: The physical science basis. Contribution of working group I to the fifth assessment report of the intergovernmental Panel on climate change, AR5. Cambridge, UK.
Jendritzky, G., de Dear, R., and Havenith, G. (2012). UTCI-Why another thermal index? Int. J. Biometeorol. 56, 421–428. doi:10.1007/s00484-011-0513-7
Jurgilevich, A., Räsänen, A., Groundstroem, F., and Juhola, S. (2017). A systematic review of dynamics in climate risk and vulnerability assessments. Environ. Res. Lett. 12, 013002. doi:10.1088/1748-9326/aa5508
Kenny, G. P., Flouris, A. D., Yagouti, A., and Notley, S. R. (2019). Towards establishing evidence-based guidelines on maximum indoor temperatures during hot weather in temperate continental climates. Temperature 6, 11–36. doi:10.1080/23328940.2018.1456257
Kenny, G. P., Flouris, A. D., Yagouti, A., and Notley, S. R. (2019). Towards establishing evidence-based guidelines on maximum indoor temperatures during hot weather in temperate continental climates. Temperature 6, 11–36. doi:10.1080/23328940.2018.1456257
Kenny, G. P., Poirier, M. P., Metsios, G. S., Boulay, P., Dervis, S., Friesen, B. J., et al. (2017). Hyperthermia and cardiovascular strain during an extreme heat exposure in young versus older adults. Temperature 4, 79–88. doi:10.1080/23328940.2016.1230171
Kenny, G. P., Yardley, J., Brown, C., Sigal, R. J., and Jay, O. (2010). Heat stress in older individuals and patients with common chronic diseases. C Can. Med. Assoc. J. 182, 1053–1060. doi:10.1503/cmaj.081050
Klein Rosenthal, J., Kinney, P. L., and Metzger, K. B. (2014). Intra-urban vulnerability to heat-related mortality in New York City, 1997-2006. Heal Place 30, 45–60. doi:10.1016/j.healthplace.2014.07.014
Klinenberg, E. (2003). Heat wave: Social autopsy of disaster in Chicago, 348. Chicago, IL: University of Chicago Press. doi:10.1056/nejm200302133480721
Kravchenko, J., Abernethy, A. P., Fawzy, M., and Lyerly, H. K. (2013). Minimization of heatwave morbidity and mortality. Am. J. Prev. Med. 44, 274–282. doi:10.1016/j.amepre.2012.11.015
Kuras, E. R., Richardson, M. B., Calkins, M. M., Ebi, K. L., Hess, J. J., Kintziger, K. W., et al. (2017). Opportunities and challenges for personal heat exposure research. Environ. Health Perspect. 125, 085001. doi:10.1289/EHP556
Lancet, T. (2015). Health professionals: Be prepared for heatwaves. Lancet 386, 219. doi:10.1016/S0140-6736(15)61261-2
Lazrus, H., Morrow, B. H., Morss, R. E., and Lazo, J. K. (2012). Vulnerability beyond stereotypes: Context and agency in hurricane risk communication. Weather Clim. Soc. 4, 103–109. doi:10.1175/WCAS-D-12-00015.1
Lee, S., Lee, H., Myung, W., Kim, E. J., and Kim, H. (2018). Mental disease-related emergency admissions attributable to hot temperatures. Sci. Total Environ. 616–617, 688–694. doi:10.1016/j.scitotenv.2017.10.260
Loughnan, M., Nicholls, N., and Tapper, N. (2010). Mortality-temperature thresholds for ten major population centres in rural Victoria, Australia. Heal Place 16, 1287–1290. doi:10.1016/j.healthplace.2010.08.008
Maller, C. J., and Strengers, Y. (2011). Housing, heat stress and health in a changing climate: Promoting the adaptive capacity of vulnerable households, a suggested way forward. Health Promot Int. 26, 492–498. doi:10.1093/heapro/dar003
Maltais, D., Wilk, B., Unnithan, V., and Bar-Or, O. (2004). Responses of children with cerebral palsy to treadmill walking exercise in the heat. Med. Sci. Sports Exerc 36, 1674–1681. doi:10.1249/01.MSS.0000142312.43629.D8
Maragno, D., Fontana, M. D., and Musco, F. (2020). Mapping heat stress vulnerability and risk assessment at the neighborhood scale to drive Urban adaptation planning. Sustain 12, 1056. doi:10.3390/su12031056
Martin-Latry, K., Goumy, M. P., Latry, P., Gabinski, C., Bégaud, B., Faure, I., et al. (2007). Psychotropic drugs use and risk of heat-related hospitalisation. Eur. Psychiatry 22, 335–338. doi:10.1016/j.eurpsy.2007.03.007
Martinez, M., Devenport, L., Saussy, J., and Martinez, J. (2020). Drug-associated Heat. stroke 95, 2–3.
Mayrhuber, E. A. S., Dückers, M. L. A., Wallner, P., Arnberger, A., Allex, B., Wiesböck, L., et al. (2018). Vulnerability to heatwaves and implications for public health interventions – a scoping review. Environ. Res. 166, 42–54. doi:10.1016/j.envres.2018.05.021
McGregor, G. R., and Vanos, J. K. (2018). Heat: A primer for public health researchers. Public Health 161, 138–146. doi:10.1016/j.puhe.2017.11.005
Michelozzi, P., de Donato, F., Bisanti, L., Russo, A., Cadum, E., DeMaria, M., et al. (2005). The impact of the summer 2003 heat waves on mortality in four Italian cities. Euro Surveill. 10, 11–12. doi:10.2807/esm.10.07.00556-en
Minson, C. T., Wladkowski, S. L., Cardell, A. F., Pawelczyk, J. A., and Kenney, W. L. (1998). Age alters the cardiovascular response to direct passive heating. J. Appl. Physiol. 84, 1323–1332. doi:10.1152/jappl.1998.84.4.1323
Morini, E., Touchaei, A. G., Castellani, B., Rossi, F., and Cotana, F. (2016). The impact of albedo increase to mitigate the urban heat island in Terni (Italy) using the WRF model. Sustain 8, 999–1014. doi:10.3390/su8100999
Nitschke, M., Hansen, A., Bi, P., Pisaniello, D., Newbury, J., Kitson, A., et al. (2013). Risk factors, health effects and behaviour in older people during extreme heat: A survey in south Australia. Int. J. Environ. Res. Public Health 10, 6721–6733. doi:10.3390/ijerph10126721
Nordon, C., Martin-Latry, K., De Roquefeuil, L., Latry, P., Bégaud, B., Falissard, B., et al. (2009). Risk of death related to psychotropic drug use in older people during the European 2003 heatwave: A population-based case-control study. Am. J. Geriatr. Psychiatry 17, 1059–1067. doi:10.1097/JGP.0b013e3181b7ef6e
Önder, S., and Akay, A. (2014). The roles of plants on mitigating the urban heat islands’ negative effects. Int. J. Agric. Econ. Dev. 2, 18–32.
O’Neill, M. S., Zanobetti, A., and Schwartz, J. (2005). Disparities by race in heat-related mortality in four US cities: The role of air conditioning prevalence. J. Urban Heal 82, 191–197. doi:10.1093/jurban/jti043
Oudin Åström, D., Bertil, F., and Joacim, R. (2011). Heat wave impact on morbidity and mortality in the elderly population: A review of recent studies. Maturitas 69, 99–105. doi:10.1016/j.maturitas.2011.03.008
Pantavou, K., Lykoudis, S., Nikolopoulou, M., and Tsiros, I. X. (2018). Thermal sensation and climate: A comparison of UTCI and PET thresholds in different climates. Int. J. Biometeorol. 62, 1695–1708. doi:10.1007/s00484-018-1569-4
Pillai, S. K., Noe, R. S., Murphy, M. W., Vaidyanathan, A., Young, R., Kieszak, S., et al. (2014). Heat illness: Predictors of hospital admissions among emergency department visits - Georgia, 2002-2008. J. Community Health 39, 90–98. doi:10.1007/s10900-013-9743-4
Prezant, D. J., Clair, J., Belyaev, S., Alleyne, D., Banauch, G. I., Davitt, M., et al. (2005). Effects of the August 2003 blackout on the New York city healthcare delivery system: A lesson for disaster preparedness. Crit. Care Med. 33, S96–S101. doi:10.1097/01.CCM.0000150956.90030.23
Pyrgou, A., Castaldo, V. L., Pisello, A. L., Cotana, F., and Santamouris, M. (2017). On the effect of summer heatwaves and urban overheating on building thermal-energy performance in central Italy. Sustain Cities Soc. 28, 187–200. doi:10.1016/j.scs.2016.09.012
Ramamurthy, P., González, J., Ortiz, L., Arend, M., and Moshary, F. (2017). Impact of heatwave on a megacity: An observational analysis of New York City during July 2016. Environ. Res. Lett. 12, 054011. doi:10.1088/1748-9326/aa6e59
Robine, J. M., Cheung, S. L. K., Le Roy, S., Van Oyen, H., Griffiths, C., Michel, J. P., et al. (2008). Death toll exceeded 70,000 in Europe during the summer of 2003. Comptes Rendus - Biol. 331, 171–178. doi:10.1016/j.crvi.2007.12.001
Romero-lankao, P., Qin, H., and Dickinson, K. (2012). Urban vulnerability to temperature-related hazards: A meta-analysis and meta-knowledge approach. Glob. Environ. Chang. 22, 670–683. doi:10.1016/j.gloenvcha.2012.04.002
Ruiz, J. M., Steffen, P., and Smith, T. B. (2013). Hispanic mortality paradox: A systematic review and meta-analysis of the longitudinal literature. Am. J. Public Health 103, e52–e60. doi:10.2105/AJPH.2012.301103
Sampson, N. R., Gronlund, C. J., Buxton, M. A., Catalano, L., White-Newsome, J. L., Conlon, K. C., et al. (2013). Staying cool in a changing climate: Reaching vulnerable populations during heat events. Glob. Environ. Chang. 23, 475–484. doi:10.1016/j.gloenvcha.2012.12.011
Schlader, Z. J., Wilson, T. E., and Crandall, C. G. (2015). Mechanisms of orthostatic intolerance during heat stress. Neuroscience 196, 37–46. doi:10.1016/j.autneu.2015.12.005
Schladera, Z. J., Wilson, T. E., and Crandall, C. G. (2017). Mechanism of orthostatic intolerance during heat stress. J. Auton. Neurosci. 43, 37–46. doi:10.1016/j.autneu.2015.12.005.Mechanisms
Schwartz, J. (2005). Who is sensitive to extremes of temperature? A case-only analysis. Epidemiology 16, 67–72. doi:10.1097/01.ede.0000147114.25957.71
Semenza, J. C., Rubin, C. H., Falter, K. H., Selanikio, J. D., Flanders, D., Howe, H. L., et al. (1996). Heat-related deaths during the july 1995 heat wave in Chicago. N. Engl. J. Med. 335, 84–90. doi:10.1056/nejm199607113350203
Semenza, J. C., Rubin, C. H., Falter, K. H., Selanikio, J. D., Flanders, W. D., Howe, H. L., et al. (1996). Heat-related deaths during the july 1995 heat wave in Chicago. N. Engl. J. Med. 335, 84–90. doi:10.1056/nejm199607113350203
Sen, J., and Nag, P. K. (2019). Effectiveness of human-thermal indices: Spatio–temporal trend of human warmth in tropical India. Urban Clim. 27, 351–371. doi:10.1016/j.uclim.2018.11.009
Sharma, J., Murthy, I. K., Esteves, T., Negi, P., and Dasgupta, S., (2016). Climate vulnerability and risk assessment: Framework. Methods Guidel.
Sheridan, S. C. (2007). A survey of public perception and response to heat warnings across four North American cities: An evaluation of municipal effectiveness. Int. J. Biometeorol. 52, 3–15. doi:10.1007/s00484-006-0052-9
Simister, J., and Cooper, C. (2005). Thermal stress in the U.S.A.: Effects on violence and on employee behaviour. Stress heal. 21, 3–15. doi:10.1002/smi.1029
Slobodan, S. P., and Simonović, P. S. (2012). Understanding City Resilience through through System Dynamics Simulation.
Stafoggia, M., Forastiere, F., Agostini, D., Biggeri, A., Bisanti, L., Cadum, E., et al. (2006). Vulnerability to heat-related mortality: A multicity, population-based, case-crossover analysis. Epidemiology 17, 315–323. doi:10.1097/01.ede.0000208477.36665.34
Taylor, N. A. S. (2006). Ethnic differences in thermoregulation: Genotypic versus phenotypic heat adaptation. J. Therm. Biol. 31, 90–104. doi:10.1016/j.jtherbio.2005.11.007
Tomlinson, C. J., Chapman, L., Thornes, J. E., and Baker, C. J. (2011). Including the urban heat island in spatial heat health risk assessment strategies: a case study for Birmingham, UK. Int. J. Health Geogr. 10, 42–24. doi:10.1186/1476-072x-10-42
Tourneux, P., Libert, J. P., Ghyselen, L., Léké, A., Delanaud, S., Dégrugilliers, L., et al. (2009). Heat exchanges and thermoregulation in the neonate. Arch. Pediatr. 16, 1057–1062. doi:10.1016/j.arcped.2009.03.014
Tran, K. V., Azhar, G. S., Nair, R., Knowlton, K., Jaiswal, A., Sheffield, P., et al. (2013). A cross-sectional, randomized cluster sample survey of household vulnerability to extreme heat among slum dwellers in Ahmedabad, India. Int. J. Environ. Res. Public Health 10, 2515–2543. doi:10.3390/ijerph10062515
Trang, P. M., Rocklöv, J., Giang, K. B., Kullgren, G., and Nilsson, M. (2016). Heatwaves and Hospital Admissions for Mental Disorders in Northern Vietnam. PLoS One 11, e0155609–e0155620. doi:10.1371/journal.pone.0155609
Turner, L. R., Barnett, A. G., Connell, D., and Tong, S. (2012). Ambient temperature and cardiorespiratory morbidity: A systematic review and meta-analysis. Epidemiology 23, 594–606. doi:10.1097/EDE.0b013e3182572795
Uejio, C. K., Wilhelmi, O. V., Golden, J. S., Mills, D. M., Gulino, S. P., and Samenow, J. P. (2011). Intra-urban societal vulnerability to extreme heat: The role of heat exposure and the built environment, socioeconomics, and neighborhood stability. Heal Place 17, 498–507. doi:10.1016/j.healthplace.2010.12.005
UNFCCC (2016). Opportunities and options for enhancing adaptation actions and supporting their implementation: Reducing vulnerability and mainstreaming adaptation. FCCC/TP/20.
Urban, A., and Kyselý, J. (2014). Comparison of UTCI with other thermal indices in the assessment of heat and cold effects on cardiovascular mortality in the Czech Republic. Int. J. Environ. Res. Public Health 11, 952–967. doi:10.3390/ijerph110100952
Vescovi, L., Rebetez, M., and Rong, F. (2005). Assessing public health risk due to extremely high temperature events: Climate and social parameters. Clim. Res. 30, 71–78. doi:10.3354/cr030071
Watts, N., Amann, M., Arnell, N., Ayeb-Karlsson, S., Belesova, K., Boykoff, M., et al. (2019). The 2019 report of The Lancet Countdown on health and climate change: ensuring that the health of a child born today is not defined by a changing climate. Lancet 394, 1836–1878. doi:10.1016/S0140-6736(19)32596-6
Wilson, A. (2006). Passive Survivability: A New Design Criterion for Buidlings. Environ. Build. News 15.
Xu, R., Zhao, Q., Coelho, M. S. Z. S., Saldiva, P. H. N., Abramson, M. J., Li, S., et al. (2020). Socioeconomic level and associations between heat exposure and all-cause and cause-specific hospitalization in 1,814 Brazilian cities: A nationwide case-crossover study. PLoS Med. 17, 10033699–e1003418. doi:10.1371/journal.pmed.1003369
Yardley, J., Sigal, R. J., and Kenny, G. P. (2011). Heat health planning: The importance of social and community factors. Glob. Environ. Chang. 21, 670–679. doi:10.1016/j.gloenvcha.2010.11.010
Yardley, J., Stapleton, J., Carter, M., Sigal, R., and Kenny, G. (2013). Is Whole-Body Thermoregulatory Function Impaired in Type 1 Diabetes Mellitus? Curr. Diabetes Rev. 9, 126–136. doi:10.2174/1573399811309020004
Ye, X., Wolff, R., Yu, W., Vaneckova, P., Pan, X., and Tong, S. (2012). Ambient temperature and morbidity: A review of epidemiological evidence. Environ. Health Perspect. 120, 19–28. doi:10.1289/ehp.1003198
Young, A. (2021). UTCI Universal Thermal Climate Index Documents. Available at: http://www.utci.org/utci_doku.php (accessed January 2, 2021).
Zanobetti, A., O’Neill, M. S., Gronlund, C. J., and Schwartz, J. D. (2013). Susceptibility to mortality in weather extremes: Effect modification by personal and small-area characteristics. Epidemiology 24, 809–819. doi:10.1097/01.ede.0000434432.06765.91
Keywords: heat vulnerability, system dynamics modelling, extreme heat events, building simulation (BS), heat adaptation
Citation: Bayomi N and Fernandez JE (2023) Quantification of heat vulnerability using system dynamics. Front. Built Environ. 9:1025480. doi: 10.3389/fbuil.2023.1025480
Received: 22 August 2022; Accepted: 06 March 2023;
Published: 04 April 2023.
Edited by:
Junqing Tang, Peking University, ChinaCopyright © 2023 Bayomi and Fernandez. This is an open-access article distributed under the terms of the Creative Commons Attribution License (CC BY). The use, distribution or reproduction in other forums is permitted, provided the original author(s) and the copyright owner(s) are credited and that the original publication in this journal is cited, in accordance with accepted academic practice. No use, distribution or reproduction is permitted which does not comply with these terms.
*Correspondence: Norhan Bayomi, bm91cmhhbkBtaXQuZWR1
Disclaimer: All claims expressed in this article are solely those of the authors and do not necessarily represent those of their affiliated organizations, or those of the publisher, the editors and the reviewers. Any product that may be evaluated in this article or claim that may be made by its manufacturer is not guaranteed or endorsed by the publisher.
Research integrity at Frontiers
Learn more about the work of our research integrity team to safeguard the quality of each article we publish.