
94% of researchers rate our articles as excellent or good
Learn more about the work of our research integrity team to safeguard the quality of each article we publish.
Find out more
ORIGINAL RESEARCH article
Front. Built Environ., 31 October 2022
Sec. Sustainable Design and Construction
Volume 8 - 2022 | https://doi.org/10.3389/fbuil.2022.997380
This article is part of the Research TopicAutomation and Artificial Intelligence in Construction and Management of Civil InfrastructureView all 5 articles
 Waheeb E. Alnaser1*
 Naser W. Alnaser2
 Amer J. Almarabheh3Ahmed M. Al-Ansari4,5,6Hala H. Al-Aali7Amjad Z. Ghanem8
Background: There has been a belief in and strong thought about the existence of a relationship between meteorological parameters and the spread of SARS-CoV-2. Many studies have been conducted but with a short period of investigation, i.e., not more than 4 months. Therefore, the relation between 27 months of SARS-CoV-2 recorded data and meteorological parameters is reported. The aim of this study is to use this vast data to examine whether average temperature, average wind speed, and absolute humidity are clearly correlated with the number of infected SARS-CoV-2 cases in Bahrain or not, which may be applicable to countries that have similar topography.
Method: The official recorded data of SARS-CoV-2 cases in Bahrain from the first day that SARS-CoV-2 cases were detected (February 24, 2020) until May 18, 2022, along with 4 meteorological parameters (temperature, wind speed, relative humidity, and absolute humidity) were used. The data were analyzed using SPSS where a p-value less than 0.05 was considered as statistically significant.
Result: There is a negative significant correlation between new daily cases of SARS-CoV-2 and temperature, T, and absolute humidity, AH, (r = −0.290, −0.317; p < 0.001, respectively). The results also show a positive significant correlation between daily cases of SARS-CoV-2 and wind speed (V) (r = −0.110; p = 0.002). No correlation was found between daily cases of SARS-CoV-2 and relative humidity (r = −0.028; p = 0.429). An empirical relation is reported, allowing the estimation of SARS-CoV-2 cases in Bahrain as a function of three weather parameters: T, AH, and V.
SARS-CoV-2 began spreading very aggressively worldwide in January 2020. During this time, the weather in countries hit by this virus was very cold. In Wuhan City in China, in January 2020, the average temperature was 4°C, rising to about 7°C in February and to 11°C in March (World Climate Guide, 2020; W&C and Climate, 2020; see Table 1; Figure 1). China officially announced the defeat of the coronavirus in Wuhan on March 10, 2020, after there had been 80,754 confirmed cases and 3,136 deaths (BBC, 2020). During January 2020, in China, the average hours of sunshine (low solar radiation) were low too; it was about 3 h in January and February, and rose to 4 h in March (see Table 2; Figure 2; World Climate Guide, 2020; W&C and Climate, 2020). Therefore, virologists and medical teams thought that this virus was affected to a large extent by the weather.
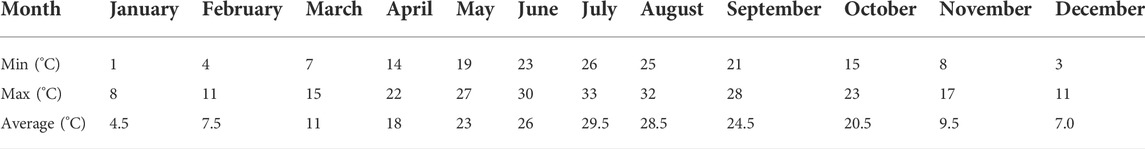
TABLE 1. Maximum and minimum temperature in Wuhan City, China (World Climate Guide, 2020).
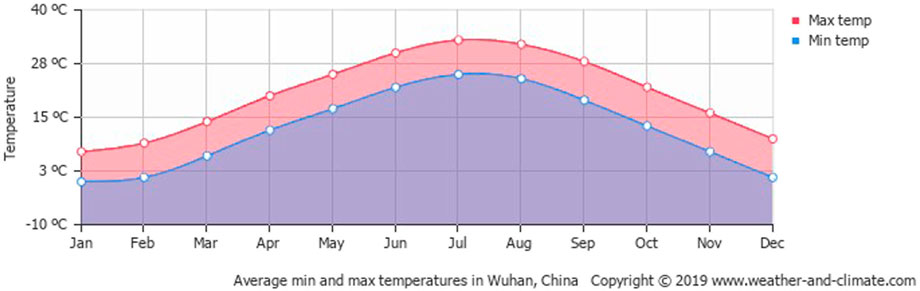
FIGURE 1. Average minimum and maximum temperature over the year (W&C and Climate, 2020).

TABLE 2. Average daily sunshine hours in Wuhan City (World Climate Guide, 2020).
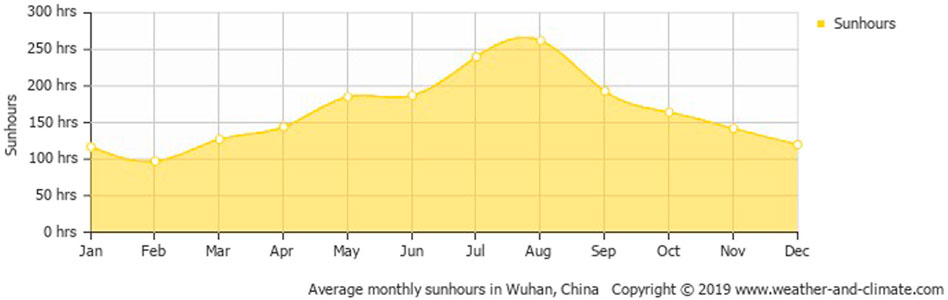
FIGURE 2. Average monthly hours of sunshine in Wuhan (Hubei) (W&C and Climate, 2020).
With the strong spread of SARS-CoV-2 to the Middle East and Gulf Cooperation Council Countries (with Bahrain among them), which have relatively warm weather in March, this assumption became weak. The lowest estimated fatality rate of SARS-CoV-2 is 1–2% of known patients, which is less than the fatality of the influenza virus (0.1% for winter influenza) (Griffiths, 2020). It was expected that fewer infected cases from SARS-CoV-2 would occur when the weather warmed up, bearing in mind that more than 100 cases had been confirmed in Singapore during January to March 2020, where it is very warm and humid. The virus hit Australia, Brazil, and Argentina (southern hemisphere) all during the period of the middle of summer, and this weakened the thought that the virus was active in cold weather. Currently, the total number of SARS-CoV-2 cases total 547 million with 6.34 million deaths, according to CSSEGIS and data by John Hopkins (CSSEGISandData by Jones Hopkins, 2022).
Research shows that sunlight cuts the virus’s ability to grow by half, so the half-life will be 2.5 min. In the dark it is about 17 min which indicates that sunlight is very good at killing viruses (Woodley, 2020). This explains why Australia and the Southern Hemisphere—near China—did not see large infection rates, as they have lots of sunlight in January to February, being in the middle of summer.
The effects of temperature and relative humidity on the viability of the SARS-CoV was studied (Chan et al., 2011). It was reported that dried virus on smooth surfaces retained its viability for over 5 days at temperatures of 22–25°C and relative humidity of 40–50%, while it rapidly loses its viability (>3 log10) at higher temperatures and higher relative humidity (e.g., 38°C and relative humidity of >95%)—as shown in Figure 3. The authors Chan et al. (2011) reported that better stability of SARS-CoV at a low temperature and low humidity environment may facilitate its transmission, and this explains why some Asian countries in tropical areas—with high temperatures and a high relative humidity environment—did not have major community outbreaks of SARS-CoV-2 during that time. However, it is well understood now that surface transmission of COVID-19 is not a dominant driver (Lewis, 2021; Nye, 2022).

FIGURE 3. Residual virus infectivity at 22–25°C with relative humidity 40–50% (starting titer 105/10 μl) and at 33 °C or 38 °C with relative humidity >95% (Chan et al., 2011).
Lamarre and Talbot (1989) studied the effect of temperature on the infectivity of the human Coronavirus 229E, and they found that the stability of Coronavirus 229E infectivity was maximum at pH 6.0 when incubated at either 4°C or 33°C. However, the influence of pH was more pronounced at 33°C. The viral infectivity was completely lost after a 14-day incubation period at 22, 33, or 37°C, but remained relatively constant at 4°C for the same length of time.
The association between SARS-CoV-2 deaths and weather parameters was further studied (Ma et al., 2020). The daily deaths from SARS-CoV-2, and meteorological and air pollutant data from January 20, 2020, to February, 2020, in Wuhan, China, were used. It was found that the total of SARS-CoV-2 mortality counts in Wuhan, China, was 2,299. A positive association with SARS-CoV-2 mortality was observed for diurnal temperature range (correlation coefficient, r = 0.44), but negative association for relative humidity (r = −0.32). This means that the temperature variation and humidity are important factors affecting COVID-19 mortality.
Patterns in the local weather of the regions affected by SARS-CoV-2 until March 22, 2020, were analyzed (Bukhari and Jameel, 2020). It was found that 83% of testing was conducted in non-tropical countries (latitude of more than 30° N), and 90% of the SARS-CoV-2 cases were recorded in the same countries within a temperature range of 3–17°C. Similarly, nearly 72% of the measurements were done in countries with absolute humidity between 3 and 9 g/m3, and 90% of the cases were observed within the same range of absolute humidity. The higher number of tests and global connectivity of the northern cooler countries may explain the difference in number of confirmed SARS-CoV-2 cases between cooler and warmer humid regions, due to a limited time span and limited data. Therefore, it is possible that weather plays a role in the spread of SARS-CoV-2 which warrants investigation and research. It was reported (Bukhari and Jameel, 2020) that thousands of new cases were documented in regions with T > 18°C, suggesting that the role of warmer temperature in slowing the spread of the SARS-CoV-2 might only be observed at much higher temperatures.
Many scientists believe that SARS-CoV-2 may be a result of global warming. In all, 19 of the 20 warmest years have all occurred since 2001, with the exception of 1998 (NASA, 2020; see Figure 4).
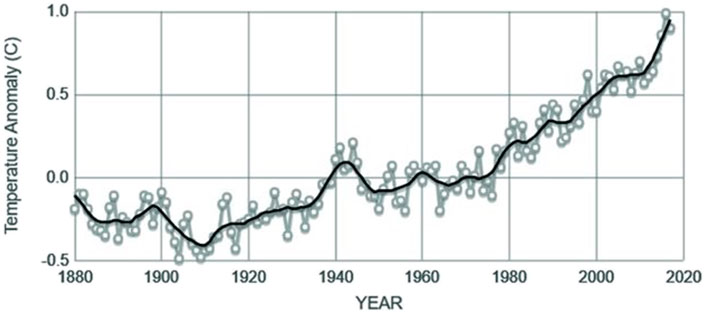
FIGURE 4. Global land–ocean temperature (NASA, 2020).
According to Berkeley Earth, 2019 was the second warmest year on Earth since 1850 (Readfearn, 2020); the global mean temperature in 2019 was colder than 2016, but warmer than every other year that has been directly measured. The average global temperature in 2021 was about 1.11 (±0.13)°C above pre-industrial (1850–1900) levels (may be 13°C). The year 2021 is the seventh consecutive year (2015–2021) where global temperature has been over 1°C above pre-industrial levels, according to all the datasets compiled by World Meteorological Office (WMO, 2022).
Scientists claim that many new diseases have been created due to a new generation of viruses because of accelerating global warming; this was brought to the world’s attention 2–3 decades ago. A new record in February 2020 was registered for Antarctica with the hottest temperature on record (18.3°C), beating the previous record by 0.8°C in March 2015, which is a sign that warming in Antarctica is happening much faster than the global average (The Guardian.com, 2020).
It was also reported (Allen, 2020) that maintaining relative humidity in the 40–60% range in indoor spaces could help slow the spread of the SARS-CoV-2 in winter. This was justified as humidity can affect virus transmission in three ways: 1) higher humidity can enhance the body’s ability to fight off infection, 2) the coronavirus decays faster at close to 60% relative humidity than at other levels, and 3) drier air can lead to greater numbers of tiny coronavirus particles that travel farther and penetrate more deeply into the lungs. A level of relative humidity of 40–60% is thought to be the optimal value.
Furthermore, analyses (Clouston et al., 2021) revealed that days with temperatures ranging between 16°C and 28°C, where wind speed was < 2.5 m/s, increased SARS-CoV-2 incidence (adjusted incidence rate ratio (aIRR) = 1.45, 95% confidence interval (C.I.)= [1.28–1.64], p < 0.001), compared to days with average wind speed of ≥ 2.5 m/s. It was concluded that reduced wind speed had an association with transmission rates during warmer spells; below a certain temperature, wind speed made little difference to transmission rates, possibly because people were more likely to socialize indoors (Clouston et al., 2021).
The effect of meteorological factors on COVID-19 was examined using the Spearman correlation test (Rendana, 2020). It was concluded that low wind speed is significantly correlated with a higher number of COVID-19 cases (r = −0.314; p < 0.05) in Jakarta, Indonesia. Similarly, low temperatures and sunshine hours are correlated with a higher number of SARS-CoV-2 cases (r = −0.447; p < 0.01, r = −0.362; p < 0.05, respectively). However, there are no significant linear correlations between humidity and rainfall with SARS-CoV-2 cases (p > 0.05).
To our knowledge, no research had studied the relation between meteorological parameters and elements (temperature, wind speed, relative humidity, and absolute humidity) with daily recorded cases of COVID-19 (SARS-CoV-2) for 2 years and nearly 3 months (starting February 24, 2020, and ending May 18, 2022). The first recorded SARS-CoV-2 cases in Bahrain was on February 24, 2020 and they were 5 cases only and the largest recorded ever was on February 3, 2022 and they were 8063 cases; where the tested cases in this day was about 33,630 (MoH, 2020). In studying correlations between variables, more data were collected for different variables, with a greater span of time, and a more precise and reliable correlation is found between such variables. It is the aim of this study to use this vast amount of data to examine whether average temperature, average wind speed, and absolute humidity are clearly correlated with number of infected SARS-CoV-2 cases in Bahrain or not. Since Bahrain is located in the middle of the west coast of the Arabian Gulf Sea (in the arid zone), this location represents nearly the middle of the world, which makes this study significant.
Bahrain is located in the arid zone, with a climate known for being hot and dry, lying 30° north and south of the Equator. Bahrain has pleasant winters, but very warm and humid summers. Rainfall is negligible from April to the end of October, coinciding with high temperatures. The relative humidity is highest during the winter months of December through February, although other months of the year show only slightly lower levels. Onshore wind speeds are typical throughout the year, ranging from 3.8 to 5.5 m/s (Worldatlas.com, 2022).
During the summer months from April to October, afternoon temperatures average 40°C and can reach 46°C during May, June, and July. The combination of intense heat and high humidity makes this season uncomfortable. In addition, a hot, humid southwest wind periodically blows across the barren southern end of Bahrain toward Manama in the summer and causes an increase in apparent temperature. Temperatures in the winter months from November to March range from 10 to 20°C. Humidity often rises above 90% in the winter. From December to March, prevailing winds from the northwest bring damp air over the islands. The coldest temperature ever recorded in Bahrain was on January 20, 1964, when it dropped to -5°C in Awali City and 2.7°C at Bahrain International Airport (Awaligolfclub.com, 2022; Wikipedia, 2022). Figures 5–7 are long-term data showing the mean average temperature, mean average wind speed, and mean average relative humidity, respectively.
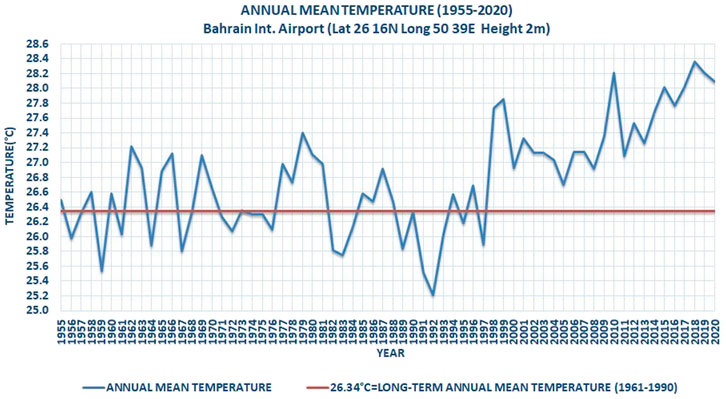
FIGURE 5. Variation of annual mean average temperature in the Kingdom of Bahrain from 1955 to 2020. The long-term annual mean temperature is 26.34°C (average of data from 1961 to 1990).
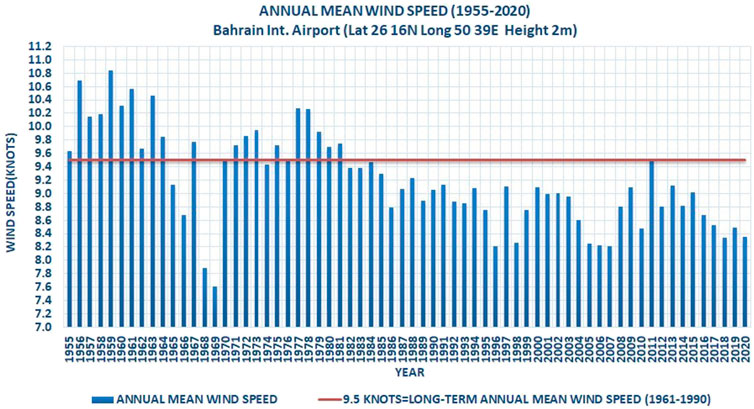
FIGURE 6. Variation of annual mean average wind speed in the Kingdom of Bahrain from 1955 to 2020. The long-term annual mean speed is 9.5 knots = 4.75 m/s = 17.1 km/h (average of data from 1961 to 1990).
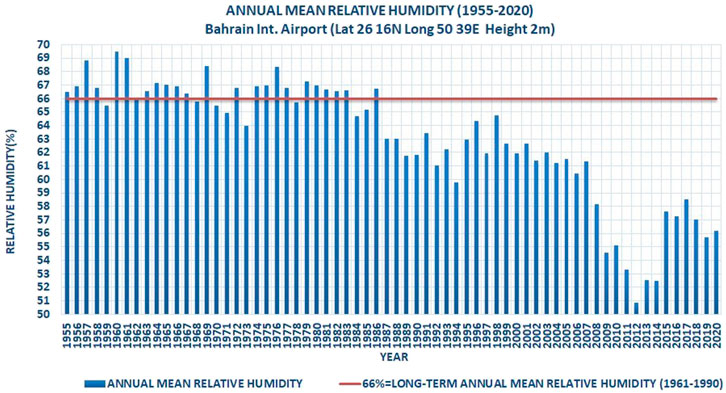
FIGURE 7. Variation of annual mean average temperature relative in the Kingdom of Bahrain from 1955 to 2020. The long-term annual mean temperature is 66% (average of data from 1961 to 1990).
Although several health, genetic, and demographic factors are associated with the rate of spread of SARS-CoV-2 cases, such a climate may impose a behavior of virus spreading, virus immolating, or virus multiplication; not only SARS-CoV-2 viruses but others too, depending on the nature of the virus.
The actual data were collected for the number of daily new confirmed cases, recovered cases, deaths, and tests administered from the National Taskforce, through the official website of the Ministry of Health (healthalert.gov.bh), to combat the coronavirus in the Kingdom of Bahrain. The data are reported in an Excel sheet, where the data for each day were reported at the end of the day and represent the actual data for that specific day.
All examined SARS-CoV-2 patient results and data in the Kingdom of Bahrain are stored in the National Health System (called I-Seha), and a representative sample from each month were sequenced and stored in the Central Virology Biobank at Public Health Laboratories, Ministry of Health, for further study.
Recorded data from the first day that COVID-19 cases were detected (February 24, 2020) until May 18, 2022 (2 years and nearly 3 months) were made by Bahrain Meteorological Directorate, Ministry of Transport and Communication. The station is well calibrated and regularly updated. The station is located at Bahrain International Airport, Muharraq Town, the former capital of Bahrain. The data is measured continuously and distributed at 10-min intervals, then at hourly intervals and per day to per month to per year. The station records various meteorological parameters; however, for this research we selected the most important parameters that are believed to affect SARS-CoV-2 viruses more heavily. These weather parameters are average temperature, maximum temperature, relative humidity, and wind speed.
Absolute humidity was not measured directly in the station; therefore, we took advantage of the recorded water vapor pressure Pv (in Pa) in the station and converted it to absolute humidity, AH (in g/m3), using the knowledge of the average temperature (in K) with the following relation:
where, for example, at a temperature of 20°C (293 K), relative humidity is 45%, PV of 1,053 Pa, the AH = 7.8 g/m3. The values of AH at different temperatures, relative humidity, and vapor pressure can be calculated using the Absolute Humidity Calculator by Omni Calculator (OmniCalculator.com, 2022).
These weather meteorological data represent the entire island because the area of the main island of Bahrain (the capital Manama) is about 604 km2 (about 51 km by 18 km), with latitude 26.03°N and longitude 50.55°E. The total area of the Kingdom of Bahrain is about 750 km2. Relatively long-term meteorological parameters measured in five places in Bahrain show a variation between them of no more than 10% between locations due to the topography of Bahrain and its small area; part of the variation is due to the presence of the urban environment.
The descriptive analyses, mean, standard deviation (S.D), quartile [percentile 25 (p25), percentile 75 (p75), and median (p50)], minimum, and maximum were used to describe the distribution of daily new cases of SARS-CoV-2 and meteorological parameters (variables). The Pearson correlation coefficient was used to measure the relationship between meteorological parameters and SARS-CoV-2 of 2 years and 3 months of cases (27 months). A multiple linear regression model was used to predict confirmed new daily cases of SARS-CoV-2 according to meteorological parameters [average temperature (T), average wind speed (V), and average absolute humidity (AH)]. A scatter diagram and simple regression line presented the association (relationship) between previously continuous variables. The data were entered in MS Excel and analyzed using Statistical Package for Social Sciences (SPSS) Version 28. A p-value less than 0.05 was considered as statistically significant, which indicates strong evidence against the null hypothesis, as there is less than a 5% probability the null hypothesis is correct.
We performed a descriptive analysis of daily new cases and meteorological parameters (variables). During the study period, the results showed that the total number of confirmed SARS-CoV-2 cases was 579,410, with a daily average of 710.93 [min = 0; max = 8,174]. The daily average of meteorological parameters was 28.05 (±6.50)°C, 55.18 (±11.97) %, 8.71 (±3.87) knots, and 15.48 (±4.86) g/m3 for temperature, relative humidity, wind speed, and absolute humidity, respectively (Table 3).
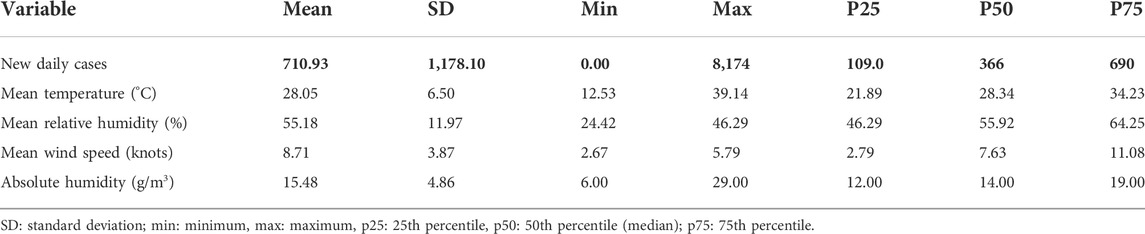
TABLE 3. Descriptive statistics for new daily cases and meteorological parameters (n = 815).
The Pearson correlation coefficient was used, and the results are illustrated in Table 4. The table shows that there is a negative statistically significant correlation between new daily cases of SARS-CoV-2 and mean temperature and absolute humidity (r = −0.290, −0.317; p < 0.001, respectively). The results also show a positive statistically significant correlation between new daily cases of SARS-CoV-2 cases and wind speed, due to very low value of P (r = −0.110; p = 0.002), i.e., there is a tendency, because of low r, for wind speed to affect SARS-CoV-2 cases, i.e., the greater the wind speed, the greater the spread of the virus and subsequently, more recorded cases. Regarding relative humidity, the results indicate that there was no statistically significant correlation between new daily cases of SARS-CoV-2 and mean average relative humidity (r = −0.028; p = 0.429). This is expected since relative humidity is the amount of water vapor that is present in the air, relative to the amount it could hold at that given temperature, which is different from absolute humidity which is the ratio of the mass of water vapor to the mass of dry air.
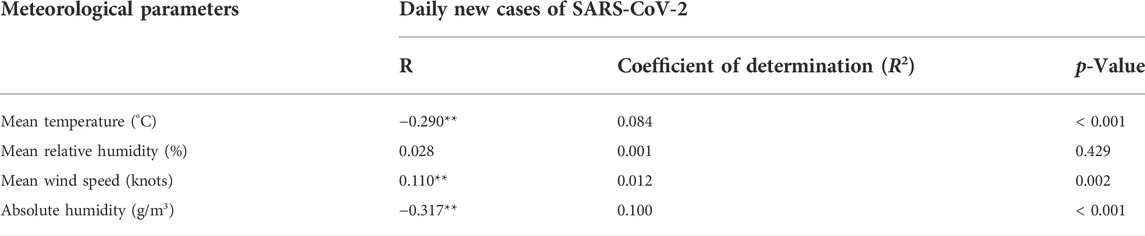
TABLE 4. Pearson correlation coefficient between new daily cases of COVID-19 and meteorological parameters.
The following relationships are found between number of SARS-CoV-2 cases in Bahrain and the meteorological parameter:
1)_ New daily cases of SARS-CoV-2 (Y) with temperature (T):
2) New daily cases of SARS-CoV-2 (Y) with relative humidity (RH):
3) New daily cases of SARS-CoV-2 (Y) with wind speed (V):
4) New daily cases of SARS-CoV-2 (Y) with absolute humidity (AH):
For further illustration, Figures 8–11 show the scatter diagram and simple regression line which present the relationship between new daily cases of SARS-CoV-2 and the meteorological parameters. The figures also show the value of the coefficient of determination (R2) which indicates the percentage of variation in new daily cases of SARS-CoV-2 that can be explained by the variation in the meteorological parameters (temperature, relative humidity, wind speed, and absolute humidity), which was found to be 8.4%, 0.1%, 1.2%, and 10%, respectively, and tell us how well the best-fit line represents the data.
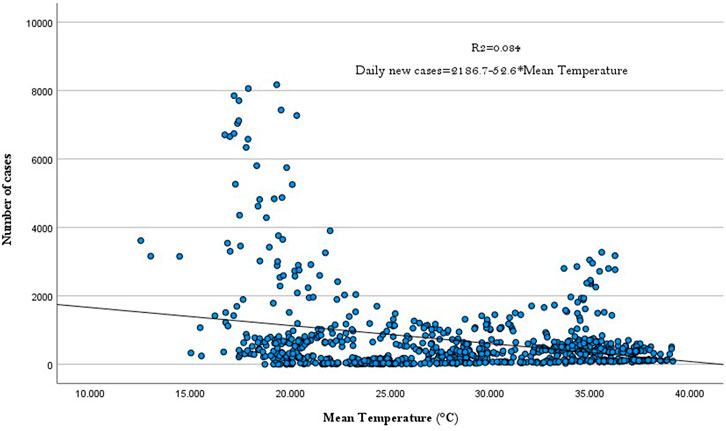
FIGURE 8. Scatter diagram and simple regression line presenting the relationship between new daily cases of SARS-CoV-2 and mean average temperature in Bahrain for 27 months of recorded cases.
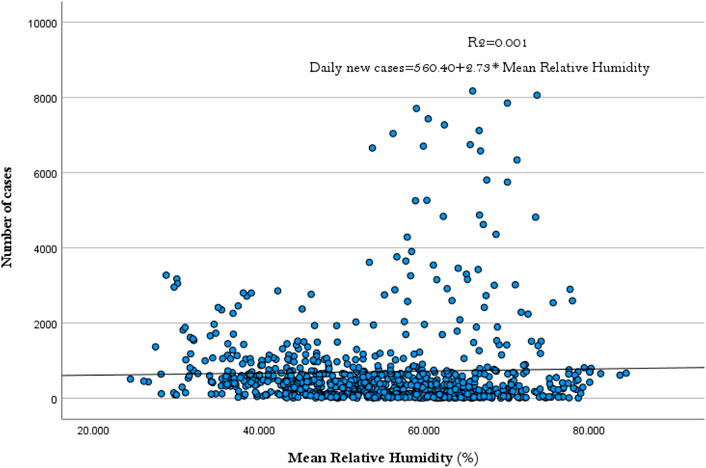
FIGURE 9. Scatter diagram and simple regression line presenting the relationship between new daily cases of SARS-CoV-2 and mean average relative humidity in Bahrain for 27 months of recorded cases.
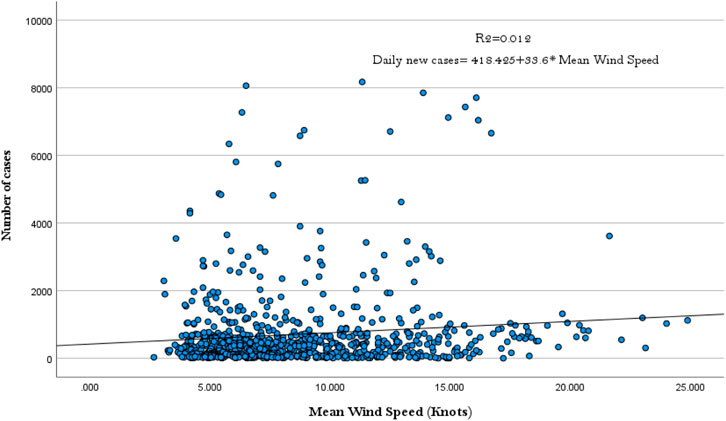
FIGURE 10. Scatter diagram and simple regression line presenting the relationship between new daily cases of SARS-CoV-2 and mean average wind speed in Bahrain for 27 months of recorded cases.
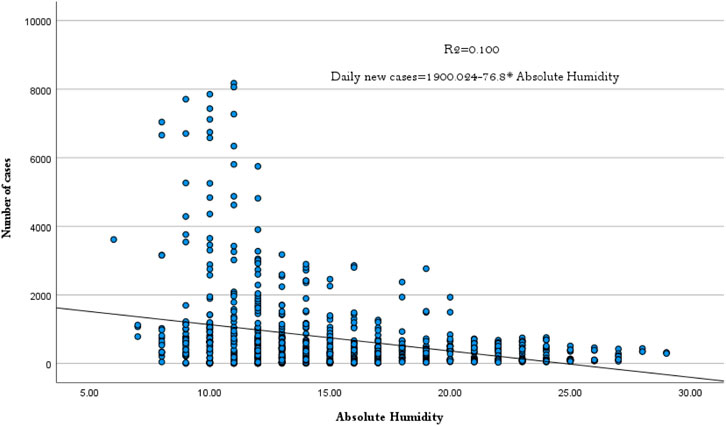
FIGURE 11. Scatter diagram and simple regression line presenting the relationship between new daily cases of SARS-CoV-2 and mean average absolute humidity in Bahrain for 27 months of recorded cases.
To predict the daily expected cases of SARS-CoV-2 under specific meteorological parameters [average temperature (T), average wind speed(V), and average absolute humidity (AH)], a multiple linear regression model was implemented for modeling the relationship between a scalar dependent variable Y (daily new cases of SARS-CoV-2) and one or more independent variables X (meteorological parameters: T, V, and AH) (Freedman, 2010) to obtain the following linear equation:
To test this equation, let us assume two extremes (unfavorable and favorable and in lieu to spreading SARS-CoV-2). For unfavorable weather parameters to the spreading of SARS-CoV-2, T = 40°C, V = 1 knot (0.5 m/s), RH = 60%, which can be converted to AU using first Tetens equation (Fxsolver.com, 2022) to calculate the saturated water vapor pressure Ps (using Eq. 7), and then calculate Pv (using Eq. 8) and finally AU from Eq. 1 (T in Eq. 7 in °C), i.e.,
Therefore, for unfavorable weather parameters to the spreading of SARS-CoV-2 (T = 40°C, V = 1 knot (0.5 m/s), RH 60%, PV = 4,431 Pa, and AH = 30.7 g/m3), the number of expected infected SARS-CoV-2 cases is 364, i.e.,
For favorable weather parameters to the spreading of SARS-CoV-2 (T = 10°C, V = 14 knot (7 m/s), RH = 20%, Pv = 245 Pa and AH = 1.9 g/m3), the number of expected infected SARS-CoV-2 cases is 2,476, i.e.,
For comparison, Figure 12 was established. It shows a comparison between the actual number of infected cases by SARS-CoV-2 for the period of the recorded data for 27 months in Bahrain, i.e., infected cases from 1 July up to 31 August (69 data set). The average deviation from the total actually recorded and that estimated from the empirical equation is found not to equal 7.9%; the total number of actual cases from 1 July to 31 August was 44,370 against the calculated number from Eq. 6 which was 40, 858 or the daily monthly average of 727 against 670. This is an encouraging number when testing the model out of the initial data set (27 months), knowing that the variant SARS-CoV-2 after June 2022 had converted to more than three types of sub-variance of Omicron (BA 2, BA4, and BA 5) with further sub-linages (BA5.1, BA5.2, etc.). These have an effect on the infected number, bearing in mind that more than 95% of the population in Bahrain (above the age of 18) were vaccinated with two doses and about 84% received the booster dose (Bahzad, 2022). It has to be noted that Bahrain, so far, had completed a total of 10, 322,918 PCR tests, since the start of the SARS-CoV-2 pandemic; this means that every person in Bahrain has been subjected to a SARS-CoV-2 PCR test at least 7 times, as the population of Bahrain is about 1.5 million. The total number of infected people in Bahrain who have recovered is 671, 331.
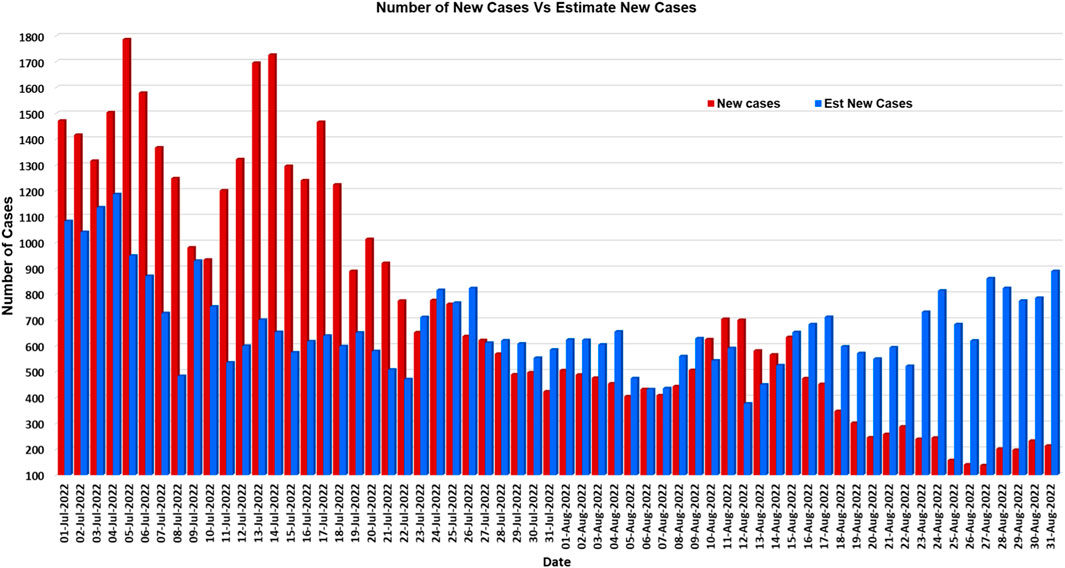
FIGURE 12. Comparison between the actual number of infected cases by SARS-CoV-2 in Bahrain for the period post of the recorded data for 27 months, i.e., infected cases from 1 July to 31 August (60 data sets).
Furthermore, the empirical equation (Eq. 6) has the following form:
where A, B, C, and D are constants, and x, y, and z are the weather variables. These constants embed the amount of the topography of the location, the wind distribution (Weibel distribution and other effects, such as the swirl of wind throughout the tower and low-level buildings), as well as population density in different regions. For the equation to be more accurate, different constants could be introduced for each type of region, although Bahrain, in general, has slightly varying weather measurements from one region to another (not more than 10%).
Based on the above observations and findings, we are confident that temperature and wind speed are two weather parameters that are connected to the spread of SARS-CoV-2 and, to a lesser degree, the absolute humidity also.
Our results to a certain extent agree with the findings reported for Bangladesh (Arefin et al., 2021), with analyses showing that with the decrease in temperature, the infection rate increased significantly. Also, the number of infections increases as wind speed increases. As the absolute humidity rate in Bangladesh is almost constant, the authors are unable to predict any relation of absolute humidity with the number of infections. Furthermore, the prediction for the number of infections based on wind direction for the several regions of seven divisions in Bangladesh is vulnerable for the coming several months.
Data of COVID-19 confirmed cases collected daily, air quality, and meteorological variables of 33 locations in China for the outbreak period January 29, 2020, to February 15, 2020, and the effect of the Air Quality Index (AQI) on confirmed cases associated with an increase in each unit of AQI were statistically significant in several cities in China (Xu et al., 2020); AQI was statistically significantly negatively correlated with temperature and wind speed (r = −0.30 and −0.20, respectively), while no significant correlation was observed with atmospheric pressure. This means if the temperature increases, the number of cases decreases; it also means that if wind speed increases, the number of cases decreases. This latter point contradicts our observation. It has to be noted herein that the period of investigation is only 1 month.
Recently Diao et al. (2020) reported a significant correlation (p < 0.05) between the spread and decay durations with population density in China, England, Germany, and Japan. The spread duration showed a high correlation with population density and absolute humidity (p < 0.05), whereas the decay duration demonstrated the highest correlation with population density, absolute humidity, and maximum temperature (p < 0.05), i.e., high absolute humidity and temperature lead to high decay of the virus, which agrees with our findings.
A reported theoretical finding by Alqudah et al. (2021) shows that the average number of confirmed COVID-19 cases has cyclic trends related to temperature, humidity, wind speed, and pressure. The wind speed shows the most significant effect on the spread of the virus; the spread decreases with a wind speed of 12.5 m/s (45 km/h) but increases at 3.5 m/s (50 km/h). This means that high wind leads to a low spread of the disease, which agrees with our actual observation (27 months).
In another study (Jefferson and Heneghan, 2020), an inverse relationship was identified between temperature (in blocks of 5°C changes) and humidity (in 10% steps) and the incidence of COVID-19, even before symptoms appear. It suggested that a cold and dry environment is a more favorable condition for virus survival and incubation; it also suggested an inverse association with wind speed—which may indicate a shorter suspension time of SARS-CoV-2 in the air and an inverse association with a higher UV index (but only in the 2 weeks prior to the incidence), leading to viral destruction at higher temperatures.
In a previous work (Al Dallal et al., 2021), statistical study shows that the closure-based interventions and precautionary measures in Bahrain were effective in slowing down the spread of SARS-CoV-2 disease, while some religious occasions involving mass gatherings caused the disease to spread again. The closure-based interventions and precautionary measures seem to be highly related to avoiding the spread of disease due to wind speed and absolute humidity; simply, people will be at home (low wind speed and low absolute humidity due to air-conditioning).
This study urges policymakers to think seriously in future built environment and urban design for cities—both classical and smart. Policies must be initiated and studied for future design. The built environment should be innovative to tackle and disable the spread of viruses in the community by having special considerations for weather parameters that accelerate or decelerate the spread of this virus—which is expected to be with us for a long time—in particular, wind speed, absolute humidity, and temperature. They do not have a direct effect but rather have a consequence, as people stay at home during the pandemic more than being out of doors. The available advanced technologies are able to contribute to serving this purpose. In fact, the policy in this issue should also complement the built environment to combat and abate the climate change consequences (Alnaser et al., 2022).
This study fills a gap on the holistic relation between the spread of recorded cases of SARS-CoV-2 and classically known meteorological parameters. Nearly all surveyed or studied research in this issue covers data during a period no more than 6 months, but this study covers 27 months. The following is the major findings of the research:
1) There is a negative statistically significant correlation between new daily cases of SARS-CoV-2 and mean temperature (r = −0.290; p < 0.001).
2) There is a negative statistically significant correlation between new daily cases of SARS-CoV-2 and average absolute humidity (r = −0.317; p < 0.001).
3) There is a positive statistically significant correlation between new daily cases of SARS-CoV-2 cases and average wind speed (r = −0.110; p = 0.002), i.e., there is a tendency for wind speed to affect SARS-CoV-2 cases.
4) There is no statistically significant correlation between new daily cases of SARS-CoV-2 and mean relative humidity (r = −0.028; p = 0.429).
5) The relationship between expected daily infected cases of SARS-CoV2 (Y) and the meteorological parameters of mean relative humidity (T), average wind speed (V), and average absolute humidity (AH) takes the following empirical form:
The datasets presented in this study can be found in online repositories. The names of the repository/repositories and accession number(s) can be found at: https://healthalert.gov.bh/en/.
All authors listed have made a substantial, direct, and intellectual contribution to the work and approved it for publication.
The authors thank Arabian Gulf University (AGU) and the University of Bahrain (UoB) for their support in publishing this article. Thanks are extended to the Ministry of Health and the Ministry of Transport and Communication, Kingdom of Bahrain, for making available accurate data on SARS-CoV-2 and accurate long-term meteorological data.
The authors declare that the research was conducted in the absence of any commercial or financial relationships that could be construed as a potential conflict of interest.
All claims expressed in this article are solely those of the authors and do not necessarily represent those of their affiliated organizations, or those of the publisher, the editors, and the reviewers. Any product that may be evaluated in this article, or claim that may be made by its manufacturer, is not guaranteed or endorsed by the publisher.
Al Dallal, A., Al Dallal, J., Alnaser, W. E., Ashqar, M. Y., and AlAnzi, B. S. (2021). Trajectory analysis of the coronavirus pandemic and the impact of precautionary measures in the Kingdom of Bahrain. Arab J. Basic Appl. Sci. 28 (1), pp135–144. doi:10.1080/25765299.2021.1886390
Allen, J. (2020). Washington Post opinion piece co-authored. Available at: https://www.hsph.harvard.edu/news/hsph-in-the-news/op-ed-humidity-can-aid-in-the-fight-against-covid-19/(Accessed in July 1, 2022).
Alnaser, N. W., Flanagan, R., Kazmerski, L., Sayigh, A. A., Nayfeh, N., and Alnaser, E. W. E. (2022). Worrying about climate change. Atmos. Clim. Sci. 12, 441–461. doi:10.4236/acs.2022.122026
Alqudah, M. A., Abdeljawad, T., Zeb, A., Khan, I. U., and Bozkurt, F. (2021). Effect of weather on the spread of COVID-19 using eigenspace decomposition. Comput. Mater. Contin. 69, 3047–3063. doi:10.32604/cmc.2021.017752
Arefin, M. A., Nabi, M. N., Islam, M. T., and Islam, M. S. (2021). Influences of weather-related parameters on the spread of Covid-19 pandemic – the scenario of Bangladesh. Urban Clim. 38, 100903. doi:10.1016/j.uclim.2021.100903
Awaligolfclub.com (2022). Awaligolfclub.com. Available at: http://www.awaligolfclub.com/pages/page_interesting_articles/1964_01_20_lowest_temp_in_bahrain/lowest_temp.html (Accessed September 8, 2022).
Bahzad, W. (2022). Private communication. Senior urology resident, salmanyia medical centre; member of national task force of COVID -19; managing member of COVID -19 outpatient treatment centre. Kingdom of Bahrain.
BBC (2020). Coronavirus: China says disease 'curbed' in wuhan and hubei. Available at: https://www.bbc.com/news/world-asia-china-51813876 (Accessed in September, 2020).
Bukhari, Q., and Jameel, Y. (2020). Will coronavirus pandemic diminish by summer? Available at: https://ssrn.com/abstract=3556998.
Chan, K. H., Malik Peiris, J. S., Lam, S. Y., Poon, L. L. M., Yuen, K. Y., and Seto, W. H. (2011). The effects of temperature and relative humidity on the viability of the SARS coronavirus. Adv. Virology. 2011, 1–7. doi:10.1155/2011/734690
Clouston, S. A. P., Morozova, O., and Meliker, J. R. A. (2021). A wind speed threshold for increased outdoor transmission of coronavirus: An ecological study. BMC Infect. Dis. 21, 1194. doi:10.1186/s12879-021-06796z
CSSEGISandData by Jones Hopkins (2022). CSSEGISand/COVID-19. Available at: https://github.com/CSSEGISandData/COVID-19 (Accessed July 6, 2022).
Diao, Y., Kodera, S., Anzai, D., Gomez-Tames, J., Rashed, E. A., and Hirata, A. (2020). Influence of population density, temperature, and absolute humidity on spread and decay durations of COVID-19: A comparative study of scenarios in China, England, Germany, and Japan. One Health 12, 100203. doi:10.1016/j.onehlt.2020.100203
Freedman, D. A. (2010). Statistical models and causal inference: A dialogue with the social sciences. Cambridge: Cambridge University Press.
Fxsolver.com (2022). Tetens equation (for temperatures above 0 °C). Available at: https://www.fxsolver.com/browse/formulas/Tetens+equation+%28for+temperatures+above+0+%C2%B0C%29 (Accessed on July 10, 2022).
Griffiths, J. (2020). Will warmer weather help fight the coronavirus? Singapore and Australia suggest maybe not, CNN. Available at: https://edition.cnn.com/2020/03/12/asia/coronavirus-flu-weather-temperature-intl-hnk/index.html.
Jefferson, T., and Heneghan, C. (2020). Effect of temperature, humidity, and wind speed on COVID-19. The centre for evidence-based medicine evidence service to support the COVID-19 response. Available at: https://www.cebm.net/study/covid-19-effect-of-temperature-humidity-and-wind-speed-on-covid-19/(Accessed on July 3, 2022).
Lamarre, A., and Talbot, P. J. (1989). Effect of pH and temperature on the infectivity of human coronavirus 229E. Can. J. Microbiol. 35 (10), 972–974. doi:10.1139/m89-160
Lewis, D. (2021). Covid-19 rarely infects through surfaces. So why are we still deep cleaning? Nature 590, 26–28. doi:10.1038/d41586-021-00251-4
Ma, Y., Zhao, Y., Liu, J., HeWang, X. B., Fu, S., Yan, J., et al. (2020) Effects of temperature variation and humidity on the mortality of COVID-19 in Wuhan. medRxiv. doi:10.1101/2020.03.15.20036426
MoH, Ministry of Health (2020). Health alert. Available at: https://healthalert.gov.bh/en/(Accessed on July 11, 2022).
NASA (2020). Global climate change. Available at: https://climate.nasa.gov/vital-signs/global-temperature/.
Nye, J. (2022). COVID-19 transmission is unlikely from contaminated surfaces. Available at: https://www.infectiousdiseaseadvisor.com/home/topics/covid19/risk-for-covid-19-transmission-from-contaminated-surfaces/ (Accessed on September 7, 2022).
omnicalculator.com (2022). Absolute humidity calculator. Available at: https://www.omnicalculator.com/physics/absolute-humidity (Accessed in September, 2020).
Readfearn, G. (2020). Antarctica logs hottest temperature on record with a reading of 18.3°C. The Guardian, issue Fri 7 Feb 2020Available at: https://www.theguardian.com/world/2020/feb/07/antarctica-logs-hottest-temperature-on-record-with-a-reading-of-183c.
Rendana, M. (2020). Impact of the wind conditions on COVID-19 pandemic: A new insight for direction of the spread of the virus. Urban Clim. 34, 100680. doi:10.1016/j.uclim.2020.100680
The Guardian.com (2020). Antarctica logs hottest temperature on record with a reading of 18.3C. Available at: https://www.theguardian.com/world/2020/feb/07/antarctica-logs-hottest-temperature-on-record-with-a-reading-of-183c (Accessed in September, 2020).
W&C, Weather and Climate (2020). Climate in wuhan (hubei), China. Available at: https://weather-and-climate.com/average-monthly-Rainfall-Temperature-Sunshine,Wuhan,China (Accessed in September, 2020).
Wikipedia (2022). Geography of Bahrain. Available at: https://en.wikipedia.org/wiki/Geography_of_Bahrain (Accessed in July 7, 2022).
WMO (2022). 2021 one of the seven warmest years on record, WMO consolidated data shows. Available at: https://public.wmo.int/en/media/press-release/2021-one-of-seven-warmest-years-record-wmo-consolidated-data-shows (Accessed in July 1, 2022).
Woodley, M. (2020). Warm weather may have helped suppress coronavirus, NewsGp, 20 Feb 2020. Available at: https://www1.racgp.org.au/newsgp/clinical/warm-weather-may-have-helped-suppress-coronavirus (Accessed in September, 2020).
World climate guide (WCG) (2020). Climates to travel. Available at: https://www.climatestotravel.com/climate/china/wuhan (Accessed in September, 2020).
Worldatlas.com (2022). What is an arid climate? Available at: https://www.worldatlas.com/articles/what-is-an-arid-climate.html (Accessed in July 7, 2022).
Keywords: SARS-CoV-2, meteorological parameters, sustainable design, Bahrain, correlations
Citation: Alnaser WE, Alnaser NW, Almarabheh AJ, Al-Ansari AM, Al-Aali HH and Ghanem AZ (2022) The relation between SARS-CoV-2 cases in Bahrain and meteorological parameters: 27 months of data. Front. Built Environ. 8:997380. doi: 10.3389/fbuil.2022.997380
Received: 18 July 2022; Accepted: 28 September 2022;
Published: 31 October 2022.
Edited by:
Maria Rashidi, Western Sydney University, AustraliaReviewed by:
Arnab Sarkar, Indian Institute of Technology (BHU), IndiaCopyright © 2022 Alnaser, Alnaser, Almarabheh, Al-Ansari, Al-Aali and Ghanem. This is an open-access article distributed under the terms of the Creative Commons Attribution License (CC BY). The use, distribution or reproduction in other forums is permitted, provided the original author(s) and the copyright owner(s) are credited and that the original publication in this journal is cited, in accordance with accepted academic practice. No use, distribution or reproduction is permitted which does not comply with these terms.
*Correspondence: Waheeb E. Alnaser, d2FsbmFzZXJAYWd1LmVkdS5iaA==
Disclaimer: All claims expressed in this article are solely those of the authors and do not necessarily represent those of their affiliated organizations, or those of the publisher, the editors and the reviewers. Any product that may be evaluated in this article or claim that may be made by its manufacturer is not guaranteed or endorsed by the publisher.
Research integrity at Frontiers
Learn more about the work of our research integrity team to safeguard the quality of each article we publish.