 Shyamala Varthini Dinakaran1*
 Kiran Raju Alluri2
 K Jossia Joseph1
 M V Ramana Murthy2
 Ramasamy Venkatesan2
- 1National Institute of Ocean Technology, Chennai, India
- 2National Centre for Coastal Research, Chennai, India
Small islands experience variation in wave energy regime along shorter shoreline due to refraction, diffraction and variability in direction of wave travel. Nearshore wave climate around these islands is quite complex due to wave transformation associated with configuration of islands, and high steepness in the bathymetry. Understanding wave energy will help in identifying suitable locations for coastal structures, wave energy devices and sediment budgeting. Assessment of extreme wave climate around the islands play a crucial role in the design and survival of coastal infrastructure for any developmental activities in islands. This study investigates the extreme wave climate around the Agatti island of Union Territory of Lakshadweep located in west coast of India. The spatial variability of wave power distribution around the Agatti island is analyzed based on 10 years of wave hindcast data from spectral wave modelling for the period between 2011 and 2020 using spectral wave model. In this study, third-generation spectral wave model was used to simulate the wave climate over the Arabian Sea. Regional model was established using ECMWF model winds and the offshore wave parameters were validated with deep water ocean observations AD07 and AD09 deployed in the Arabian Sea. To understand the nearshore wave transformation along the Agatti island, local wave model of fine resolution was established using high resolution bathymetry and is validated using the coastal buoy (CB02) deployed near Agatti. Nearshore wave parameters such as Significant wave height, Peak wave period (Tp) and Mean wave direction (θm) were analyzed. The wave power distribution around the island was quantified and demarcated for siting of offshore structures for developmental activities. The study reveals that the south zone of the island is more energetic with annual mean wave power of 8–12 kW/m and during monsoon, wave power more than 28 kW/m is observed. The extreme value theory based on Generalized Extreme Value distribution is applied to the extreme wave height estimate based on modelled wave data around the Agatti island. The extreme wave heights for different return periods were estimated around the Agatti island for design and analysis of coastal infrastructure.
Introduction
Development activities are rapidly increasing along the coastal areas and there is increasing demand for marine infrastructures to sustain commercial and tourist activities. Coastal infrastructure forms the backbone of every society, providing essential services that include coastal defense, trade, tourism, fisheries and aquaculture, energy, water, waste management, transport, telecommunications and other industries (Steven et al., 2020). Coastal structures are capital-intensive, and complicated structures placed in a complex environment and their design and development require proper understanding of hydrodynamics. Wave energy assessment play an important role to develop strategies for selection of site for ocean structures, wave energy devices and sediment budgeting. Similarly for the design and survival of coastal infrastructures, extreme wave heights form the most decisive parameter. Extreme significant wave height (SWH) is increasing globally as well as regionally, especially in coastal regions (Woo and Park, 2021). Increases in extreme wave height caused by tropical cyclones and hazardous events, combined with predicted sea-level rises (Ruggiero et al., 2010), have the potential to increase the magnitude of disasters along with coastal erosion.
The accurate and reliable long-term wave climate data is one of the challenging and crucial steps for wave resource assessment and for estimation of extreme wave heights. A long-term wave climate data can be obtained from various sources such as in-situ buoy, wave observation from ships, numerical modeling and satellite altimeters (Patel et al., 2020). In the recent years, numerical wave models such as WAVEWATCH-III (WWIII), Simulating WAves Nearshore (SWAN), WAve Modelling (WAM) and MIKE 21 Spectral Wave (MIKE 21 SW) (Venugopal and Nemalidinne. 2015; Jadidoleslam et al., 2016) have become feasible tools for evaluating wave potential, primarily due to their ability to produce long-term wave hindcasts with high spatial and temporal resolution. The 34-year ERA-I dataset produced by the ECMWF (European Centre for Medium-Range Weather Forecasts) was analyzed to examine the temporal and spatial variability of the wave power along the shelf seas of India (Sanil Kumar and Anoop, 2015). The spatial distribution of total mean wave energy flux and seasonal mean wave energy flux along Indian coast was studied and is found that the west coast of India is more energetic which may be due to the open exposure to swell coming from southern Indian ocean (Patel et al., 2020). Similarly, the variation in wave power off the central west coast of India was examined for different years from 2009 to 2015 at water depths of 30, 9, and 5 m based on the measurement from wave rider buoy (Amrutha and Sanil Kumar, 2016). Wave energy assessment along the Exclusive Economic Zone (EEZ) of India for 39 years using ERA-Interim dataset indicates that the western coast of India adjoining the states of Maharashtra, Goa, Karnataka and Kerala shows an annual average of 10–15 kW/m Wave Power (Haripriya et al., 2021). A lot of work has been performed to assess the wave power potential worldwide. This generally involves running numerical spectral wave model hindcasts, which are validated against measured data. (Ariyarthne and Jayarathne, 2020) presented the spatial and temporal assessment of nearshore wave energy along the Sri Lanka coast to identify the wave potential sites. Similar wave energy assessment studies have been carried out for Faroe Islands in North Atlantic Ocean (Joensen et al., 2021), Black Sea (Akpınar and Kömürcü, 2013), Marmara Sea (Abdollahzadehmoradi et al., 2019), Mediterranean Sea (Besio et al., 2016) and Madeira Islands (Rusu and Guedes Soares, 2012).
Wave energy resource assessment primarily focuses on the demarcation of sites for coastal structures, wave energy devices and sediment budgeting. The design and survival of such coastal infrastructures requires estimation of design wave heights for which the extreme value analysis of significant wave height is always performed. Understanding of extreme climatic conditions is crucial when dealing with design of coastal and offshore structures, coastal management plans, shipping and navigational activities etc. (Shamji et al., 2020), Extreme value analysis on significant wave height requires historical buoy records of sufficient length and good quality. However, such observation datasets are often inexistent and numerical hindcasts of waves are used instead. The advantage of using model outputs is that an extreme value analysis over a large spatial area is possible, enabling one to highlight spatial variations on extremes (Bulteau et al., 2013). The central idea of extreme wave height analysis is to determine the long-term variability of significant wave height through implementations of distribution functions and quantile functions as well as extrapolation of historical data (Muir and El-Shaarawi. 1986; Goda, 1992; Muraleedharan et al., 2012). The extreme significant wave heights and wind speeds from 33 years of hindcast data for six locations along the Indian coast was estimated and the return value estimates were compared with the values obtained from the well-known Generalised extreme value distribution and Generalised Pareto distribution methods (Polnikov et al., 2017). The return levels of significant wave height (Hs) were analysed at central western shelf of India for different periods estimated using Generalized Extreme Value (GEV) and Generalized Pareto Distribution (GPD) based on the wave rider buoy data spanning for 8 years and the ERA-Interim reanalysis data for 38 years (Muhammed Naseef and Sanil Kumar, 2017). The result showed that the 100-year return levels by using GEV method give comparable results of extreme wave heights for short-term buoy data of 8 years when compared with long-term data of 1979–2016 ERA-Interim shallow data. The minimum period of data required to make estimates was studied by analysing the data in subsets. The means and standard deviations for the subsets indicated that the minimum duration of data to be considered in extreme wave analysis may be as little as 10 years to obtain a reliable estimate (Agarwal et al., 2013).
Remote islands of Lakshadweep group of islands situated in the west coast of India are subjected to high waves and undergo complex nearshore wave transformation due to high steepness in bathymetry and variability in direction of wave travel. Nearshore wave climate of islands is very complex with waves generated by local winds and also from multiple swell fields. Kumaran et al. (2015) assessed the wave climate in Lakshadweep group of islands in order to understand the wave climate for the construction of any offshore structures and to locate an ideal place for the offshore structures. Past study revealed that the Lakshadweep Sea shows an annual average Wave Power of 10–15 kW/m with the western parts showing higher values ranging between 15 and 20 kW/m (Haripriya et al., 2021). However, the studies on the high-resolution mapping of the wave energy potential around the Lakshadweep islands is very scarce. The analysis of renewable energy potential sources for Kavaratti island of Lakshadweep revealed that estimated wave energy potential in the Kavaratti offshore and coastal areas ranges from 1.5–8 kW/m for different seasons using MIKE 21 (Jinoj et al., 2019). The present study focuses on preliminary assessment of the wave power potential and extreme wave climate around the Agatti island of Lakshadweep. The study analyses long-term assessment of the nearshore wave climate propagated around the Agatti island of Lakshadweep, based on a 10-year wave hindcast. The wave hindcast dataset was developed using the third-generation spectral wave model DHI (Danish Hydraulic Institute, 2015) MIKE 21 Spectral wave model, calibrated and validated against wave measurements available on the west coast. The study investigates the wave power distribution around the islands for proper siting of development activities. In small islands like Agatti island, wave heights are generally higher due to constructive interference of wave trains from different directions. Lakshadweep is influenced by southwest monsoon and during monsoon, high waves with intense storms results in extreme waves with high energy intensity approaching the coast. Extreme waves have the potential to cause severe coastal erosion, flooding and as well as causing significant damage to coastal infrastructure. Coastal erosion is a serious problem faced by the islands every year resulting in the construction of coastal protection structures like seawalls along the shoreline. Also, there has been rapid development in Lakshadweep islands like construction of jetties, port and harbor development, widening of entrance channel, etc., to promote tourism and to enhance livelihood. For the design and survival of coastal infrastructure for coastal protection or for any developmental activities in Lakshadweep such as harbors, energy infrastructure, desalination plants, tourism, navigation, etc, proper understanding of the wave climate and estimation of the extreme wave heights is necessary and essential for building resilient coastal infrastructure.
Materials and methods
Description of the study area
Lakshadweep, known as the coral paradise of Arabian Sea, constitutes a group of islands lying scattered, at a distance of 220–460 km away off Kerala in the west coast of India between 8° and 12° 3′ North Latitude and 71° and 74° East Longitude. Lakshadweep is an archipelago consisting of twelve atolls, three reefs and five submerged banks with geographical area of 32 sq. Km. The islands are grouped into three main clusters named as Laccadive, Amindivi and Minicoy and the islands comprising each group which include both inhabited and uninhabited. Lakshadweep consists of 36 islands, of which 10 islands are inhabited namely Agatti, Amini, Androth, Bitra, Chetlat, Kadmat, Kalpeni, Kavaratti, Kiltan and Minicoy.
Agatti island is a 7.6 km long coral island located about 459 km from Kochi and is the virtual gateway to the islands. It has an area of 3.84 sq. Km and has a north-east, south-west trend with a long tail on the south. All the islands have a northeast-southwest orientation and are characterized by lagoon on the western side and open sea on eastern side. The lagoon area of Agatti island is 17.50 sq. Km and the water depth in lagoon ranges from 0.5 m to 2.5 m. Agatti island is the only island in Lakshadweep archipelago and has a high potential in terms of tourism and recreation. Agatti island, with a tiny land area the erosion of even a small portion of the land can be a significant loss. Hence the present study focuses on Agatti island of UT Lakshadweep for analysis of wave power distribution and estimation of extreme wave climate. Figure 1 shows the study area map for Agatti island, Lakshadweep.
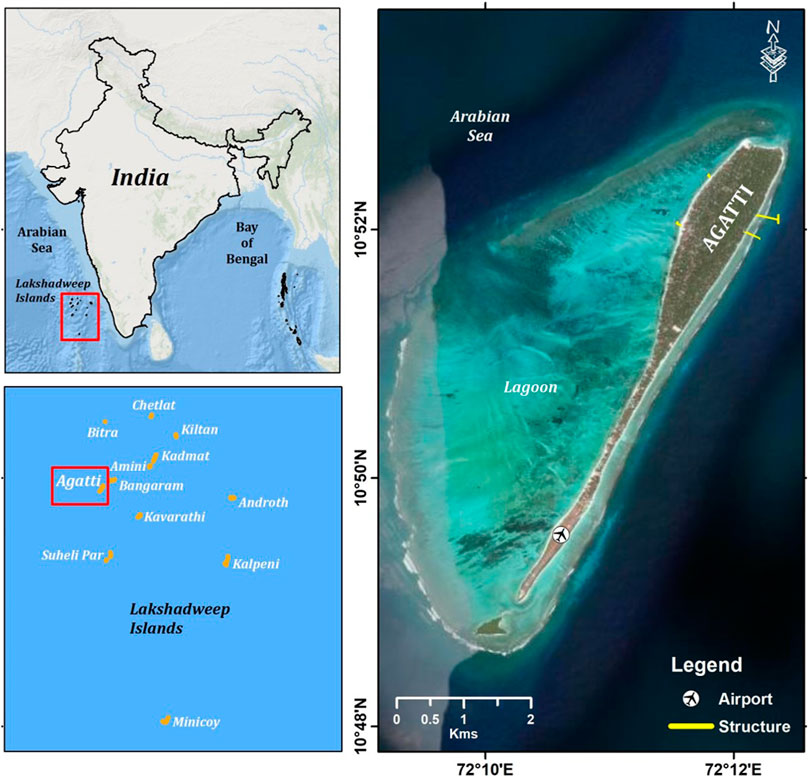
FIGURE 1. Map showing study area.
Spectral wave modelling
In the present study, the third-generation spectral wave model MIKE 21 SW has been used for modeling the waves. This model discretizes the governing equations in geographical and spectral space using a cell-centered finite volume method. In the geographical domain an unstructured mesh technique is used. The time integration is performed using a fractional step approach where a multi-sequence explicit method is applied for the propagation of wave action. The Spectral wave model has been effectively used to simulate growth, decay, and transformation of wind generated waves and swells in offshore and coastal areas. MIKE 21 SW model is based on flexible mesh, which allows for coarse spatial resolution in the offshore area and high resolution in the shallow coastal waters. The governing equation of this model is based on a wave action density spectrum N (σ, θ), where σ is the independent phase parameter (the relative angular frequency) and θ is the direction of wave propagation. The action density, N (σ, θ), is dependent on energy density.
MIKE 21 SW includes two types of formulations: Directional decoupled formulation and fully spectral formulation. The first formulation is based on the parameterization of the wave action conservation equation and is more appropriate for nearshore processes, while the second formulation is also suitable for the offshore area. The evolution of the wave spectrum is described by the spectral action wave balance equation given below,
where N (X, σ, θ, t) is the action density, t is the time, X = (x, y) are the Cartesian coordinates, and ν = (cx, cy, cσ, cθ) is the propagation velocity of a wave group in the four-dimensional phase space X, σ, and θ. S is the source term for the energy balance equation, and ∇ is the four-dimensional differential operator in the X, σ, and θ space. The source function term of the energy balance equation, S is given
where
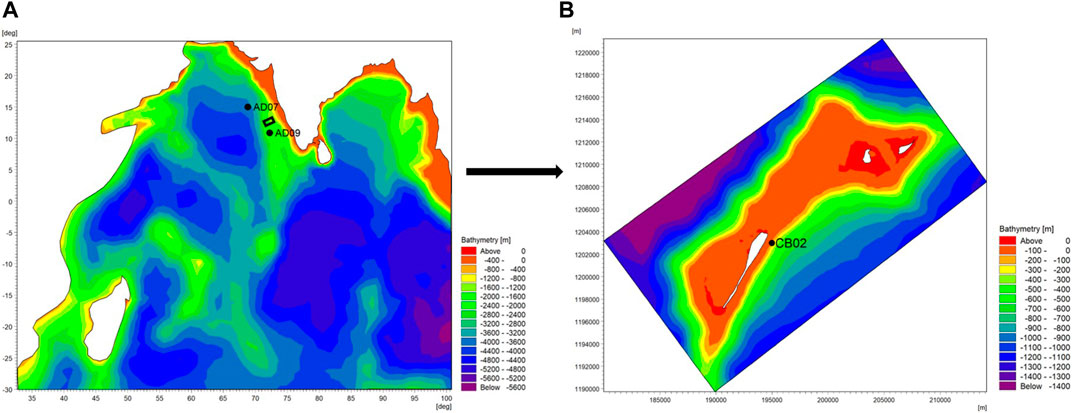
FIGURE 2. Computational model domain (A) Regional wave model for Indian ocean (B) Local wave model for Agatti island.
Calculation of wave power
The energy flux or power (p) transmitted by a regular wave per unit crest width can be estimated as,
The real sea is generally assumed as a combination of a large number of regular waves having different frequencies, wave heights and wave directions. Hence the wave energy flux, or wave power, in a real sea state in arbitrary water depth, can be expressed as
where E (σ, θ) is the energy density, c (σ, θ) is the group velocity, ρ is the density of water and g is the gravitational acceleration.
Estimation of extreme wave heights
Extreme waves mainly occur during major storms at sea by means of constructive interference of wave trains or by nonlinear wave interaction, but extreme waves may also be associated with tsunami or meteo tsunami events. Design of marine structures in remote islands like Agatti requires estimation of design wave height for different return periods. Long term hindcast wave data available for estimation of extreme waves were of minimum resolution 0.25 ° × 0.25 °. Unfortunately, this coarse grid hindcast wave data cannot be used for small islands having total length which is of the order 0.07°. Hence the high-resolution numerical modelling established for Agatti island for the period of 10 years were used in the extreme wave height analysis. In this study, General Pareto, General Extreme Value (GEV), Weibull (3-parameter) and Rayleigh model are considered for estimation of extreme wave height. Extreme value analysis was carried out using the monthly maximum of modelled significant wave heights. Maximum likelihood method is used for determination of parameters of the distributions. Kolmorgov Smirnov test and Anderson-darling test is used for checking the adequacy of fitting the method/distribution to the recorded data. The goodness of fit for the models is performed on General Pareto, GEV, Weibull (3 P) and Rayleigh using Probability-Probability Plots as shown in Figure 3. The General Extreme Value appears to be the distribution that best fits the Significant wave height data, as it has the highest correlation coefficient (r = 0.9969) compared to the other distribution models. Therefore, Generalised Extreme Value distribution method is preferred over the other distribution method for this present study.
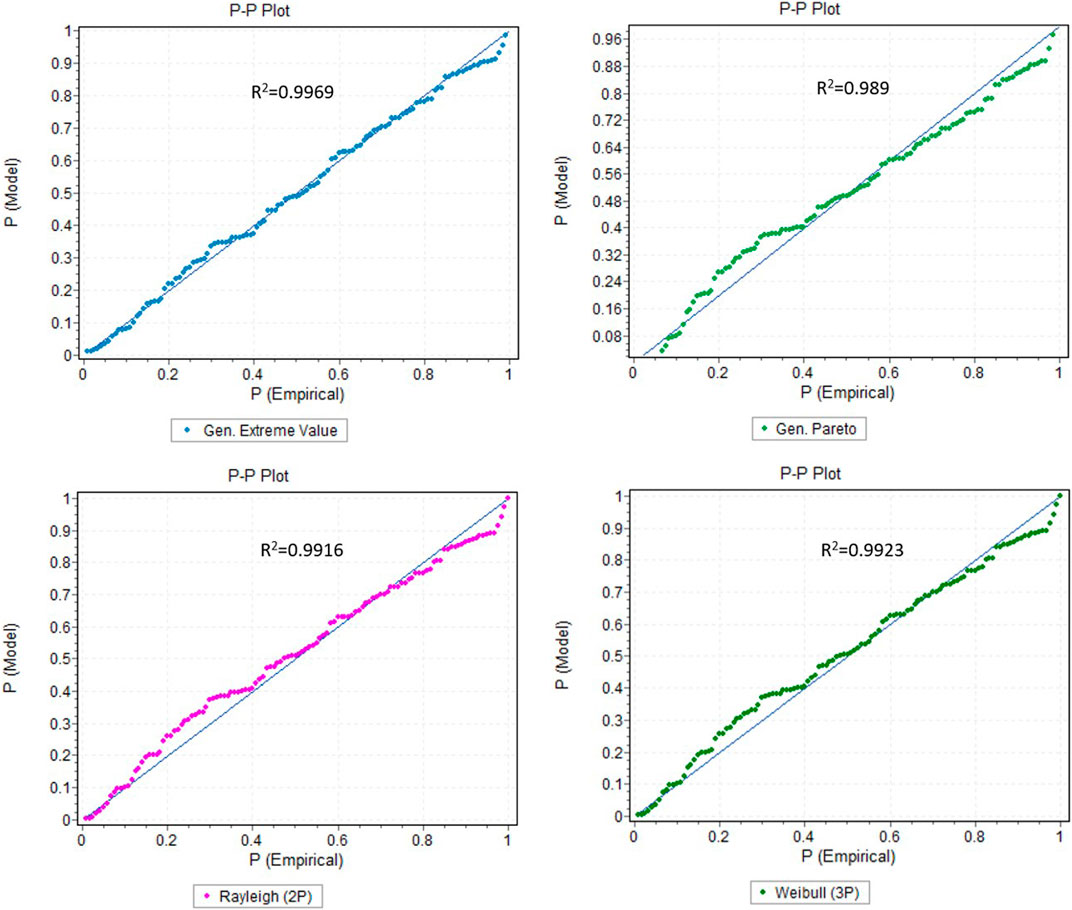
FIGURE 3. Probability-Probability Plot for various distributions.
The generalized extreme value (GEV) distribution has the cumulative distribution function (CDF) as:
where µ, σ and ζ represent the location, scale and shape parameters of the distribution, respectively, and within the range of −∞ < µ < 0 and −∞< ζ < ∞. The 1/T year wave height return value, HT, based on the GEV distribution model is given as
Results and discussions
Validation of the spectral wave model
The accuracy of regional model results is evaluated by validating the model with NIOT moored buoy AD07 (15°,68.8°) and AD09 (8.3°, 73.18°) deployed in the Arabian Sea as shown in Figure 2A. The comparison between the values of significant wave height, mean wave period and mean wave direction simulated by MIKE21 SW and wave parameters recorded by the buoy AD07 and AD09 is presented in Figures 4, 5 (left panel) respectively. To quantify the model performance, the scatter plots between simulations and measurements at AD07 and AD09 locations are also presented in Figures 4, 5 (right panel) respectively. The measured data were compared with the model results by using correlation coefficient (r), root mean square error (RMSE), MAE (mean absolute error), BIAS (mean difference between simulated and measured data), SI (scatter index) and is given in Table 1.
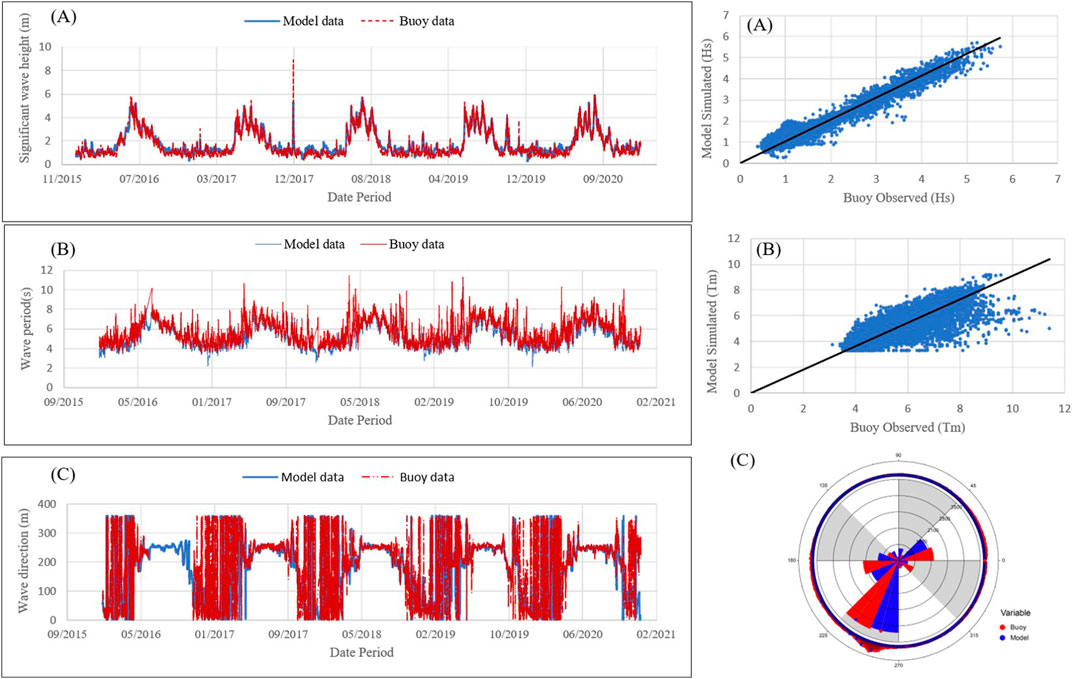
FIGURE 4. (left panel) Comparison of significant wave height between the modelled data and measured data at AD07 (A) Significant wave height (B) Mean wave period (C) Mean Wave direction; (right panel) Correlation between model simulated data and observed buoy AD07 data (A) Significant wave height (B) Mean Wave period (C) Mean Wave direction.
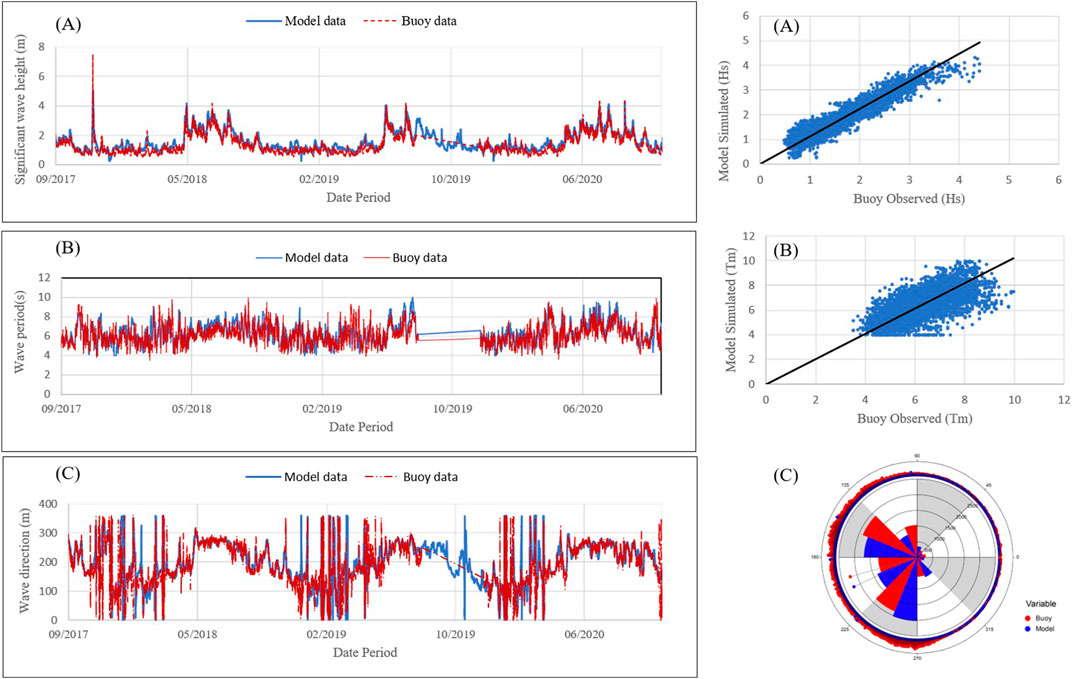
FIGURE 5. (left panel) Comparison of significant wave height between the modelled data and measured data at AD09 (A) Significant wave height (B) Mean wave period (C) Mean Wave direction; (right panel) Correlation between model simulated data and observed Buoy AD09 data (A) Significant wave height (B) Mean Wave period (C) Mean Wave direction.
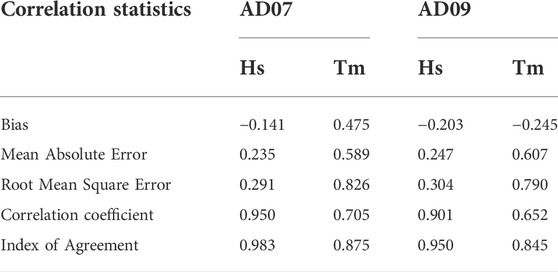
TABLE 1. Correlation statistics between simulated data and Observed buoy data.
The modelled significant wave height statistics reveals good agreement with the observed buoy statistics in both AD07 and AD09 location with correlation coefficient of 0.95 and 0.90 respectively. However, the time history comparison between the hindcast data and observed buoy data for significant wave height shows that the peaks in wave height induced by intense storms, are not simulated in the hindcast. The correlation coefficient of mean wave period between modelled data and AD07, AD09 buoy location is 0.70 and 0.65 respectively. The angular correlation coefficient of mean wave direction between modelled and buoy data generated is 0.6 and 0.88 for AD07 and AD09 respectively which indicates that the model is capable of simulating temporal variations of mean wave direction with reasonable accuracy.
To understand the nearshore wave transformation along the Agatti island, local wave model of fine resolution was established and the wave climate extracted from the regional wave model was given as forcing to the local wave model. Figure 4A and Figure 5A shows that the underestimation occurred in the regional model when waves higher than 6 m were recorded by the buoy. To understand the performance of local wave model in extreme situations, the nearshore wave parameters from the local wave model is validated using the coastal buoy (CB02) deployed near Agatti at 10.8° latitude and 72.2° longitude as indicated in Figure 2B. The comparison of moored buoy AD07, coastal buoy CB02 and the local model result extracted in CB02 location were compared as shown in Figure 6A. It is found that though regional model underestimates the extreme events in deep water, local model simulated the extreme conditions with correlation coefficient of 0.71 which demonstrates that the model provide a reliable wave height around the Agatti island.
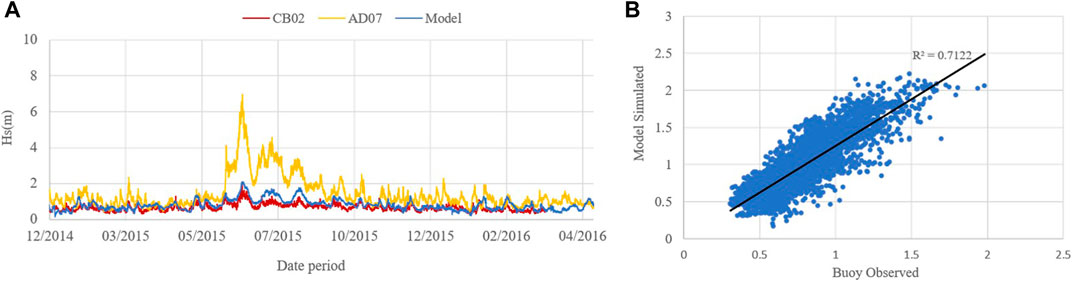
FIGURE 6. Comparison of significant wave height between the modelled data and measured data at CB02 location (A) Time series of significant wave height (B) Scatter plot between model simulated and observed buoy CB02 data.
Wave climatology in Arabian sea
Offshore wave climate along the west coast of India was analysed for seasonal and annual variation in wave characteristics. The seasons were considered as June–September (JJAS) representing Monsoon, October–January (ONDJ) as post monsoon and the season from February–May (FMAM) as pre monsoon. Figure 7 displays the spatial distribution of annual mean significant wave height and the seasonal means.

FIGURE 7. Spatial distribution of Significant wave height (Hs) based on wave data for the year 2019 (A) Annual mean (B) Monsoon mean (C) Pre monsoon mean (D) Post monsoon mean.
The range of the annual mean significant wave height in the deep waters of the Arabian sea is within 1.3–2.3 m (Figure 7A). The seasonal climatology of the Hs in the pre monsoon period ranges from 0.5 to 1.3 m and during post monsoon the wave heights in Arabian sea is in the range of 0.7–1.7 m (Figure 7C and 7D). During monsoon, the waves are energetic with average wave heights of 1.7–2.5 m in the Arabian sea. The analysis of time series of Hs at AD07 location indicates that the annual significant wave height (Hs) ranges from 0.38 m to 5.5 m with average value of 1.75 m. The waves are high during monsoon up to 5.5 m with mean value of 3 m. During post monsoon, wave heights are in the range of 0.5–2 m with average value of 1.25 m and pre monsoon is observed with wave heights less than 2 m. During the study period, extreme wave heights of 8.5 m is observed during very severe cyclonic storm Ockhi, 2017 and cyclonic storm Nanauk, 2014. The Peak wave period (Tp) ranges from 4°s to 16°s with average value of 10.6°s. Peak swells more than 14°s occurs during monsoon and post monsoon and minimum during the pre monsoon months. Wave during pre monsoon particularly between February and March is from North direction and the wave direction gradually changes from North to South-South West (SSW) direction during April and May. During monsoon from June to September, swells occur predominantly from South West (SW) direction. October to January is observed with waves from North East (NE) direction. To understand the seasonal variation of waves within a year, modelled data at AD07 location is represented in Figure 8. Figure 8 shows the time series of significant wave height (Hs), peak wave period (Tp) and mean wave direction (θ) for the year 2019.
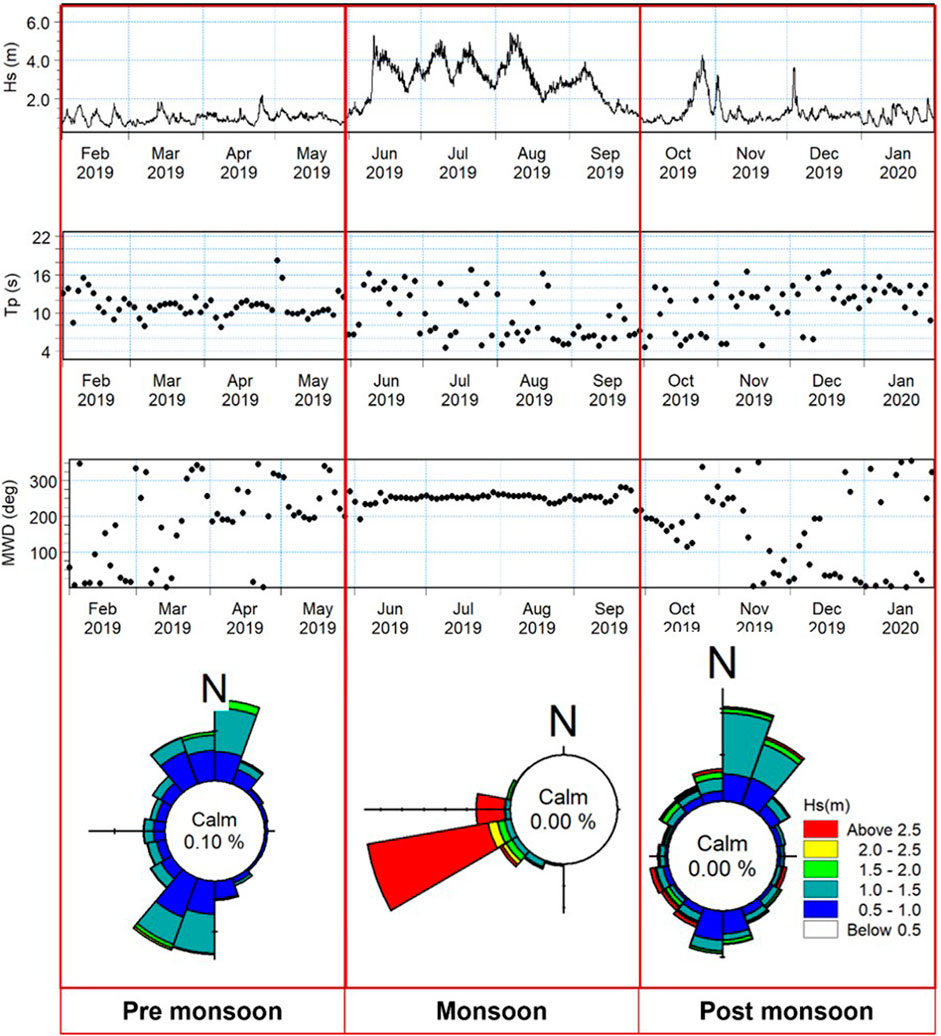
FIGURE 8. Distribution of significant wave height (Hs), peak wave period (Tp) and mean wave direction (θ) of waves for the period from February 2019 to January 2020.
Wave power distribution along agatti island
As the wave propagates from deep waters to Lakshadweep waters, a complex coastal process of shoaling, refraction, diffraction, reflection, and energy dissipation due to bed friction and wave breaking contribute to variations in the wave height, period and direction. The wave climate of the Lakshadweep Sea is dominated by the southwest monsoon. In order to understand the distribution of wave energy around the islands, 18 locations were selected around the Agatti island as presented in Figure 9. The directional spectrum for the different zones at sites P1, P4, P9 and P18 is shown in Figure 8. It is seen that the lowest energy was obtained at P4 location selected in the east coast of Agatti. It is clearly evident that the north of the island is subjected to waves dominant from NNW direction and also waves from NE and East direction.
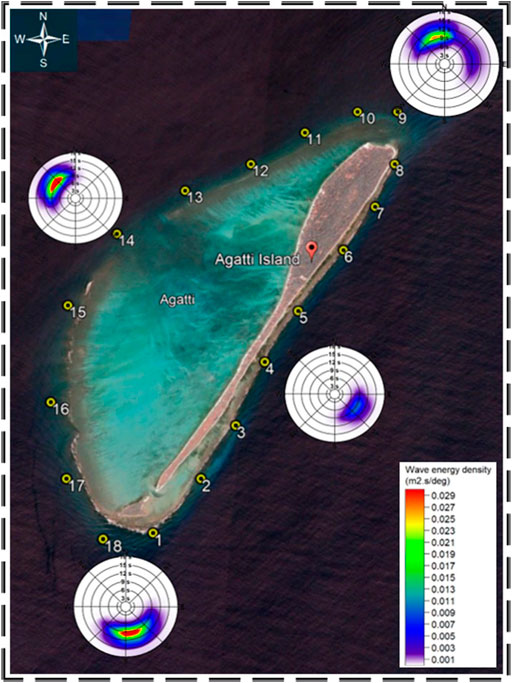
FIGURE 9. Simulated wave directional-frequency spectrum around Agatti island.
The directional distribution of nearshore significant wave height at 5 m water depth extracted around the Agatti island is shown in Figure 10. Nearshore waves in open sea in the western side of the Agatti island experience high intensity waves due to island geomorphology and wave induced setup. The highest wave heights are observed during the monsoon from June to September with the dominant values of significant wave heights around 2.2 m in the west and about 1 m in the east. However, coral reefs bordering the lagoon protect the island from direct attack of waves by attenuating the high waves. The significant wave height greatly reduces from 1.2 m to 0.2 m inside the lagoon indicating that the coral reefs reduced the wave heights by 83% thus protecting the island from direct attack of high waves as shown in Figure 10. The mean significant wave height (Hs) generally varies in the range of 0.5 m to 1 m during pre monsoon and post monsoon whereas during monsoon, mean Hs varies in large range between 0.7 and 1.4 m. Table 2 represents the mean annual wave height and maximum wave height at sites selected around the island. Table 3 and 4 represents the monthly averaged significant wave height for the east and west coast of Agatti island respectively. Monthly averaged wave period is observed to be maximum around 10 s during July and minimum during January with mean value of 7 s. Averaged values of wave period during pre monsoon, post monsoon, and monsoon are 8.2, 7.6, and 9.2 s respectively. As the waves propagates from offshore towards coast, the waves align perpendicular to the coast.
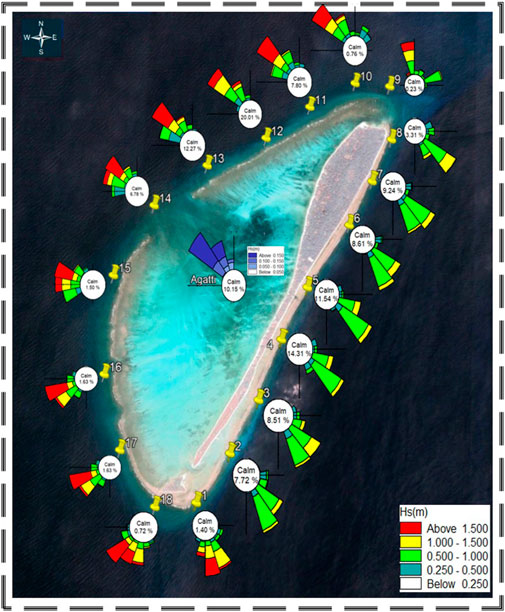
FIGURE 10. Distribution of significant wave height around the island.
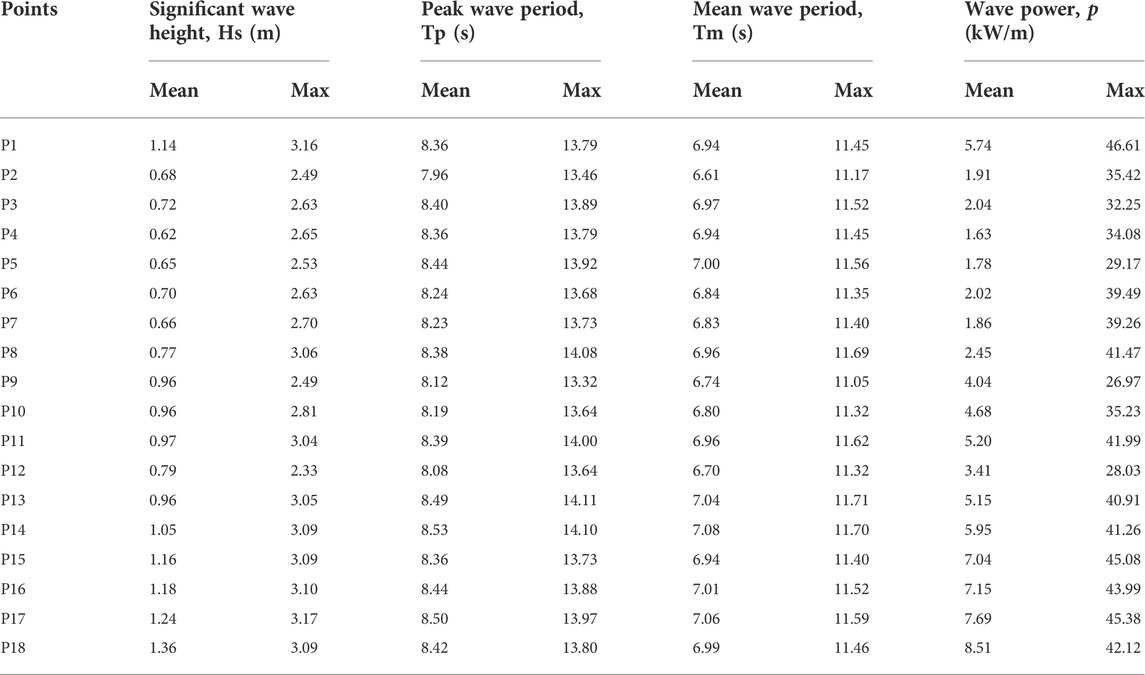
TABLE 2. Annual averaged and maximum values of wave height, wave period and wave power at selected locations around the Agatti island.
TABLE 3. Monthly averaged values of Significant wave height in east coast of Agatti island.
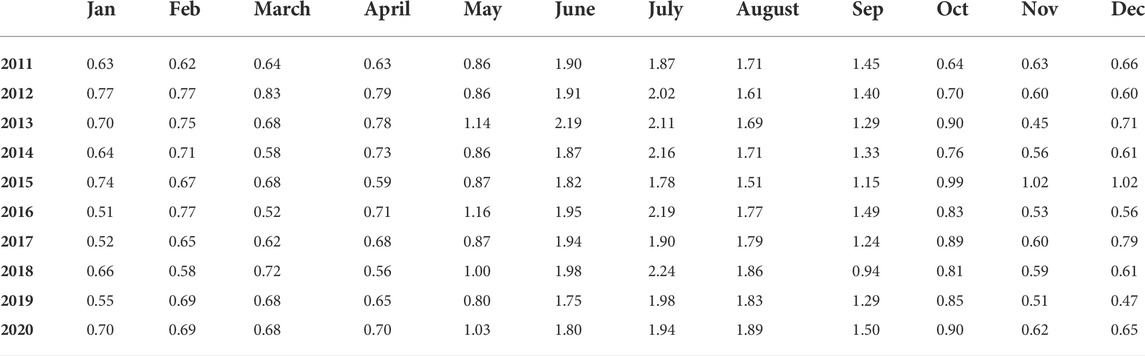
TABLE 4. Monthly average values of Significant wave height in west coast open sea.
Annual mean spatial distribution maps of significant wave height and wave power were obtained from 10 years data generated from numerical model and were presented in the form of a contour map in Figure 11. It is seen that the west coast of the Agatti island is characterized by the waves more than the eastern part, and was also identified to possess higher wave energy and power compared to the eastern part of the Agatti island. It was observed that waves having annual mean significant wave heights between 0.5 and 1 m with 2–6 kW/m mean wave power capacity prevails in eastern part of the Agatti island. The waves with higher wave power capacity which is 8–12 kW/m and larger significant wave height of 1–1.5 m occurs in the western part of the Agatti island.
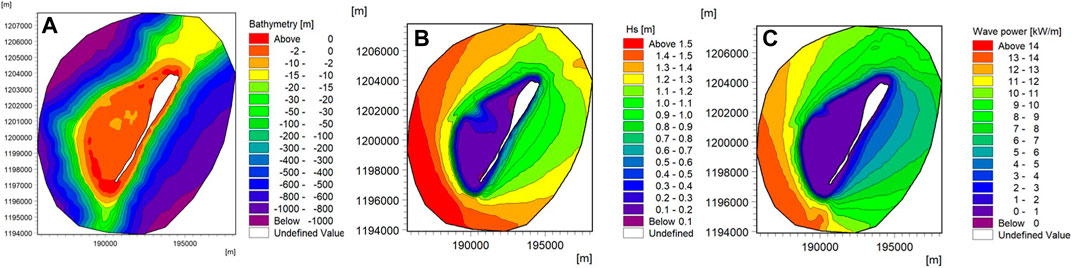
FIGURE 11. (A) Bathymetry around Agatti island (B) Spatial distribution of Mean annual significant wave height (C) Spatial distribution of Mean annual wave power for all years based on 10-year MIKE 21 SW results.
Mean Significant wave height and wave power were also analyzed to examine the seasonal dependencies. Average seasonal spatial distributions of significant wave height and wave power flux based on 10 years wave hindcast data from MIKE 21 were presented in Figure 12. It is seen that the waves are much higher (0.7–2.2 m) and more energetic (4–28 kW/m) in the monsoon when compared to the pre monsoon and post monsoon (0.5–1.1 m and 1–5.5 kW/m). During monsoon, mean wave power reaches 28 kW/m at approximately 15 m water depth in the region extending from south towards westward of the island. This high energetic zone lies within the distance of 0.5 km from the reefs bordering the lagoon. The North zone experiences less wave power capacity of 18–20 kW/m compared to south zone at approximately15 m water depth. The mean wave power of 4–5 kW/m is observed in the east coast at water depth of 15 m during monsoon. During pre and post monsoon, the wave power is of the order 3–4 kW/m for the entire island with south zone having comparatively more wave power of 5–6 kW/m.
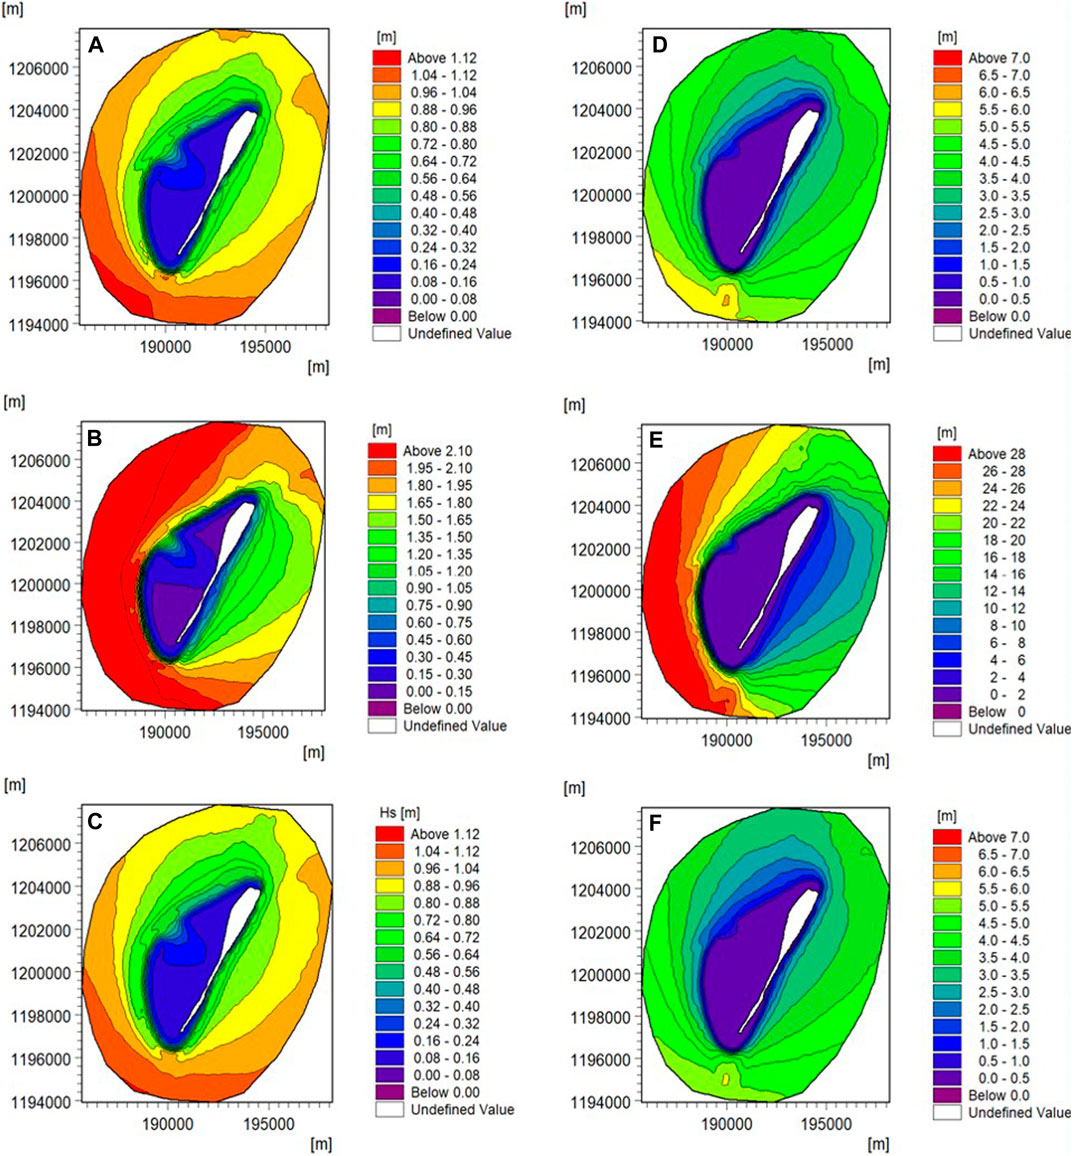
FIGURE 12. (left panel) Spatial distribution of mean significant wave height around the island (A) Pre monsoon (B) Monsoon (C) Post monsoon; (right Panel) Spatial distribution of annual averaged wave power flux for (D) Pre monsoon (E) Monsoon (F) Post monsoon.
To understand the nearshore wave power distribution around the island, the seasonal mean wave energy flux interpolated at 5 m water depth is shown in Figure 13. Table 5 shows the seasonal distribution of mean wave energy flux for Agatti island. The North and South zone of Agatti island is observed to be hotspot for mean wave power having value of 4.6 kW/m and 7.8 kW/m due to constructive interference of waves approaching island from different directions. During monsoon the average value of wave power reaches its maximum up to 8.8 kW/m and 15 kW/m for North and South zone respectively. During pre monsoon and post monsoon, the average value of wave power is 2.7 kW/m and 4.7 kW/m for North and South zone respectively. The wave power in the east coast of Agatti island ranges from 2.5 to 3 kW/m and the west coast inside lagoon is experienced with wave power in the range of 0.05–0.15 kW/m due to very less intensity of waves in the lagoon. Figure 13 shows the spatial distribution of wave power at 5 m water depth around Agatti island for various seasons.
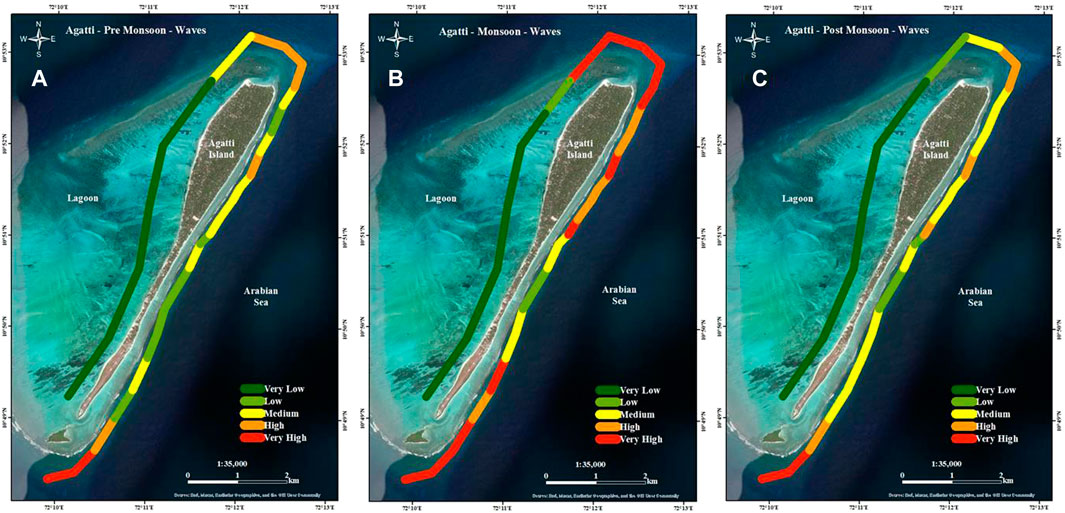
FIGURE 13. Nearshore wave power distribution around Agatti island (A) Pre monsoon (B) Monsoon (C) Post monsoon.

TABLE 5. Seasonal distribution of Mean wave energy flux for Agatti island.
Extreme wave heights
In the present study, the extreme significant wave heights for different return periods were estimated around the Agatti island. In order to carry out the analysis, modelled significant wave heights for the period of 10 years i.e., from 2011 to 2020 were extracted at selected locations every 1 km along the Agatti island at 5 m and 10 m water depth. The extreme wave heights corresponding to different return periods were estimated using Generalized Extreme Value (GEV) distribution. The GEV analysis has been carried out over monthly maximum values. The estimation of parameter is performed by Maximum Likelihood method.
Extreme value analysis is carried out for various return periods 5 years, 10 years, 25 years, 50 years and 100 years at 5 m and 10 m water depth and the results are presented in Table 6 and Table 7 respectively. Spatial variations along the coast for several return values of Significant wave height (25 years, 50 years, 100 years) for water depth of 5 m and 10 m were presented in Figure 14. The results indicate that the extreme wave heights in the east coast ranges from 1.70 to 2.30 m. The extreme wave heights in north zone and south zone were estimated in the range of 2.3–4.0 m and 3.1–4.5 m respectively. The 100 years return wave heights of 4–4.6 m prevails in high energetic zones north, south and west of the Agatti island. The 100 years return period extreme waves in the west coast open sea ranges from 4.5 to 5 m. The highest return values of Hs among all the locations are found at P16 in the south zone with 4.54 m, 4.74 m, 5.09 m for 25 years, 50 years and 100 years return periods, respectively. The highest return value of Hs in the east coast is 2 m for 100 years return period and the extreme waves are 27% higher in 10 m water depth with wave height of 2.6 m. The extreme waves at 10 m water depth were estimated in the range of 6–7 m in the south zone. Figure 15 shows the relationship between extreme wave heights and the return periods at various zones of Agatti island.
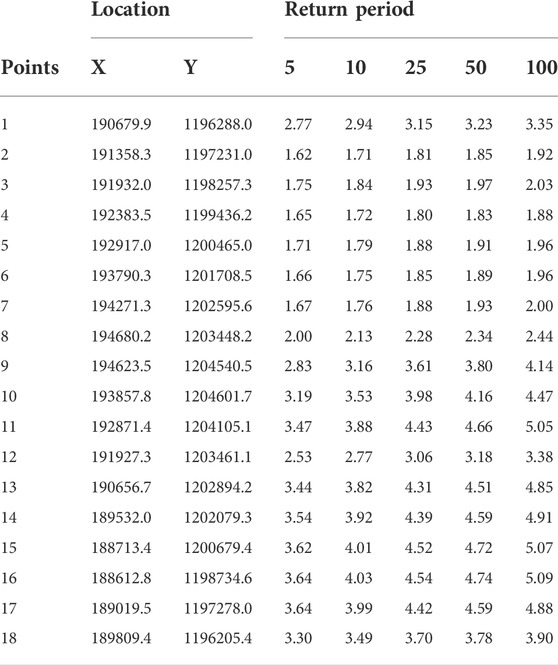
TABLE 6. Extreme wave heights for various return periods using GEV monthly maximum at nearshore water depth of 5 m.
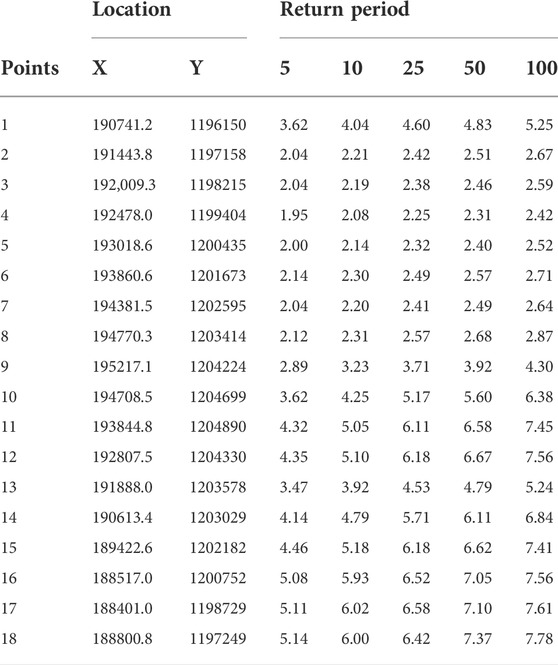
TABLE 7. Extreme wave heights for various return periods using GEV monthly maximum at water depth of 10 m.
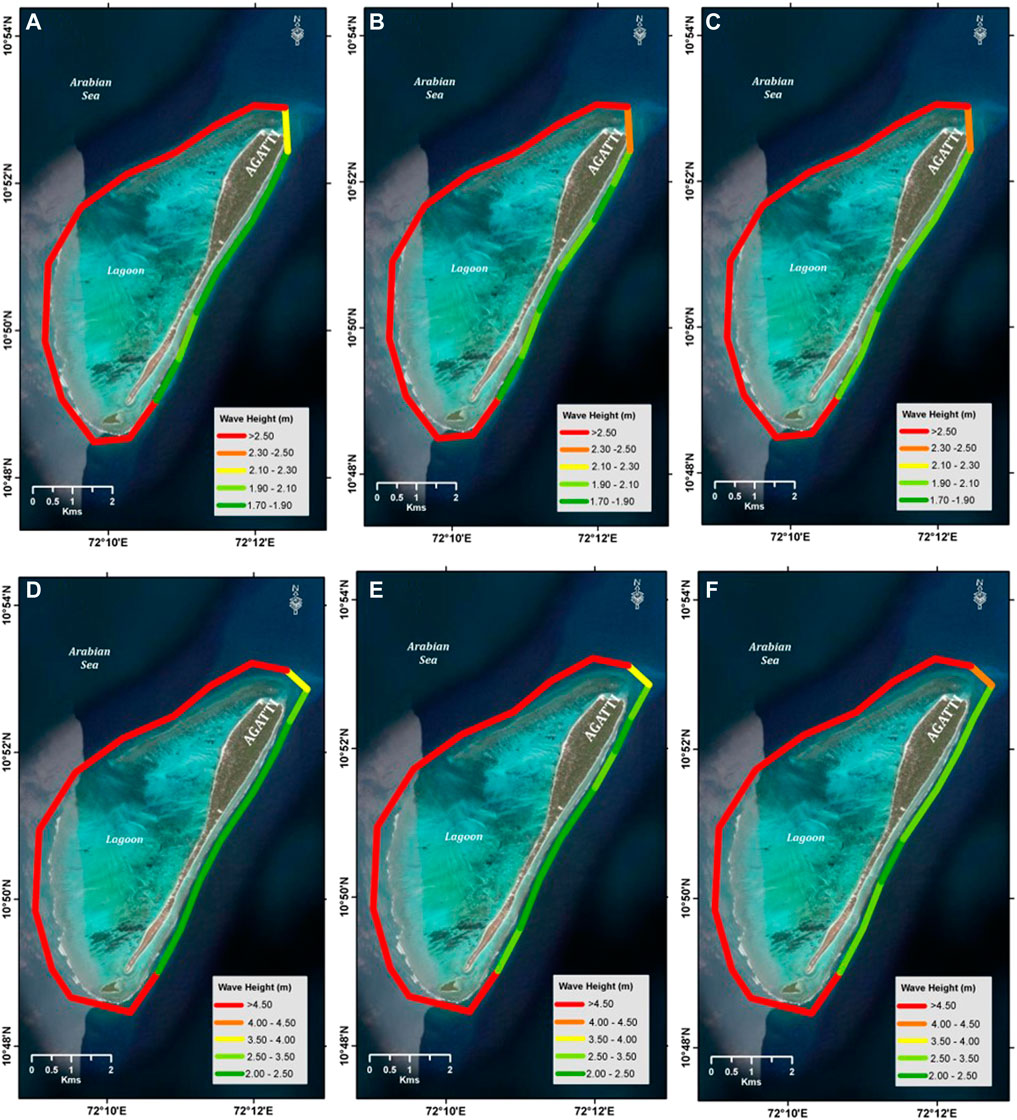
FIGURE 14. Extreme wave height distribution at 5 m water depth (A) 25-year return period (B)50-year return wave period (C) 100-year return period; 10 m water depth (D) 25-year return period (E)50-year return wave period (F) 100-year return period at 10 m water depth.

FIGURE 15. Extreme wave height values based on extreme wave heights vs. return periods at North, South, West and East zone of Agatti island.
Conclusion
In the present study, numerical modelling was carried out for 10 years (2011–2020) in regional scale for Indian Ocean and in local scale for Agatti island of Lakshadweep. A comprehensive validation of regional and local model was performed using measured wave data from moored buoy AD07 in west coast of India and CB02 off Agatti island respectively. The validation study showed that the significant wave height was successfully reproduced indicating that the wave model can be used to provide nearshore wave climate around Agatti island of Lakshadweep.
Offshore wave climate along the west coast of India was analyzed for seasonal and annual variation in wave characteristics. Waves around Agatti island are very complex due to island geomorphology and the variability in direction of wave travel. The distribution of nearshore wave heights around Agatti island show that the north and south zone are subjected to high waves with mean wave energy flux of (5–8 kW/m). Eastern coast experience waves of 0.5m–1 m and exhibits the mean wave energy flux of (2–6 kW/m). Further, monsoon is the most energetic among all three seasons with maximum wave power potential exceeding 28 kW/m in the south zone extending towards west. The high wave power in southern zone at shallow depths makes the zone promising location for the exploitation of wave energy. The north of the Agatti island with shallow 15 m water depth connects the atoll with Bangaram island and shows significant wave power potential particularly during monsoon. The west coast of Agatti island experiences high energetic waves with annual mean significant wave height of 1–1.5 m having annual mean wave power potential of 8–12 kW/m. The lagoon in the west bordered by reefs acts as a natural barrier protecting the west coast of Agatti island by dissipating 83% of high waves from directly attacking the coast. The significant wave height inside the lagoon ranges from 0.05 to 0.2 m with lowest mean energy flux of 0.05–0.15 kW/m. The east coast of Agatti has comparatively lesser energy and is ideal for any infrastructure development with the proper analysis of design wave heights.
This study also provides the insight on distribution of extreme wave heights around Agatti island which need to be considered for the design and analysis of the marine structure. Extreme wave heights were estimated based on the monthly maximum of 10 years hindcast wave data. From the results it can be seen that the significant height of extreme waves is location specific and it varies from one location to another. The extreme wave heights vary quite significantly, from a maximum of about 2 m in the east coast of Agatti island to a maximum of approximately 5 m in the South zone and in the western open sea. It is clearly evident that the reef bordering the lagoon acts as a natural defense protecting the west coast of Agatti island from extreme events. The predicted extreme waves for different return periods in the Agatti island can be used for economic and safe design of the ocean structures proposed for futuristic development. Due to limited data on Lakshadweep islands, the modelling approach for estimation of extreme wave heights shall be extended to other islands for enhancing the coastal resilience.
Data availability statement
The raw data supporting the conclusions of this article will be made available by the authors upon reasonable request.
Author contributions
All authors agreed to be accountable for the content of the manuscript.
Conflict of interest
The authors declare that the research was conducted in the absence of any commercial or financial relationships that could be construed as a potential conflict of interest.
Publisher’s note
All claims expressed in this article are solely those of the authors and do not necessarily represent those of their affiliated organizations, or those of the publisher, the editors and the reviewers. Any product that may be evaluated in this article, or claim that may be made by its manufacturer, is not guaranteed or endorsed by the publisher.
References
Abdollahzadehmoradi, Y., Özger, M., and Altunkaynak, A. (2019). Optimized numerical model based assessment of wave power potential of Marmara Sea. J. Ocean. Univ. China 18, 293–304. doi:10.1007/s11802-019-3826-5
Agarwal, A., Venugopal, V., and Harrison, G. P. (2013). The assessment of extreme wave analysis methods applied to potential marine energy sites using numerical model data. Renew. Sustain. Energy Rev. 27, 244–257. doi:10.1016/j.rser.2013.06.049
Akpınar, A., and Kömürcü, M. I. (2013). Assessment of wave energy resource of the Black Sea based on 15-year numerical hindcast data. Appl. Energy 101, 502–512. doi:10.1016/j.apenergy.2012.06.005
Amrutha, M. M., and Sanil Kumar, V. (2016). Spatial and temporal variations of wave energy in the nearshore waters of the central west coast of India. Ann. Geophys. 34 (12), 1197–1208. doi:10.5194/angeo-34-1197-2016
Ariyarathne, K., and Jayarathne, P. (2020). Preliminary assessment of wave energy in Sri Lanka. Int. Conf. Coast. Eng. 36, 21. doi:10.9753/icce.v36v.papers.21
Besio, G., Mentaschi, L., and Mazzino, A. (2016). Wave energy resource assessment in the Mediterranean Sea on the basis of a 35-year hindcast. Energy 94, 50–63. doi:10.1016/j.energy.2015.10.044
Bulteau, T., Lecacheux, S., Lerma, A. N., and Paris, F. (2013). Spatial extreme value analysis of significant wave heights along the French coast, international short conference on advances in extreme value analysis and application to natural hazards: EVAN2013. Siegen, Germany.
Danish Hydraulic Institute (DHI) (2015). “MIKE 21 SW reference manual, MIKE by DHI,” in Manual mesh generator; MIKE zero (Denmark: Hørsholm), 28–30.
Goda, Y. (1992). Uncertainty of design parameters from viewpoint of extreme statistics. ASME. J. Offshore Mech. Arct. Eng. May 114 (2), 76–82. doi:10.1115/1.2919962
Haripriya, R., Misra, A., Jeyaraj, S., and Ramakrishnan, B. (2021). Wave energy assessment for 39 years along the exclusive economic zone (EEZ) of India. Regional Studies in Marine Science 45, 101809. doi:10.1016/j.rsma.2021.101809
Jinoj, S., MahijaHann, J., and Bonthu, S. (2019). Analysis of renewable energy potential sources for kavaratti Island, Lakshadweep. IOSR Journal of Engineering (IOSRJEN) 2022, 91–97.
Jadidoleslam, N., Özger, M., and Ağiralioğlu, N. (2016). Wave power potential assessment of Aegean Sea with an integrated 15-year data. Renewable Energy 86, 1045–1059. doi:10.1016/j.renene.2015.09.022
Joensen, B., Niclasen, B. A., and Bingham, H. B. (2021). Wave power assessment in Faroese waters using an oceanic to nearshore scale spectral wave model. Energy 235, 121404. doi:10.1016/j.energy.2021.121404
Kumar, V. S., and Anoop, T. R. (2015). Spatial and temporal variations of wave height in shelf seas around India. Nat. Hazards (Dordr). 78 (3), 1693–1706. doi:10.1007/s11069-015-1796-5
Kumaran, V., Nagamani, K., and Mullaivendhan, C. (2015). Wave climate for the design of island structures union - territory (Lakshadweep). Procedia Eng. 116, 398–405. doi:10.1016/j.proeng.2015.08.301
Muhammed Naseef, T., and Sanil Kumar, V. (2017). Variations in return value estimate of Ocean surface waves – A study based on measured buoy data and ERA-interim reanalysis data. Nat. Hazards Earth Syst. Sci. 17, 1763–1778. doi:10.5194/nhess-17-1763-2017
Muir, L. R., and El-Shaarawi, R. A. H. (1986). On the calculation of extreme wave heights: A review. Ocean. Eng. 13 (1), 93–118. doi:10.1016/0029-8018(86)90006-5
Muraleedharan, G., Lucas, C., Soares, C. G., Nair, N. U., and Kurup, P. (2012). Modelling significant wave height distributions with quantile functions for estimation of extreme wave heights. Ocean. Eng. 54, 119–131. doi:10.1016/j.oceaneng.2012.07.007
Patel, R. P., Nagababu, G., Surisetty, V. V., Seemanth, M., and Singh, S. (2020). Wave resource assessment and wave energy exploitation along the Indian coast. Ocean. Eng. 217, 107834. doi:10.1016/j.oceaneng.2020.107834
Polnikov, V. G., Sannasiraj, S. A., Satish, S., Pogarskii, F. A., and Sundar, V. (2017). Estimation of extreme wind speeds and wave heights along the regional waters of India. Ocean. Eng. 146, 170–177. doi:10.1016/j.oceaneng.2017.09.031
Ruggiero, P., Komar, P. D., and Allan, J. C. (2010). Increasing wave heights and extreme value projections: The wave climate of the U.S. Pacific Northwest. Coast. Eng. 57 (5), 539–552. doi:10.1016/j.coastaleng.2009.12.005
Rusu, E., and Guedes Soares, C. (2012). Wave energy pattern around the Madeira Islands. Energy 45 (1), 771–785. doi:10.1016/j.energy.2012.07.013
Sanil Kumar, V., and Anoop, T. R. (2015). Wave energy resource assessment for the Indian shelf seas. Renew. Energy 76, 212–219. doi:10.1016/j.renene.2014.11.034
Shamji, V. R., Aboobacker, V. M., and Vineesh, T. C. (2020). Extreme value analysis of wave climate around Farasan Islands, southern Red Sea. Ocean. Eng. 207, 107395. doi:10.1016/j.oceaneng.2020.107395
Steven, A. D. L., Appeaning Addo, K., Llewellyn, G., and Vu, T. C. (2020). Coastal development: Resilience, restoration and infrastructure requirements. Washington, DC: World Resources Institute.
Venugopal, V., and Nemalidinne, R. (2015). Wave resource assessment for Scottish waters using a large scale North Atlantic spectral wave model. Renew. Energy 76, 503–525. doi:10.1016/j.renene.2014.11.056
Keywords: numerical modelling, Agatti, spectral wave model, extreme wave Heights, wave energy flux, Lakshadweep
Citation: Dinakaran SV, Alluri KR, Joseph KJ, Murthy MVR and Venkatesan R (2022) Modelling and simulation of extreme wave heights around agatti island of lakshadweep, west coast of India. Front. Built Environ. 8:991768. doi: 10.3389/fbuil.2022.991768
Received: 11 July 2022; Accepted: 17 October 2022;
Published: 31 October 2022.
Edited by:
Prashant Kumar, National Institute of Technology Delhi, IndiaReviewed by:
Junichi Ninomiya, Kanazawa University, JapanManuel Gerardo Verduzco-Zapata, University of Colima, Mexico
Copyright © 2022 Dinakaran, Alluri, Joseph, Murthy and Venkatesan. This is an open-access article distributed under the terms of the Creative Commons Attribution License (CC BY). The use, distribution or reproduction in other forums is permitted, provided the original author(s) and the copyright owner(s) are credited and that the original publication in this journal is cited, in accordance with accepted academic practice. No use, distribution or reproduction is permitted which does not comply with these terms.
*Correspondence: Shyamala Varthini Dinakaran, c2h5YW1hbGFkaW5ha2FyYW5AZ21haWwuY29t