 Artur Petrov
 Dmitrii Zakharov
 Sergey Evtukov2
95% of researchers rate our articles as excellent or good
Learn more about the work of our research integrity team to safeguard the quality of each article we publish.
Find out more
OPINION article
Front. Built Environ. , 19 August 2022
Sec. Transportation and Transit Systems
Volume 8 - 2022 | https://doi.org/10.3389/fbuil.2022.981078
This article is part of the Research Topic Sustainable Transport Systems View all 6 articles
Nowadays, almost all processes of socio-technical management in Russia have vertically integrated specifics (Kozhevnikov, 2016). The federal government establishes general policy and specific practices of society management. Regional and municipal authorities follow the guidelines of the Federal Centre. In the road safety sphere, the policy is set by the Main Directorate for Traffic Safety of Russia.
The organization of road traffic in Russian cities and worldwide is constantly becoming more complicated (Lanke and Koul, 2013; Sładkowski and Pamula., 2015; Shubenkova et al., 2018; Mohamed and AlShalfan, 2021). This is associated with the constant increase in the automobilization rate (the current (2021) automobilization rate in Russia is 413 vehicles/1,000 people) (Website of the State Road Safety Inspectorate of the Russian Federation, 2021) and, as a consequence, the growth of traffic intensity. Today, it is hard to find road areas with traffic lights, working in the two-phase mode, in the biggest Russian cities (Makarova et al., 2017). Four-, five-, and six-phase traffic light modes have become more and more common for Russians (Gorodokin et al., 2017; Makarova et al., 2020; Glushkov and Shepelev, 2021; Shepelev et al., 2022).
In February 2014, changes to the main regulatory document on the road traffic organization came into force in Russia (Russian National Standard 52,289-2019) (GOST 52289-2019, 2019). Its paragraph 7.1.2 was amended with the sentence “it is not allowed to intersect traffic and pedestrian flows in one phase of the traffic light cycle.” From this point on, the reconfiguration of all traffic lights to multiphase mode had started in Russian cities. In some Russian cities, for the increase of road safety, the pedestrian phase was included in the traffic light cycle. The separation of different transport flows in time decreases the number of conflicts and the probability of road accidents (Buyvol et al., 2021). In Russian cities such as Moscow, St. Petersburg, Novosibirsk, Yekaterinburg, Nizhny Novgorod, and Kazan there are practically no two- or three-phase traffic lights left. In these cities, in most cases, the traffic light cycle consists of four… five… six phases, including the pedestrian one.
In small- and medium-sized (population is up to 100 thousand people) Russian cities, the processes of traffic light cycle complication and addition of the pedestrian phase are just beginning. Some intermediate cases of the organization of traffic light cycle regulation are often found in large (population—100–500 thousand people) Russian cities. It is usually a trade-off between complicated and strict options, common for million-population cities, and simple two-phase cycles, common for small and medium Russian cities.
Therefore, purposefulness, speed, and productivity of the process of the unification of approaches of the road traffic organization significantly vary in different Russian cities (Pugachev et al., 2020; Yakupova et al., 2020).
The quality of life of the population in regions is also differentiated all over Russia (Andrushchak et al., 2011; Berkalov et al., 2016). The quality of life includes not only welfare but also an attitude to life and health (Korolenko, 2018). It has an impact on regional differentiation in the choice of an acceptable level of risk (Wilde, 1998). In the aggregate, all of them form a specific level of homeostasis of the road accident rate risk common for a particular city (Wilde, 2014).
How to evaluate the quality of road safety provision in different Russian cities? Moscow and St. Petersburg vary greatly from lots of small and medium cities with a 50–100 thousand people population. How to compare their transport systems from the perspective of system quality? It can be carried out by the evaluation of urban road safety provision systems’ orderliness.
In this case, orderliness is the structural quality of a system, providing minimization of processes’ randomness and increase of the certainty level of relations between system elements (von Bertalanffy, 1968). Orderliness is evaluated by the structural entropy method, i.e., by division of the process of road accident rate formation into the blocks of the cause-and-effect chain, determination of the significance level of each of the blocks, and quantitative assessment of relative entropy Hn RSS of the researched process. In summary, it is necessary to point out that the concept of system orderliness can be an indicator of a city’s metabolism (Ulgiati and Zucaro, 2019).
The method of a quantitative assessment of relative entropy Hn RSS of the road accident rate formation process was developed in 2017 by the authors from Tyumen Industrial University and is presented in (Kolesov and Petrov, 2017). The most complete current state (2022) of research on that issue is presented in (Petrov, 2022).
To specify the methodology of the assessment of the orderliness of the road accident rate formation process, we present it in the view of the formulated stages.
The methodology consists in the sequential implementation of the following operations:
1) The determination of the values of transitional coefficients Ki (exactly KRA; KV; KD) between the blocks of the cause-and-effect chain of the road accident rate formation process [Population (P)—the number of road accidents (NRA)—the number of victims (NV)—the number of deaths (ND)].
2) The determination of the positive value of the individual blocks of the road accident rate formation Qi. Partial positives Qi of individual blocks of the studied process are connected with the transitional coefficient Ki of the cause-and-effect chain by relation (1).
3) The determination of the common positive Q by Formula 2.
where KHR–the end-to-end path transmission factor KHR = ND/P;
4) The determination of the contribution
5) The physical meaning of
6) The determination of the values [
7) The determination of the values [
8) The calculation of the values of the informational entropy HRSS of Shannon (1948) by the classic Formula 4.
where n—the number of transfer links in the formation of a road accident rate (in our case n = 3);
9) The calculation of the values of the C. Shannon relative entropy Hn RSS by Formula 5.
For the identification of quantitative values of indicators, by characterizing blocks of the cause-and-effect chain [Population (P)—the number of road accidents (NRA)—the number of victims (NV)—the number of deaths (ND)], the information from the sources (Road Safety profiles subjects of the Russian Federation, 2021) has been collected. Analysis was performed for the five datasets. The research results are presented in Section 3.
The results of the analysis ranges of relative entropy Hn RSS of the road accident rate formation process are presented as follows:
- All cities (211 cases) with the population more than 50 thousand people [Hn RSS = (0,351; 0,709)].
- Cities (15 cases) with the population more than 1 million people [Hn RSS = (0,596; 0,682)].
- Cities (23 cases) with the population ranging from 500 to 1,000 thousand people [Hn RSS = (0,581; 0,709)].
- Cities (110 cases) with the population ranging from 100 to 500 thousand people [Hn RSS = (0,351; 0,655)].
- Cities (63 cases) with the population ranging from 50 to 100 thousand people [Hn RSS = (0,416; 0,697)].
Empirical distributions of quantitative values of relative entropy Hn RSS for Russian urban road safety provision systems are presented in Figure 1.
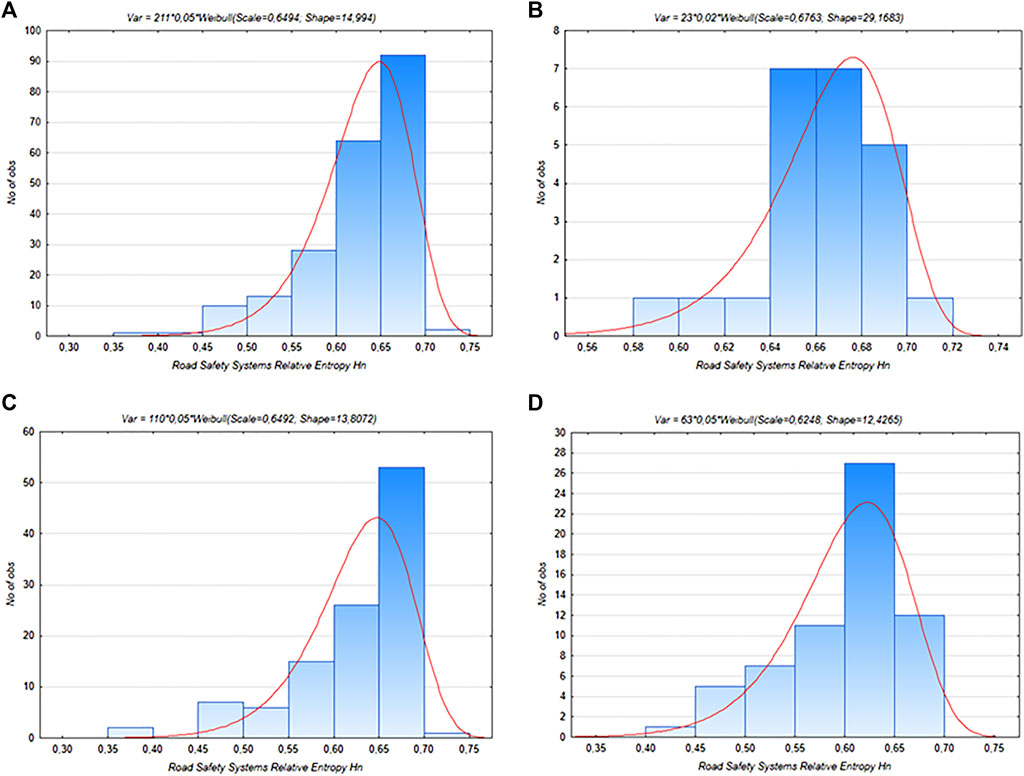
FIGURE 1. Empirical distributions of quantitative values of relative entropy Hn RSS for urban road safety provision systems (Russia, 2021). (A) All Russian cities with the population more than 50 thousand people; (B) Russian cities with the population ranging from 500 to 1000 thousand people; (C). Russian cities with the population ranging from 100 to 500 thousand people; (D) Russian cities with the population ranging from 50 to 100 thousand people.
Based on the research results, we can formulate three conclusions.
First, the range of values (2021) of relative entropy Hn RSS of the road accident rate formation process in Russian cities is quite wide. Hn RSS 2021 = (0,351; 0,709).
Second, the distribution of Hn RSS values is an example of the Weibull distribution, i.e., the expected value M (Hn RSS) is shifted to the right in comparison to the Gaussian distribution. It allows us to say that in several cities, there is a specific and unordinary system for most Russian cities’ road safety provision environment. The reasons for that exclusiveness should be determined by special methods.
Third, the expected value M (Hn RSS) decreases as the city’s population decreases. Thus, for Russian millionaire cities, M (Hn RSS 2021) = 0,6852; for cities with the population 500–1,000 thousand people, M (Hn RSS 2021) = 0,6763; for cities with the population 100–500 thousand people, M (Hn RSS 2021) = 0,6492; and for cities with the population 50–100 thousand people, M(Hn RSS 2021) = 0,6248.
It can be explained by the fact that in the biggest cities of the country, there are strict conditions for transport flow regulation, and multi-phase systems are used for the regulation of transport and pedestrian flows. In millionaire cities, the quality of life is higher, and this means a more qualitative vehicle park. The participants of road traffic in millionaire cities are qualified enough and motivated to follow the traffic code. Road safety provision systems in the biggest Russian cities can be characterized as maximally undetermined from the perspective of evaluation of the probability of death of people (its entropic orderliness is relatively low). Conversely, the road safety provision system of small Russian cities (population up to 100 thousand people) can be characterized as maximally determined from the perspective of the probability of death of people (its entropic orderliness is relatively high).
It is not surprising that the minimal value of Hn RSS 2021 = 0,351 belongs to the road safety provision system of Novoshakhtinsk [this monocity is declared as the worst Russian city among cities with a population from 100 thousand to 250 thousand people, according to the Index of urban environment quality (The Urban Environment Quality Index is a tool for assessing the quality of the material urban environment and the conditions for its formation, 2021)].
Conversely, the maximal value Hn = 0,709 351 belongs to the road safety provision system of Tyumen (the best Russian city among cities with a population from 250 thousand to 1,000 thousand people, according to the Index of urban environment quality (The Urban Environment Quality Index is a tool for assessing the quality of the material urban environment and the conditions for its formation, 2021).
In conclusion, we should note that the lower the entropic orderliness of the road accident rate formation process, the higher is the quality of the road safety provision system. The method of quantitative evaluation of relative entropy Hn RSS of the road accident rate formation process may be quite useful for the Main Directorate for the Traffic Safety of the Ministry of Internal Affairs of Russia. It is a tool for the management of the quality of road safety provision systems in the country’s cities (Bliss and Breen, 2012). Today, these problems are being solved by evaluation and comparative analysis of the values of relative indicators such as human risk (HR) and transport risk (TR) (Wilde, 1994). These indicators, suggested by Smeed (1949) 70 years ago, are not perfect [G. J. S. Wilde, 2013]. For example, human risk (HR) connects the output parameter [The number of deaths (ND)] with the first block of the chain [Population (P)] without evaluation of internal processes. Transport risk (TR) connects the output parameter [The number of deaths (ND)] with the second block of the chain [The number of vehicles (NVh)] (Blinkin and Reshetova, 2013). Relative entropy Hn RSS characterizes the process of road accident rate formation comprehensively, taking into account every transition from block to block in the cause-and-effect chain. This is why the relative entropy of Hn RSS is an indicator that determines the quality of the entire road safety system.
AP: conceptualization, methodology, investigation, visualization, writing—review and editing, and supervision. DZ: investigation, visualization, and writing. SE: investigation. FG: supervision. DP: data curation.
This research was funded by the Russian Ministry of Education and Science [Grant No. 0825-2020-0014, 2020-2022 (new patterns and solutions for the functioning of urban transport systems in the paradigm “Transition from owning a personal car to mobility as a service”)]
The authors declare that the research was conducted in the absence of any commercial or financial relationships that could be construed as a potential conflict of interest.
All claims expressed in this article are solely those of the authors and do not necessarily represent those of their affiliated organizations, or those of the publisher, the editors, and the reviewers. Any product that may be evaluated in this article, or claim that may be made by its manufacturer, is not guaranteed or endorsed by the publisher.
Andrushchak, G., Burdijak, А., Gimpelson, V., et al. (2011). Mode of life and living standards of Russian population in 1989–2009. Мoscow. Moscow: HSE Publ. House, 74. Available at: https://www.hse.ru/data/2011/04/06/1211703897/Mode_of_life-ENGL.pdf?ysclid=l4qvvsjajh980930291 (Accessed June 11, 2022).
Berkalov, S. V., Pluchevskaya, E. V., and Kozlova, N. V. (2016). Quality of life - the factor of Russia success at present and in the future. SHS Web Conf. 28, 01012. doi:10.1051/shsconf/20162801012
Blinkin, M. Ya., and Reshetova, E. M. (2013). Road safety: Background, international experience, basic institutions. Available at: https://id.hse.ru/data/2015/04/21/1096201513/%D0%91%D0%BB%D0%B8%D0%BD%D0%BA%D0%B8%D0%BD-%D1%81%D0%B0%D0%B9%D1%82.pdf (Accessed June 16, 2022).
Bliss, T., and Breen, J. (2012). Meeting the management challenges of the decade of action for road safety. IATSS Res. 35, 48–55. doi:10.1016/j.iatssr.2011.12.001
Buyvol, P., Yakupova, G., Shepelev, V., Mukhametdinov, E., and Boyko, A. (2021). Mobility and road safety improvement by optimizing smart city infrastructure parameters: A case study. Lect. Notes Netw. Syst. 195, 507–517. doi:10.1007/978-3-030-68476-1_47
Glushkov, A., and Shepelev, V. (2021). Development of reliable models of signal-controlled intersections. Transp. Telecommun. 22 (4), 417–424. doi:10.2478/ttj-2021-0032
Gorodokin, V., Almetova, Z., and Shepelev, V. (2017). Procedure for calculating on-time duration of the main cycle of a set of coordinated traffic lights. Transp. Res. Procedia 20, 231–235. doi:10.1016/j.trpro.2017.01.060
GOST R 52289-2019 (2019). Traffic control devices. Rules of application of traffic signs, markings, traffic lights, guardrails and delineators. Available at: https://docs.cntd.ru/document/1200170422?ysclid=l4k6d14kq4772808959 (Accessed June 10, 2022).
Kolesov, V., and Petrov, A. (2017). Cybernetic modeling in tasks of traffic safety management. Transp. Res. Procedia 20, 305–310. doi:10.1016/j.trpro.2017.01.028
Korolenko, А. V. (2018). Patterns of population’s self-preservation behavior: research approaches and building experience. Econ. Soc. Changes Facts, Trends, Forecast 11 (3), 248–263. doi:10.15838/esc.2018.3.57.16
Kozhevnikov, S. A. (2016). Management of vertically integrated systems formation and development in the Russian economy. Econ. Soc. Changes Facts, Trends, Forecast 6 (48), 53–69. doi:10.15838/esc/2016.6.48.3
Lanke, N., and Koul, S. (2013). Smart traffic management system. Int. J. Comput. Appl. 75 (7), 19–22. doi:10.5120/13123-0473
Makarova, I., Pashkevich, A., Shubenkova, K., and Mukhametdinov, E. (2017). Ways to increase population mobility through the transition to sustainable transport. Procedia Eng. 187, 756–762. doi:10.1016/j.proeng.2017.04.434
Makarova, I., Yakupova, G., Buyvol, P., Mukhametdinov, E., and Pashkevich, A. (2020). Association rules to identify factors affecting risk and severity of road accidents.” in Proceedings of the 6th International Conference on Vehicle Technology and Intelligent Transport Systems, Prague. VEHITS 2020, 614–621.
Mohamed, S. A. E., and AlShalfan, K. A. (2021). Intelligent traffic management system based on the internet of vehicles (IoV). J. Adv. Transp., 1–23. doi:10.1155/2021/4037533
Petrov, A. I. (2022). Entropy method of road safety management: Case study of the Russian federation. Entropy (Basel). 24, 177. doi:10.3390/e24020177
Pugachev, I., Kulikov, Y., and Cheglov, V. (2020). Features of traffic organization and traffic safety in cities. Transp. Res. Procedia 50, 766–772. doi:10.1016/j.trpro.2020.10.089
Road Safety profiles subjects of the Russian Federation (2021). Available at: https://media.mvd.ru/files/embed/4478063 (Accessed June 06, 2022).
Shannon, C. E. (1948). A mathematical theory of communication. Bell Syst. Tech. J. 27 (3), 379623–423656. Available at: https://people.math.harvard.edu/∼ctm/home/text/others/shannon/entropy/entropy.pdf.(Accessed June 13, 2022). doi:10.1002/j.1538-7305.1948.tb00917.x
Shepelev, V., Zhankaziev, S., Aliukov, S., Varkentin, V., Marusin, A., Marusin, A., et al. (2022). Forecasting the passage time of the queue of highly automated vehicles based on neural networks in the services of cooperative intelligent transport systems. Mathematics 10 (2), 282. doi:10.3390/math10020282
Shubenkova, K., Boyko, A., and Buyvol, P. (2018). The technique of choosing a safe route as an element of smart mobility. Transp. Res. Procedia 36, 718–724. doi:10.1016/j.trpro.2018.12.100
Sładkowski, A., and Pamuła, W. (2015). Intelligent transportation systems - problems and perspectives. Springer Cham: Studies in systems, decision and control, 316. doi:10.1007/978-3-319-19150-8
Smeed, R. J. (1949). Some statistical aspects of road safety research. J. R. Stat. Soc. Ser. A 112, 1–34. doi:10.2307/2984177
The Urban Environment Quality Index is a tool for assessing the quality of the material urban environment and the conditions for its formation (2021). Available at: https://индекс-городов.рф/#/(Accessed June 16, 2022).
Ulgiati, S., and Zucaro, A. (2019). Challenges in urban metabolism: Sustainability and well-being in cities. Front. Sustain. Cities 1, 1–3. doi:10.3389/frsc.2019.00001
Von Bertalanffy, L. (1968). General system theory: Foundations, development, applications. New York, NY: George Braziller. Available at: https://monoskop.org/images/7/77/Von_Bertalanffy_Ludwig_General_System_Theory_1968.pdf (Accessed June 12, 2022).
Website of the State Road Safety Inspectorate of the Russian Federation (Russian SRSI) (2021). Road safety indicators: Information on the number of cars (2021). Available at: http://stat.gibdd.ru/(Accessed June 02, 2022).
Wilde, G. J. S. (2013). “Homeostasis drives behavioural adaptation,” in book: Behavioural adaptation and road safety. Chapter 5: Homeostasis drives behavioural adaptation. Editors C. M. Rudin-Brown, and S. L. Jamson (Boca Raton, FL, USA: CRC Press). doi:10.1201/b149331-8
Wilde, G. J. S. (1998). Risk homeostasis theory: An overview. Inj. Prev. 4 (2), 89–91. doi:10.10/1136/ip4289
Wilde, G. J. S. (2014). Target risk 3. Risk homeostasis in everyday life. Available at: https://is.muni.cz/el/fss/podzim2016/PSY540/um/64998189/64998284/targetrisk3_1.pdf.(Accessed June 12, 2022).
Wilde, G. J. S. (1994). Target risk: Dealing with the danger of death, disease and damage in everyday decisions. Toronto, Canada: PDE Publications.
Keywords: road safety, Russian cities, system orderliness, entropy, relative entropy, sociotechnical management
Citation: Petrov A, Zakharov D, Evtukov S, Grakov F and Petrova D (2022) Evaluation of the orderliness of the road safety provision systems in Russian cities. Front. Built Environ. 8:981078. doi: 10.3389/fbuil.2022.981078
Received: 29 June 2022; Accepted: 20 July 2022;
Published: 19 August 2022.
Edited by:
Irina Makarova, Kazan Federal University, RussiaReviewed by:
Maxim Kulev, Orel State University, RussiaCopyright © 2022 Petrov, Zakharov, Evtukov, Grakov and Petrova. This is an open-access article distributed under the terms of the Creative Commons Attribution License (CC BY). The use, distribution or reproduction in other forums is permitted, provided the original author(s) and the copyright owner(s) are credited and that the original publication in this journal is cited, in accordance with accepted academic practice. No use, distribution or reproduction is permitted which does not comply with these terms.
*Correspondence: Artur Petrov, QXJ0SWdQZXRyb3ZAeWFuZGV4LnJ1
Disclaimer: All claims expressed in this article are solely those of the authors and do not necessarily represent those of their affiliated organizations, or those of the publisher, the editors and the reviewers. Any product that may be evaluated in this article or claim that may be made by its manufacturer is not guaranteed or endorsed by the publisher.
Research integrity at Frontiers
Learn more about the work of our research integrity team to safeguard the quality of each article we publish.