
95% of researchers rate our articles as excellent or good
Learn more about the work of our research integrity team to safeguard the quality of each article we publish.
Find out more
ORIGINAL RESEARCH article
Front. Built Environ. , 26 September 2022
Sec. Indoor Environment
Volume 8 - 2022 | https://doi.org/10.3389/fbuil.2022.957973
This article is part of the Research Topic Ventilation and Health: How much do we need and how do we achieve this? View all 6 articles
 H. Proulx*
 S. Hallé
Trichloramine (NCl3) is a disinfection by-product commonly found in the water and air in indoor swimming pools. The gas is associated with chronic diseases such as asthma and often causes eye and skin irritation. Due to its higher density than air, NCl3 tends to accumulate close to the water surface and above the deck. Mixing ventilation is the main ventilation strategy used in aquatic centers to maintain the NCl3 concentrations at an acceptable level. However, swimming pool halls are known to be significantly energy-intensive, mostly because of water evaporation from the basin. Consequently, building codes recommend maintaining a low airspeed above the pool and deck to minimize evaporation and to ensure swimmers’ thermal comfort. If trichloramine levels are suspected to be too high, pool managers will favor increasing the number of air changes per hour (ACH) while limiting the outdoor air (OA) intake. However, mechanical filtration systems are not designed to remove NCl3 from the airflow. Since its concentration cannot be measured directly, ventilation system parameters are often based on minimum recommendations set out in building codes and may vary in operation according to the CO2 levels in the extracted air, irrespective of the NCl3 level and its accumulation behavior. It remains unknown how the OA intake ratio affects NCl3 levels in breathing zones. This study carries out a numerical investigation of the impacts of the OA and the ACH on NCl3 concentrations in a swimming pool hall in Montreal (Canada). Results show that the minimum recommendations (OA intake and ACH) by ASHRAE are not sufficient to eliminate NCl3 accumulation and stratification in the lower breathing zones. Moreover, air recirculation mostly affects the breathing zones of standing occupants on decks and of lifeguards but has a smaller impact on the breathing zones of swimmers or people sitting on the deck. Eliminating air recirculation does not guarantee better air quality in terms of NCl3 in these breathing zones. The findings for the complex under study may be used to guide similar research in other aquatic centers and for the continuous development of building codes and air quality standards.
Commonly present in the air in swimming pool halls, trichloramine (NCl3) can irritate the eyes and the upper airways (Parrat et al., 2012). The gas is a highly volatile compound formed in water subsequent to a reaction between free chlorine (Cl−) and ammonia (NH3) (Afifi and Blatchley, 2015). Table 1 presents NCl3 negative impacts on health and on building structures reported in the literature. Parrat et al. (2012) found a high prevalence of eye and nose irritation symptoms, following a 40-h exposure to NCl3 with concentrations between 0.20 mg/m3 and 0.39 mg/m3. Exposure to airborne NCl3 also increases the frequency and severity of certain respiratory diseases such as asthma and bronchitis (ANSES, 2012). No regulation in Canada currently exists limiting the concentrations of NCl3 (CNCl3) in swimming pool air. However, certain organizations and researchers recommend limiting thresholds varying from 0.2 mg/m3 to 0.5 mg/m3 (Lévesque et al., 2015; Nitter and Svendsen, 2020).
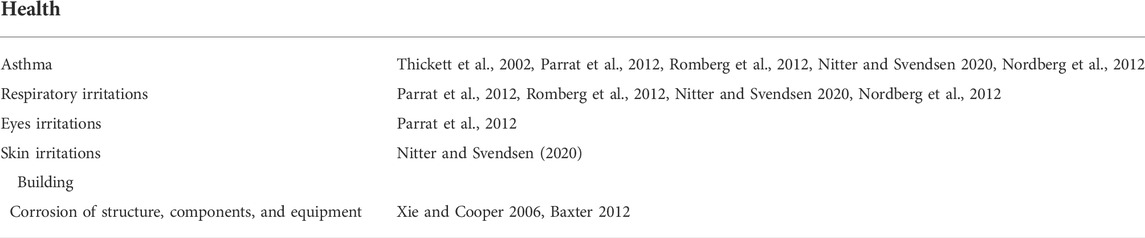
TABLE 1. Effects of NCl3 on the air of the swimming pool hall.
NCl3 must be extracted from the air by mechanical ventilation (Lochner and Wasner, 2017). The gas is difficult to remove since its density is higher than that of air, and it tends to accumulate at the water surface and above the deck (Baxter, 2012). In theory, increasing the flow of outdoor air (OA) coupled with sufficient air velocity near the water surface should be enough to remove the trichloramine bubble. However, to prevent excessive water evaporation, air velocity above the water surface should not exceed 15.0 cm/s (ASHRAE Handbook-HVAC Applications, 2019). Air drafts over the deck can also cause thermal discomfort among bathers (Xie and Cooper, 2006). Moreover, any OA increase has an impact on energy consumption, especially in a cold climate country like Canada. Most indoor swimming pools meet the minimum OA requirements in current codes, but very few exceed these minimum recommendations.
According to some researchers, the rate of OA introduced into the heating, ventilation, and air conditioning (HVAC) system is a determining parameter of CNCl3 (Bessoneau et al., 2011; Lochner and Wasner, 2017). For a swimming pool hall, ASHRAE (Handbook-Fundamentals, 2019) prescribes an OA intake of 2.4 L/s per m2 of the pool and deck surface and between 4.0 and 6.0 air changes per hour (ACH). Where the swimming pool has a dedicated spectator area, the OA intake should be 0.3 L/s per m2 of the specific area added to 3.8 L/s per person and between 6.0 and 8.0 ACH (ASHRAE Handbook-Fundamentals, 2019; ANSI/ASHRAE 62.1, 2019). Cavestri and Seeged-Clevenger (2008) posited that the OA supply recommended by ASHRAE may be sufficient, provided that air is also extracted at the water surface level and exhausted directly outside. However, the position and number of extraction vents and the ratio of extracted air at that level are not specified in their study or in building codes and standards, including ASHRAE. Saleem et al. (2019) measured CNCl3 in a swimming pool hall (Canada) while changing the fraction of OA input to the HVAC system from minimum ASHRAE recommendations to 100% and obtained a 55% reduction in CNCl3 when only OA was supplied. Lochner and Wasner (2017) hold that the OA intake recommended by ASHRAE (Handbook-Fundamentals, 2019) would be insufficient for several types of indoor swimming pool installations and that an increase in OA is the preferred route to maintain the acceptable air quality. There appears to be an agreement among researchers that the OA intake has an impact on CNCl3. According to some, increasing the OA beyond the minimum rate recommended by ASHRAE is necessary to get CNCl3 to an acceptable level. However, the National Building Code of Canada (Canadian Commission on Building and Fire Codes, 2015) prescribes limiting the OA intake to the levels recommended by ASHRAE in order to minimize energy expenditure while maintaining an acceptable air quality. According to Nitter and Svendsen (2020), ventilation parameters for swimming pool halls recommended by standards are targeted at reducing water evaporation and minimizing energy loss rather than insuring air quality in the swimmer’s zone. There is a dearth of literature on increases in OA and ACH and the impact on CNCl3 in swimming pools. Information on an optimal air distribution strategy required for adequate NCl3 dilution is also lacking.
Experimentally evaluating the ventilation efficiency of large spaces like most indoor swimming pools is not an easy task. Computational fluid dynamics (CFD) has been used by some researchers to study airflow in such indoor spaces. Ciuman and Lipska (2018) modelized thermal-moisture and airflow conditions with a Reynolds-averaged Navier–Stokes (RANS) approach in an indoor swimming pool enclosure located in Germany. They obtained good accuracy in reproducing airspeeds and a good agreement between experimental data and numerical results with respect to moisture when using the evaporation rates suggested in the German standard VDI-2089 Part 1 (2010). Rojas and Grove-Smith (2018) used CFD to study the effectiveness of various ventilation strategies in contaminant removal in an indoor swimming pool hall. They obtained the best ventilation effectiveness when it came to removing contaminants with exhaust vents positioned at the deck level. Calise, Figaj and Vanoli (2018) determined the energy expenditure of a swimming pool by TRNSYS software. They proposed a method to calculate the mass transfer and energy loss between the water in the basin and the ambient air of the enclosure. Limane, Fellouah and Galanis (2017) modeled the air velocities and temperature measured in a swimming pool hall (Canada) using an open-source CFD software application. They demonstrated that airflow with heat and mass transfer in this particular environment could be successfully reproduced numerically. They also studied how swimmers affect the airflow and concluded that the air temperature and the humidity level are more homogenous in the occupied zone with such movement at the water surface.
Any accumulation of NCl3 in a swimming pool enclosure must be limited due to its negative impact on health. Respecting ASHRAE’s recommendations for ventilation strategies and parameters to limit CNCl3 in the air does not guarantee an acceptable indoor air quality. In a systematic data-driven literature review on indoor swimming pool halls, Smedegard et al. (2021) recommended that future studies, in regard to air quality and ventilation, aim at providing results that can be implemented in the context of HVAC and the building architecture. Notwithstanding the aforementioned studies, the impact of OA and ACH on CNCl3 has not yet been analyzed with CFD. Building managers can usually adjust the ventilation parameters, such as OA intake and ACH, but are less likely to modify the HVAC system partially or totally in order to mitigate the effects of NCl3. In this context, the objective of this study is to investigate the impact of a variation of the OA rate and ACH on CNCl3 in different breathing zones of an indoor aquatic center.
A swimming pool located in Montreal (Canada) that has experienced air quality problems due to high CNCl3 was chosen for this study and is presented in Figure 1. Despite recent renovations and modifications to the ventilation system, these issues are still reported to managers. The studied swimming pool hall includes one 14 × 25 m indoor basin and a spectator area in the mezzanine for a total volume of 9,200 m3. A dedicated HVAC system provides 3.6 ACH (9.3 m3/s) with 23% OA (2.1 m3/s). There are three air supply duct lines delivering air to the hall, including the mezzanine area. The first branch delivers an airflow rate of 4.9 m3/s to the bottom of the windows of five solariums through 10 linear diffusers (Figure 1B). The second branch (Figure 1C) delivers an airflow rate of 3.1 m3/s near the ceiling along the pool basin through a perforated fabric duct. The third branch (Figure 1D) delivers an airflow rate of 1.3 m3/s near the ceiling over the mezzanine through six circular diffusers. The air is extracted through two adjacent vents near the ceiling, behind the diving boards (Figure 1E).
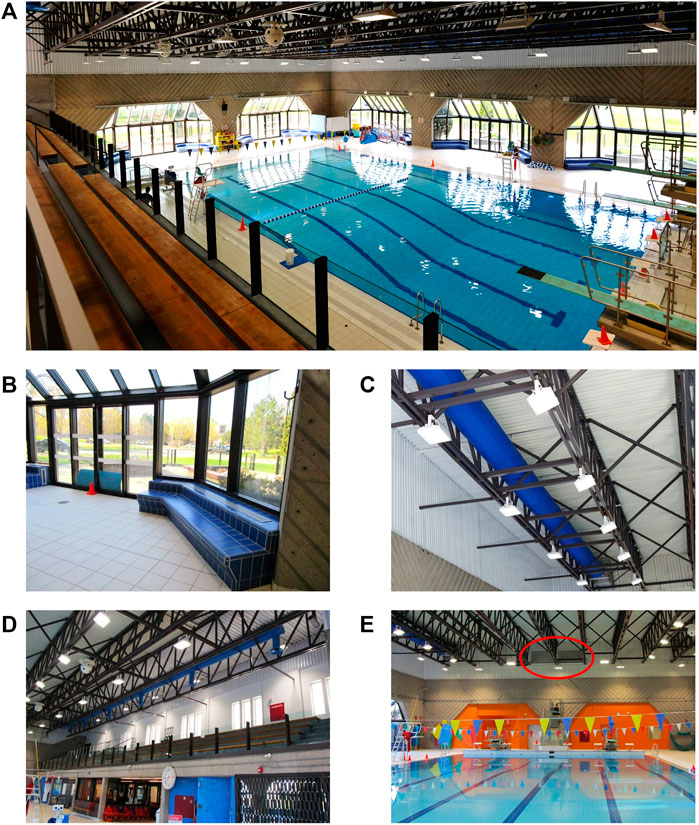
FIGURE 1. (A) Studied swimming pool hall, (B) linear diffusers in solariums, (C) fabric duct, (D) circular diffusers over mezzanine, and (E) extracting vents.
Numerical simulations of airflow, NCl3 advection, and diffusion in the pool enclosure were performed with Fire Dynamics Simulator (FDS) software (McGrattan et al., 2021a). FDS 6.7.6 uses the large eddy simulation (LES) method to numerically solve the equations governing the air movement, the temperature field, and the transport of contaminants in building enclosures. Thus, the unsteady three-dimensional Navier–Stokes equations, the energy conservation equation, and the NCl3 mass transport equation were solved using the second-order accurate finite difference method on a three-dimensional rectangular grid. The FDS employs a simple immersed boundary method for the treatment of solid obstruction in the computational domain (Fadlun et al., 2000).
The numerical model of the pool enclosure was developed with PyroSim (2021), a graphical user interface for FDS. The FDS HVAC solver was used to simulate the recirculation of NCl3 in the pool hall. Conservation equations of mass, energy, and momentum were solved on a network of nodes and duct segments in the HVAC solver. The nodal conservation equations were connected with the exhaust and supply vents in the computational domain. NCl3 emitted on the water’s surface reaching the extraction vent entered the HVAC system and was transported in the ventilation ducts to be partially or totally recirculated into the pool hall through supply vents. NCl3 recirculation was considered numerically by adding a filter in the HVAC solver imitating the introduction of OA. This numerical filter captured NCl3, from 23% as a reference case to 100% which corresponds to a 100% OA ventilation strategy. CNCl3 extracted from the return grille was, therefore, reintroduced in the enclosure minus the filtered CNCl3:
where the subscripts e and s are extraction and supply vents, respectively, and
The numerical HVAC diagram is presented in Figure 2. Extraction and supply fans were placed in the ducts to control the air volume flow. A coil placed in a duct heated the extracted air to a setpoint temperature of 33°C. The power of the heating coil was controlled by using a thermal device located near one of the main supply vents. The computational domain was limited by the pool water surface, its deck, and the enclosure walls and ceiling. Heat flux boundary conditions resulted from experimental measures conducted in late winter. The interior and exterior surface temperatures of the enclosure were taken with a Fluke TI25 infrared camera (measurement uncertainty ± 2°C). For hard-to-reach areas such as the roof, the outside surface temperature was assumed to be the same as the outdoor ambient air temperature (−7°C). Similarly, all temperatures of surfaces located in adjacent interior rooms were assumed to be 21°C. The thermal resistance coefficients (R”) of the swimming pool enclosure were estimated based on the construction assemblies found in the architectural plans and on the thermal resistance coefficients of each material (Canadian Commission on Building and Fire Codes, 2015; ASHRAE Handbook-Fundamentals, 2019). Thus, the measured (or assumed) surface temperatures on both sides of the enclosure with estimated R” values allowed the calculation of the heat flux leaving the enclosure, and thus, the computational domain. Dry temperatures and relative humidity were measured with a TSI 9545 thermo-anemometer (measurement uncertainty ± 1°C) to set the ambient initial conditions.
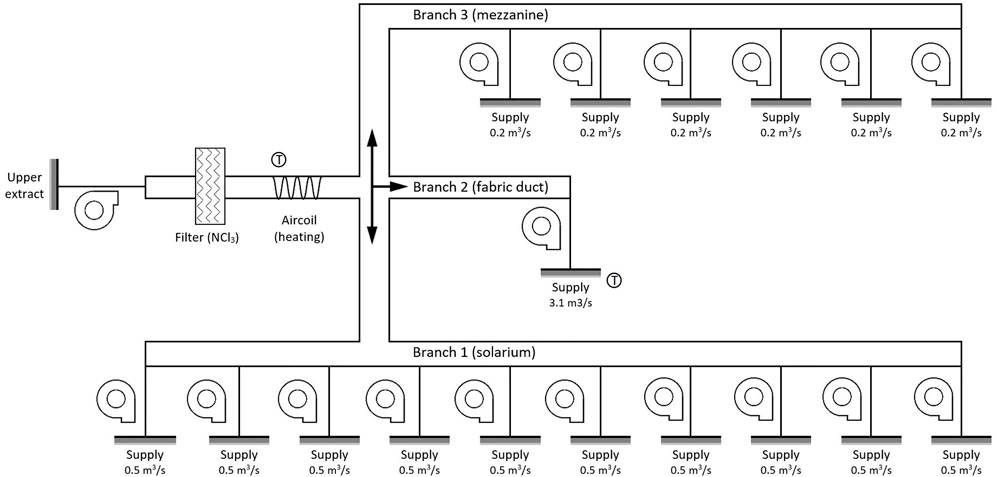
FIGURE 2. Numerical HVAC air recirculation diagram.
A no-slip boundary condition was applied for the velocity components. The velocity gradient at the solid surface was not computed directly, but rather, the near-wall treatment was based on a “log law” wall model. A fixed airflow rate was imposed at the air outlets, following the momentum box method. At all solid surfaces, except for the water surface, the mass transfer of NCl3 was zero. A constant mass transfer of 4 ×10⁻⁹ kg/s·m2 NCl3 gas was imposed uniformly at the water’s surface, corresponding to a fully occupied pool with significant water movement and splashing (Schmalz et al., 2011). Mean CNCl3 was calculated in control volumes corresponding to the breathing zone for five different groups of users, as illustrated in Figure 3. These groups are swimmers with their heads at the water surface (group 1), swimmers sitting on the deck along the basin (group 2), swimmers or staff standing on the deck around the pool basin (group 3), lifeguards sitting in surveillance towers (group 4), and spectators sitting or standing in the mezzanine (group 5).
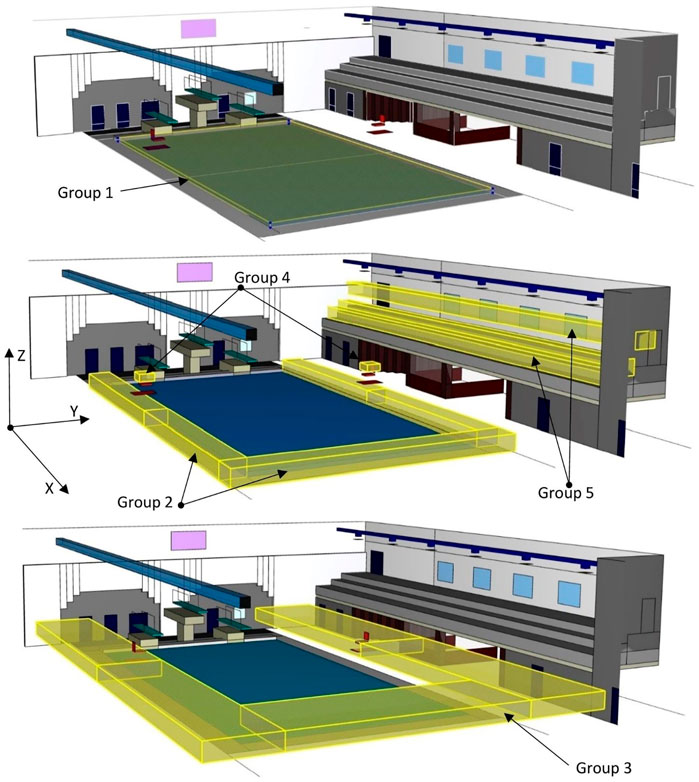
FIGURE 3. Swimming pool hall numerical model’s geometry with control volumes of user groups.
The impact of modifications to airflow parameters on CNCl3 in the breathing zone of the five groups was studied, as shown in Table 2. The actual conditions in the investigated pool were simulated as the reference case (sim. 1), with 3.6 ACH and 23% OA intake. This OA intake corresponds to the minimum ASHRAE recommendation of 2.4 L/s per m2 of the pool and deck surface for that specific swimming pool. In simulations 2 and 3, the recirculated airflow (RA) was increased while maintaining the amount of OA at its reference value (2.1 m3/s). The total airflow (TA) for these simulations corresponded to 6.0 ACH (sim. 2) and 8.0 ACH (sim. 3). In simulations 4 and 5, the increase in OA above the minimum recommendation was investigated while maintaining the TA fixed at 3.6 ACH (9.3 m3/s). The OA flow represented 50% (sim. 4) and 100% (sim. 5) of the TA supply.
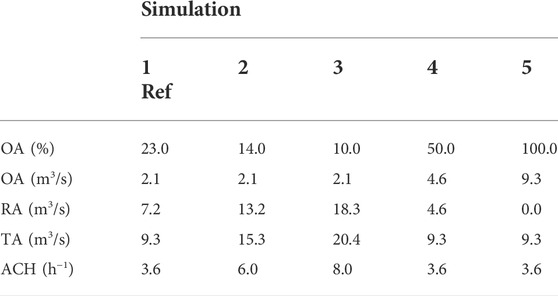
TABLE 2. Numerical simulations of ventilation parameters.
Boundary conditions applied on solid surfaces (fixed temperatures or imposed heat fluxes) were identical for all simulations. Thermal radiation was neglected in the thermal model. The air supply temperature was maintained at 33.0°C for simulations 1, 4, and 5 and lowered to 31.5°C and to 30.0°C, respectively, for simulations 2 and 3 to maintain the setpoint temperature in the enclosure despite a higher ACH. Initial air temperature and CNCl3 conditions were 29°C and 0 ppm, respectively. Simulations were carried out until the mean concentration of NCl3 in all of the breathing zones was in a steady state. This equilibrium state was reached after simulation times varied from 14,000 to 18,000 s.
The Grid Convergence Index (GCI) (Roache 1998) was used to determine the influence of spatial discretization on CNCl3 in the lowest breathing zone over the deck and the basin (Z = 0.0–0.5 m). This index was calculated with the results of three simulations performed with coarse (1), intermediate (2), and fine (3) meshes composed of 2.7, 4.2, and 6.9 million cells, respectively. A GCI of 0.25% between meshes 2 and 3 confirms the independence of the spatial discretization for the intermediate grid with 4,184,032 cells. A Y+ value between 30 and 100 is recommended for most engineering applications (McGrattan et al., 2021b). The average Y+ value for the selected mesh is 80. The airflow is sufficiently resolved along the boundaries for the purpose of this study.
The tracer gas decay and pulse methods were chosen to validate the airflow profile calculated by the numerical model. The decay method involves injecting gas into a space, making sure it is well mixed, and then measuring its concentration in real time at different locations in the room. In the pulse method, a measured amount of gas is injected into the air supply, and then, its concentration is measured at specific locations in the room. Carbon dioxide (CO2) was chosen for its nontoxicity, non-flammability, and its low impact on the environment. Since CO2 is present in ambient air, a sufficient quantity must be injected to measure a concentration higher than the background value.
The ability of the FDS to adequately model the indoor environment airflow has been the subject of numerous verification and validation case studies (McGrattan et al., 2021c and, 2021d). Two such validation cases were performed. The first was conducted in a 53-m3 test chamber with the tracer gas decay method. Pressurized CO2 was injected into the chamber for 10 s and then mixed in a room with a large fan. The concentrations of CO2 (CCO2) and air temperature were then measured at each second with four non-dispersive infrared sensors (TSI-7545, accuracy of ± 3% or ± 50 ppm), three of which were set on 1.5-m high rods and one placed on the air outlet. The ACH in the room was controlled with a variable-speed fan drive adjusted at 100 and 50% of its capacity.
The second validation was carried out in the investigated swimming pool enclosure. Due to the inability to mix the tracer gas in such a large volume, pressurized CO2 was injected into one of the linear diffusers in a solarium for 15 s. Figure 4A shows the setup of the rods on a schematic layout of the swimming pool enclosure, and Figure 4B shows an actual rod with two CO2 sensors. The CCO2 and air temperature were measured with four TSI-7545 and four TSI-7525 sets on four rods at two specific heights (0.5 and 1.5 m), positioned on the deck between the air supply vent and the pool basin in a two-row configuration. The four rods and eight TSI devices were first positioned closer to the injection vent (row 1: rods 1 to 4 in Figure 4A) and repositioned closer to the pool (row 2: rods 5 to 8 in Figure 4A). There were distances of 2.0 m between each rod and each row and of 3.0 m between the injection vent and the first row. The experiment was repeated three times for each configuration (rows 1 and 2). The total CO2 mass injected (average of 180 g per test) was determined by weighing the gas cylinder before and after each test with an ADAM CBK 35a AE balance (uncertainty ± 0.5 g). The mean CCO2 was calculated by the numerical code in control volumes enclosing each rod and averaged every 15 s.
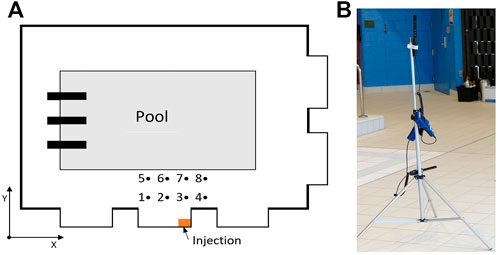
FIGURE 4. (A) Schematic layout of the pool enclosure showing the positions of the tracer gas injection’s supply vent and the measurement rods 1–8 and (B) the rod with two air sensors.
The mean age of air (MAA), used to assess the air supply distribution in each breathing zone investigated, indicates the time required for air supplied by the HVAC system to reach a specific zone (Rim and Novoselac, 2010; Sandberg, Kabanshi, and Wigo, 2020) and is directly correlated with the space airflow (Rim and Novoselac, 2010). The MAA was determined numerically with the decay method setting an initial CCO2 at 5,000 ppm in the whole domain, and its time decay was determined in control volumes for the five different groups of users.
The air change effectiveness (ACE) is a ratio expressed in percentage, comparing the MAA with the ventilation time constant (
The last index considered in this study is the contaminant removal effectiveness (CRE). The CRE, expressed in percentage, is an indicator of the effectiveness of the airflow distribution in removing a specific local indoor source contaminant, following this equation (Mundt et al., 2004):
where subscript e, s, and v are the extraction, supply, and control volume, respectively.
The outdoor ambient air temperature was −7°C, while the mean indoor air temperature and relative humidity were 28°C and 39%, respectively. The air supply temperature is controlled by a pulsed heating system. This temperature ranged from 29 to 37°C, with a mean supply temperature of 33°C. The surface mean temperatures of the floor, walls, windows, and ceiling varied between 22 and 29°C, indoors, and between −7 and 0°C, outdoors. The water temperature was 27°C.
Figure 5 shows the CCO2 versus time expressed in parts-per-million (ppm) in the climatic chamber over a 20-min period for tests 1 and 2, corresponding to the speed fan drive at 100 and 50%, respectively. Significant agreement is obtained between the experimental measurements and numerical results for both tracer gas tests. Figure 6 shows the tracer gas results in the swimming pool enclosure, which globally show a good agreement between the experiment and the CFD simulation, thus validating our numerical model. The experimental and numerical peaks of the pulse signal curves correspond very well, but the decay profile shows some divergences attributed to the difficulty of precisely reproducing the CO2 injection conditions. This level of discrepancy is expected and falls within the acceptable range required to meet the objective of this research. Table 3 shows the mean differences between experimental and simulated measures, which vary, respectively, from 5% (rod 1) to 12% (rod 4).
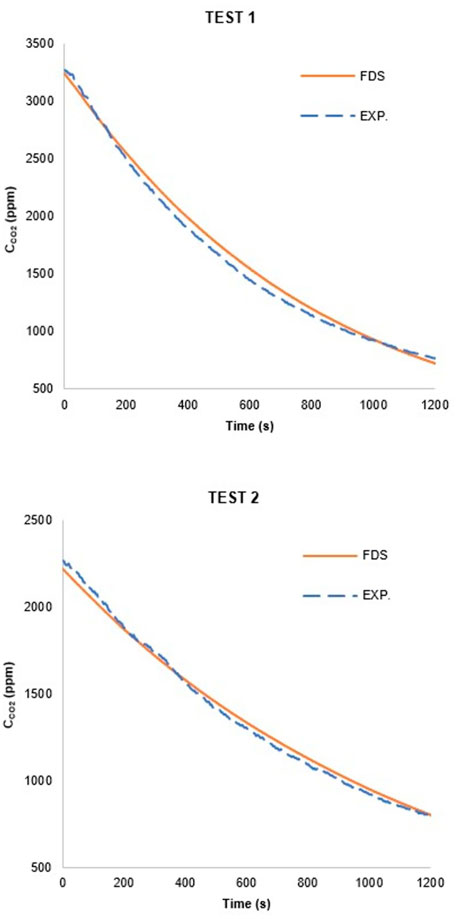
FIGURE 5. Experimental data and numerical curves of tracer gas two tests in the climatic chamber.

FIGURE 6. Experimental data and numerical curves of tracer gas (CO2) tests (rods 1–8).
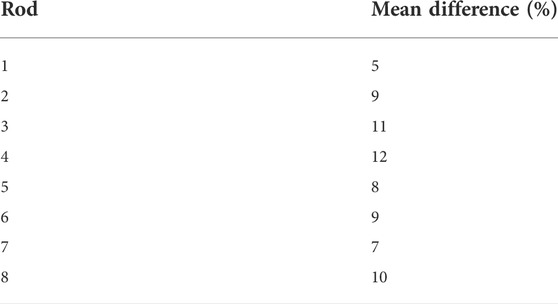
TABLE 3. Mean differences between experimental and numerical tracer gas test results.
Figures 7A,B present instantaneous velocities in the XY plane near the water level at a height of 0.13 m and in the YZ plane across the pool hall (X = 21.0 m), respectively. Increasing the TA rate increases the flow velocity in the vicinity of the air distribution devices. In the region above the basin, an increase in flow velocity can be seen, but the velocities remain well below 0.3 m/s. The RA ratio variation for simulations 4 and 5 has no impact on the airflow velocities because the TA is identical to the reference case at 9.3 m3/s. Therefore, these results are not presented in Figure 7. Roller shades installed in front of each solarium create an obstacle to the airflow, explaining why the warmer supply air does not directly go toward the ceiling of the pool hall. The supply air from the fabric duct is projected downward, but the buoyancy forces redirect it toward the ceiling since the air supply temperature is higher than the mean air temperature of the enclosure. The air supplied in the mezzanine sector is oriented sideways by using a deflector below the vent reproducing numerically the diffusers in place.
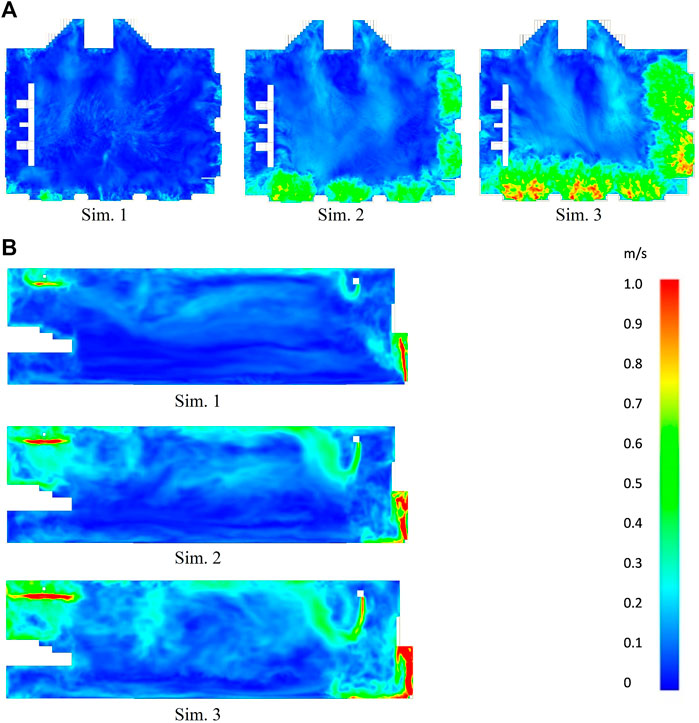
FIGURE 7. Velocities (A) in the XY plane at the water level (Z = 0.13 m) and (B) in the YZ plane in the center of the pool hall (X = 21.0 m).
Table 4 shows the mean velocities above the pool basin at 0.13 m height, averaged over a period of 15 min. In the reference case (sim. 1), the mean velocity above the pool is 5.8 cm/s. When the TA is increased to 6.0 ACH (sim. 2) and to 8.0 ACH (sim. 3), the mean velocities above the pool increase to 11.0 cm/s and 14.7 cm/s, respectively. They all remain within the threshold of the ASHRAE (HVAC Applications, 2019) recommendations, from 5.0 cm/s to 15.0 cm/s, to ensure a sufficient airspeed to remove trichloramines while limiting water evaporation. However, the air velocities are between 10.0 cm/s and 70.0 cm/s (sim. 2) and between 30.0 cm/s and 100.0 cm/s (sim. 3) above the deck on the sides of the solariums (Figures 7A,B), which could cause significant discomfort to swimmers while they are in those areas. In all of the velocity planes presented, the area with the lowest airspeed is located above the pool and behind the diving boards. The ventilation strategy in place avoids high-speed airflow above the pool, as recommended by ASHRAE.
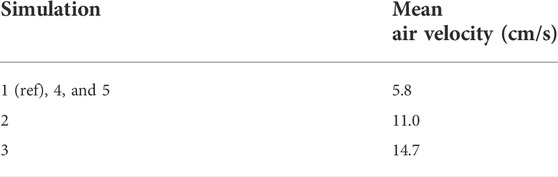
TABLE 4. Air velocity above the water surface: numerical results.
Table 5 shows the MAA and the ACE for the reference case (sim. 1). An ACE index of 100% corresponds to a piston flow, while an index of 50% represents ideal mixing conditions (Mundt et al., 2004). The weighted average of the local MAA for the five user groups is 29.7 min, and the associated ACE index is 56%, which allows us to conclude that the ventilation in place creates conditions close to a well-mixed air distribution system. The lifeguard breathing zone (group 4) is not considered well-mixed, with an index of 41%, indicating some stagnant air in the zone, while the spectator area (group 5) shows short-circuit ventilation with an index of 76%.
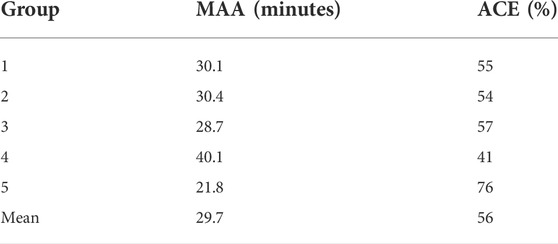
TABLE 5. MAA and ACE numerical results.
Table 6 shows the CRE index for the five user groups and the mean CRE averaged over the volume of each zone, for all five simulations. A CRE index of 100% corresponds to a well-mixed condition; above 100%, it indicates an area with short-circuited ventilation, and a CRE below 100% indicates an area with potentially stagnant airflow or closer to the contaminant source (Etheridge and Sandberg, 1996). The CRE index in the reference case (sim. 1) for the five user groups (volume-weighted average of all groups) is 24%. This index moves up to 30% (sim. 2) and 45% (sim. 3) when the TA is increased but remains at 24% or close to it (sim. 4 and 5) when the TA is unchanged. These results indicate an improvement in the effectiveness of the air distribution in removing NCl3 only when the TA and RA rates are increased (sim. 2 and 3). This is explained by the higher airflow velocities in the space when the TA is increased. Increasing the OA rate (sim. 4 and 5) does not lead to a significant change in the CRE index. Indeed, an OA variation while the TA is unchanged does not affect the airflow distribution in the space. The CRE index does not take into consideration its impact on contaminant removal.
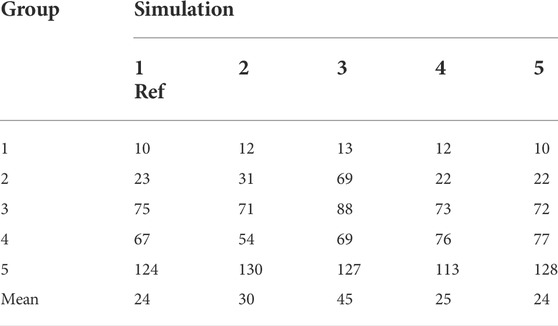
TABLE 6. CRE numerical results (%).
Figures 8A,B show, respectively, CNCl3 in parts-per-billion (ppb) and CNCl3 variations (%) compared to the reference case (sim. 1), for each of the five user groups and their volume-weighted average. These results represent the average CNCl3 in each control volume after the steady-state conditions are reached and over a time interval of 15 min. For the reference case (sim. 1) in Figure 8A, CNCl3 in the lowest breathing zone (group 1) just above the water surface is 1,910 ppb, which is two times higher than CNCl3 in the second group’s breathing zone (sitting alongside the pool) and almost four times the CNCl3 in the third group’s breathing zone (standing on the deck). This reveals the significant vertical CNCl3 gradient near the water surface. Regardless of the ventilation scenario, CNCl3 remains much higher in the first breathing zone (group 1). The weighted average CNCl3 of the reference case (sim. 1) is the highest, with 950 ppb, while the lowest concentration is 600 ppb obtained with 100% OA (sim. 5). Thus, admitting 50% OA (sim. 4) and 100% OA (sim. 5) yields a 19% and a 37% CNCl3 reduction (volume-weighted average), respectively.
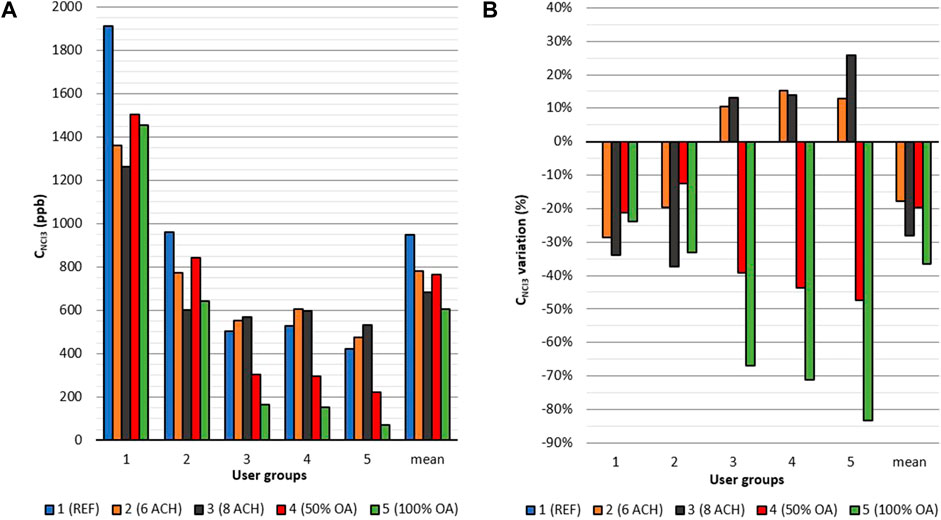
FIGURE 8. CNCl3 for the five user groups: (A) absolute values and (B) variation with the reference case (sim. 1).
For the lowest breathing zone (group 1), in Figure 8B, the TA increased to 6.0 ACH and 8.0 ACH (sims. 2 and 3, respectively) yields the largest reduction of CNCl3, with 28 and 33%, followed by an increase in the OA (sims. 4 and 5), with a CNCl3 reduction of 21 and 24%. However, the reduction is not that significant between 6.0 ACH and 8.0 ACH or between 50% OA and 100% OA.
For the second breathing zone (group 2), the most significant CNCl3 reduction obtained is 37% with 8.0 ACH (sim. 3), closely followed by 100% OA (sim. 5), with a reduction of 33%. There is an OA of 2.1 m3/s for 8.0 ACH (sim. 3), the same amount as the reference case (sim. 1), but an increased OA to 9.3 m3/s for 100% OA (sim. 5). Interestingly, the increased RA (and TA) has a greater impact on CNCl3 reduction than an increased OA (TA fixed), for the lower breathing zones (groups 1 and 2). This can be explained by the difficulty in moving NCl3 due to its high molar weight. Increased air momentum is required to prevent its accumulation at the water and deck levels. By itself, OA is not sufficient if the air velocity is also insufficient (not enough momentum).
For breathing zones located at a height greater than 1.0 m from the floor and water surface (groups 3, 4, and 5), there is a reduction of CNCl3 between 39 and 47%, with 50% OA (sim. 4) and between 67 and 83%, with 100% OA (sim. 5). These breathing zones benefit the most from an increase in OA. Conversely, there is an increase of CNCl3 of between 10 and 15%, with 6.0 ACH (sim. 2) and between 13 and 26%, with 8.0 ACH (sim. 3). These breathing zones (groups 3, 4, and 5) are negatively impacted by an increase in the TA. This is explained by the increased momentum that lifts NCl3 from the water and deck levels and disperses it in the entire volume of the enclosure.
Figures 9A,B show CNCl3 in the XY plane near the water level at Z= 0.13 m and in the YZ plane across the pool hall (X = 21.0 m), respectively. There is a significant reduction of CNCl3 for simulations 4 and 5 in about half of the areas over the deck (Figure 9A) and in the space above 1.0 m height (Figure 9B). This reduction is induced by a decrease in RA and, consequently, an increase in OA. These zones are clearly affected by the recirculation of NCl3 in the HVAC system. A significant reduction of CNCl3 for simulations 2 and 3 above the water surface (Figures 9A,B) and in some areas above the deck (Figure 9A) is also observed. This is explained by the increased air velocities lifting NCl3 in the air above that level. As NCl3 is lifted up, it is entrained and diluted in the air.
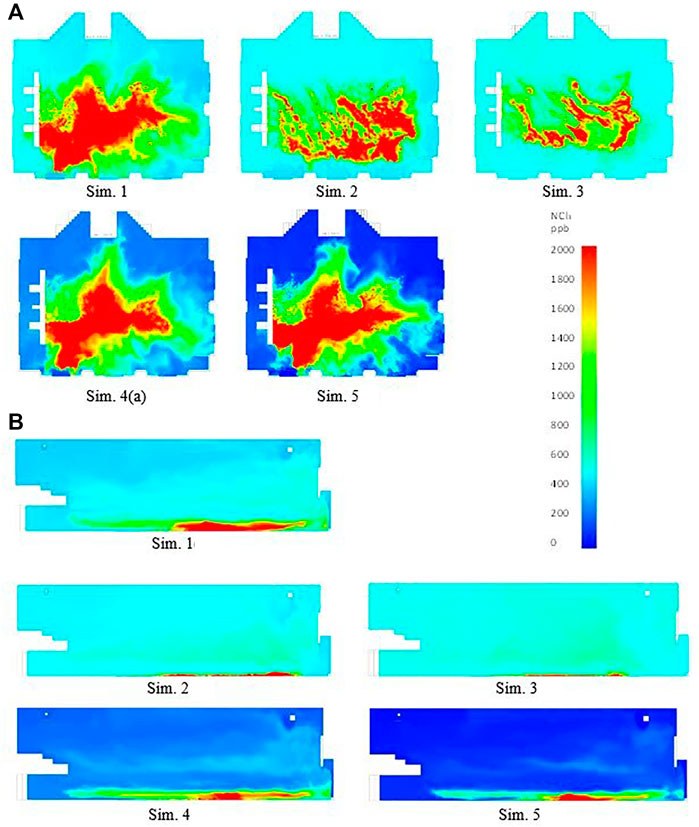
FIGURE 9. CNCl3 (A) in the XY plane at the water level (Z = 0.13 m) and (B) in the YZ plane in the center of the pool hall (X = 21.0 m).
Each simulated scenario yields a CNCl3 decrease as compared to the reference case (sim. 1) for the volume-weighted average of all five user groups. As recommended by Lochner and Wasner (2017) and Bessoneau et al. (2011), an OA increase effectively improves air quality in the breathing zone of all five groups by reducing CNCl3. The reduction ratio is surprisingly low, coming in at only 24% for group 1 (water surface) and 33% for group 2 (sitting on the deck), for a 100% OA (sim. 5), also taking into consideration that these two groups are exposed to the highest CNCl3. These reductions may not yield CNCl3 sufficiently low enough to prevent adverse effects on health. Furthermore, eliminating air recirculation with a 100% OA is a known energy-demanding ventilation strategy, especially in a cold climate. In comparison, Saleem et al. (2019), in an experimental study, obtained a 55% reduction of CNCl3, from 0.22 mg/m3 to 0.10 mg/m3, when only OA was supplied, in reference to the minimum ASHRAE requirements. Their measuring locations correspond to the breathing zone of group 2 (sitting on the deck). Their results present a more significant CNCl3 reduction with a 100% OA strategy, compared to our numerical results. However, the swimming pool halls do not have the same geometry nor the same ventilation, air distribution, and extraction layouts, limiting our comparative analysis. For groups 3, 4, and 5 (breathing zones above 1.0 m), there is a CNCl3 increase when the TA and RA are increased (sim. 2 and 3), but this is compensated by a CNCl3 decrease for groups 1 and 2 (water surface and the deck along the basin). Increasing the RA and TA (sims. 2 and 3) brings higher air velocities above the water surface, which contributes to more efficient contaminant dilution by displacing NCl3 through the enclosure. The air quality, with regard to CNCl3, is improved in the lower breathing zones but negatively impacted in higher breathing zones, where lifeguards and swimming monitors may be more exposed. Energy expenditure might be increased by the added RA in movement (ventilation fans) and the added air velocities near the building envelope contributing to an increase in the convective heat transfer coefficient. However, there is no added OA needing conditioning, therefore limiting the energy demand to a potentially acceptable level for building managers. This dilution ventilation strategy (increased RA and TA, sims. 2 and 3) has the potential to bring the overall CNCl3 to under a certain threshold by leveling its concentration in all breathing zones. In terms of exposure, these higher airflow strategies could represent a better compromise depending on the duration of exposure in each breathing zone and the frequency of that exposure. In other words, a lifeguard who does not go in the water or spends less time in that lower breathing zone might not benefit from that ventilation strategy as much as a swimmer who spends most of its time in the lowest breathing zone.
The simulations show that a mean velocity of 5.8 cm/s over the water surface is not sufficient to prevent NCl3 accumulation. ASHRAE’s recommendation of 5.0 cm/s as a minimum threshold to move chloramines might not be enough to prevent NCl3 accumulation near the water surface. Lower CNCl3 near the water surface and improved dilution are obtained, with a mean velocity of 11.0 cm/s, and are further improved with a mean velocity of 14.7 cm/s, corresponding respectively to 6.0 ACH (sim. 2) and 8.0 ACH (sim. 3).
The lowest CRE index is obtained in the lowest breathing zone (group 1) for all simulations (from 10 to 13%), representing an important stratification of NCl3, but the ACE index for the same breathing zone (55%) is very close to the weighed-volume average of 56% and represents a well-mixed ventilation condition. Despite this well-mixed condition, NCl3 can accumulate in that area due to its proximity to the emission source (water surface) and its density which is higher than that of air.
Variation of the OA rate and the ACH on CNCl3 in different breathing zones was numerically investigated for an aquatic center located in Canada. Four scenarios have been modeled and compared with the modeled reference case based on the existing conditions. This research shows that for the swimming pool hall investigated,
• an OA increase by itself is not sufficient to reduce CNCl3 in the lower breathing zones, especially over the water surface, if no added air momentum is provided.
• A mean air velocity of 5.8 cm/s above the water surface is not sufficient to prevent NCl3 accumulation in the swimmers’ breathing zone.
• Breathing zones above 1.0 m from the floor and the water surface are negatively impacted by an augmentation of the TA.
• The most significant CNCl3 reduction in the breathing zone that has the highest CNCl3 (group 1) is obtained by augmenting the TA (OA unchanged) from 3.6 ACH to 8.0 ACH. This ventilation strategy yields an increase in the mean air velocity above the water surface from 5.8 cm/s in the reference case to 14.7 cm/s.
Based on the results of this research for that specific swimming pool hall and in a context where no reconfiguration of the HVAC system is planned, the recommendation to managers is to increase the TA (with RA) as much as possible but only up to a maximum of 8.0 ACH. However, the swimmers’ comfort must be assessed, given the increased airspeed above the deck. Therefore, a compromise must be made between CNCl3 over the water surface, the thermal comfort, and the energy expenditure. An increase of OA would also be beneficial, particularly for breathing zones above 1 m in height, and should be evaluated with respect to additional energy expenses. The findings of this study can serve to guide research for other swimming pool halls even if the enclosure and the ventilation strategy are not similar to those herein. Further research is needed to study the exposure, thermal comfort, and energy expenditure associated with variation of ventilation parameters. Ventilation strategies should be studied in other aquatic centers to provide optimal air quality in all breathing zones while minimizing energy loss.
The raw data supporting the conclusion of this article will be made available by the authors, without undue reservation.
HP developed the numerical model of the swimming pool, prepared and ran the numerical simulations, performed (with Pr. Hallé) the experimental tracer gas tests, and analyzed the experimental and numerical results. SH directed and supervised the work of HP, performed (with HP) the experimental tracer gas tests, and revised the analysis of the experimental and numerical results.
This work was supported by the Institut de recherche Robert-Sauvé en santé et en sécurité du travail (IRSST) under Grant 2015-00102.
The authors would like to thank the City of Montreal for access to the investigated swimming pool, ventilation reports, and architectural and mechanical plans, and Thunderhead Engineering Consultants for access to PyroSim software.
The authors declare that the research was conducted in the absence of any commercial or financial relationships that could be construed as a potential conflict of interest.
All claims expressed in this article are solely those of the authors and do not necessarily represent those of their affiliated organizations, or those of the publisher, the editors, and the reviewers. Any product that may be evaluated in this article, or claim that may be made by its manufacturer, is not guaranteed or endorsed by the publisher.
Afifi, M. Z., and Blatchley, E. R. (2015). Seasonal dynamics of water and air chemistry in an indoor chlorinated swimming pool. Water Res. 68, 771–783. doi:10.1016/j.watres.2014.10.037
Agence nationale de sécurité sanitaire de l’alimentation (2012). Evaluation des risques sanitaires liés aux piscine partie 1: Piscines réglementées. (Maisons-Alfort: ÉdScientifique).
American Society of Heating (2019). Refrigerating and air-conditioning engineers inc. ANSI/ASHRAE standard 62.1: Ventilation for acceptable indoor air quality. Atlanta, GA.
American Society of Heating Refrigerating and air-conditioning engineers inc. ASHRAE Handbook. Atlanta, GA: HVAC Applications.
American Society of Heating Refrigerating and air-conditioning engineers inc. ASHRAE Handbook: Fundamentals, 2019. Atlanta, GA.
Bessonneau, V., Derbez, M., Clément, M., and Thomas, O. (2011). Determinants of chlorination by-products in indoor swimming pools. Int. J. Hyg. Environ. Health 215, 76–85. doi:10.1016/j.ijheh.2011.07.009
Calise, F., Figaj, R. D., and Vanoli, L. (2018). Energy and economic analysis of energy savings measures in a swimming pool centre by means of dynamic simulations. Energies 11, 2182. doi:10.3390/en11092182
Canadian Commission on Building and Fire Codes, National Research Council of Canada (NRCC) (2015). National building code of Canada. Ottawa.
Cavestri, R. C., and Seeger-Clevenger, D. (2008). Chemical off-gassing from indoor swimming pools. ASHRAE Res. Proj. Rep. RP- 1083, 39.
Ciuman, P., and Lipska, B. (2018). Experimental validation of the numerical model of air, heat and moisture flow in an indoor swimming pool. Build. Environ. 145, 1–13. doi:10.1016/j.buildenv.2018.09.009
Etheridge, D., and Sandberg, M. (1996). Building ventilation, theory and measurment. John Wiley & Sons, 724p.
Fadlun, E. A., Verzicco, R., Orlandi, P., and Mohd-Yusofz, J. (2000). Combined immersed-boundary finite-difference methods for three-dimensional complex flow simulations. J. Comput. Phys. 161, 35–60. doi:10.1006/jcph.2000.6484
Lévesque, B., Vézina, L., Gauvin, D., and Leroux, P. (2015). Investigation of air quality problems in an indoor swimming pool: A case study. Ann. Occup. Hyg. 59-8, 1085–1089. doi:10.1093/annhyg/mev038
Limane, A., Fellouah, H., and Galanis, N. (2017). Simulation of airflow with heat and mass transfer in an indoor swimming pool by OpenFoam. Int. J. Heat. Mass Transf. 109, 862–878. doi:10.1016/j.ijheatmasstransfer.2017.02.030
Lochner, G., and Wasner, L. (2017). Ventilation requirements for indoor pools. ASHRAE J. July, 16–24.
McGrattan, K., Hostikka, S., Floyd, J., McDermott, R., and Vanella, M. (2021d). Fire Dynamics Simulator Technical’s Reference Guide. sixth ed, Vol. 3. (Gaithersburg: National Institute of Standards and Technology (NIST) special publication).
McGrattan, K., Hostikka, S., Floyd, J., McDermott, R., and Vanella, M. (2021a). Fire Dynamics simulator software. (Gaithersburg: National Institute of Standards and Technology NIST).
McGrattan, K., Hostikka, S., Floyd, J., McDermott, R., and Vanella, M. (2021c). Fire Dynamics simulator technical guide. sixth ed.(Gaithersburg: National Institute of Standards and Technology (NIST) special publication).
McGrattan, K., Hostikka, S., Floyd, J., McDermott, R., and Vanella, M. (2021b). Fire Dynamics simulator user’s guide. sixth ed. (Gaithersburg: National Institute of Standards and Technology (NIST) special publication).
Mundt, E., Mathisen, H. M., Nielsen, P. V., and Moser, A. (2004). Ventilation effectiveness. REHVA: Federation of European Heating and Air-conditioning Associations.
Nitter, T. B., and Svendsen, K. V. H. (2020). Covariation amongst pool management, trichloramine exposure and asthma for swimmers in Norway. Sci. Total Environ. 723, 138070. doi:10.1016/j.scitotenv.2020.138070
Nordberg, G. F., Lundstrom, N.-G., Forsberg, B., Hagenbjork-Gustafsson, A., Lagerkvist, B. J., Nilsson, J., et al. (2012). Lung function in volunteers before and after exposure to trichloramine in indoor pool environments and asthma in a cohort of pool workers. BMJ Open 2, e000973. doi:10.1136/bmjopen-2012-000973
Parrat, J., Donzé, G., Iseli, C., Perret, D., Tomicic, C., and Schenk, O. (2012). Assessment of occupational and public exposure to trichloramine in Swiss indoor swimming pools: A proposal for an occupational exposure limit. Ann. Occup. Hyg. 56-3, 264–277. doi:10.1093/annhyg/mer125
Rim, D., and Novoselac, A. (2010). Ventilation effectiveness as an indicator of occupant exposure to particles from indoor sources. Build. Environ. 45, 1214–1224. doi:10.1016/j.buildenv.2009.11.004
Roache, P. J. (1998). Verification and validation in computational science and engineering. Hermosa, United States, 429.
Rojas, G., and Grove-Smith, J. (1998). Improving ventilation efficiency for a highly energy efficient indoor swimming pool using CFD simulations. Fluids 3 (4), 92. doi:10.3390/fluids3040092
Romberg, K., Tufvesson, E., and Bjermer, L. (2012). Asthma is more prevalent in elite swimming adolescents despite better mental and physical health. Scand. J. Med. Sci. Sports 22, 362–371. doi:10.1111/j.1600-0838.2010.01177.x
Saleem, S., Dyck, R., Hu, G., Hewage, K., Rodriguez, M., and Sadiq, R. (2019). Investigating the effects of design and management factors on DBPs levels in indoor aquatic centres. Sci. Total Environ. 651-1, 775–786. doi:10.1016/j.scitotenv.2018.09.172
Sandberg, M., Kabanshi, A., and Wigo, H. (2020). Is building ventilation a process of diluting contaminants or delivering clean air? Indoor Built Environ. 29, 768–774. doi:10.1177/1420326x19837340
Schmalz, C., Frimmel, F. H., and Zwiener, C. (2011). Trichloramine in swimming pools – formation and mass transfer. Water Res. 45, 2681–2690. doi:10.1016/j.watres.2011.02.024
Smedegard, O. O., Aas, B., Stene, J., Georges, L., and Carlucci, S. (2021). Systematic and data-driven literature review of the energy and indoor environmental performance of swimming facilities. Energy Effic. 14, 74. doi:10.1007/s12053-021-09985-6
Thickett, K. M., McCoach, J. S., Gerber, J. M., Sadhra, S., and Burge, P. S. (2002). Occupational asthma caused by chloramines in indoor swimming-pool air. Eur. Respir. J. 19, 827–832. doi:10.1183/09031936.02.00232802
Verein Deutscher Ingenieure (2010). VDI 2089 Part 1: Building Services in swimming baths – indoor pools. (Dusseldorf: Gesellschaft Bauen und Gebäudetechnik).
Keywords: trichloramine, indoor swimming pool, ventilation, CFD, tracer gas, outdoor air, recirculation, HVAC
Citation: Proulx H and Hallé S (2022) A numerical study of the impacts of outdoor air intake and air changes per hour on the trichloramine concentrations in a swimming pool enclosure. Front. Built Environ. 8:957973. doi: 10.3389/fbuil.2022.957973
Received: 31 May 2022; Accepted: 06 September 2022;
Published: 26 September 2022.
Edited by:
Gráinne McGill, University of Strathclyde, United KingdomReviewed by:
Samar Thapa, Ca’ Foscari University of Venice, ItalyCopyright © 2022 Proulx and Hallé. This is an open-access article distributed under the terms of the Creative Commons Attribution License (CC BY). The use, distribution or reproduction in other forums is permitted, provided the original author(s) and the copyright owner(s) are credited and that the original publication in this journal is cited, in accordance with accepted academic practice. No use, distribution or reproduction is permitted which does not comply with these terms.
*Correspondence: H. Proulx, aGVsZW5lLnByb3VseC4xQGVucy5ldHNtdGwuY2E=
Disclaimer: All claims expressed in this article are solely those of the authors and do not necessarily represent those of their affiliated organizations, or those of the publisher, the editors and the reviewers. Any product that may be evaluated in this article or claim that may be made by its manufacturer is not guaranteed or endorsed by the publisher.
Research integrity at Frontiers
Learn more about the work of our research integrity team to safeguard the quality of each article we publish.