 R. Flores-Mendoza
 A. Pozos-Estrada
- Instituto de Ingeniería, Universidad Nacional Autónoma de México, Ciudad Universitaria, Mexico City, Mexico
In an optimal seismic design context, the seismic demand is characterized by hazard curves that can be obtained by simulation techniques, and the capacity of the structure is established by the designer following a predefined seismic code. The capacity of structures is generally characterized by the seismic design coefficient. Furthermore, the structure damage is evaluated based on certain well-defined damage indicators (e.g., displacement ductility). Thus based on the damage indicator, it is possible to estimate the cost of the associated losses. Furthermore, it is noted that the quantification of the damage costs associated with reinforced concrete (RC) structures with and without nonlinear viscous dampers under seismic loading is very scarce in the relevant literature. In this study, damage cost expressions, similar to those employed in the optimal seismic design criterion, were used to quantify and compare the damage cost on RC buildings with and without viscous dampers located in seismic-prone areas of Mexico. For the analysis, three RC buildings were designed according to Mexican seismic design regulations. The buildings under study were subjected to seismic actions characterized by actual seismic records, scaled according to simulated maximum ground motion accelerations. The damage to the structures caused by seismic action is calculated by means of a damage factor that is a function of displacement ductility demand. The cost of damage to the considered structures was estimated based on cost expressions that are a function of the damage factor. The analyses results indicate that the use of viscous dampers in concrete buildings subjected to seismic action can considerably reduce the associated damage costs with respect to buildings without such a damping system.
1 Introduction
The experiences of damage caused by past and recent earthquakes have clearly established the importance of the economic losses and the consequences of this type of natural event, affecting the economy of the people and the country. The economic impact of an earthquake or any natural disaster can be classified as 1) loss of real estate assets, 2) loss of movable assets, 3) economic loss due to business interruption, 4) economic cost of the public sector, and 5) loss of family income due to loss of life and injuries (Gokhale et al., 2004). The first two economic impacts are considered to be direct losses and the last three indirect economic losses.
Within the current building environment, there is evidence that recently built structures have presented a certain degree of vulnerability. Thus in many countries from 1974 to 2003, the economic cost caused by earthquakes has shown an increasing trend, being more noticeable in affluent societies (EM-DAT, 2022). The vulnerability of structures in Mexico has not been an exception; for example, during the earthquake of September 19, 2017, official reports showed that a total of 65,044 houses, 1,440 schools, 46 medical units, and 460 cultural spaces were considerably damaged and in some cases underwent total collapse (Pozos-Estrada et al., 2019).
Optimal seismic design and coding based on the minimum expected life cycle cost have been discussed by Rosenblueth and Mendoza (1971), Hasofer (1974), Rosenblueth (1976, 1987), Liu et al. (1976), Rosenblueth and Jara (1991), Ang and De Leon (1997), Rackwitz (2000), Kang and Wen (2000), Ellingwood and Wen (2005), Goda and Hong (2006), and more recently by Pozos-Estrada et al. (2016). In all the studies, the selection of the seismic design level is seen as an economic and safety issue that balances benefits and costs for the life cycle of the structure. To select an optimal seismic design level, most studies consider the maximum expected benefit or the minimum expected cost rule. It should be noted that to achieve an optimal seismic design, it is important to incorporate the occurrence of earthquakes, which happen infrequently and randomly, through seismic hazard studies such as those reported by Esteva (1968), Cornell (1968), Newmark and Rosenblueth (1971), and Rosenblueth and Esteva (1972).
In this study, damage cost expressions, similar to those employed in the optimal seismic design criterion, were used to quantify and compare the damage costs on RC buildings, with and without viscous dampers located in three seismic-prone areas in Mexico. For the analysis, three RC buildings were designed following Mexican seismic design regulations. Nonlinear structural responses under seismic excitations were employed to define the partial damage and collapse, as well as to evaluate estimates of the damage cost. The buildings under study were subjected to seismic actions characterized by actual seismic records, scaled according to simulated peak ground accelerations (PGA). The simulated PGA were obtained by using a detailed seismic hazard model applicable to part of the Mexican Pacific coastal region and Mexico City. The damage to the structures due to seismic action was calculated by means of a damage factor that is a function of displacement ductility demand. The cost of damage to the considered structures was estimated based on cost expressions that are a function of damage factor.
2 Cost information
2.1 Background
Life cycle cost analysis to select the optimal seismic design has been investigated by Rosenblueth (1976), Rackwitz (2000), and Kang and Wen (2000). Let B(CS,t) denote the present worth benefit derived from the service and existence of a designed structure up to time t, where CS is a design parameter. The construction of the structure requires an initial capital investment C0(CS). If the structure becomes damaged or collapses in a very strong earthquake, there would be a damage cost at present value. The damage cost not only includes the structural and non-structural costs, but the cost of lost life and limb, demolition, removal, repair, and replacement as well. If systematic reconstruction following failure is considered (i.e., the structure is repaired or rebuilt without modifying the design and construction rules), the optimal design, based on the rule of the value of the maximum expected benefit or the value of the minimum expected costs, is obtained by maximizing the following objective function (Rosenblueth, 1976):
where the O(CS,t) values must be positive for the structure to be considered as a benefit, considering that the earthquake is generated by n zones of seismic sources that would excite the structure. Furthermore, considering that an earthquake occurs randomly at a time τij, i = 1, …, Nj(t) and j = 1,...,n, where Nj(t) is the number of earthquakes originating from the jth source zone in a time interval (0, t). If the structure is immediately repaired or rebuilt after suffering damage or collapse without modifying the construction design standards (the structure is repaired in the initial conditions), and the service or the planned period is considered (0, t). CD (CS|xij) and CR (CS|xij) represent the damage cost and the repair/reconstruction cost, given that the damage state induced by an earthquake τij occurred in xij, and γ is the discount rate adjusted by inflation, which is often set at 5% for developing societies.
2.2 Initial damage and repair and reconstruction costs
The initial construction cost has been discussed by various authors, including Rosenblueth and Jara (1991), Ang and De Leon (1997), Kang and Wen (2000), and Goda and Hong (2006). For RC buildings, Esteva et al. (2002) considered that C0(Cs) was a function of the vibration period of the structure and the fundamental vibration period of the system if it was designed for gravity load only. In the present study, the adopted functional form of C0(Cs) is the one used by Pozos-Estrada et al. (2016) to evaluate the seismic design and importance factor of a 10 story RC structure, modeled as an elastoplastic single-degree-of-freedom system, written as
where the initial cost function of the structural components is of the following form
where C00 represents the cost if the structure was not designed against earthquakes. The cost of the non-structural components,
The damage costs,
where
where μ is the seismic displacement ductility demand, and μC is the ductility capacity of the structure. Equation 6 is applicable when μ
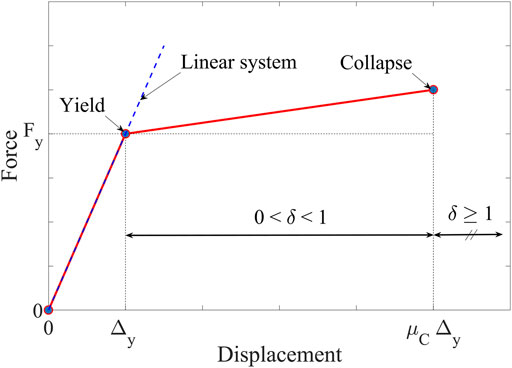
FIGURE 1. Ranges of δ in the force-displacement curve of a nonlinear system.
3 Characterization of the seismic action
It is noted that new simulation techniques for ground motion records have been proposed recently (Hong and Liu, 2014; Liu and Hong, 2015; Liu and Hong, 2016; Hong and Cui, 2020); however, for simplicity, the characterization of the seismic records adopted in this study followed a practical approach and consisted of the PGA simulation, scaling of actual seismic records, and calculation of the strong ground motion duration. This procedure was followed to include both the seismicity of the sites of interest as well as the amplitude and frequency content characteristics of actual records. It was noted that although the results of the de-aggregation of the seismic hazard for some selected sites of Mexico (including Mexico City and Guerrero) indicate that in all the cases studied, the far-field earthquakes dominated the seismic hazard (Pozos-Estrada et al., 2014), the passive dampers’ ability to adapt under near-field pulse-like records requires further investigation; however, the latter is outside the scope of the present study. Figure 2 thus illustrates the characterization of seismic records used in the analyses.
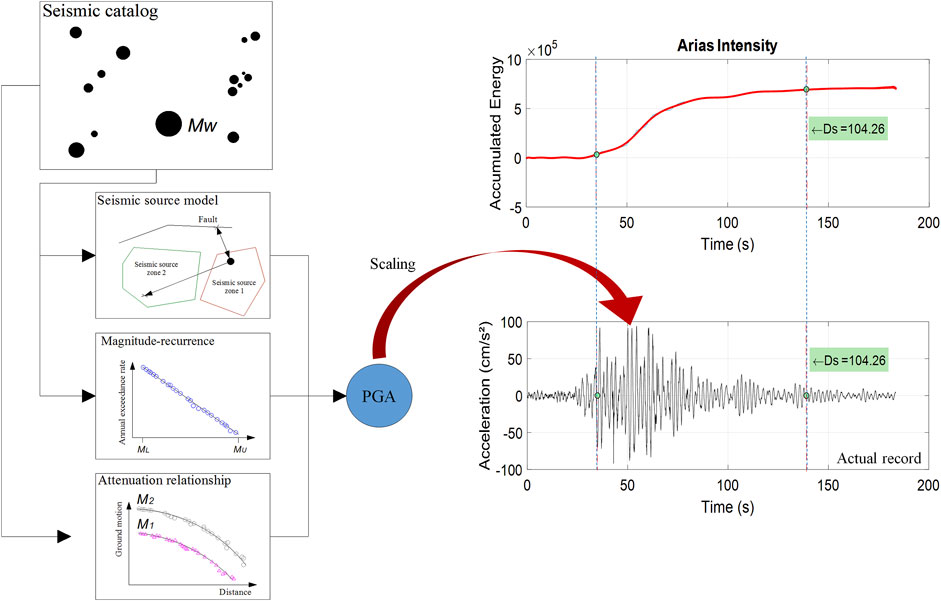
FIGURE 2. Illustration of the characterization of seismic records used in the analyses.
3.1 Simulation of the peak ground accelerations and scaling of the seismic records
To simulate the PGA, a detailed seismic hazard model based on a simulation technique described in Hong et al. (2006) was adopted in the present study. This model includes the earthquake occurrence modeling, magnitude–recurrence relation, seismic source zones, and ground motion prediction equations (GMPEs). The model considers the seismic sources presented in Figure 3, where the seismic sources are separated into three groups (Ordaz and Reyes, 1999; Jaimes and Reinoso, 2006; Reinoso and Jaimes 2009; Nishenko and Singh 1987), depending on the type of earthquake and magnitude considered. The magnitude–recurrence relation and parameters defining the source zones are given by Ordaz and Reyes (1999) for interplate events, and by Jaimes and Reinoso (2006) for intraslab events. The GMPEs employed were those developed by Hong et al. (2009) for interplate and intraslab events for places outside Mexico City. In the case of Mexico City, GMEs have been developed to evaluate the seismic hazard and deaggregation of the seismic hazard for firm soil (Pozos-Estrada et al., 2014; Liu et al., 2016); however, since one of the structures under study is assumed to be located in soft soil of Mexico City, the GMPE developed by Jaimes and Reinoso (2006) for interplate and intraslab earthquakes were considered.
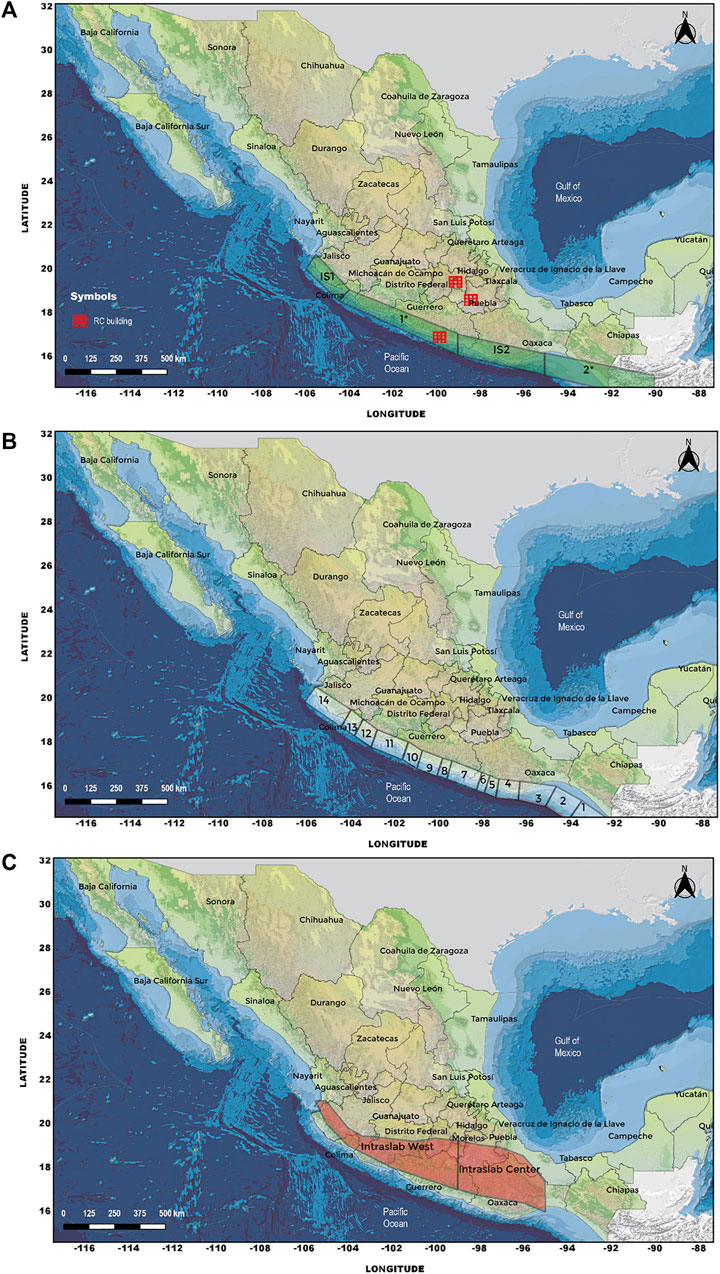
FIGURE 3. Seismic source zones: (A) interplate with 4.5 < Mw < 7.0 and locations of the studied buildings; (B) interplate with Mw ≥ 7.0; (C) intraslab with 4.5 < Mw < 7.9.
The simulated PGA was employed to scale actual ground motion records for the sites of interest. The seismic records employed integrate information from different networks. A total of 150 strong ground motion records from 23 interplate and intraslab earthquakes were used and scaled. Before scaling, the seismic records were corrected with a baseline correction and a high-pass filter with cutoff frequency equal to 0.05 Hz for events with Mw > 6.5, and 0.1 Hz for the remaining events (Garcia et al., 2005). Table 1 summarizes the interplate and intraslab seismic events considered.
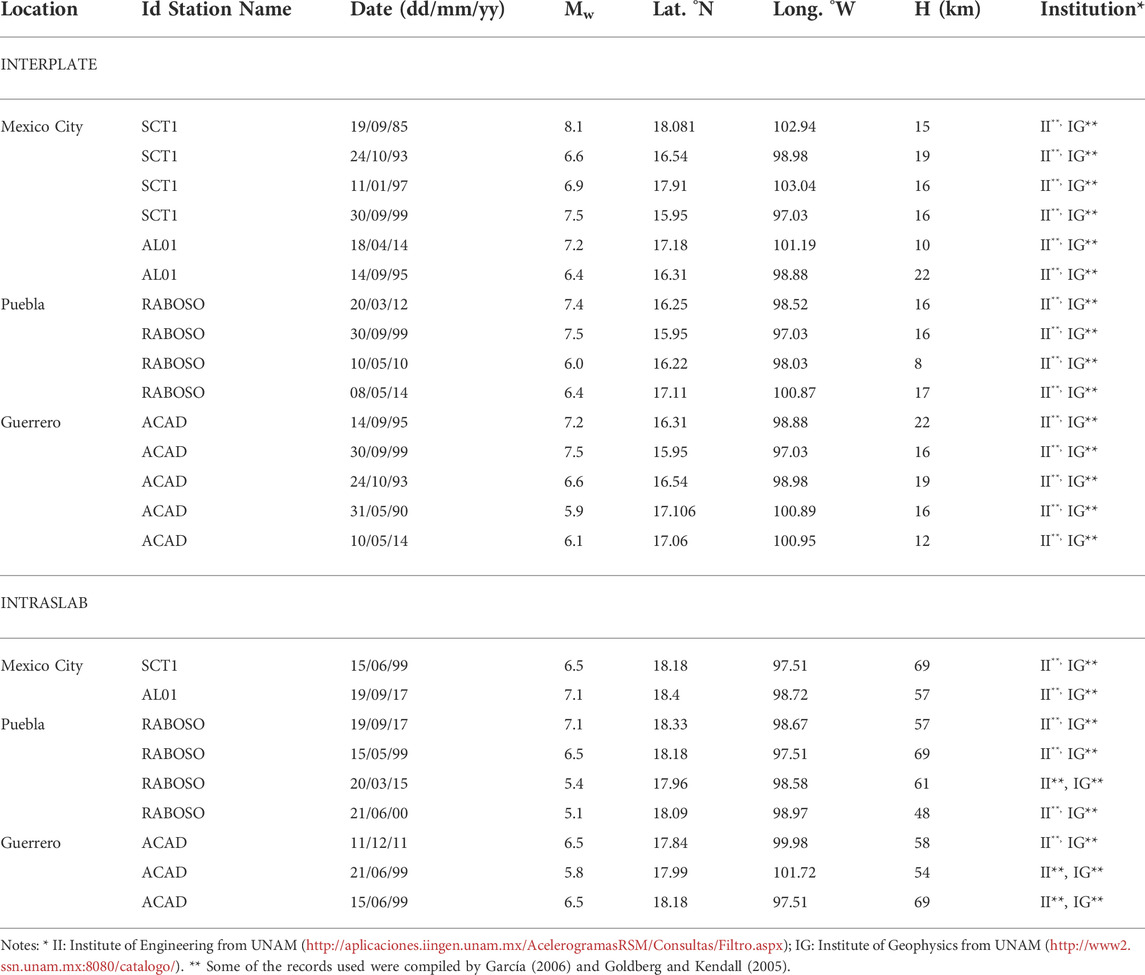
TABLE 1. Interplate and intraslab events and seismic records selected.
3.2 Strong ground motion duration
For the numerical analysis, the strong ground motion duration (SGMD) for all the seismic records considered was calculated. The aim of calculating the SGMD was to shorten the total duration of the seismic records to reduce the computing time without losing the maximum energy phase of the movement. Furthermore, according to Reinoso and Ordaz (2001), the SGMD should be integrated as a design parameter if the structural damage of systems with hysteretic behavior behavior is of interest.
The Arias intensity (Arias, 1970) has been widely used to relate the SGMD with the acceleration time history energy, although it has also been used to study the damage patterns and principal direction of seismic excitations (Hong and Goda, 2007; Hong et al., 2009). In this study, the SGMD was assessed based on the Arias intensity, defined as
where a(t) is the acceleration time history, t0 is the total duration of the strong ground motion, and g is the acceleration due to gravity. According to Reinoso and Ordaz (2001), the SGMD for Mexican earthquakes can be obtained based on the duration of the strong ground motion between 2.5 and 97.5% of IA, which is useful for engineering problems. Details about the calculation of the Arias intensity of the records employed are provided by Flores-Mendoza et al. (2022).
4 Structural systems under study
For the numerical analysis, three case-study buildings were considered. One of the buildings is assumed to be located on soft soil of Mexico City, and the other two buildings near the coast of Guerrero and in Puebla on firm soil. Significant effects of the soil–structure interaction have been identified for medium and long period structures located on very soft soils in the valley of Mexico (Avilés and Pérez-Rocha, 1998). The consideration of the soil–structure interaction effects is not an easy task, and it requires an in-depth knowledge of the nonlinear properties of the soft soil, soil settlements, and a very refined numerical analysis. Considering previous development, and as the complete information to characterize the soft soil at the location selected for Mexico City is not available for the authors, as a first approximation and oversimplification, we neglect the effects of soil–structure interaction in this study. Further studies are required to formally evaluate the effects of the soil–structure interaction for RC buildings located in soft soil of Mexico City to evaluate its impact on the structural response. Figure 3A shows the location of the buildings.
4.1 Description of the structures
The reference structures are 12-storey RC buildings. The RC buildings have a rectangular plan 24 m × 18 m. The distance between axes in the X-direction is 6 m with four bays, the distance between axes in the Y-direction is 6 m with three bays, and the interstorey height is 3.50 m. The total height of the RC buildings is 42 m. The dimensions are comparable to those adopted by Esteva et al. (2002).
The buildings were designed in accordance with the Complementary Technical Standards for Earthquake Design (NTCDS, 2017) and the Civil Works Design Manual for Earthquake (MDOC-DS) of the Federal Electricity Commission (CFE, 2015). All the beams were designed using rectangular cross-sections (perimeter and interior beams). The columns were fixed at the base and were characterized by rectangular cross-sections. The general dimensions of the buildings are shown in Figure 4, and Table 2 presents a summary of the dimensions of beams and columns used in each storey for each building. Table 2 indicates that the RC building located in Guerrero is the one with the greatest reinforcement due to its location, and that the RC buildings located in Mexico City (soft soil) and in Puebla presented a similar reinforcement.
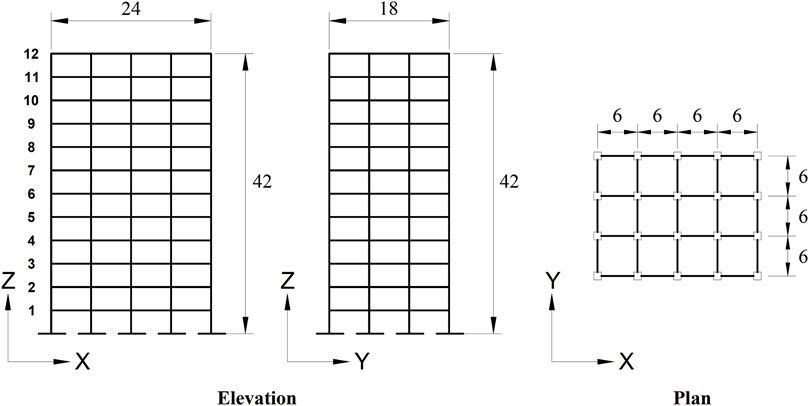
FIGURE 4. General dimensions of the analyzed buildings (units in meters).
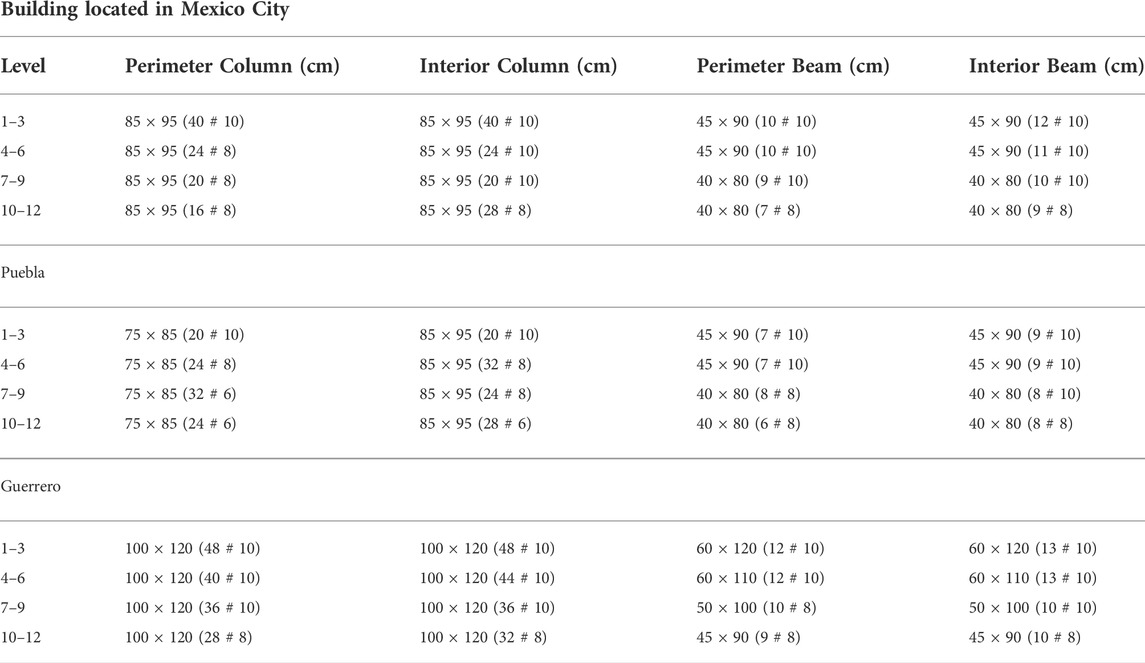
TABLE 2. Dimensions of beams and columns used in each storey for the designed buildings.
4.1.1 Description of the nonlinear viscous dampers and structures fitted with them
The buildings designed with the most recent design regulations (NTCDS, 2017, MDOC-DS [CFE, 2015]) provide adequate structural behavior under the hypotheses of the regulations; however, the cost of repairing possible damage under an extreme seismic event may be higher than anticipated. An alternative to control the response of a structure and increase the amount of energy dissipated is the use of damping devices. In particular, the viscous damper is one of the consolidated auxiliary energy dissipation devices that have been extensively employed in different types of buildings to control the seismic-induced response (De Domenico et al., 2019). In this study, the nonlinear viscous type was used.
The constitutive law that governs the behavior of a NLVD is
where FNLVD is the force of the NLVD; α is the velocity exponent (real positive) with values ranging from 0.35 to 1.0 (Lin and Chopra, 2002); C is the damping coefficient of the NLVD; V is the relative velocity across the NLVD; and
The studied buildings were fitted with NLVD on the perimeter frames, as shown in Figure 5. The arrangement of the NLVD selected was guided by the studies by Kang et al. (2017) and Huseyin et al. (2019).
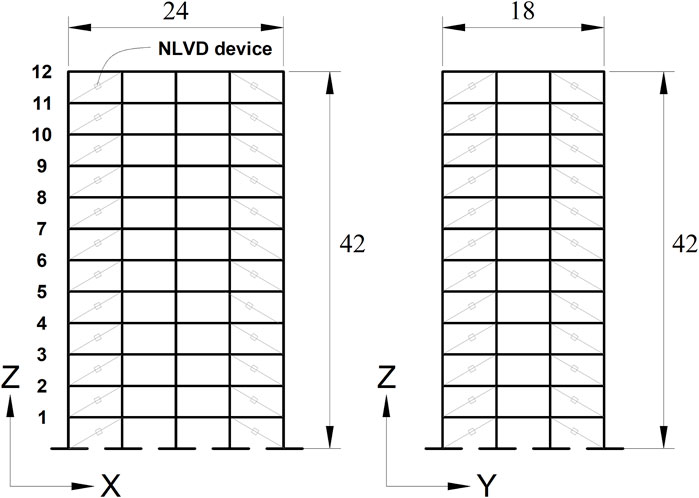
FIGURE 5. Elevation view of the buildings fitted with NLVD (units in meters).
Several methods have been proposed in the literature to identify the optimal properties of different types of passive dampers (Uemura et al., 2021). One of the most popular methods is the genetic algorithm (GA), which is based on the concepts of natural selection and natural genetics (Holland, 1975). In this study, GA are used to identify the optimal properties of NLVD (i.e., C and α) along the height of the buildings. It is noted that GA can also be used to carry out a viscous damper distribution; however, an important increase of the computing time must be anticipated. Thus, in this study, a traditional viscous damper arrangement was adopted (Kang et al., 2017; Huseyin et al., 2019).
To obtain the optimal parameters, the GA proposed by Sastry et al. (2005) was used. Four GA operators were employed: evaluation, selection, crossover, and mutation operators. As the GA results have showed better convergence when they are seeded (Chevallier et al., 2022), the initial C and α values were calculated in accordance with FEMA (1997). The initial properties of the NLVDs were evenly distributed over the height of the building. The encoding of the properties was done in binary code for use with the GA method. The number of individuals considered was 15, each one of the individuals is qualified, and the best of them is selected. This individual is maintained until a better one appears (elitism). While the other individuals enter the crossing process (65%), the mutation (3%) is performed to create new individuals (i.e., new C and α values are created).
5 Analysis procedure and results
5.1 Procedure
The quantification and comparison of the damage costs of RC buildings without and with NLVDs subjected to seismic action is carried out in this section. The steps taken in the calculation of the damage costs of the RC buildings under seismic action are detailed in the following:
(1) Characterize the ductility capacity of the buildings with a push-over analysis
(2) Characterize the seismic action according to the procedure described in Section 3
(3) Evaluate the damage costs according to the costs expressions given in Section 2
(4) Repeat Steps (2) and (3) to evaluate the variation of the damage costs with the seismic action
To carry out the quantification and comparison of the damage costs of the RC buildings with NLVDs, it is considered that the designed RC buildings are fitted with NLVDs, and Steps 2) to 4) are repeated to calculate the damage costs associated with the RC buildings with damping devices installed.
It is noted that due to the adopted simulation approach, a considerable number of simulation cycles is required to probabilistically characterize the seismic hazard and damage states to formally evaluate the LCC of the considered structures; however, since the main objective of the present study is to carry out the quantification and comparison of the damage costs of the RC buildings with NLVDs under simulated earthquake scenarios, the methodology used is considered adequate.
5.2 Analyses results
To evaluate the ductility capacity of each RC building, a push-over analysis was carried out with the program OPENSEES (McKenna et al., 2000). This analysis produced a base shear-displacement (displacement at the top of the building) curve for each building depicted in Figure 6. The solid lines shown in Figure 6 are obtained directly from the program OPENSEES, and the red dotted lines are bilinear curves obtained according to ATC-40, 1996.
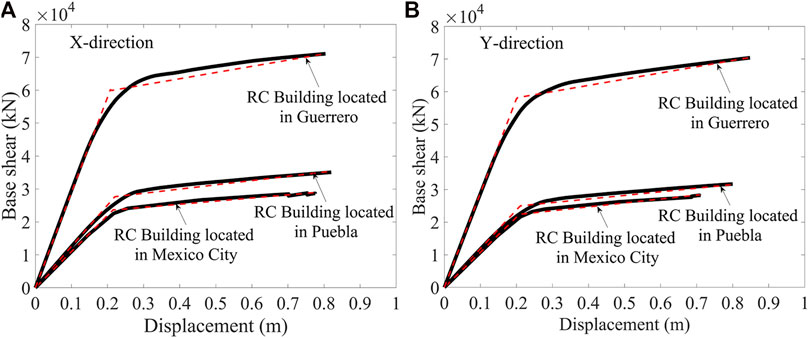
FIGURE 6. Base shear-displacement curves for the RC buildings considered. (A) X-direction. (B) Y-direction.
The global ductility displacement capacities (i.e., μC) of the RC buildings, using the procedure indicated by ATC-40, 1996, were obtained using an incremental lateral thrust to the structure, considering the constant gravitational loads, until collapse; the displacements are defined by a bilinear curve where the elements or structural system are deformed beyond the elastic limit with an acceptable reduction in stiffness and strength. Thus the ductility capacity is defined as
where
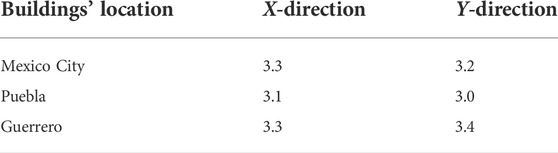
TABLE 3. Calculated global ductility capacity (
The results presented in Table 3 were used in Eq. 6 to characterize the ductility capacity of the RC buildings. Nonlinear dynamic analyses (NLDA) with scaled seismic records (i.e., scaled according to the procedure presented in Section 3) were carried out to calculate the ductility demand (μ). For the NLDA, the OPENSEES program was used. For both type of models (i.e., RC buildings without and with NLVDs), plastic hinges at the element ends were included using the beamWithHinges command. To characterize the nonlinear behavior of the material of the structural elements, the complete concrete model was used. In the case of RC buildings fitted with viscous dampers, the ViscousDamper command was employed. Note that, similar to the calculation of the ductility capacity, the calculated ductility demand was based on the displacement at the top of the buildings. A total of 150 scaled seismic records were used in the NLDA for each direction (i.e., X- and Y-direction).
Based on the calculated μC and μ values, Eqs. 2–6 were employed to calculate the damage costs of RC buildings. Figure 7 presents the damage costs,
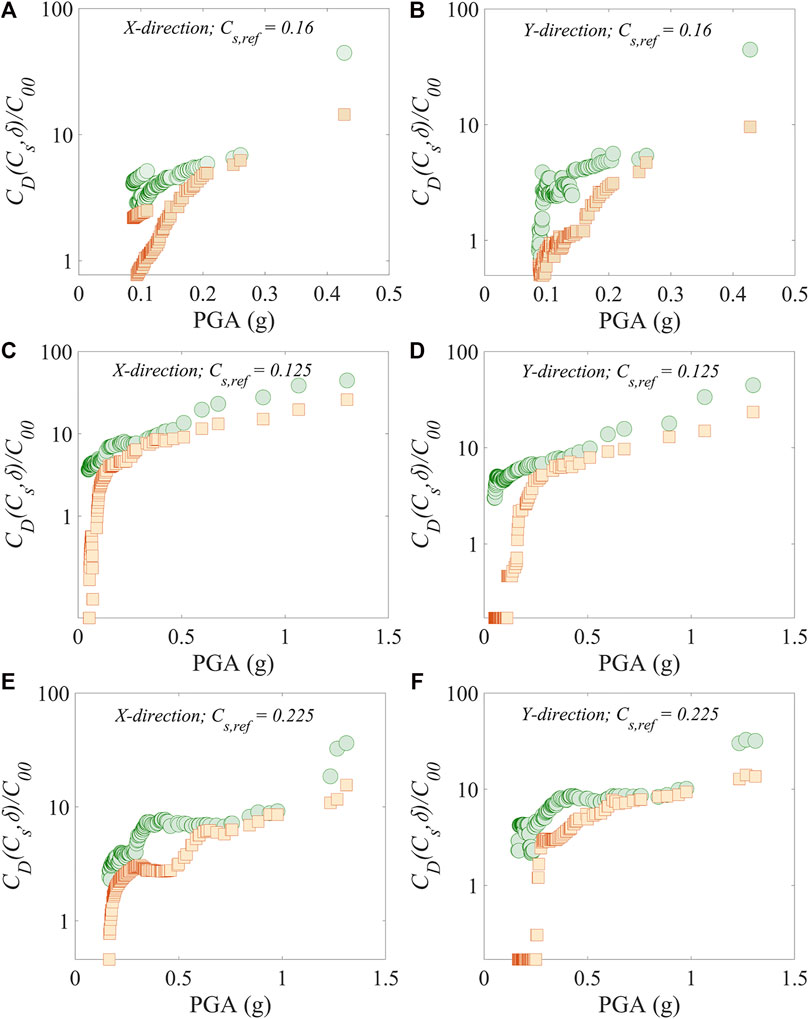
FIGURE 7.
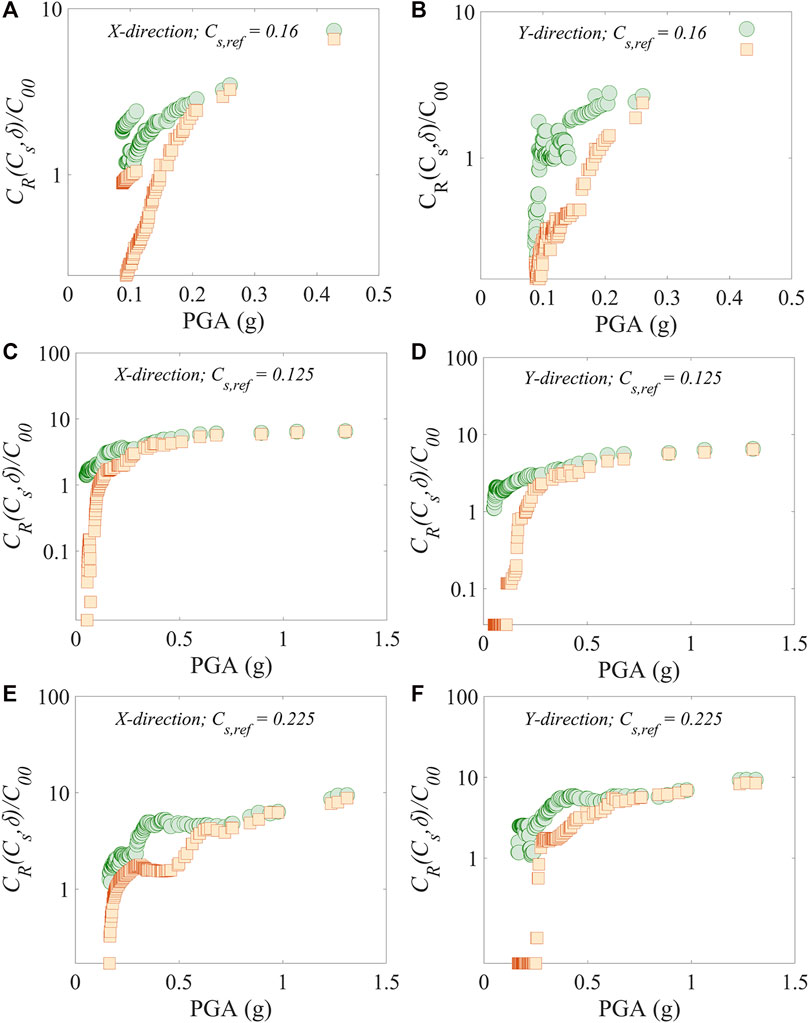
FIGURE 8.
The optimal C and α values, obtained based on the GA approach, employed in the analyses are shown in Table 4. This table shows that the obtained values of C range from 1,361 to 72,888 kN/(m/s)α and α is within 0.35–1.
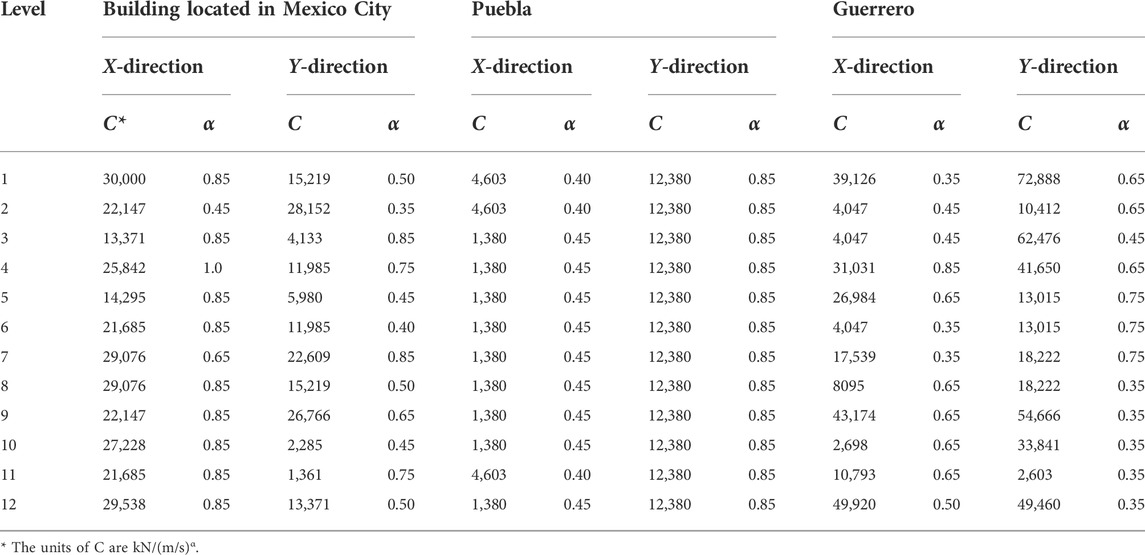
TABLE 4. C and α values obtained with the GA approach.
Figures 7 and 8 show that, as expected,
To further compare the variation of
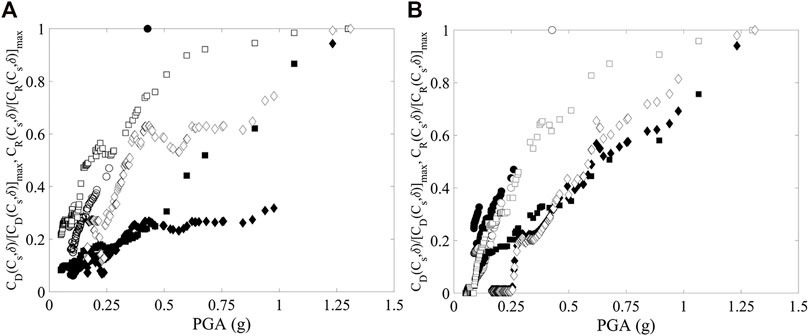
FIGURE 9. Variation of
To evaluate the amount of reduction over the PGA considered, Figure 10 presents the variation of
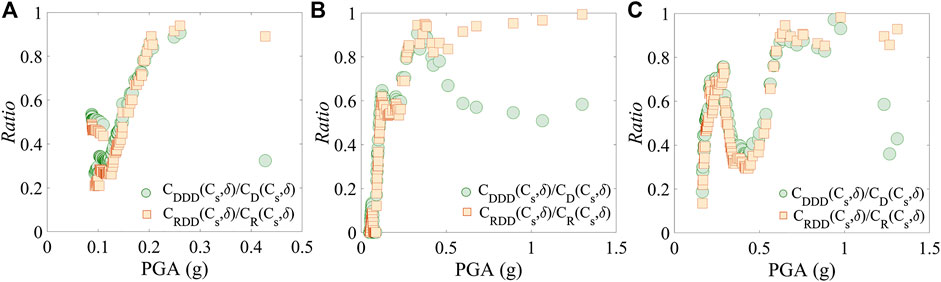
FIGURE 10. Variation of
It was observed in Figure 10 that, in general,
6 Conclusion
In this study, the elements of the optimal seismic design criterion were used to compare the damage costs for three RC buildings with and without NLVDs, located in seismic-prone areas of Mexico. The RC buildings were designed following Mexican seismic design regulations, and the seismic actions were characterized by actual seismic records, which were scaled according to simulated maximum ground motion accelerations. The costs of damage of the considered structures were estimated based on cost expressions that are the function of a damage factor. The results of analyses indicated that the RC buildings fitted with NLVDs subjected to seismic action can reduce considerably the associated damage and repair/reconstruction costs with respect to buildings without NLVDs. More specifically, the following conclusions can be drawn:
(1) In all the considered cases, the use of NLVDs reduces
(2) The ratios of the costs of damage and repair and reconstruction of the RC buildings with NLVDs to those without increase as PGA increases, indicating that the damage and repair and reconstruction costs of the RC buildings fitted with NLVDs increase and reach values similar to the RC buildings without NLVDs.
(3) The soil condition and seismicity have an important impact on the variation of
(4) For RC buildings fitted with NLVDs, the variation of
(5) The ratios of the costs of damage and repair and reconstruction of the RC buildings with NLVDs to those without present sudden drops for moderate and large values of the PGA were considered. These drops are associated with the level of damage (measure though the damage factor δ) reached by the RC buildings with and without NLVDs. As a preliminary observation, these drops in the cost ratios could help as indicators of the range of acceleration where the NLVDs are more effective in terms of costs.
Data availability statement
The raw data supporting the conclusion of this article will be made available by the authors, upon reasonable request.
Author contributions
All authors listed have made a substantial, direct, and intellectual contribution to the work and approved it for publication. AP-E and RF-M: conceptualization, methodology, software, validation, investigation, visualization, writing—review and editing. AP-E and RG: supervision. RF-M: software, data curation. AP-E and RF-M: writing—original draft.
Acknowledgments
The financial support received from the Institute of Engineering of the National Autonomous University of Mexico (UNAM) and the National Council on Science and Technology of Mexico (CONACYT) are gratefully acknowledged.
Conflict of interest
The authors declare that the research was conducted in the absence of any commercial or financial relationships that could be construed as a potential conflict of interest.
Publisher’s note
All claims expressed in this article are solely those of the authors and do not necessarily represent those of their affiliated organizations, or those of the publisher, the editors, and the reviewers. Any product that may be evaluated in this article, or claim that may be made by its manufacturer, is not guaranteed or endorsed by the publisher.
References
Ang, A. H. S., and De Leon, D. (1997). Determination of optimal target reliabilities for design and upgrading of structures. Struct. Saf. 19, 91–103. doi:10.1016/S0167-4730(96)00029-X
Arias, A. (1970). Seismic design for nuclear power plants. MA: MIT Press Cambridge, 438–489.A Measure of earthquake intensity
ATC-40 (1996). “Applied Technology Council,” in Seismic evaluation and retrofit of concrete buildings (San Francisco, California: California), 1. y 2.
Avilés, J., and Pérez-Rocha, L. E. (1998). Site effects and soil-structure interaction in the Valley of Mexico. Soil Dyn. Earthq. Eng. 17, 29–39. doi:10.1016/S0267-7261(97)00027-4
CFE (2015). Manual de diseño de obras civiles: diseño por sismo (MDOC-DS), Ciudad de México. Mexico City, Mexico: Instituto de Investigaciones Eléctricas de la CFE. (In Spanish).
Chevallier, M., Grozavu, N., Boufarès, F., Rogovschi, N., and Clairmont, C. (2022). “Trade between population size and mutation rate for GAAM (genetic algorithm with aggressive mutation) for feature selection,” in Artificial intelligence applications and innovations. AIAI 2022. Editors I. Maglogiannis, L. Iliadis, J. Macintyre, and P. Cortez (Cham: Springer), 646. IFIP Advances in Information and Communication Technology. doi:10.1007/978-3-031-08333-4_35
Cornell, C. A. (1968). Engineering seismic risk analysis. Bull. Seismol. Soc. Am. 58, 1583–1606. doi:10.1785/BSSA0580051583
De Domenico, D., Ricciardi, G., and Takewaki, I. (2019). Design strategies of viscous dampers for seismic protection of building structures: A review. Soil Dyn. Earthq. Eng. 118, 144–165. doi:10.1016/j.soildyn.2018.12.024
Ellingwood, B. R., and Wen, Y. K. (2005). Risk-benefit based design decisions for low probability/high consequence earthquake events in Mid-America. Prog. Struct. Engng. Mat. 7 (2), 56–70. doi:10.1002/pse.191
EM-DAT (2022). The international disaster database. Available at: https://climate-adapt.eea.europa.eu/metadata/portals/em-dat-the-international-disaster-database-year-of-launch May 5, 2022).
Esteva, L. (1968). Bases para la formulación de decisiones de diseño sísmico. México: Tesis doctoral, Universidad Nacional Autónoma de México, Ciudad de México. (In Spanish).
Esteva, L., Diaz-Lopez, O., Garcia-Perez, J., Sierra, E. I., and Ismael, E. (2002). Life-cycle optimization in the establishment of performance-acceptance parameters for seismic design. Struct. Saf. 24, 187–204. doi:10.1016/S0167-4730(02)00024-3
FEMA (1997). “NEHRP Guidelines for the seismic Rehabilitation of buildings,” in Report FEMA 273 (guidelines) and FEMA 274 (commentary). Washington, DC: Federal Emergency Management Agency.
Flores-Mendoza, R., Rodríguez-Alcántara, J., Pozos-Estrada, A., and Gómez, R. (2022). Use of artificial neural networks to predict strong ground motion duration of interplate and inslab Mexican earthquakes for soft and firm soils. Geofis. Int. 61 (3), 153–177. doi:10.22201/igeof.00167169p.2022.61.3.2043
García, D. (2006). Estimación de parámetros del movimiento fuerte del suelo para terremotos interplaca e intraslab en méxico central, tesis doctoral. Madrid, España: Universidad Complutense de Madrid. (In Spanish).
Garcia, D., Shri Krishna, S., Ordaz, M., and Pacheco, J. F. (2005). Inslab earthquakes of central Mexico: Peak ground-motion parameters and response spectra. Bull. Seismol. Soc. Am. 95 (6), 2272–2282. doi:10.1785/0120050072
Goda, K., and Hong, H. P. (2006). Optimal seismic design considering risk attitude, societal tolerable risk level and life quality criterion. J. Struct. Eng. (N. Y. N. Y). 132 (12), 2027–2035. doi:10.1061/(asce)0733-9445(2006)132:12(2027)
Gokhale, V. A., Joshi, R. D., and Abhayankar, A. L. (2004). The psychological and socio economic aspects of earthquake occurrence, 13 WCEE. CANADA.
Goldberg, S., and Kendall, G. (2005). “Genetic algorithms,” in Search methodologies: Introductory tutorials in optimization and decision support techniques. Editors E. G. Burke, and G. Kendall (US, Boston: Springer), 97–125. doi:10.1007/0-387-28356-0_4
Hasofer, A. M. (1974). Design for infrequent overloads. Earthq. Eng. Struct. Dyn. 2, 387–388. doi:10.1002/eqe.4290020408
Holland, J. H. (1975). Adaptation in natural and artificial systems. Ann Arbor, Michigan: University of Michigan Press.
Hong, H. P., and Cui, X. Z. (2020). Time–frequency spectral representation models to simulate nonstationary processes and their use to generate ground motions. J. Eng. Mech. 146 (9), 04020106. doi:10.1061/(ASCE)EM.1943-7889.0001827
Hong, H. P., Goda, K., and Davenport, A. G. (2006). Seismic hazard analysis: a comparative study. Can. J. Civ. Eng. 33 (9), 1156–1171. doi:10.1139/l06-062
Hong, H. P., and Goda, K. (2007). Orientation-dependent ground-motion measure for seismic-hazard assessment. Bull. Seismol. Soc. Am. 97 (5), 1525–1538. doi:10.1785/0120060194
Hong, H. P., and Liu, T. J. (2014). Assessment of coherency for bidirectional horizontal ground motions and its application for simulating records at multiple stations. Bull. Seismol. Soc. Am. 104 (5), 2491–2502. doi:10.1785/0120130241
Hong, H. P., Pozos-Estrada, A., and Gomez, R. (2009). Orientation effect on ground motion measure for Mexican subduction earthquakes. Earthq. Eng. Eng. Vib. 8 (1), 1–16. doi:10.1007/s11803-009-8155-z
Huseyin, C., Ersin, A., and Baki, O. (2019). Optimal design and distribution of viscous dampers for shear building structures under seismic excitations. Front. Built Environ. 5, 90. doi:10.3389/fbuil.2019.00090
Jaimes, T. M., and Reinoso, E. (2006). Comparación del amortiguamiento de edificios en el valle de México ante sismo de subducción y de falla normal. Rev. Ing. sísmica 75, 1–22. Available at: https://www.redalyc.org/articulo.oa?id=61807501.
Kang, L. T., Shin, H. J., and Hui, C. K. (2017). Optimal distribution of damping coefficients for viscous dampers in buildings. Int. J. Str. Stab. Dyn. 17 (04), 1750054. doi:10.1142/S0219455417500547
Kang, Y. J., and Wen, Y. K. (2000). “Minimum lifecycle cost structural design against natural hazards,” in Structural research series No. 629 (Urbana-Champaign, IL: Univ. of Illinois at Urbana-Champaign).
Lin, W.-H., and Chopra, A. K. (2002). Earthquake response of elastic SDF systems with non-linear fluid viscous dampers. Earthq. Eng. Struct. Dyn. 31 (9), 1623–1642. doi:10.1002/eqe.179
Liu, S. C., Dougherty, M. R., and Neghabat, F. (1976). Optimal aseismic design of building and equipment. J. Engrg. Mech. Div. 102, 395–414. doi:10.1061/jmcea3.0002121
Liu, T. J., and Hong, H. P. (2016). Assessment of spatial coherency using tri-directional ground motions. J. Earthq. Eng. 20 (5), 773–794. doi:10.1080/13632469.2015.1104760
Liu, T. J., and Hong, H. P. (2015). Simulation of horizontal ground motions with spatial coherency in two orthogonal horizontal directions. J. Earthq. Eng. 19 (5), 752–769. doi:10.1080/13632469.2014.999175
Liu, T. J., Pozos-Estrada, A., Gomez, R., and Hong, H. P. (2016). Seismic hazard estimation: Directly using observations versus applying seismic hazard model. Nat. Hazards (Dordr). 80 (1), 639–655. doi:10.1007/s11069-015-1988-z
McKenna, F., Fenves, G. L., and Scott, M. H. (2000). Open system for earthquake engineering simulation. Berkeley: University of California. Available at: http://opensees.berkeley.edu.
Micheli, L., Cao, L., Laflamme, S., and Alipour, A. (2020). Life-cycle cost evaluation strategy for high-performance control systems under uncertainties. J. Eng. Mech. 146 (2), 04019134. doi:10.1061/(ASCE)EM.1943-7889.0001711
Newmark, N. M., and Rosenblueth, E. (1971). Fundamentals of earthquake enginnering. Englewood cliffrs, new jersey: Pretince-Hall Inc, 640.
Nishenko, S. P., and Singh, S. K. (1987). Conditional probabilities for the recurrence of large and great interplate earthquakes along the Mexican subduction zone. Bull. Seism. Soc. Am. 77 (6), 2095–2114. doi:10.1785/BSSA0770062095
NTCDS (2017). Normas Técnicas Complementarias para Diseño por Sismo. México: Gobierno de la Ciudad de México.
Ordaz, M., and Reyes, C. (1999). Earthquake hazard in Mexico city: observations versus computations. Bull. Seismol. Soc. Am. 89 (5), 1379–1383. doi:10.1785/BSSA0890051379
Pozos-Estrada, A., Chávez, M. M., Jaimes, M., Arnau, O., and Guerrero, H. (2019). Damages observed in locations of oaxaca due to the tehuantepec Mw8.2 earthquake. Nat. Hazards. doi:10.1007/s11069-019-03662-9
Pozos-Estrada, A., Gómez, R., and Hong, H. P. (2014). Desagregación del peligro sísmico para algunos sitios seleccionados de México. Rev. Ing. Sísmica 91, 31–53. doi:10.18867/RIS.91.178
Pozos-Estrada, A., Liu, T. J., Gómez, R., and Hong, H. P. (2016). Seismic design and importance factor: benefit/cost for overall service time versus per unit service time. Struct. Saf. 58, 40–51. doi:10.1016/J.STRUSAFE.2015.08.005
Rackwitz, R. (2000). Optimization - the basis of code-making and reliability verification. Struct. Saf. 22, 27–60. doi:10.1016/S0167-4730(99)00037-5
Reinoso, E., and Jaimes, M. (2009). Criterios para obtener acelerogramas de diseño en sitios afectados por varias fuentes sísmicas usando como ejemplo el caso de terreno firme de la ciudad de México. Rev. Ing. Sísmica 81, 1. doi:10.18867/ris.81.73
Reinoso, E., and Ordaz, M. (2001). Duration of strong ground motion during Mexican earthquakes in terms of magnitude, distance to the rupture area and dominant site period. Earthq. Eng. Struct. Dyn. 30, 653–673. doi:10.1002/eqe.28
Rosenblueth, E., and Esteva, L. (1972). Reliability basis for some Mexican codes publication, 31. Farmington Hills, Michigan, USA: ACI Special Publication, 1–42.
Rosenblueth, E., and Jara, J. M. (1991). “Constant versus time dependent seismic design coefficients,” in Proceedings of the 3rd IFIP WG 7.5 conference on reliability and optimization of structural systems, 901. Berlin, Germany: Springer-Verlag, 315–327.
Rosenblueth, E., and Mendoza, E. (1971). Reliability optimization in isostatic structures. J. Engrg. Mech. Div. 97, 1625–1642. doi:10.1061/jmcea3.0001521
Rosenblueth, E. (1976). Optimum design for infrequent disturbances. J. Struct. Div. 102, 1807–1825. doi:10.1061/jsdeag.0004431
Rosenblueth, E. (1987). “What should we do with structural reliabilities,” in Proc., ICASP 5, 1 (Waterloo, Canada: Univ. of Waterloo), 24–34.
Santos-Santiago, M. A., Ruiz, S. E., and Cruz-Reyes, L. (2022). Optimal design of buildings under wind and earthquake, considering cumulative damage. J. Build. Eng. 56, 104760. doi:10.1016/j.jobe.2022.104760
Sastry, K., Goldberg, D., and Kendall, G. (2005). Genetic algorithms. Search methodologies. Boston, MA: Springer, 97–125.
Taylor, D. (2022). Seismic dampers and seismic protection products. Available at: http://taylordevices.com/dampers-seismic -protection.html (Accessed June 20, 2022).
Keywords: nonlinear viscous dampers, seismic records, damage costs, repair/reconstruction costs, cost functions
Citation: Flores-Mendoza R, Pozos-Estrada A and Gómez R (2022) Comparative study of the damage cost of reinforced concrete buildings with and without nonlinear viscous dampers subjected to seismic loading. Front. Built Environ. 8:953193. doi: 10.3389/fbuil.2022.953193
Received: 25 May 2022; Accepted: 27 June 2022;
Published: 10 August 2022.
Edited by:
David De Leon, Universidad Autónoma del Estado de México, MexicoCopyright © 2022 Flores-Mendoza, Pozos-Estrada and Gómez. This is an open-access article distributed under the terms of the Creative Commons Attribution License (CC BY). The use, distribution or reproduction in other forums is permitted, provided the original author(s) and the copyright owner(s) are credited and that the original publication in this journal is cited, in accordance with accepted academic practice. No use, distribution or reproduction is permitted which does not comply with these terms.
*Correspondence: A. Pozos-Estrada, QVBvem9zRUBpaW5nZW4udW5hbS5teA==