 Kinda Al Sayed
 Sean Hanna
 Alan Penn
95% of researchers rate our articles as excellent or good
Learn more about the work of our research integrity team to safeguard the quality of each article we publish.
Find out more
ORIGINAL RESEARCH article
Front. Built Environ. , 02 September 2022
Sec. Urban Science
Volume 8 - 2022 | https://doi.org/10.3389/fbuil.2022.949441
In this paper, we argue for the case that cities are self-organised complex systems by presenting evidence on positive and reinforcing feedback mechanisms and robust global trends that characterise historical growth patterns. In two case studies; Manhattan and Barcelona, historical stages of urban growth were mapped and analysed. The analyses revealed regularities that may help define the local and global processes that characterise urban growth marked by alternating periods of expansion and pruning in street networks. The global trend marked by a lognormal distribution of segmental integration (closeness) in street networks was consistently restored following planning interventions. The overall street network growth trend appeared to fit an exponential or power law distribution, along with a linear change in fractal dimension. Underlying these global trends, we found evidence for local positive and reinforcing feedback mechanisms; explained by preferential attachment to well-connected street structures, and pruning of weakly integrated local street structures. The findings are likely to improve our understanding of urban growth.
Instigated by the call to understand cities as matters of organised complexity1 (Jacobs, 1961; Krafta, 1999; Marshall, 2009; Portugali, 2011), many theorisations were made on the type of mechanisms involved in complex adaptive behaviour in cities. Urban complexity emerges as a product of nonlinear interactions between different sets of variable. These interactions display “complex dynamics” once they pass a critical transition from periodic behaviour to chaos (Langton, 1992: 76). Of interest is whether the degree of order that distinguishes urban systems from random systems is a product of top-down planning or else a manifestation of the periodic patterns that cities naturally settle into as a result of the dynamic interactions that occur on the finer scale (de Roo and Rauws, 2012). The patterns that characterise evolution in urban systems might yield that in addition to the elaborative interactions between the constituent elements, there is some targeted quality and quantity that cities are apt to fulfil. These qualities and quantities are what make cities perceivable as objects in themselves and as navigable environments for both inhabitants and strangers alike.
The product of self-organised complex behaviour in cities can be traced in the spatial signature of growth (Netto et al., 2020), and the invariant trends that characterise it. Some of these invariants were investigated in research on self-similarity and fractals (Batty and Longley, 1994; Salingaros, 2003; Lu and Tang, 2004), as well as scaling and allometry (Carvalho and Penn, 2004; Jiang and Claramunt, 2004; Bettencourt et al., 2007; Volchenkov and Blanchard, 2008; Shpuza, 2014). Complexity models of cities are thought to be dependant on initial conditions2 and the actors that are put in use in simulation models (Allen and Sanglier, 1979; Portugali, 2011). A search for plausible evidence to support the assumptions made on urban dynamics is indispensable for any simulation model to be substantiated (Wu, 2002). Recognising this problem, research in urban morphology outlined empirical descriptions of urban growth (Griffiths, 2009; Al Sayed et al., 2012; Strano et al., 2012; Barthelemy et al., 2013; Masucci et al., 2013; Vaughan et al., 2013), including models that distinguished street typologies (Marshall, 2009; Serra et al., 2017), or space syntax representations (Desyllas, 1997; Kubat, 1999; Karimi and Motamed, 2003; Medeiros et al., 2003; Krafta and Fattori, 2005; Haynie and Peponis, 2009; Read, 2011; Psarra and Kickert, 2012; Can et al., 2015; O'Brien and Griffiths, 2017). At the core of the complex behaviour that characterise urban growth, there is what Wilson (2010) and Hillier (2012a) recognised as the “genetic code” of cities. Hillier (2012a) described the “genetic code” as a dual process governed by spatial laws and spatio-functional laws that shape urban patterns and contribute to the creation of economic and social life in cities.
In search for a spatiotemporal explanatory theory on urban growth, we started from the premise that cities exhibit a degree of autonomy inherent in the way they naturally adapt and respond to artificial interventions. This natural order operates from the local to the global to arrive at distinctive patterns and trends that mark the urbanity of city structures. Where natural processes stem from is something implicit to our knowledge. We pronounce terms such as organic, self-organised, sustainable and resilient. For the purpose of understanding self-organisation in cities, we seek empirical evidence in the way urban systems transform in space and time, addressing the following research question; Are there simple local and global mechanisms that explain growth and differentiation in street structures over time?
At the outset of this research, we acknowledge the need to set clear definitions for the research henceforth. To begin with, there is a clear dispute on how to define a city as a geographically recognisable entity. It is - for example- difficult to find a clear definition for compact urban form (Marshall and Gong, 2005), or urban agglomeration; whether to associate such terms with morphological or functional descriptions (Antrop, 2004). For a definition of a city, what we are concerned by is seemingly a physical continuum of urbanisation that could be physically identified. The hypothesis is that; there is a pattern of behaviour that compact urban form3 naturally settles into as it grows. This pattern can be characterised quantitatively. Any disruptive changes on this pattern of growth- induced by mass development of road infrastructure - would be resisted by a process of self-organisation, in which urban systems deform internally to retrieve the properties that characterise compact urban form. The global trends that characterise urban growth could be explained by several models; describing the statistical distributions for closeness centrality, the increase in the system’s overall size (number of street segments) and its fractal dimension, and the distribution of connectivity (degree) values. The latter may prove to fit a power law distribution.
Observing how the fractal dimension and the distribution of street connectivity changes during the period of growth may provide insights on street network dynamics. Street network growth is thought to take place multiplicatively in a correlated self-similar modular pattern due a process of “repulsion (disassortativity)” between highly connected streets or city centres that eventually lead to their dispersion in the urban grid. The assumption is that there is an “evolutionary drive” towards fractality in the complex topology of street networks that leads to an increase in the network robustness. This applies to other types of networks (Song et al., 2006). The “evolutionary drive” is coupled with a process of preferential attachment –similar to that observed in information networks (Barabasi and Albert, 1999)-in which streets that are highly connected are likely to connect to new streets (Jiang and Claramunt, 2004; Volchenkov and Blanchard, 2008). Jiang and Claramunt (2004) discovered that log-log distributions of street connectivity presented non-linear trends that do not fit well with power law distributions. Volchenkov and Blanchard observed that control values (degree of choice) fall into power law distributions. Their findings were compatible with Porta et al. (2006). Growth by means of preferential attachment needs to be associated with a theory on the degeneration of weak local street structures in order to explain the rise of structure in cities (Al Sayed et al., 2012).
These observations could be outlined in a set of hypotheses, that is;
- Street networks are likely to preserve specific properties that admit them to a family of statistical distributions, depending on the indices used for measuring network distance and network size.
- The growth of the system’s size, measured by the number of segments or by the fractal dimension is likely to fit a generic trend despite cultural and geographic specificities of each city.
- These statistical trends that characterise urban systems may go through phases of disruption caused by top-down planning practices. Following the disruptions, the statistical trends will be retrieved through a process of self-organisation.
- Indices of connectivity (degree) of street networks at different stages of growth are likely to fit with scaling law distributions. This scaling property is locally generated by mechanisms of preferential attachment and degeneration, in which new patches of grid structures attach to streets that are highly connected, and patches that are weakly connected to the street network degenerate.
With the scope of identifying the local and global trends that cities display in their growth behaviour, an empirical investigation was held in this paper focusing on two case studies; Barcelona and Manhattan. Historical datasets of street networks were mapped and analysed using space syntax type of representations (Hillier and Hanson, 1984). The values of street network configurations were used to build statistical models of growth. The mapping revealed global trends that characterise the growth of street networks and local positive and reinforcing feedback mechanisms that operate through alternating periods of expansion and degeneration in the urban grid.
Street network maps were manually traced and extracted as a vector layer overlaid on top of a set of historical maps (see Supplementary Appendix A1) that record the history of urban development of Manhattan (United States) and Barcelona4 (Spain). The maps of Manhattan were observed in the years; 1,642, 1,661, 1,695, 1728, 1755, 1767, 1789, 1797, 1808, 1817, 1836, 1842, 1850, 1880, 1920, and 2008. The dates of Barcelona’s maps were; 1,260, 1,290, 1,698, 1714, 1806, 1855, 1891, 1901, 1920, 1943, 1970 and 2008. These two urban regions were chosen because they have both passed through an organic growth process that was interrupted by a large-scale imposition of a regular grid layout in the 1880s. It was therefore possible to delineate organic growth patterns and distinguish patterns of differentiation following planning interventions. The growth of Manhattan’s development extended to Brookline, Bronx and other regions in the vicinity of Manhattan Island in the early 1900s. At this stage, our study was focused on differentiation in the island’s street structure defined by natural geographic boundaries (large water surface areas)5.
Street network maps of Manhattan and Barcelona were drawn manually in such a way as to reduce the complexity of the street layout to the fewest and longest axial6 lines (lines of sight). At each stage of growth, an axial line was drawn preferentially to match the exact coordinates of the axial line in the former stage.
The next two sections will be directed towards understanding and analysing dual historical transformations in the organic and uniform grids of Manhattan and Barcelona7. The assumption is that, the configurations of urban space are the main influential factors in the formation of cities. We assume the presence of invariant features that mark the global and local trends in urban growth.
To compute the configurations of a street network, we calculated network distance using the segment8 representation of Space Syntax (Hillier and Iida, 2005)9. The representation was manually constructed as a vector layer on top of historical map data10. For a more accurate representation, the streets were unlinked where there are multilevel interchanges in the road infrastructure. For each map, Angular Segment Integration (ASI)11 was calculated within local metric radius (R500 m) and global metric radius (R2000m). Of interest, is how values of ASI distribute and change over time. Approximately, radius 500 m equals 6 min walking distance, and radius 2000 m equals 25 min walking distance from each segment element. This metric radius of 2000 m was seen as a sensible choice in Manhattan- as it is smaller than the island’s width in most parts. Angular Segment Integration (ASI) was chosen as it was reported powerful at predicting and postdicting pedestrian movement potentials and economic activity in cities (Hillier et al., 2012b).
Values of axial integration were also calculated to derive measures of intelligibility and synergy of the street network. Axial Integration (AI) represents the centrality closeness of each axial line in relation to all other axial lines that exist within a predefined radius. Radius here is defined topologically as the number of turns made from each axial line; (e.g. radius 2 calculates AI for one axial line in relation to all the axial lines that are within two turns away). Intelligibility is the relationship between local AI and AI Radius n. It is an indicator of how easy it is to navigate a street network system based on its local properties. Synergy is the relationship between different radii of AI, revealing some aspects of the parts-whole structures. Statistical distributions will be outlined for each stage of growth to reveal whether the probability distributions of geometric networks change as the urban system expands.
After obtaining historical map data for Manhattan12, it was possible to map and analyse the growth of the street network. The Axial Integration (AI) and Angular Segment Integration (ASI) values of each historical stage of growth were computed in DepthmapX (Varoudis, 2015), and the statistical distributions of ASI maps were visualised using JMP (SAS/Stat software). In the maps and associated distribution plots, we observed an increase in local (R500 metre) and global ASI (R2000 metre) as the urban system grew (Figure 1). The number of elements retaining high local ASI values (in downtown Manhattan and Washington Heights areas) dropped when the regular grid was imposed. These areas were characterised by organic structures. Overall, there was an increase in ASI values (radius 2000 m) as the system grew. The highest values concentrated in the Lower Manhattan area at the initial stages of growth, spreading in later stages to the midtown area.
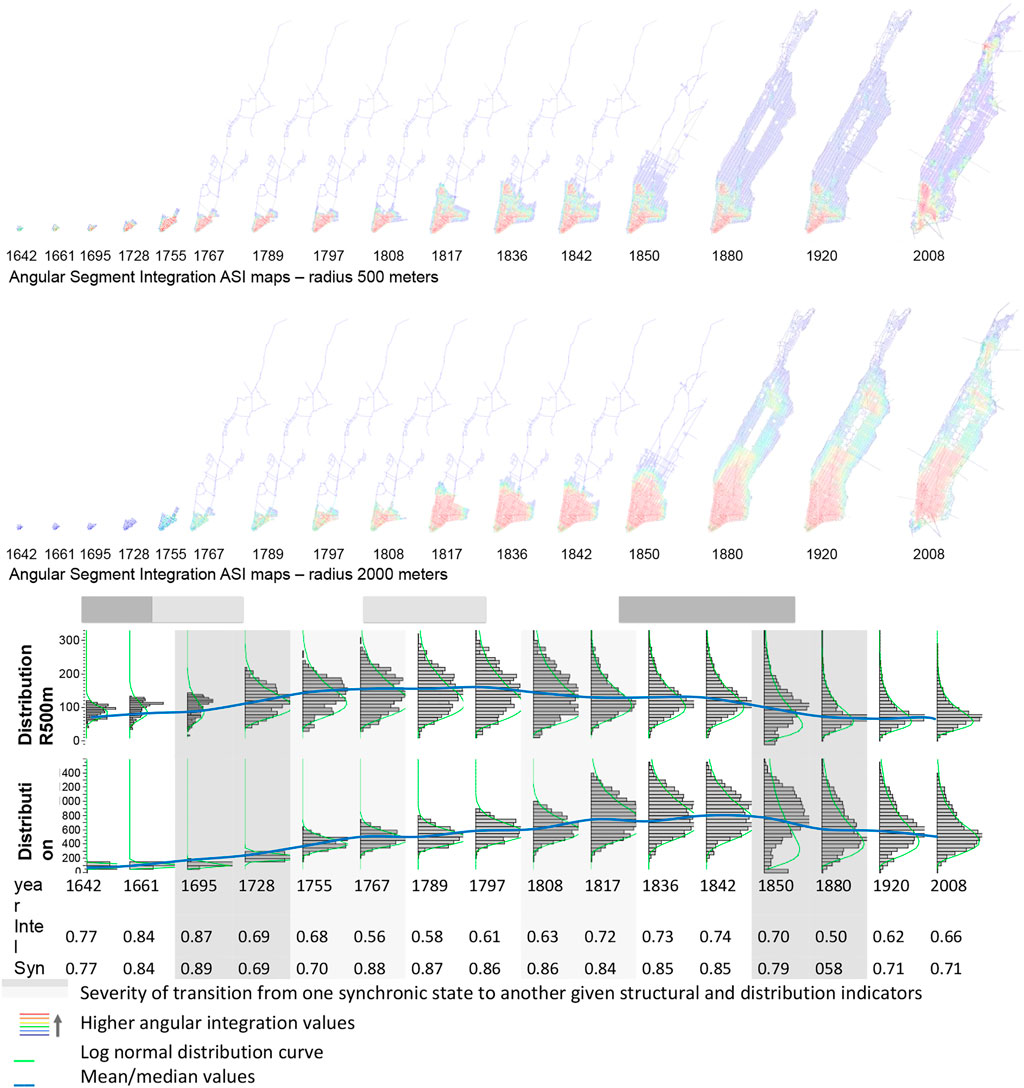
FIGURE 1. Comparing ASI maps (radius 500 and radius 2000 m) and their distribution plots for each stage of growth in Manhattan, including axial Intelligibility R2 (R2, Rn) and axial Synergy R2 (R2, R5) measures.
The local and global ASI values of segment networks proved to fit well into a heavy tailed lognormal distribution in most phases of growth (Figure 1). As the urban system grew, the range of global ASI values was spreading more widely than the range of local ASI values. Local structures preserved their range of values with slight changes on the mean and median values. The peaks of the distribution plots for local ASI sharpened in later phases of growth. This was less evident when rendering global ASI values. The choice of analyses radii influenced the results. The lognormal distributions of local ASI values were sharper than the distributions of global ASI values.
Topological measures of street structures (defined by the correlation coefficients of axial Intelligibility R2 (R2, Rn) and axial Synergy R2 (R2, R5)) were listed below the distribution plots to reflect on how changes on the distribution of geometric measures (defined by the mean, median and skewness) associated a change on the network topology. Changes on intelligibility and synergy values were present in the years (1695–1728), (1755–1767), (1808–1817) and particularly in the years (1850–1880).
The goodness of fit of Intelligibility and Synergy correlation coefficients measured by a Kolmogorov–Smirnov limits (KSL) test13 acted as an indicator to sharp transitions where the D value suddenly dropped to the half. The drop marked an improvement in the degree to which the empirical distribution fits the reference distribution (the lognormal distribution). In most years, the distribution followed a lognormal curve, with the exception of the year 1850. This could be due to the distinctive differentiation between compact urban development in lower Manhattan, and the extended freeway road network in northern Manhattan in 1850. This issue could be an effect of the presence of a large number of stubs with low value of ASI (Hillier et al., 2012b). Stubs could be dead-end streets, extensions of cul-de-sacs, streets at the edge of urban development, or the remaining segments of axial lines that fall outside the interconnected street network. Stubs cannot be removed here as their locations are linked to the past and future states of the street network.
There was no particular rule that associated the rise and drop of Intelligibility and Synergy on the one hand, with changes on the mean and median on the other hand. Generally, the structure of the grid was weakened when exposed to a massive addition of streets within relatively shorter periods of time. After a sudden drop in Intelligibility, the system appeared to retrieve the structural properties it had before. In parallel, the distribution shape settled with no significant changes. These findings indicate to an autonomous process, that is, evident in how street networks preserved patterns of persistence and change. When such patterns were disturbed by an artificial intervention, the system adapted its structure to retrieve its prior distribution patterns.
The analytical attempts to understand the spatial structure of Manhattan pointed to several consistencies in the growth process of the urban region. On both local and global metric radii, ASI values increased as the system grew. The pace of change on the global scale was more rapid than that on the local scale. The latter was less affected at later stages of growth, probably due to the scale of measurement. Where evident, the increase in ASI values seemed to be directional. It started from a set of centres and developed in space and time. Another consistency was evident in how the street network presented sharp changes in Intelligibility and Synergy that appeared to synchronise with changes on the shape of statistical distributions. The sharp transitional stages were often associated with a massive addition of streets, and were characterized by a change on the fitness level of ASI values to a lognormal distribution. These transitional states of the urban network were followed by a period where the urban system adapted back to its prior structural patterns to improve its fitness to a lognormal distribution.
In this section, we present a similar set of analytical investigations to that applied on Manhattan’s case. The scope was to examine whether a different case study would present different trends of persistence and change in the statistical distribution of accessibility values. Similar to Manhattan’s case, the choice of growth phases to be examined was limited to the data available (see appendix 1). Axial maps were drawn manually following the procedure explained in earlier sections. The axial representation was analysed to obtain axial Intelligibility and Synergy. A more refined segmental representation was also used to obtain ASI. Statistical distributions were plotted to display how aggregate properties of the urban system change in time.
The ASI values appeared to plot analogous patterns in Barcelona to those outlined in Manhattan (Figure 2). Similarities appeared where organic or deformed local structures preserved the highest values. Over the period of growth, the old city continued to preserve the highest values of ASI (R 500 m). Equally, emergent suburban town centres in the urban fringe maintained analogous values of local ASI. Similar to Manhattan’s case, ASI maps radius (2000m) rendered how highly integrated centres expand and shift leaving lower values on the peripheries. In Barcelona, higher ASI values shifted from the old city to centre at the heart of the uniform grid. The lines representing major roads in the street network appeared to be particularly integrated connecting all parts of the urban grid with the local old city centre and the suburban town centres. As the spatial system grew and deformed, the distinct features of the two different grid patterns (organic and uniform) faded and a connective structure arose tracing the rural freeways that preceded the uniform grid.
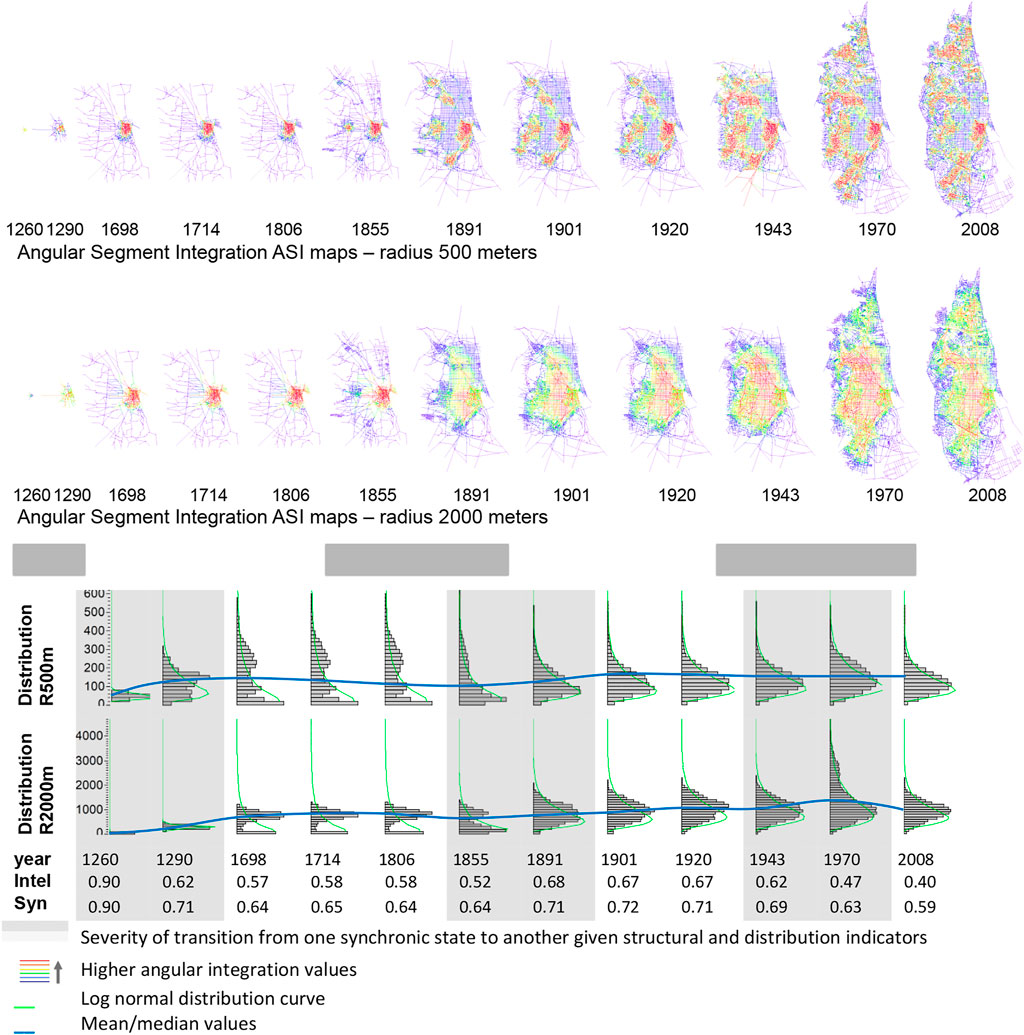
FIGURE 2. Comparing ASI maps (radius 500 and radius 2000 m) and their distribution plots for each stage of growth in Barcelona. In ASI maps, equal colour ranges were used where size was comparable. Measures of axial Intelligibility R2 (R2, Rn) and axial Synergy R2 (R2, R5) were included.
The patterns of aggregate distributions were consistent with our observations in Manhattan. In most stages, the distribution plots for ASI R500 metres and R2000 metres appeared to fit a lognormal curve (Figure 2). The period from 1,698 to 1855 presented a multi modal distribution pattern that does not fit well the lognormal curve. This is due to distinct differences in density, angularity and segment line length between fully urbanised agglomerations around the old city centre and the rural freeway network in the peripheries. This phenomenon may help delineate compact urban form statistically. Distinct transitional periods that characterise transformations in the street network could be recognised when comparing the shapes of statistical distributions. In two cases out of three, we found the distribution of local ASI turning from a relatively unimodal to multimodal. The case is less clear in Manhattan. With that comes also a change on the distribution moments including the median and mean. Intelligibility and Synergy coefficients came as to confirm these transitional periods revealing changes on the level of the structural unity between the parts and the whole. Again, similar to Manhattan’s case; the changes on the structure were associated with a mass addition of streets.
The analyses exposed several particularities that had to do with the inclusion of less urbanised areas in the analysis. Where such differences were clear, they had an impact on the shape of statistical distribution in Barcelona’s case. The impact of stubs on the segment representation and the effect of freeway infrastructure were found to disrupt the overall distribution patterns. This finding may help outline the characteristics of compact urban form; defined by how aggregate ASI configurations of street structures fit into lognormal distributions.
The effect of anomalies on the representation is not likely to dismiss the more prevailing consistencies, particularly in how local centres conserved high local ASI values and in how global ASI spread to central areas as the system grew. Consistencies are also evident in how transitional periods were associated with mass addition of streets and synchronised with changes on the fitness of the lognormal distribution function; where the D value –here describing the goodness of fit- dropped to half or else doubled. This all needs to be considered given different local radii. A radius of 2000m proved to be a stronger indicator of the transitions in the growing street network. The more ASI fits a lognormal distribution, the less likely the system would call for changes. On the contrary, the more erratic are ASI values around the lognormal distribution curve the more likely it is for the system to change. In this way, the system’s inclination to change was strongly related to how good it fits a lognormal distribution function.
The manner that characterised how the urban system settled back into a lognormal distribution after transitional periods is suggestive of an autonomous behaviour that cities exhibit in their growth patterns. Such hypothesis needs to be supported by a more extensive investigation into the local mechanisms that governed growth. Before going for a higher resolution analyses, it is imperative to think about the time dimensionality and how it coupled spatial transitions. In Manhattan, we noted a time factor, or what we might term as a radius of time that associated the radius of space, where local ASI radii maintained a slower pace of change when compared to global ASI radii.
In order to find a model that explains the relationship between street network size, fractal dimension and time (measured in years), we plotted R2 values of linear, exponential, power, logarithmic, and polynomial models, and applied these models on both Barcelona’s and Manhattan’s data (Table 1). The R2 values in Table 1 indicated that street network growth (the increase in the number of street segments per historical stage) could be outlined by exponential trends, where R2 = 0.91 in Manhattan’s case and R2 = 0.90 in Barcelona’s case. A power law distribution appeared to be an alternative model that fits the street network growth data. The relationship between the fractal dimension of each growth stage and the time dimension (years) did not present much variation in terms of R2 values when fitted to all models in Table 1. Our preference was for the linear model for simplicity. The correlation in Manhattan’s case (0.53) was much lower than Barcelona’s R2 value (0.83), indicating that there is little to no relationship between the fractal dimension and the time dimension in Manhattan.
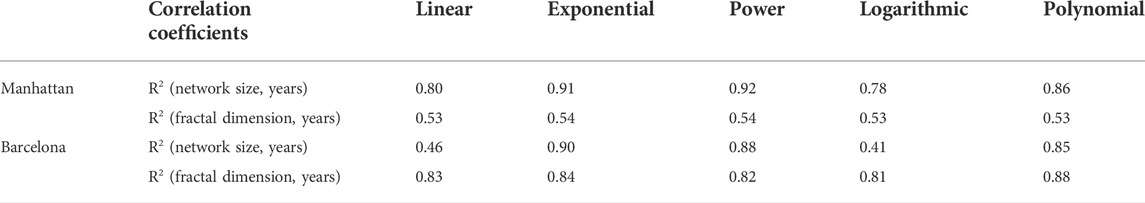
TABLE 1. Fitting street network size and fractal dimension to the time dimension (measured in years) using different models; linear, exponential, power, logarithmic, and polynomial.
The exponential trends of street network growth and the linear trends of the fractal dimension were overlaid in Figure 3. The range of fractal dimension is relative to the image size of the two street structures. The fractal dimension is calculated using the box-counting algorithm (Batty and Longley, 1994; He and El-Dib, 2021; He et al., 2021), by iteratively overlaying boxes with different sizes and calculating the black pixels within (see appendix 2, in the Supplementary Material). The output of this procedure is a regression line. The slope of this regression line is the fractal dimension of the street structure. In Figure 3, the size of the urban network and its fractal dimension are represented as follows; each black dot on the graph represents the number of street segments in a specific year. Each blue dot on the graph represents the fractal dimension of the street network during that particular year.
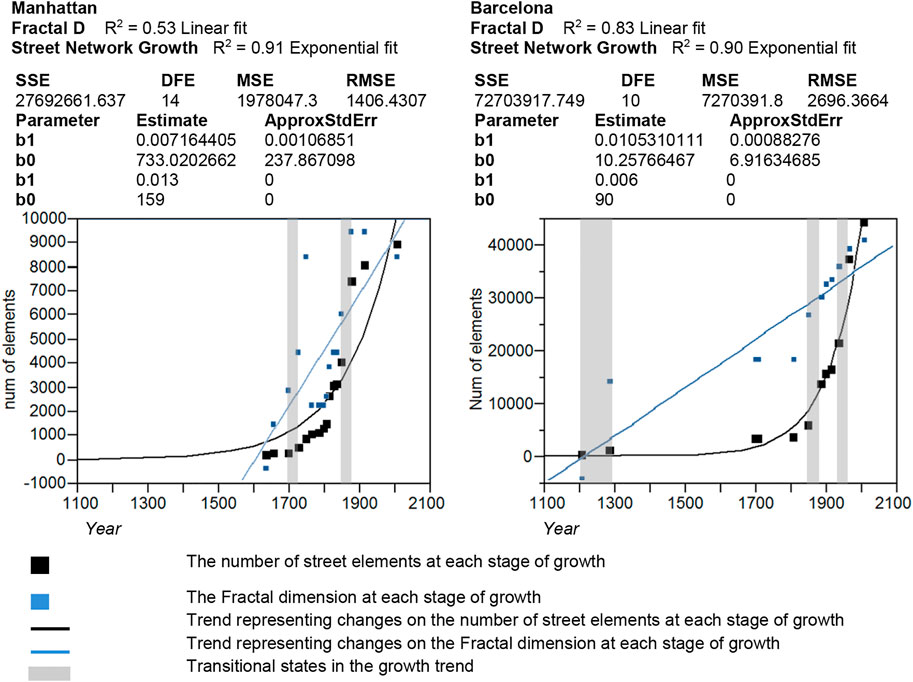
FIGURE 3. A nonlinear exponential growth model and a linear model of fractal dimension for Manhattan and Barcelona marking transitional states corresponding to those outlined in the statistical distributions of ASI values (Figures 1, 2).
The exponential growth parameters recorded different values for the two urban regions. This difference could be reasoned by the system’s sensitive dependence on initial conditions; a phenomenon that characterises complex systems (O'Sullivan, 2004). The growth trends are dependent on the system’s size and shape at the initial stage of growth, the directionality of growth, the geographic boundaries that may restrict growth, and the number of elements added to the system at subsequent stages of growth. These conditions are likely to define the system’s behaviour in the future. Physical boundary limitation –for example- presents a constraint during the last stages of growth diverting the exponential trend in Manhattan to a linear trend that settles at a global maxima. At this point, we were able to distinguish a point of inflection that marked a change on the concavity of the curve. In Barcelona, the addition of new elements continued to follow an exponential trend provided that the structure has not reached its maximum geographical boundaries. On the exponential models, we overlaid the transitional states that were derived from critical changes on the probability distributions of the street structures to expose any correspondences with the generic trends. We noted a remarkable correspondence between these transitions and a sudden rise or fall in the number of elements, along with the grid’s fractal dimension. Such transitions were also traceable in the changes on the overall size of the urban system and in the patterns it rendered.
While both growth trends followed a nonlinear exponential model, they did that with different rates. Manhattan’s exponential growth covered a period of 240 years starting from year0 = 1,640, whereas Barcelona’s growth spanned over a period of 750 years starting from year0 = 1,260. The number of elements (NoE) variable was modelled as a nonlinear function of year. To build the exponential model, a prediction formula was set. The prediction formula included parametric estimates (X0, X1). X0 is the prediction of the number of elements at year 1,240 in Barcelona and year 1,698 in Manhattan. It should be near the value of the number of street segments in the network representation of the historical data. The formula contained the parameters’ initial values. The X1 growth rate parameter was given the initial value of 0.006 for Barcelona, and 0.013 for Manhattan, which would match the estimate of the slope, that is, derived from fitting the natural log of NoE to year with a straight line. The initial values did fit reasonably well with the final parameter estimates of the exponential model. The prediction formula was defined as follows;
X1 = 0.013, X0 = 159 for Manhattan.
X1 = 0.006, X0 = 90 for Barcelona.Where the parameters initial values are;
The nonlinear fitting process was tailored so that the confidence limits14 retained a value for Alpha = 0.05 and the convergence criterion was set to 0.00001. Using this method, solutions were found for a minimised Sum Square Errors (SSE) value. The fitness to an exponential trend appeared to be different for the two urban regions. The mean squared error (MSE) in Manhattan’s growth trend was about 1978047.3 while in Barcelona’s trend MSE approximated 7270391.8. If we were not to include the last stage of growth (year = 2008) in the calculation, the MSE would be reduced by four times for Manhattan. This test highlighted how the growth process was constrained by physical boundaries—that is, the availability of geographic vacant land suitable for development in the vicinity of urban areas. Such constraint is only one of many. For this reason, it is theoretically difficult to find an averaged trend of growth that fits historical data in both cases of urban growth. This is not only made difficult by the sensitive dependence on initial conditions but is also dependant on the circumstances and conditions that direct growth at each time interval and for each localised addition of street segments to the network.
The previous section presented the general trends of growth that outline the yearly increase in the number of street elements in Manhattan and Barcelona. It is yet imperative to consider the artificial and natural factors that may have influenced the rate and scale of growth, and the emergence and disappearance of street structures. Artificial interventions by planners altered the street layout, yet we found a tendency in the urban system to self-organise to conserve the relationship between the parts and the whole. This process builds up from the local to the global to render hierarchies in street structures. It is possible to set forth assumptions on the mechanisms involved in growth and differentiation in urban grids by mapping addition, degeneration, mergence and subdivision in street structures. The two basic processes that govern growth, shrinking or differentiation in cities are based on a positive feedback mechanism that results from the addition of new elements and reinforcing feedback that results from degeneration of weaker street structures (Al Sayed et al., 2012).
It is suggested that in periods of expansion, a positive feedback mechanism operates and takes the form of exponential addition of elements. New street structures are preferentially added where there is a potential increase in the street network accessibility. At each stage of growth the connectivity (degree) of street lines follows power law distributions, a phenomenon, that is, usually observed in scale-free networks.
The observed pattern of historical growth comes as to confirm this finding. In a process that resembles preferential attachment in information networks; the emergence of new patches of grid structures in 18th century Barcelona (Figure 4) appears where there is an increase in the network’s connectivity (degree). The process of preferential attachment in Barcelona did not exactly follow the model initially proposed in (Barabasi and Albert, 1999). In the Barabási-Albert model, nodes that are highly connected (high degree) will have more likelihood to attach to more nodes. The urban preferential attachment process was characterised by the addition of clusters of streets along the nodes (street lines) that are highly connected.
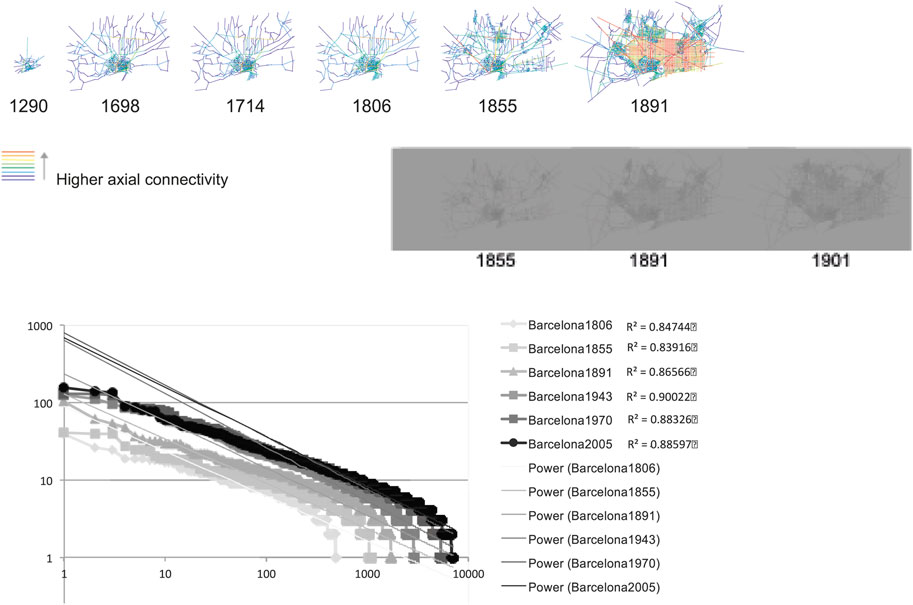
FIGURE 4. Axial connectivity (degree) maps of Barcelona’s growth process, and Log-Log plots of axial connectivity values of axial maps fitted to a Power law distribution.
The Barabási-Albert model will need to be adjusted to fit with the particularities of street networks. Considering the topological axial representation of streets (Figure 4), there seems to be some characteristic patterns that arise from the use of simple network measures such as axial connectivity (degree). These observations were reconstructed from historical map data to trace how the system changed with the addition of new street elements in Barcelona (Al Sayed et al., 2012). The emergence of new grid structures in suburban regions, and more clearly in Gracia (1806-1855) seemed to coincide with high values of axial connectivity. At each stage of growth, the axial connectivity values were closely –but not exactly- fitted with Power law distributions (Figure 4). The trends matched closely the log-log distribution plots of street connectivity observed by Jiang and Claramunt’s (2004). The type of small-world networks that these distributions display matched “single-scale networks”, characterized by a connectivity distribution with a tail that decays exponentially (Amaral et al., 2000). The cutoffs on the power law decay of the tail of axial connectivity distributions are likely to be caused by what Amaral et al. (2000) termed as the ageing of the nodes and the cost of adding new links. The ageing of the nodes may match here the age, density and vitality of economic development that could physically occupy a street. The cost of adding new connections may resemble a limit on the number of axial lines a highly connected axial line can connect to given its relative length and the intensity of the grid structure that neighbours it. Some additional constraints -possibly axial line length- may be applied to distinguish those elements in vacant land. It is important to recognise then that geometry in the spatial networks in cities plays a role in shaping growth patterns, as such there are caveats that need to be considered when applying scale-free laws to model the growth of street networks.
Once the urban system reached its maximum boundary, another process of reinforcing feedback took place, where weakly connected street structures degenerated. This mechanism was evident in Manhattan, where the filling of the central park rendered this exact area as poorly connected (Figure 5). The degeneration of Manhattan’s Central Park region was a product of the physical configurations as well as the historical and economic conditions that led to the decay of this central area. The process of degeneration was less clear in Barcelona, where the filling of the citadel area resulted with a slight increase in local ASI values in the area adjacent to the old city centre. The mechanism of degeneration took place once the urban system reached its maximum natural geographic boundaries and contributed to the demarcation of a structure deforming the homogeneity of the grid. It is important to acknowledge the historical circumstances that led to the formation of a void within a densely occupied urban structure. Ultimately, the abstract physical form of the urban grid is a materialisation of many less easily delineated social and economic conditions that historically shaped urban regions (Griffiths, 2009; Vaughan et al., 2013).
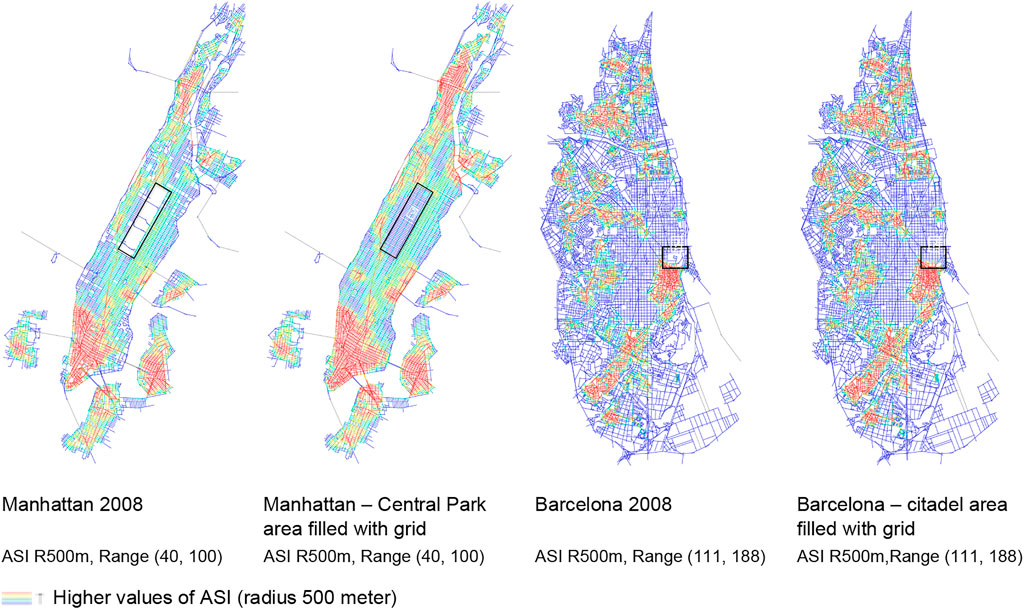
FIGURE 5. A degeneration process marked by the loss of segment elements with low ASI values (radius 500 m) in Manhattan and Barcelona. The models on the right of each map are produced by filling the Central Park void in Manhattan and the Citadel area in Barcelona (both locations marked in black) with a grid structure analogous to its surrounding area.
This paper presented empirical models of street network growth, showing evidence on some of the mechanisms that shaped growth and differentiation in the grid structures of Manhattan and Barcelona. Street network growth seems to follow a simple exponential model. Exponential trends were also marked in population size (Bretagnolle et al., 2002; Pumain et al., 2006). Alongside the exponential trend of growth, there is a linear increase in the fractal dimension, exposing how self-similarity -as a property of complex systems- was conserved during urban growth. The distribution of connectivity (degree) values of the growing street networks fitted a power law distribution with two exponentially decaying tails, admitting street networks to the category of single-scaled networks (Amaral et al., 2000). These trends were thought to reveal some characteristic features of urban dynamics. These patterns emerge as a product of addition, subdivision, mergence and disappearance of street segments. The addition and subdivision processes are thought to follow a preferential attachment model similar to information networks, in that nodes (here axial lines) that are highly connected are more likely to attach to new nodes in subsequent stages of growth. The mergence and disappearance of streets are products of a process of degeneration or pruning, where weak local structures disappear in later stages of growth to reinforce structural differentiation within the urban grid. The positive and reinforcing feedback mechanisms were associated with changes on ASI values in the street network. While integrated centres are preserved, changes seem to travel directionally towards urban voids. Where such processes are interrupted by the addition of grid structures, they seem to revert back to their initial distribution patterns. These interruptions could be recognised as periods of transitions, that could be concurrent to innovation cycles where information, economic and industrial developments pervasively transform urban regions (Pumain et al., 2006). Transitional periods appear to have a destabilisation effect on the structural unity of the system and the aggregate distributions of ASI values characterised by a lower fitness level to a lognormal distribution.
To conclude, it is difficult to generalise the observed growth trends without raising concerns over the specific initial conditions that influence urban growth. The geographic and topological affordances of both regions had clear impact on growth behaviour. In Barcelona, the inclusion of peri-urban areas in the distribution plots distorted the aggregate distribution patterns that would otherwise settle into a lognormal distribution. In Manhattan, the physical boundary constraint was marked as an inflection point on the exponential trend of growth. The change on concavity in the exponential curve could be seen as an indicator for the system’s diversion from growth to differentiation. The differentiation process is augmented by the system’s tendency to react to the imposition of the uniform grid, where weakly integrated local structures degenerate to give rise to a heterogeneous structure.
The findings support the hypothesis about self-organisation in cities, in the way cities adapt back to their original patterns of growth after periods of transition. Both Manhattan and Barcelona appeared to retrieve the characteristics of their macrostate following large-scale planning interventions. To expose the dynamics of growth, there is a need to observe how elements change locally and how they settle into hierarchies. These spatial processes are thought to be driven by the joint forces of economic determinism and historical chance to shape the “historical path dependence” of urban growth (Arthur, 1987). This could be explained by how industries tend to form agglomerations in order to shorten distances and sustain communications.
It must be emphasized here that Manhattan and Barcelona were transformed historically following large scale planning interventions, where artificial grid structures were imposed on vacant land to connect old town centres. Despite these interventions, both cities presented similar statistical trends in their growth patterns, and both cities reinforced natural deformations to differentiate structures amid the homogeneity of an orthogonal grid. The findings yet need to be tested on a broader range of urban regions before any generalisations are made on the type of laws that characterise urban growth.
The original contributions presented in the study are included in the article/Supplementary Material, further inquiries can be directed to the corresponding author.
KA, first and main author. SH, PhD supervisor AP, PhD supervisor.
The authors would like to thank Shinichi Iida who provided the initial digitized maps of Barcelona and Manhattan (2007). The first author wishes to pay tributes to Alasdair Turner for his insights and discussions as the first PhD supervisor, for supervising the first part of this PhD research despite his ill health.
The authors declare that the research was conducted in the absence of any commercial or financial relationships that could be construed as a potential conflict of interest.
All claims expressed in this article are solely those of the authors and do not necessarily represent those of their affiliated organizations, or those of the publisher, the editors and the reviewers. Any product that may be evaluated in this article, or claim that may be made by its manufacturer, is not guaranteed or endorsed by the publisher.
The Supplementary Material for this article can be found online at: https://www.frontiersin.org/articles/10.3389/fbuil.2022.949441/full#supplementary-material
1Complexity theories of cities may be attributed to the study of cities as complex systems; that is, systems that emerge as a result of simple rules and yet exhibit complex behaviour in their patterns of organisation.
2This phenomenon is known as the “sensitive dependence on initial conditions”; where interactions between variables would plot very different paths, given a slight change on the initial state.
3By urban form, we only refer here to street networks.
5The area of Manhattan was defined geographically by the urban region within Manhattan island.
4Barcelona was defined geographically by the urban region that grew along the linear coastline.
6The topological description of street networks might be simply defined as the fewest and longest lines of sight (axial lines) that cover all continuous spaces in an urban region. Each axial line will have a connectivity value (degree); that is, the number of axial lines intersecting with it.
7The historical developments that coupled the formation of the organic grid and the design of the uniform grid in Barcelona are discussed in (Millán Gómez et al., 2013).
8A finer-scale description of streets is the (segment lines); the uninterrupted street interjunctions that link two road intersections (Turner, 2000).
9see research data section in the supplementary material document.
10An example for, that is, where bridges and tunnels connect to the street network.
11Angular Segment Integration ASI is a special measure of angular closeness in the segment network. It is calculated by relating total angular depth in the neighbourhood to the node count (Turner, 2000). ASI was not normalised in this particular case.
12see research data section in the supplementary material document.
13KSL test measures a distance between the empirical distribution function of the ASI values and the cumulative distribution function of the lognormal distribution (Massey, 1951).
14The iterations for confidence limits do not find the profile-likelihood confidence intervals successfully.
Al Sayed, K., Turner, A., and Hanna, S. (2012). “Generative structures in cities,” in Proceedings of the 8th International Space Syntax Symposium, Santiago de Chile, January 3–6, 2012. Editors M. Greene, J. Reyes, and A. Castro (Pontificia Universidad Cat𠃳lica de Chile.
Allen, P. M., and Sanglier, M. (1979). A dynamic model of growth in a central place system. Geogr. Anal. 11, 256–272. doi:10.1111/j.1538-4632.1979.tb00693.x
Amaral, L. A. N., Scala, A., Barthelemy, M., and Stanley, H. E. (2000). Classes of small-world networks. Proc. Natl. Acad. Sci. U. S. A. 97 (21), 11149–11152. doi:10.1073/pnas.200327197
Antrop, M. (2004). Landscape change and the urbanization process in Europe. Landsc. urban Plan. 67 (1-4), 9–26. doi:10.1016/s0169-2046(03)00026-4
Arthur, W. B. (1987). “Urban systems and historical path dependence,” in Cities and their vital systems. Editors J. H. Ausubel,, and R. Herman (Washington DC: National Academy Press), 85–97.
Barabasi, A.-L., and Albert, R. (1999). Emergence of scaling in random networks. Science 286 (5439), 509–512. doi:10.1126/science.286.5439.509
Barthelemy, M., Bordin, P., Berestycki, H., and Gribaudi, M. (2013). Self-organization versus top-down planning in the evolution of a city. Sci. Rep. 3, 2153. doi:10.1038/srep02153
Batty, M., and Longley, P. A. (1994). Fractal cities: A geometry of form and function. London: Academic Press.
Bettencourt, L. M., Lobo, J., Helbing, D., Kuhnert, C., and West, G. B. (2007). Growth, innovation, scaling and the pace of life in cities. Proc. Natl. Acad. Sci. U. S. A. 17, 7301–7306. doi:10.1073/pnas.0610172104
Bretagnolle, A., Paulus, F., and Pumain, D. (2002). Time and space scales for measuring urban growth (Cybergeo: European Journal of Geography).
Can, I., İnce, İ., and Yamu, C. (2015). “The rationale behind growth patterns: Socio-spatial configuration of Izmir, Turkey 1700s–2010,” in SSS 2015-10th International Space Syntax Symposium (London: Space Syntax Laboratory, The Bartlett School of Architecture.
Carvalho, R., and Penn, A. (2004). Scaling and universality in the micro-structure of urban space. Phys. A Stat. Mech. its Appl. 332, 539–547. doi:10.1016/j.physa.2003.10.024
de Roo, G., and Rauws, W. S. (2012). “Positioning planning in the world of order, chaos and complexity: On perspectives, behaviour and interventions in a non-linear environment,” in Complexity theories of cities have come of age (Berlin, Heidelberg: Springer), 207–220.
Desyllas, J. (1997). “Berlin in transition,” in Proceedings of the 1st International Space Syntax Symposium (London: University College London).
Griffiths, S. (2009) Persistence and change in the spatio-temporal description of Sheffield Parish c.1750-1905. In Proceedings of the 7th International Space Syntax Symposium. In: D. Koch, L. Marcus, and J. Steen (eds.). Royal Institute of Technology KTH: Stockholm, Sweden. (pp. p. 37).
Haynie, S. D., and Peponis, J. (2009). “Atlanta: A morphological history,” in Proceedings of the 7th International Space Syntax Symposium. Editors D. Koch, L. Marcus, and J. Steen (Stockholm: KHT).
He, C. H., Liu, C., He, J. H., Mohammad-Sedighi, H., Shokri, A., and Gepreel, K. A. (2021). A fractal model for the internal temperature response of a porous concrete. Appl. Comput. Math. 20 (2), 71–77. doi:10.30546/1683-6154.21.1.2022.71
He, J. H., and El-Dib, Y. O. (2021). A tutorial introduction to the two-scale fractal calculus and its application to the fractal zhiber-shabat oscillator. Fractals 29 (08), 1–9. doi:10.1142/s0218348x21502686
Hillier, B., and Hanson, J. (1984). The social logic of space. Cambridge: Cambridge University Press.
Hillier, B., and Iida, S. (2005). “Network and psychological effects in urban movement,” in International Conference on Spatial Information Theory (Berlin Heidelberg: Springer), 475–490.
Hillier, B. (2012a). “The genetic code for cities: Is it simpler than we think?” in Complexity theories of cities have come of age (Berlin, Heidelberg: Springer), 129–152.
Hillier, W. R. G., Yang, T., and Turner, A. (2012b). Normalising least angle choice in Depthmap-and how it opens up new perspectives on the global and local analysis of city space. J. Space syntax 3 (2), 155–193.
Jacobs, J. (1961). Death and life of great American cities – the failure of town planning. Harmondsworth: Penguin Books.
Jiang, B., and Claramunt, C. (2004). Topological analysis of urban street networks. Environ. Plann. B. Plann. Des. 31 (1), 151–162. doi:10.1068/b306
Karimi, K., and Motamed, N. (2003). “The tale of two cities: Urban planning of the city Isfahan in the past and present,” in Proceedings of the 4th International Space Syntax Symposium, 1, 14.
Krafta, R., and Fattori, R. (2005). “Syntactic evolution of cities,” in V International Symposium on Space Syntax. Editor Akkelies Van Nes (Delft).
Krafta, R. (1999). Spatial self-organization and the production of the city. Paris: Cybergeo: European Journal of GeographyDossiers, 1–22.
Kubat, A. S. (1999). The morphological history of Istanbul. Urban Morphology. J. Int. Seminar Urban Form 3 (1), 28–44.
Lu, Y., and Tang, J. (2004). Fractal dimension of a transportation network and its relationship with urban growth: A study of the dallas-fort worth area. Environ. Plann. B. Plann. Des. 31 (6), 895–911. doi:10.1068/b3163
Marshall, S., and Gong, Y. (2005). “Urban pattern specification,” in Institute of community studies, London paper presented at solutions symposium (Cambridge.
Massey, F. J. (1951). The Kolmogorov-Smirnov test for goodness of fit. J. Am. Stat. Assoc. 46 (253), 68–78. doi:10.1080/01621459.1951.10500769
Masucci, A. P., Stanilov, K., and Batty, M. (2013). Limited urban growth: London’s street network dynamics since the 18th century. PLoS One 8 (8), e69469. doi:10.1371/journal.pone.0069469
Medeiros, V., Holanda, F., and Trigueiro, E. (2003). “From compact colonial villages to sparse metropolis,” in Proceedings of the 4th International Space Syntax Symposium (London: UCL), 12.
Millán Gómez, A., Jiménez Rivera, M., Latre Cabrera, J. A., and Díaz-Asensio García, V. (2013). “Turning barriers into alleyways: Unsolved transitions from old Barcelona to the post-cerdà city,” in Proceedings of the Ninth International Space Syntax Symposium. Editor Y. O. Kim, H. T. Park, and K. W. Seo (Seoul: Sejong University), 41.
Netto, V. M., Meirelles, J., and Ribeiro, F. L. (2020). Cities and entropy: assessing urban sustainability as a problem of coordination. Sustainability assessment of urban systems. In Editor C. Binder, R. Wyss, and E. Massaro (Cambridge: Cambridge University Press), 438–459.
O'Brien, J. A., and Griffiths, S. (2017). “Relating urban morphologies to movement potentials over time: A diachronic study with space syntax of liverpool, UK,” in Proceedings of the 11th Space Syntax Symposium (Lisbon: Instituto Superior Técnico), 11, 98.
O'Sullivan, D. (2004). Complexity science and human geography. Trans. Inst. Br. Geog. 29 (3), 282–295. doi:10.1111/j.0020-2754.2004.00321.x
Porta, S., Crucitti, P., and Latora, V. (2006). The network analysis of urban streets: A dual approach. Phys. A Stat. Mech. its Appl. 369 (2), 853–866. doi:10.1016/j.physa.2005.12.063
Portugali, J. (2011). “Complexity theories of cities (CTC),” in Complexity, cognition and the city (Berlin Heidelberg: Springer), 53–94.
Psarra, S., and Kickert, C. (2012). “Detroit: The fall of the public realm: The street network and its social and economic dimensions from 1796 to the present,” in Proceedings: Eighth International Space Syntax Symposium (Santiago: PUC).
Pumain, D., Paulus, F., Vacchiani-Marcuzzo, C., and Lobo, J. (2006). An evolutionary theory for interpreting urban scaling laws. Cybergeo: European Journal of Geography.
Read, S. (2011). History, structure and technique: A reply to batty and another challenge to space syntax. J. Space Syntax 2 (1), 120–124.
Salingaros, N. A. (2003). “Connecting the fractal city,” in Keynote speech, 5th Biennial of town planners in Europe (Barcelona.
Serra, M., Gil, J., and Pinho, P. (2017). Towards an understanding of morphogenesis in metropolitan street-networks. Environ. Plan. B Urban Anal. City Sci. 44 (2), 272–293. doi:10.1177/0265813516684136
Shpuza, E. (2014). Allometry in the syntax of street networks: Evolution of adriatic and ionian coastal cities 1800–2010. Environ. Plann. B. Plann. Des. 41 (3), 450–471. doi:10.1068/b39109
Song, C., Havlin, S., and Makse, H. A. (2006). Origins of fractality in the growth of complex networks. Nat. Phys. 2 (4), 275–281. doi:10.1038/nphys266
Strano, E., Nicosia, V., Latora, V., Porta, S., and Barthélemy, M. (2012). Elementary processes governing the evolution of road networks. Sci. Rep. 2, 296. doi:10.1038/srep00296
Turner, A. (2000). Angular analysis: A method for the quantification of space. London: Centre for Advanced Spatial Analysis, UCL. Working Paper 23.
Varoudis, T. (2015). DepthmapX: Spatial network analysis software, version DepthmapX 0.50. London: University College London, Space Syntax Laboratory.
Vaughan, L. S., Dhanani, A., and Griffiths, S. (2013). Beyond the suburban high street cliché - a study of adaptation to change in london’s street network: 1880-2013. J. Space Syntax 4 (2), 221–241.
Volchenkov, D., and Blanchard, P. (2008). Scaling and universality in city space syntax: Between Zipf and Matthew. Phys. A Stat. Mech. its Appl. 387 (10), 2353–2364. doi:10.1016/j.physa.2007.11.049
Wilson, A. (2010). Urban and regional dynamics from the global to the local: Hierarchies. ‘DNA’, and ‘genetic’ planning. Environ. Plann. B. Plann. Des. 37 (5), 823–837. doi:10.1068/b36141
Keywords: urban growth, street networks, preferential attachment, space syntax, fractal model
Citation: Al Sayed K, Hanna S and Penn A (2022) Urban growth: Modelling street network growth in Manhattan (1642–2008) and Barcelona (1260–2008). Front. Built Environ. 8:949441. doi: 10.3389/fbuil.2022.949441
Received: 20 May 2022; Accepted: 12 August 2022;
Published: 02 September 2022.
Edited by:
Yao Shen, Tongji University, ChinaCopyright © 2022 Al Sayed, Hanna and Penn. This is an open-access article distributed under the terms of the Creative Commons Attribution License (CC BY). The use, distribution or reproduction in other forums is permitted, provided the original author(s) and the copyright owner(s) are credited and that the original publication in this journal is cited, in accordance with accepted academic practice. No use, distribution or reproduction is permitted which does not comply with these terms.
*Correspondence: Kinda Al Sayed, a2luZGFhbHNheWVkQGN1bmV0LmNhcmxldG9uLmNh
Disclaimer: All claims expressed in this article are solely those of the authors and do not necessarily represent those of their affiliated organizations, or those of the publisher, the editors and the reviewers. Any product that may be evaluated in this article or claim that may be made by its manufacturer is not guaranteed or endorsed by the publisher.
Research integrity at Frontiers
Learn more about the work of our research integrity team to safeguard the quality of each article we publish.