 Nadezhda Morozova
 Kazuma Shibano
 Yuma Shimamoto
 Sena Tayfur
 Ninel Alver
 Tetsuya Suzuki
- 1Graduate School of Science and Technology, Niigata University, Niigata, Japan
- 2Institute of Agriculture, Tokyo University of Agriculture and Technology, Tokyo, Japan
- 3Department of Civil Engineering, Ege University, Izmir, Turkey
- 4Faculty of Agriculture, Niigata University, Niigata, Japan
The durability of concrete irrigation infrastructures decreases easily due to environmental effects, such as the freeze-thawed process. The degree of damage in concrete is, in most cases, evaluated by an unconfined compression test or ultrasonic test. The limiting states of structures are the result of a gradual accumulation of microdefects during the in-service period, which leads to the initiation and development of macroscopic cracks, loss of performance, and Failure. Therefore, to maintain such structures, it is necessary to properly determine the degree of damage by non-destructive testing. For effective maintenance and management of in-service structures, it is necessary to evaluate not only such mechanical properties as strength but also the degree of damage. Quantitative damage evaluation of concrete is proposed by applying the X-ray CT method and related non-destructive inspection, which is based on estimating cracking damage effects. In this study, the damage evaluation of concrete-core samples is investigated by X-ray CT parameters and the non-destructive parameters. The samples tested were taken from the damaged concrete headwork in Niigata, Japan, about 50 years after its construction. The geometric properties of the concrete matrix were calculated by the analysis of X-ray CT images. After X-ray CT measurement, an ultrasonic test and a resonant frequency test were performed. The dynamic modulus of elasticity was calculated by using ultrasonic pulse velocity and resonant frequency. As a result, based on the relationship between the geometric properties of the concrete matrix and the non-destructive parameters, the accumulation of damage in the samples tested was correlated with the ratio of the total area of cracks to the observation area. In damaged conditions, the high value of its ratio is demonstrated under low ultrasonic pulse velocity. These results suggest that the most sensitive components in a concrete body to the degree of damage are cracks in mortar and the ratio of the total area of cracks to the observation area. These values are affected by the internal actual cracks. Thus, the damage of concrete could be quantitatively evaluated by the geometric properties of the concrete matrix and its physical properties.
1 Introduction
During the operation of structures, changes in their conditions may take place, which results in decrease in their bearing capacities due to various damages and environmental effects. When a structure achieves a certain degree of reliability, irreversible damage will be observed in it leading to the failure of the structure and its subsequent collapse. A large number of concrete structures have been built in Japan since the 1950s (Uomoto, 2000). They have been in use for about 70 years which may suggest existing damage conditions. Moreover, Japan is one of the most exposed to natural hazard risk regions: a huge part of facilities deterioration is caused by floods (Shuto and Fujima, 2009), earthquakes (Kazama and Noda, 2012), freeze-thawing processes (Japan Concrete Institute C65, 2005), etc. Therefore, there is a necessity of maintaining such structures by monitoring their condition and predicting the future damage progresses (Mori and Ellingwood, 1994). Accordingly, damage evaluation approaches for diagnostic inspection are in high demand in concrete engineering.
The damage degree of concrete structures, in most cases, is assessed by the trend of reducing the strength of concrete (Loland, 1980). But to precisely assess concrete damage, it is necessary to evaluate not only its mechanical properties but also the damage degree of the structure. The quantitative evaluation of damage can be based on the analysis of the cracking parameters which influence the effective area of the material (Kachanov, 1986). At this point, non-destructive testing (NDT) is an appropriate way to carry out a detailed inspection of a concrete structure (Helal et al., 2015). There are various NDT methods which are subdivided depending on parameters such as the type of structure, its shape, evaluation target, and result accuracy (Kroworz and Katunin, 2018). Moreover, the innovative adoption of Artificial Neural Network (ANN) approaches in the damage assessment field allows the reconstruction of a mathematical model of the appropriate structure and then it uses that model to predict mechanical properties and elucidate the structural behavior (Bonagura and Nobile, 2021). Visual inspection, X-ray computed tomography (CT), ultrasonic pulse velocity (UPV), resonant frequency, and acoustic emission (AE) are standard and the most useable NDT techniques in this field. In the last decades, the X-ray CT method has been used widely in concrete structure inspection (Kong et al., 2020). The obvious advantage of this method is the ability to describe the inner mass of the material with a high-resolution visualization of particles belonging to different phases such as aggregates, pores, and cracks (Parisatto et al., 2015; Dong et al., 2017; Lu et al., 2017). The X-ray CT is also a useful tool for in-depth analysis providing an understanding of the 3D fracture mechanisms and mechanical properties of the concrete (Yang et al., 2017; Chung et al., 2019). Besides, this technique is actively applied to evaluate the condition of the structure which was affected by negative environmental factors (Tian and Han, 2016; Shields et al., 2018). Some studies use the combination of the X-ray CT with AE technique for quantitative estimation of concrete damage because AE generating behavior is closely associated with the formation process of microcracks in concrete (Ohtsu, 1987; Yamagishi and Suzuki, 2015; Suzuki and Shimamoto, 2017; Alver et al., 2017; Tayfur et al., 2018; Tayfur and Alver, 2019). The following works (Suzuki et al., 2010; Suzuki and Ohtsu, 2014; Karcili et al., 2016; Suzuki et al., 2020) include the specially developed method for quantitative damage evaluation which is based on estimating the intact modulus of elasticity of concrete. By authors of the works (Suzuki and Ohtsu, 2016; Suzuki and Shimamoto, 2019), it was determined that the dynamic modulus of elasticity is the most useful parameter for damage evaluation of concrete because it is correlated with inner damage of the material. The dynamic parameter of the concrete can be measured in two non-destructive ways (Eiras et al., 2014). The first method is based on the ultrasonic pulse velocity measurement (Naik et al., 2004) and the second technique is based on the resonant vibration test (Malhorta and Sivansudaran, 2004). Both these methods refer to elastic wave methods which are based on stress wave propagation in the solids (Ohtsu, 2016).
In this study, damage evaluation of concrete core samples is investigated by applying NDT parameters. The samples were taken from an in‐service reinforced concrete structure, which has been subjected to the influence of aggressive environmental effects. Then, X-ray CT procedure was conducted on the specimens to detect and visualize the crack distributions After scanning, concrete damage was evaluated by the dynamic modulus of elasticity measured by UPV and resonant frequency tests. Results indicate that the decrease in mechanical properties of the concrete could be evaluated by comparing the geometrical properties of cracks with the dynamic modulus of elasticity, because both these parameters are affected by the internal actual cracks, thus, the damage of concrete could be quantitatively evaluated.
2 Materials and methods
2.1 Concrete specimens
Cylindrical concrete samples of 10 cm in diameter and the range of height between 35 mm and 280 mm were drilled out from the damaged drainage headworks (Shinkawa drainage station), which were constructed after about 50 years ago in Niigata, Japan (see Figure 1). This structure was selected for this study since crack progress in concrete was severe. These extremely advanced damages were reported to be frost damage affected by cold climate environments (Shimamoto et al., 2022). After the drill out from the in-service structure, restrictions on the range of the testing samples were imposed due to their various heights. Accordingly, the optimal range was established at 150-213 mm. In addition, samples with reinforcing bars were also excluded from the analyzes. Considering all these limitations, totally 12 specimens were used for the study.
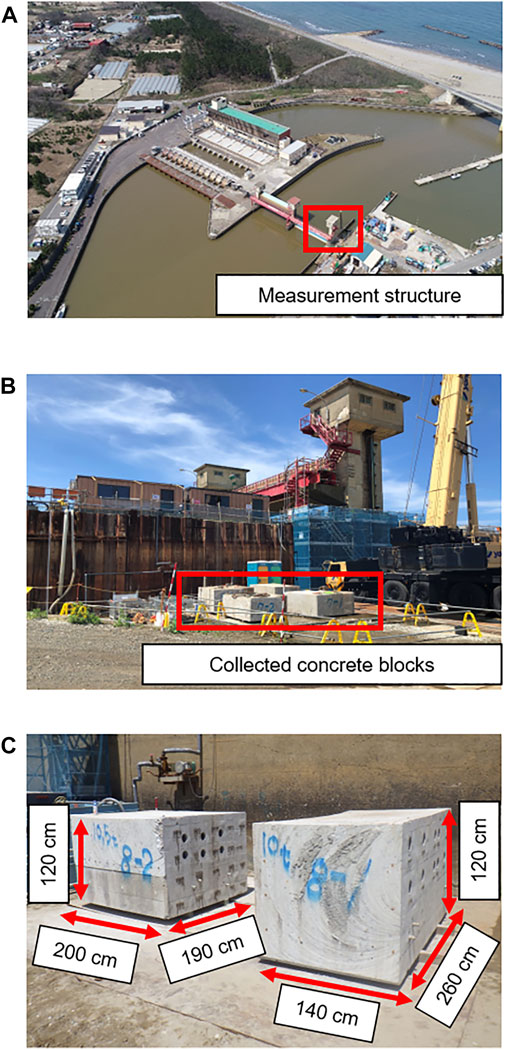
FIGURE 1. Shinkawa drainage headworks structure. (A) General view of the facility. (B) Overview of collected concrete blocks. (C) Sampling site (concrete blocks).
2.2 Visualization of concrete characteristics by the X-ray CT method
The most common form of concrete damage is associated with cracking. In this study, X-ray CT technique was utilized for visualization and quantification of damage of the concrete specimens which has been used widely in different materials analysis for a few years. Moreover, in the material field, this non-destructive method was improved from a qualitative imaging tool to a quantitative analysis method (Maire and Withers, 2014). Applying X-ray CT helps to predict material properties, to investigate structure-property relationships and to obtain new insights into material behavior (du Plessis and Boshoff, 2019). This technique visualizes a virtual reconstruction of the inner mass distribution of an object. The generated cross-sectional slices consist of a matrix of voxels which are based on the quantification of detected CT numbers obtained in Hounsfield Units (HU) and represent the mean X-ray absorption. The CT numbers vary according to the properties of the material, generally adjusted to −1000 for air and 0.0 for water.
The X-ray CT results presented in this article were collected on the helical CT scans Aquilion ONE (TSX-301C/6A) (manufactured by TOSHIBA) at the Animal Medical Center, Nihon University. The characteristics of the machine and measurement condition are represented in Table 1. To ensure the exact location of the samples, a laser positioning device was used (see Figure 2A). The result of X-ray CT scanning is the series of cross-sectional grayscale images where air appears as a white area and the densest parts in the image appear as a dark area (see Figure 2B). Detected X-ray CT images were scanned constantly at 0.5 mm pitch overlapping. A total of 200–500 2D images were obtained from each specimen depending on the specimen length. The X-ray slice data are acquired in the DICOM (Digital Imaging in Communications and Medicine) format. These 2D slices can be assembled to provide a 3D reconstruction of the concrete core specimens.

TABLE 1. Settings used for helical CT scan.
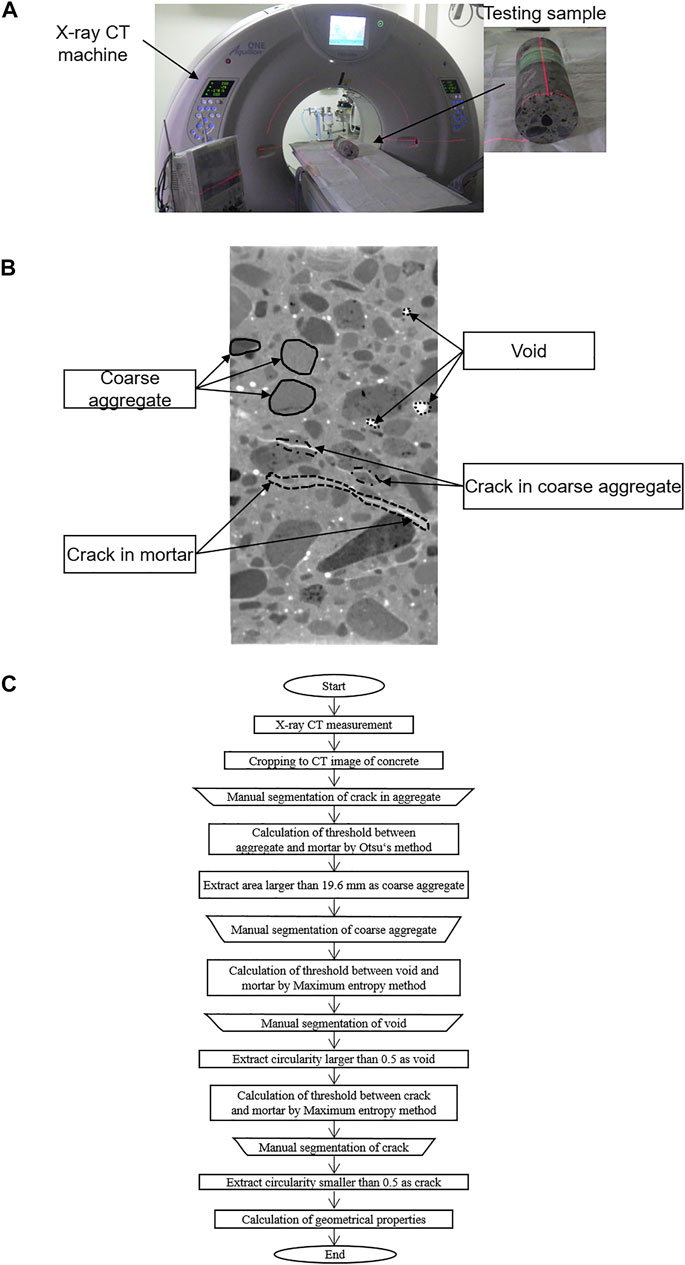
FIGURE 2. X-ray CT technique. (A) A general view of the CT machine. (B) X-ray CT characteristics. (C) The flow of X-ray CT image analysis.
2.2.1 Determination of threshold for phases
After sampling, the X-ray CT tests were conducted. In Figure 2B, the phases of concrete such as aggregate, mortar and pores are readily visible and the system of inner cracks is also distinguishable. The flow of X-ray CT image analysis is shown in Figure 2C. The extraction of each phase of concrete specimens was conducted by binarization techniques which allow recognition of objects from the image background by a specified threshold level.
In this research, two methods of calculating threshold levels as Otsu and maximum entropy methods were provided (see Figure 3). These methods are used to determine a proper threshold of gray value of coarse aggregate, cracks, and voids. The Otsu method is based on the minimization of intra-class variance defined as a weighted sum of variances of the two classes (see Figure 3A) (Otsu, 1979). On the other hand, the Maximum Entropy method is very similar to Otsu's method, but is based on the maximization of the inter-class entropy (see Figure 3B) (Kapur et al., 1985). In this study, the use of a combination of these methods is explained by their precision and usability for different phases of the concrete matrix. The Otsu method has high accuracy in detecting macroscopic objects such as aggregate particles, whereas applying the maximum entropy method allows obtaining a better result of segmentation cracks and voids. The optimal threshold for phase segmentation was calculated for each sample (see Figure 3C).
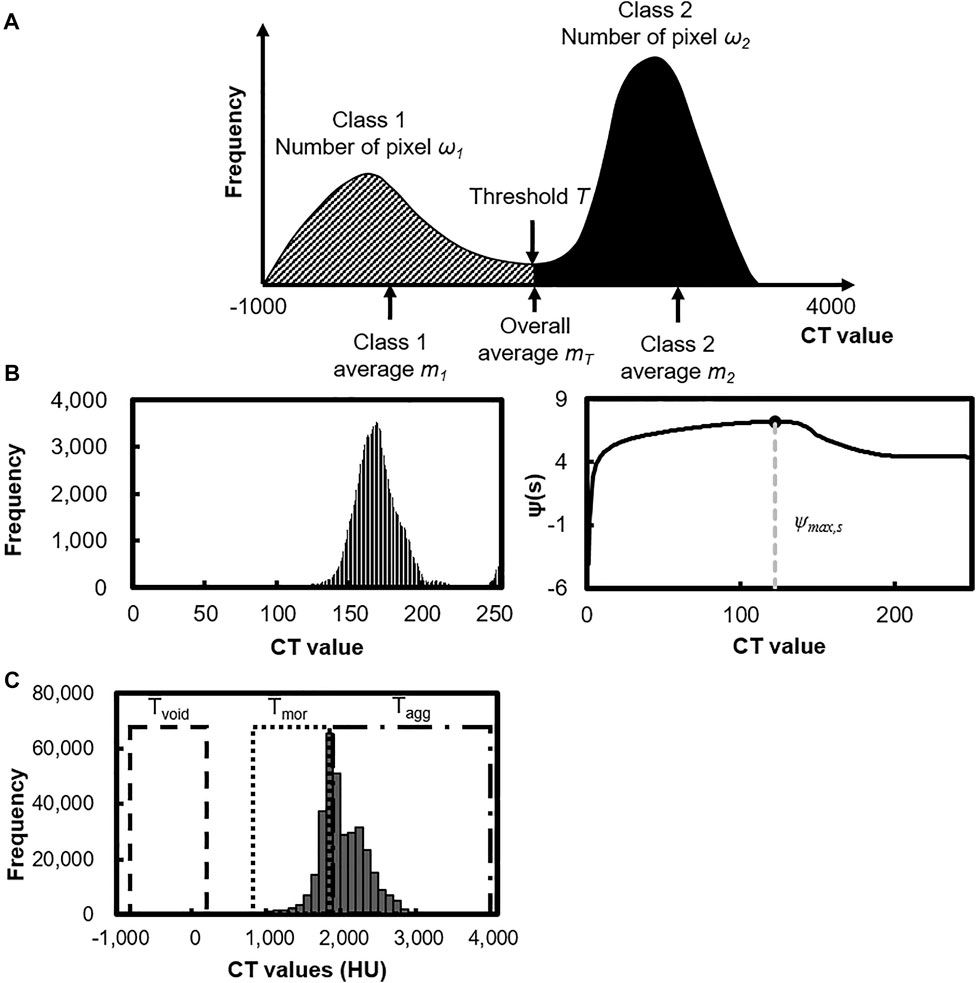
FIGURE 3. Otsu and Max entropy methods. (A) Determination of threshold by discriminant analysis method. (B) Histogram and binarization by maximum entropy method. (C) Histogram of CT values and threshold.
2.2.2 Segmentation of concrete matrix by manual operations
The segmentation of the X-ray CT images into phases was conducted by the calculated corresponding threshold levels. However, using thresholds alone to segment the inner concrete matrix is unreliable due to connected aggregates and missed areas. A series of manual operations on the 2D slices were conducted to increase the accuracy of the calculation. This process includes the separation of connected aggregates and the addition of missed areas.
Moreover, some adjustments were introduced in this research. The extraction was undergone by only for aggregates whose size was more than 5 mm. It relates to microcracking initiated at the interface between coarse aggregate and the surrounding mortar. Therefore, the analysis of damage quantification under this condition is more significant. In addition, restriction of circularity of void and crack was introduced. Filtering by circularity allows removing little parts not related to cracks and simplifies the conduction of further manual operations. Also, this operation imposes a condition on the determination of cracks: if the circularity of particles is less than 0.5, it is a crack; otherwise, it is a void. In the given research, we set this value experimentally from a comparison of X-ray CT images and visualization of cracks.
For extraction of cracks in a mortar, a series of manual operations were carried out. If detection of the cracking system is complicated, it is necessary to extract X-ray CT images of previous and subsequent slices of the sample under consideration. After the determination and separation of cracks and voids, it is required to combine corresponding groups with each other.
To exclude mistakes in the future calculation of geometric parameters, it is needed to extract duplicate concrete components. At this stage, voids that belong to aggregates were removed from the binary image of voids.
2.2.3 Representation of the concrete matrix
The visualization and extraction were conducted by applying Python (Ver.3.8) and ImageJ (Ver.1.53p) software. Combining both these programs allows simplifying and accelerating image processing, especially using big data volume. The post-processed phases of concrete are shown in Figure 4. Figure 4A demonstrates the observation surfaces A and B. Figure 4B illustrates the binary images before manual operations. The boundary of some aggregates has not been discovered correctly. Not all voids were distinguished accurately; low-scale pores were not taken into processing. Figure 4C depicts binary images of particles that are treated by manual operations. The extracted parts are represented in black pixels. These images can detect a similar trend as the structure of the real sample: the particle distribution and coverage area are identical as in the initial sample. This result was used in future analysis and calculation of geometric properties of the concrete structure.
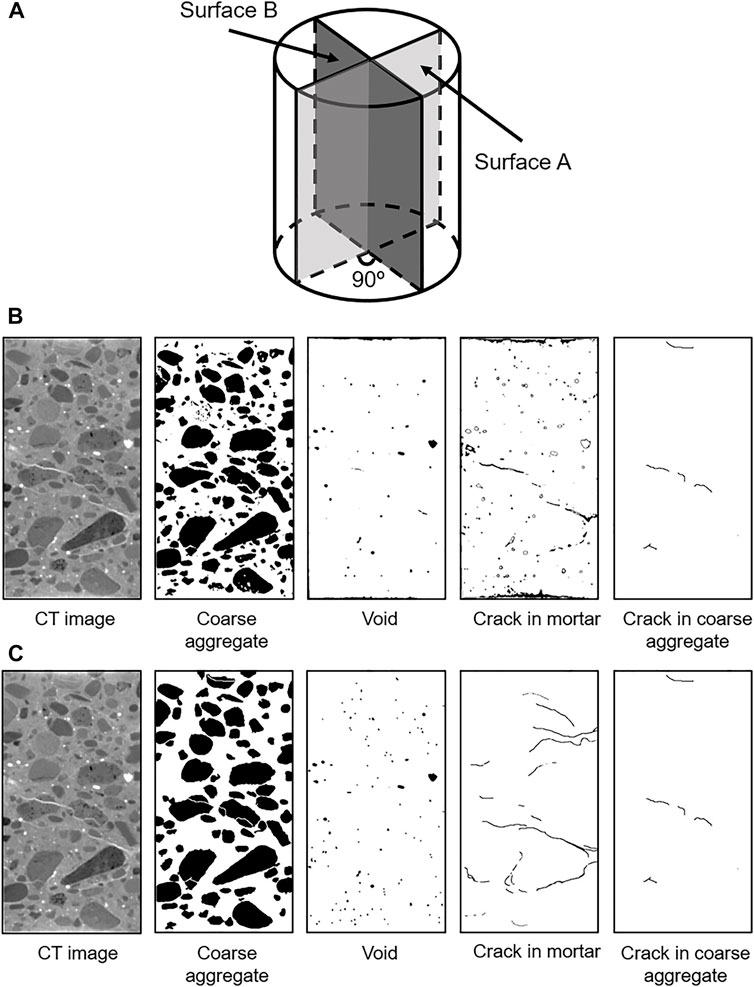
FIGURE 4. Extracted particles. (A) Observation surfaces. (B) Before manual operations. (C) After manual operations.
2.3 Ultrasonic and vibration-based non-destructive tests
2.3.1 Ultrasonic pulse velocity (UPV) method
The deformations are considered in solid media as small elastic oscillations or elastic waves (Landau and Lifshitz, 1975). The ultrasonic wave-based propagation technique is among the most widely used NDT methods for the inspection of concrete structures. It is based on the generation of ultrasonic impulses in the form of an elastic wave at a point on the structural element surface which propagates through a solid medium. Due to heterogeneous medium of the concrete, the wave propagation is affected by parameters, such as the type, density and composition of the material, the severity and location of internal defects, and surface conditions. Therefore, analysis of ultrasonic wave propagation characteristics allows us to detect the extent of damage in a concrete structure, to assess its severity and to monitor structural condition (Leonard, 2018).
After the X-ray CT test, an ultrasonic test and a resonant frequency test were performed. The procedure of measurement was conducted in accordance with ASTM (2002). The appropriate setups are illustrated in Figure 5. The P-wave velocity was measured by using a UT device (Pundit Lab system manufactured by PROCEQ) which is portable for field testing and can be used for multiple testing methods by switching the instrument modules (see Figure 5A). A through-transmission technique was applied to measure the transit time (time-of-flight). The time of propagation of the ultrasonic pulse was determined across the center of the cross-section over the length of the testing specimen and the pulse velocity was calculated using the average of measurements. The input wave voltage and frequency were set to 50 V and 150 kHz, respectively. The receiver was set to double. A good coupling between the transducers and the specimen’s surfaces was provided using polyether polyol as a coupling agent. Elastic waves are generated and propagated in concrete due to either a dynamic force (UT) or generation of cracking (AE). In an anisotropic elastic body, P-wave propagation with the velocity Vp can be calculated from Eq. 1:
where Ed is the dynamic modulus of elasticity calculated from the P-wave velocity, ν is Poisson’s ratio, and ρ is the concrete density. The dynamic modulus of elasticity, Ed, can be determined from Eq. 2:
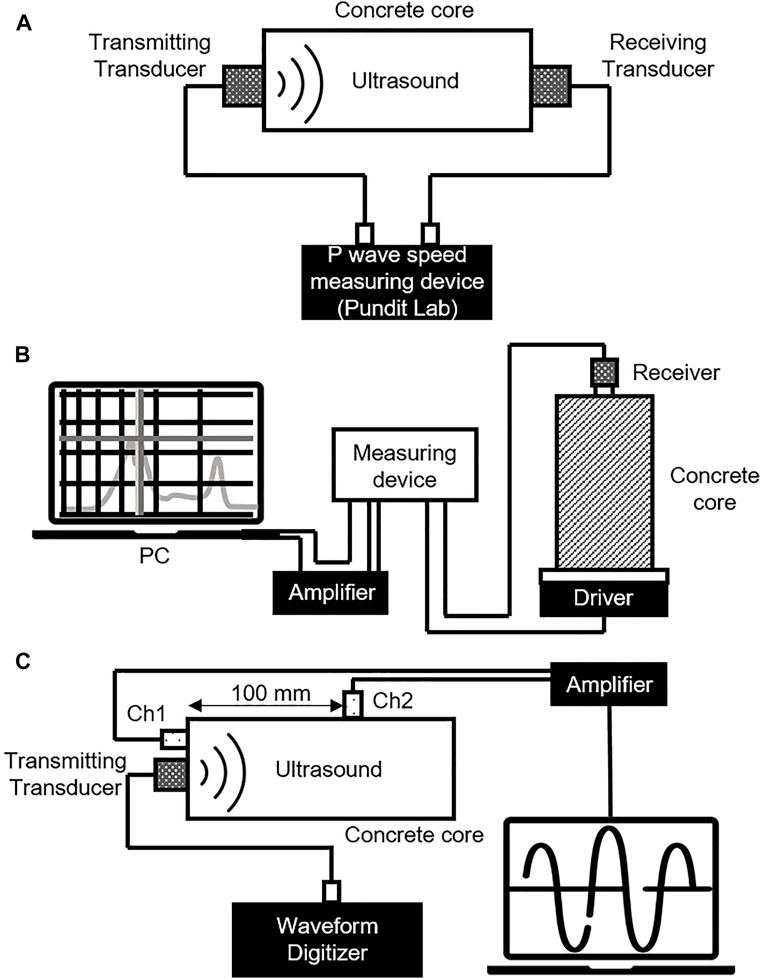
FIGURE 5. Setup of NDT. (A) Pulse velocity test. (B) Resonant frequency test. (C) Acousto-ultrasonic test.
2.3.2 Resonant frequency method
Based on elastic wave propagation theory, the resonant method is utilized to measure the dynamic modulus of elasticity of concrete at small strains. By stimulating a concrete specimen longitudinally and measuring the frequencies at which it resonates, the unconstrained compression wave velocity of the specimen may be computed. Wave velocity, specimen shape, and boundary condition affect the specimen’s resonant frequency, which are frequencies at which waves reflect off the specimen ends and stack constructively. Sine sweeps excitation’s shaker, accelerometer, and a waveform analyzer are used in resonant frequency testing. The main operating idea is to produce excitation at one end of the specimen while monitoring its reaction at the other. This method is widely used for the determination of the dynamic elastic modulus of materials and the diagnosis of structural integrity (Salawu, 1997).
The fundamental longitudinal resonant frequency of the concrete cylinders was measured to estimate the dynamic modulus of elasticity in accordance with JIS A 1127:2001 (2010). This test consists of placing an oscillator and a receiver at the two ends of a cylindrical specimen to generate longitudinal vibrations parallel to the main axis as illustrated in Figure 5B. The input voltage and sweeping time were set at 100 mV and 30 s, respectively. The resonant frequency method estimates the dynamic modulus of elasticity, ED, calculated from the measurement of the resonant frequency of sweep vibration condition (500–20,000 Hz) in concrete (Eq. 3):
where ED is the dynamic modulus of elasticity calculated from the resonant frequency, f is the resonant frequency, m, L and A are the mass, length, and area of the testing sample, respectively.
2.3.3 Acousto-Ultrasonic (AU) method
The AU method is a viable one for assessing material integrity. This technique assumes the stress waves are generated by ultrasound and resemble AE waves but without destruction of the material. Launched ultrasonic waves are modified by stochastic processes, which are analogous to those that influence spontaneous AE from internal sources during such processes as stressing, deformation, etc. One of the advantages of applying this method is the opportunity to save the nature and location of the source of ultrasonic radiation and to characterize the material medium between the source and the receiver (Vary, 1988). As in ultrasonic testing, the propagation media influences the ultrasonic signal parameters that provide information about internal inclusions and evaluate the damage degree of the material.
Table 2 represents the input and output measurement characteristics of the application of the AU technique, respectively. The AU test setup is illustrated in Figure 5C. Stress wave simulation was accomplished with a 2 MHz piezoelectric transducer coupled directly to the top surface of the specimen. AU measurements were achieved by using two piezoelectric sensors with a frequency range of 150 kHz which were mounted on the specimen at a distance of 100 mm between each other as shown in Figure 5C. To avoid the reflection between waves and to receive more precise information about the damage state of the specimen, only one longitudinal wave was launched. After achieving of signal to the piezoelectric sensors, the structural response was recorded and taken as the simulated acoustic signal. The AE descriptors such as the amplitude, energy, duration, and frequency of the emitted and received signals were recorded.
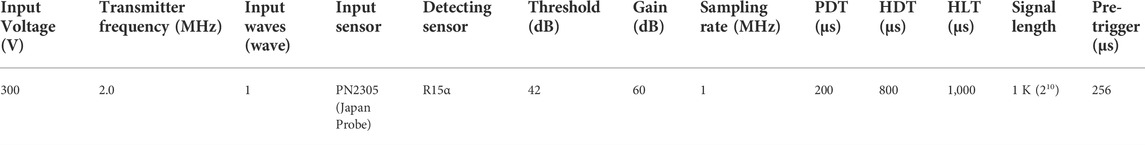
TABLE 2. Input and output settings used for acousto-ultrasonic test.
Material inhomogeneity is an important parameter that affects the wave energy reflecting or scattering it to directions other than the original. During propagation, the signal is also absorbed by the viscoelastic matrix of the material, so there is a difference in the amplitude of the propagated signal between the two receivers. Due to the internal damage as cracks blocking the propagation signal path, the portion of the energy cannot proceed to the second transducer. Therefore, the ratio of the signal descriptors such as amplitude and the energy of the second to the first sensor was used as the factor of transmission to correlate with the extent of the damage in this work. The high-frequency components experience high attenuation and completely disappear while traveling long paths, so analysis of this phenomenon also can demonstrate the information about the internal structure of the material.
3 Results and discussion
3.1 Physical properties of the concrete core specimens
The physical properties of the samples are shown in Table 3. The dynamic elastic modulus Ed and ED are calculated from Eqs. 2, 3, respectively. As seen, the variance of these values is high enough. Sample No.5 has an absolute high value of Ed (=28.7 GPa) which corresponds to optimal propagation velocity in good quality concrete (=3,730 m/s = 4,000 m/s) (Leslie and Cheesman, 1949). Conversely, sample No. 12 has a very low value of Ed (=1.9 GPa) which can suggest the presence of a high damage degree in the material (977 m/s; Min value). Because all samples were taken from the in-service concrete structure which was strictly affected by the freeze-thaw process, the average value of dynamic modulus of elasticity from pulse velocity for all samples is 8.8 GPa which confirms their damaged condition.
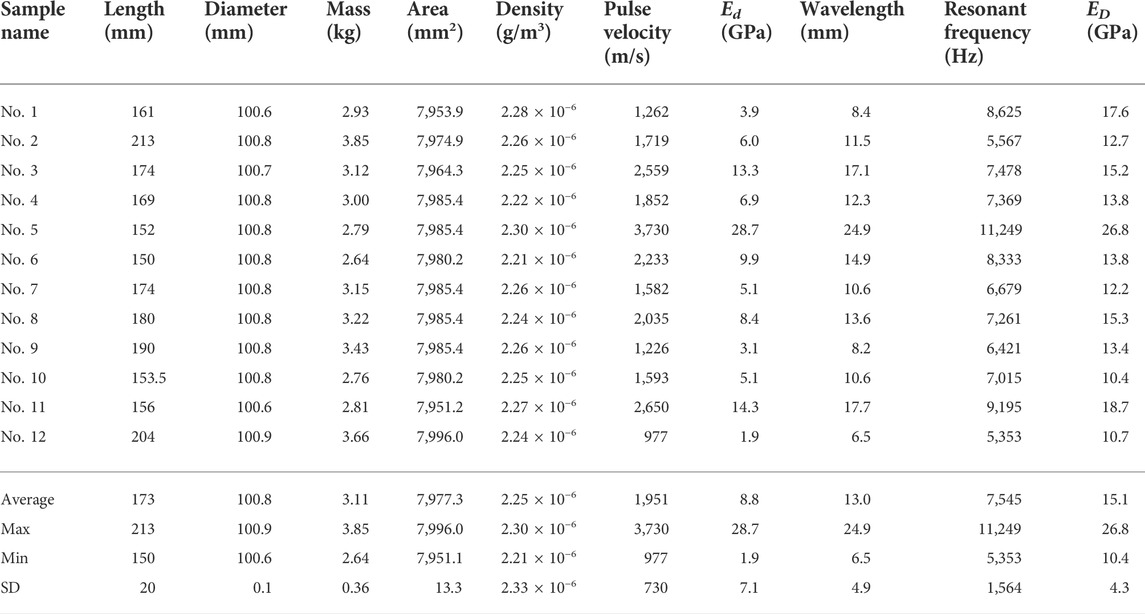
TABLE 3. Physical properties of testing concrete samples.
Results of the resonant frequency test also show a considerable difference between the minimum and maximum values of ED which ranges from 10.4 to 26.8 GPa. It is visible that sample No. 5 satisfies a requirement of a few-damaged condition with a high dynamic elastic modulus value of 28.2 GPa, which is approximately equal to Ed. Therefore, both parameters indicate the low-damage condition of this sample. According to these test results, the common tendency to damage is the same as in the pulse velocity test but has a different dispersion of values. Sample No. 12 shows a lower ED (=10.7 GPa) but there is a huge gap between the two test values. The average value of ED is about twice higher than Ed: 15.1 and 8.8 GPa. The standard deviation of ED (=4.3 GPa) is observed lower than Ed (=7.1 GPa) by approximately twice. It can be related to different input measurement conditions. The input voltage of ultrasound waves was set at 50 V which is related to the intensity of generated mechanical energy of the input signal propagating in the concrete core. The picking-up of the signals depends on amplitude, attenuation degree, stiffness of the fastest available path in anisotropic media, measuring system’s onset threshold, signal amplification, and signal-to-noise ratio (Kay, 1998; Molyneux and Schmitt, 2000). Hence, the first arrival time could be mistakenly detected due to the low power of the input signal and, respectively, the poor pulse velocity can be received. In addition, there was a difference in the frequency of generated signals in ultrasonic and vibration tests. The frequency of the ultrasonic transmitter was 150 kHz, whereas longitudinal vibration frequencies ranged from 0.5 to 20 kHz. A significantly lower ultrasonic pulse velocity in these samples may be attributed to the mechanism of pulse propagation in the anisotropic and attenuating concrete medium. The presence of such particles as coarse aggregates, voids, and cracks diffuses the energy in every direction during wave propagation (Molero et al., 2010). Therefore, the low values of Ed were discovered under the pulse velocity test rather than the resonant frequency test.
Some research works (Philleo, 1955; Lee et al., 2017) confirmed the difference in the values of the dynamic modulus of elasticity calculated by different methods such as those introduced in this work and showed that the modulus from the ultrasonic method was the highest followed by the longitudinal and flexural vibration test. In this study, the inverse tendency was received. Ohtsu (2005) considers that it can be associated with the fact of ED value reflects only one-dimensional wave propagation and does not take Poisson’s ratio into account (Ohtsu, 2005). Opposite, the Ed includes this parameter in computations which has a close relationship with the spatial distribution of the inside damage. Because the damaged inner structure of all testing samples was confirmed, it can be considered that Ed is a more sensitive parameter to the spatial damage condition than ED.
3.2 Characteristics of extracted concrete particles by visual analysis
Figure 6 represents the grayscale X-ray CT images of A and B surfaces and their corresponding segmented particles. The color scheme depicts each group of extracted components: mortar, coarse aggregates, voids, and cracks. These images allow tentative assessing the distribution of each type of particle, its rough size ratio and its condition visually. All samples have different degrees of particle size distribution. The big-size aggregates of samples No. 1 and No. 5 are concentrated in the central and left parts of the observation area, respectively, whereas No. 4 and No. 7 have a homogeneous distribution. The different distribution densities of the coarse aggregates can be observed in the samples. The possible reason for it can be related to segregation: the samples No. 6, No. 10, and No. 12 samples were placed at the upper layer of the structure and, accordingly, they have big gaps in the mortar and domination of small size aggregate. Whereas the inner structure of the lower layer’s samples No. 5, No. 7, and No. 9 illustrates a good correlation between both density and size distribution. It needs to mention that different degrees of allocation can be combined in one sample as No. 3 and No. 10 where longitudinal surface A depicts significant blanks between particles and surface B perpendicular to it shows that it has a homogeneous distribution. The analysis of coarse aggregate parameters is an important part of the damage assessment because they affect the fracture behavior (Chen and Liu, 2004; Meddah et al., 2010).
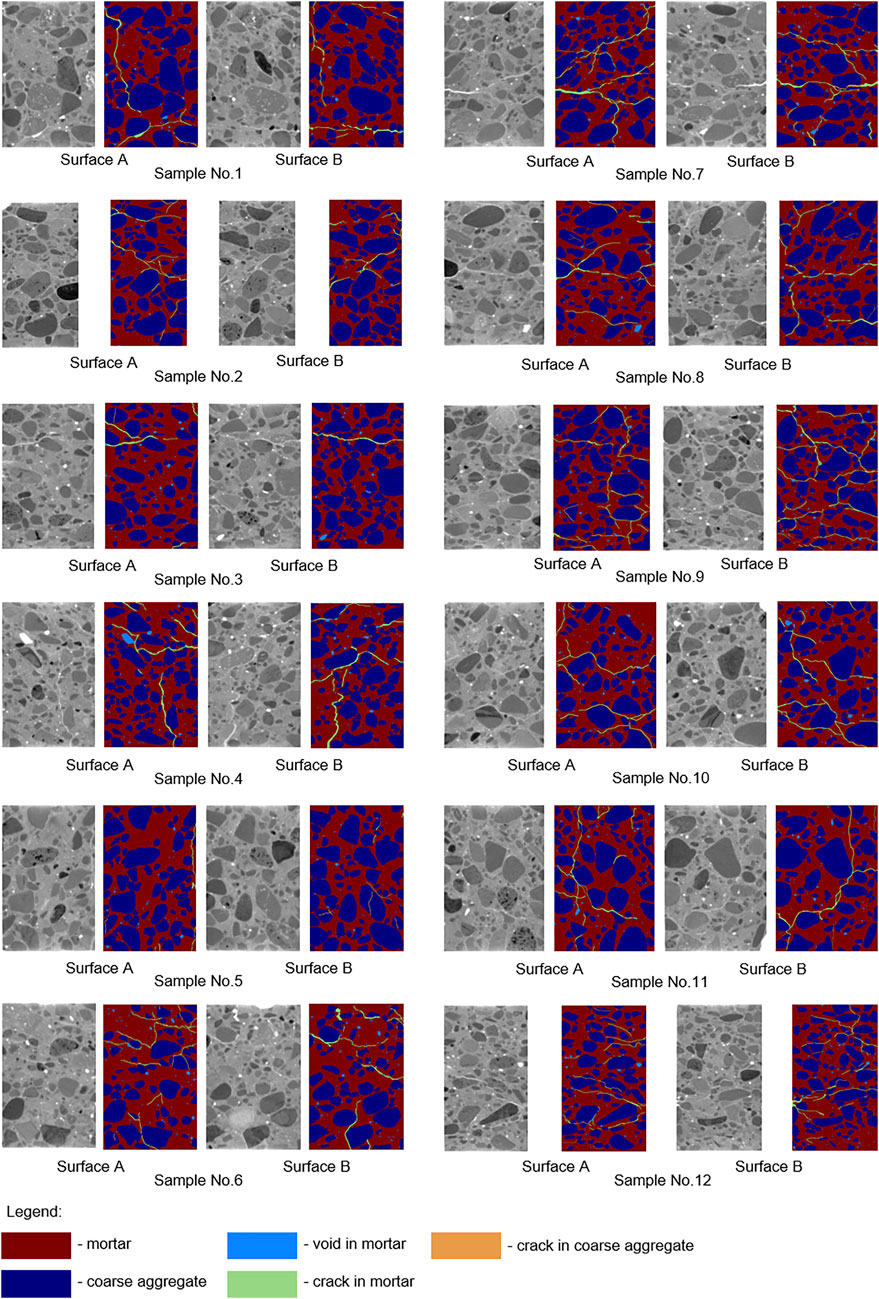
FIGURE 6. Schemes of concrete components.
All samples have various degrees of damage which are expressed by the cracking area of samples. As can be mentioned above, the structure underwent a freeze-thaw process, so the cracking processes can be observed in all samples. It is known that the cracking damage is generated from pores, gradually propagated along the interfacial transition zone (ITZ) and accumulated during repeating freeze-thawing cycles. The initial microcracking can be occurred by differential shrinkage (Samouh et al., 2017), bleeding, or segregation during casting. As a result, weak layers can be observed under the larger aggregate particles preferentially. The transmission path of cracks through large-size aggregates can be observed approximately in all samples especially in No. 1, No. 4, and No. 11. Furthermore, cracks propagated through the coarse aggregate have been detected, which can be evidence of the presence of low-strength aggregates in the matrix (No. 7). Since the drainage pump station is located near the sea coast, the probability of salt penetration from the surface into the depth of the concrete structure and defect occurring is also high (Liu et al., 2021).
Because concrete is a heterogeneous material, precise determination of fracture behavior is complicated. But the existing degree of damage can be assessed by the X-ray CT projections of samples. The mortar cracks are prevalent in analyzed samples which can be related to duration of the external load but cannot be investigated due to insufficiency of high-resolution scanning for detection of microcracking in ITZ. The core sample No. 5 demonstrates only one continuous crack near the lateral surface. Sample No. 3 also has oblong cracks in the upper part of the cylinder. The orientations of the main cracks of samples No. 2, No. 3, No. 7, and No. 11 do not vary obviously in a given plane due to the formation of dominant failure paths. The visualized cracking system helps to evaluate the location, damaged area, density, and dimensions of cracks and can be actively used to get a tentative assessment of the damage degree of the material.
The results of the assessment of 2D images are simplified patterns and can include not all damage aspects due to the limitation of a spatial survey of the sample, but, due to this method being rather simple and fast, this type is reasonable for realization and quantitative evaluation of inner structure. On the opposite side, 3D segmentation starts to be a new method in X-ray CT image analysis of structure which represents the whole structural composition of the testing sample (Barisin et al., 2021). An example of this study is shown in Figure 7. However, there are some troubles with using 3D segmentation of components of the material. It refers to the fact that the precise separation and the subsequent deep damage analysis demand high-resolution scanning equipment which can extract low-scale components of the material (du Plessis et al., 2016). Moreover, volumetric representation of the inner structure requires big data files to be processed (Paetsch, 2019). Applying manual operation is very time-consuming, so the 3D approach assumes deep and machine learning (ML) methods for solving image segmentation tasks (Rezaie et al., 2020). In this research, the shape of concrete inclusions under investigation is rather simple, so the 2D analysis was chosen as a cost-effective and useful tool for damage quantification instead of 3D.
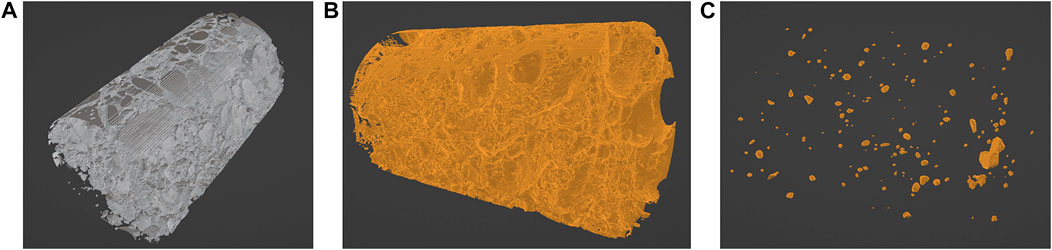
FIGURE 7. 3D phase segmentation. (A) Coarse aggregate. (B) Mortar. (C) Void.
3.3 Evaluation of geometric characteristics of cracks by image processing
The calculated geometric properties of concrete components and their proportions in concrete are represented in Tables 4, 5, respectively. The average and standard deviation values were calculated from measurements of all 12 samples for each parameter in three groups of components: aggregate, void, and crack. The total area of aggregate to observation area ratio means that the distribution density of particles in the specimen area varies from 0.357 to 0.520 with an average value of 0.444 and a standard deviation of 0.046. The average value of the total perimeter of aggregate to observation area is 0.161 mm−1 and the standard deviation is 0.012 mm−1. In accordance with parameters for the void, the average value of the distribution density of voids is 0.008 with a standard deviation of 0.002. The ratio of the total perimeter of voids to observation area ranges between 0.013 mm−1 and 0.024 mm−1 with average and standard deviation values of 0.019 mm−1 and 0.003 mm−1, respectively. Analysis of geometric properties shows that sample No. 5 has one of the highest (0.520) and lowest (0.005) values of coarse aggregate and the void distribution densities, respectively. Hence, high compressive strength can be expected (Kozul and Darwin, 1997). Sample No. 3 also can be referred to as the group mentioned above with aggregate and void distribution densities of 0.464 and 0.008, respectively.
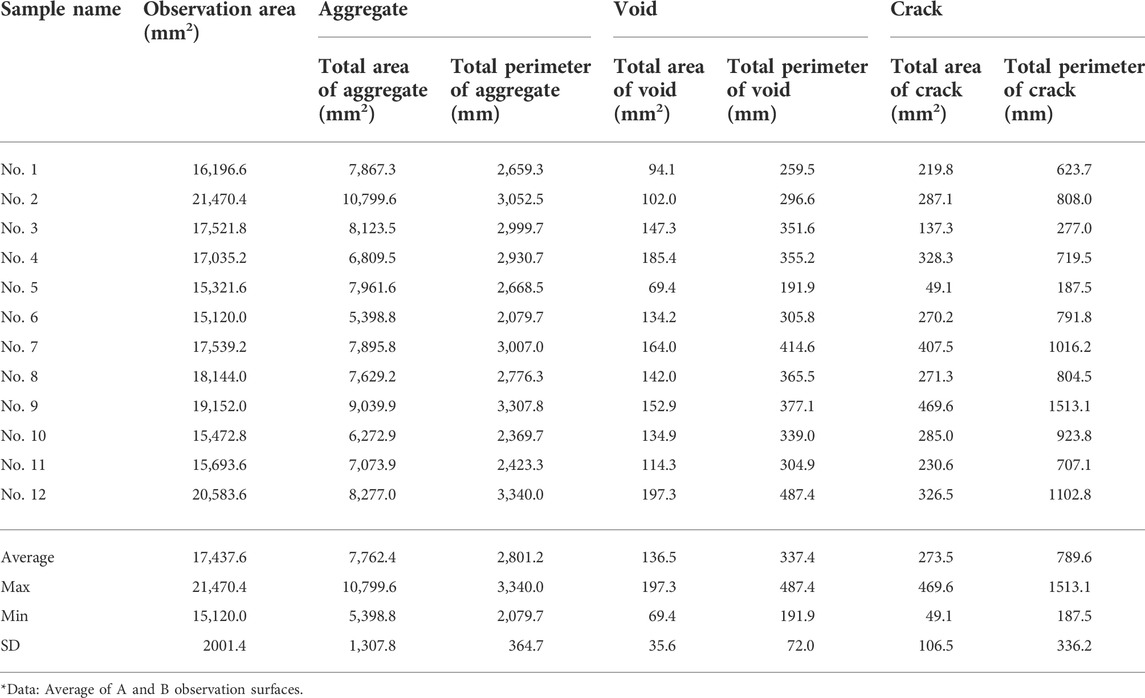
TABLE 4. Geometric properties of concrete components.
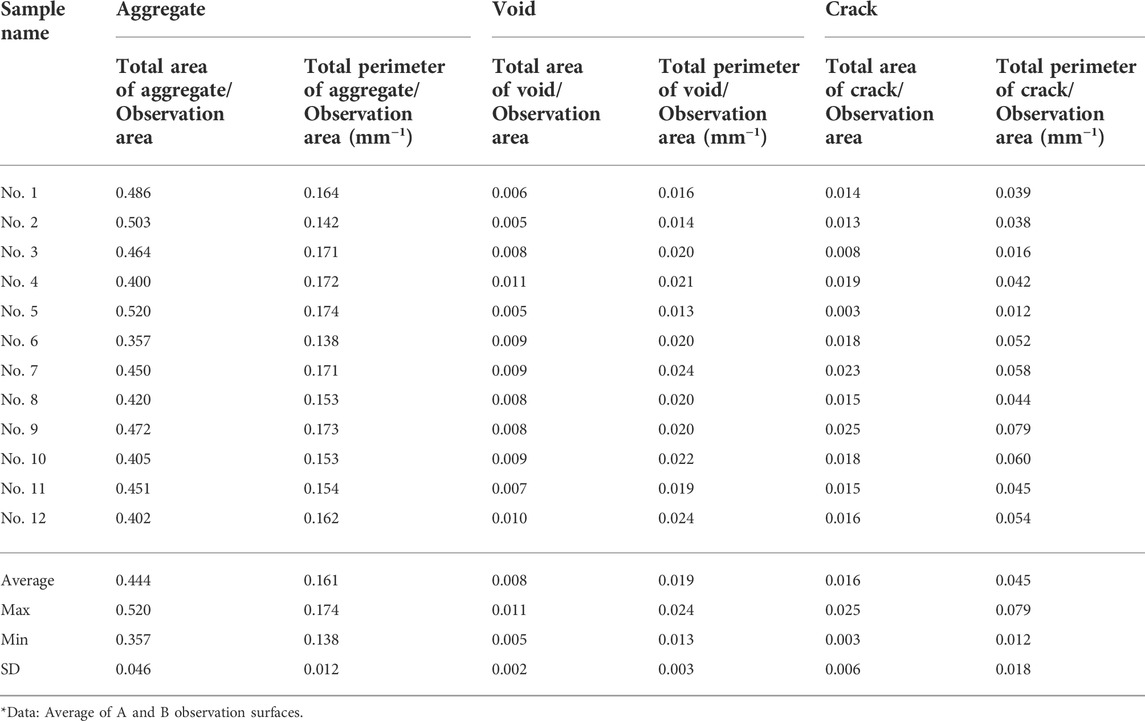
TABLE 5. Proportions of concrete components.
As was observed in the work of Nemati and Monteiro (1998), the most appropriate parameter of damage evaluation is a crack density which represents the area of cracks per unit of the observation area. As can be seen from the table, there are two different parameters used for the calculation of density: total area and total perimeter of extracted particle. For aggregate and void, this distinction is substantial due to their shape but in this research, the width of cracks is very low compared with length, therefore, both parameters can be represented like a crack length by counting only half of the total perimeter. There is a little difference in these values: the total area of crack includes all regions occupied by shape including a crack width, but the total perimeter defining the length of the outer boundary of the shape, takes crack tortuosity into account. The crack density varies from 0.003 to 0.025 for the total area of cracks and from 0.012 mm−1 to 0.079 mm−1 for the total perimeter of cracks. The average and standard deviation values of both parameters are 0.016 and 0.006 in the total area case and 0.045 mm−1 and 0.018 mm−1 in the total perimeter case. Sample No. 5 demonstrates the lowest crack density of 0.003 and 0.012 mm−1 by both crack parameters. Sample No. 9 shows the absolute high value of crack density of 0.025 and 0.079 mm−1 and the high value of void distribution density of 0.008.
3.4 Comparison of the dynamic modulus of elasticity and geometric characteristics of cracks
The correlation between NDT parameters and calculated proportions parameters of concrete components of samples is shown in Table 6. In addition, the acousto-ultrasonic test was carried out for estimating damage in concrete core samples. Table 7 provides information about the correlation between acousto-ultrasonic parameters and the proportions parameters of concrete components. Pearson’s correlation analysis was used to prove the strength of linear association between different parameters. The correlation values range between 0.29 and 0.57 for the total area of aggregate to the observation area ratio and between 0.08 and -0.29 for the total perimeter of aggregate to the observation area ratio with NDT parameters representing a low and not statistically significant relationship between these parameters (p-value is higher than 0.05 for all parameters). Moreover, the relationship between the total perimeter of aggregate to the observation area and resonant frequency and ED has a negative correlation (−0.17 and −0.29, respectively). The parameters of the void group show higher values of correlation than the aggregate group. The correlation values vary from −0.40 to −0.63 for the total area of void to the observation area ratio and from −0.50 to −0.71 for the total perimeter of void to the observation area ratio with NDT parameters. All correlations in this group are negative. It means that increasing void content in the sample leads to decreasing in NDT parameters. On the other hand, the relationship between void parameters and ED shows a statistically significant correlation. The crack group shows the strongest relationship between NDT and crack parameters. The highest value of correlation can be observed between the total area of crack to the observation area and Ed of −0.76. The total perimeter of cracks to the observation area also has a high correlation with Ed of −0.72. In this group, the trend of correlation has a negative character: increasing crack density causes decreasing NDT parameters.
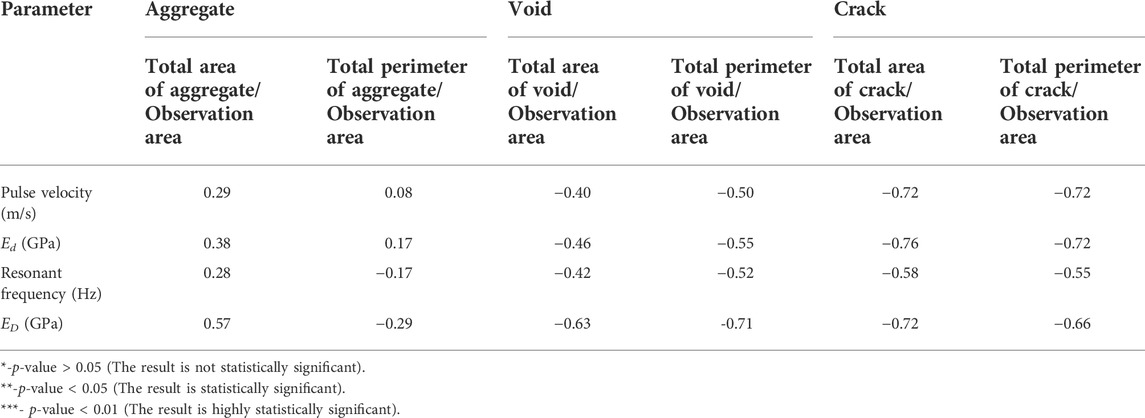
TABLE 6. Correlation between NDT parameters and proportions parameters of concrete components.
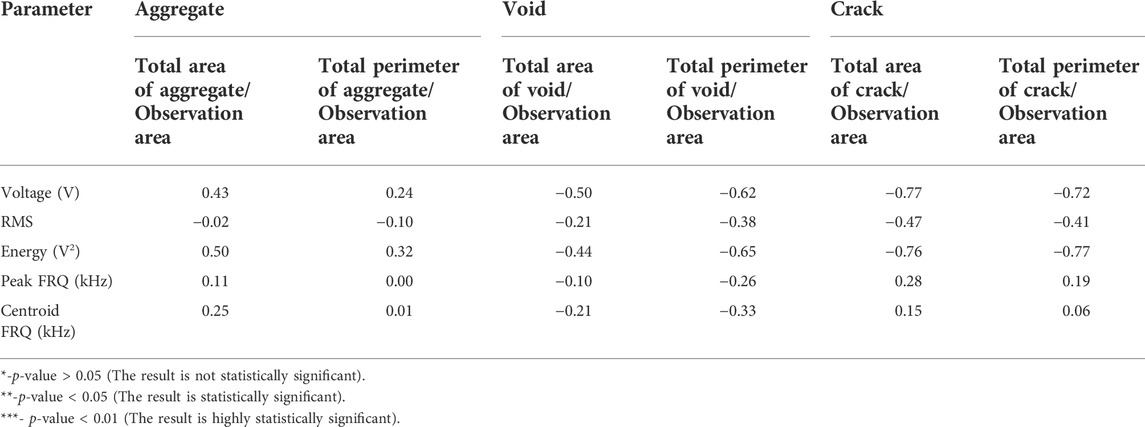
TABLE 7. Correlation between proportions parameters of concrete components and AU parameters.
There is no significant correlation between the total perimeter of aggregate to observation area ratio and NDT parameters because this parameter depicts only the length of particle shape which was not a key parameter in this analysis. But this parameter can calculate aggregate angularity which had a fine linear positive correlation with the dynamic stability of the mixture (Kuang et al., 2019). The total area of aggregate to the observation area ratio also has a weak correlation with NDT parameters. The big differences between Ed and ED and the correlation between them and geometric parameters can be caused by the low strength of the ultrasonic pulse signal. Because coarse aggregate has a high density, the weak signal propagates through heterogeneous media with a large degree of scattering and attenuation. It needs to be pointed out that the correlation of all geometric parameters of the concrete matrix with ED showed reasonably a high value. It is that the value of the dynamic modulus of elasticity depends on the dimensions of the specimens used in the measurements.
Table 7 shows approximately the same trend as in NDT parameters: the strongest correlation exists between crack parameters and AU parameters (−0.77 between the total area of crack to the observation area ratio and voltage and −0.77 between the total perimeter of crack to the observation area ratio and energy) and the lowest can be observed in the aggregate group (−0.02 between RMS and total area of aggregate to the observation area ratio). The frequency-based parameters of the signal show a weak relationship with particle parameters: there is absolutely no correlation between the total perimeter of aggregate to the observation area and peak frequency and centroid frequency (0.00 and 0.01, respectively). It can be related to the fact that only one wave propagated in the solid media and it was not enough for accurate frequency analysis. Figure 8 illustrates the highest correlations between crack and AU parameters. The horizontal axis is set to the crack parameters and the vertical axis is set to the AU parameters. The circle plot depicts the relation of the crack parameter value and that of the AU parameter. The damage condition is evaluated by decreasing of signal-based parameters of AU and increasing crack parameter values. Figure 8A shows the relationship between crack density and transmitting energy ratio (R2 = 0.57). Sample No. 5 can be marked as few-damaged samples with a low value of crack density and a high degree of transmitted energy. Sample No. 3 also shows a low value of crack propagation in the matrix and the high energy transmitting ratio consequently. The situation with the definition of the most damaged sample is ambiguous. Samples No. 7 and No. 9 show a high value of crack density but various energy ratios. Sample No. 12 has not undergone strong cracking damage but has the lowest value of transmitting energy ratio. This phenomenon can be related to the distribution of initial microcracks where size is less than the resolution of the used X-ray CT scan in this research (Anugonda et al., 2001). Therefore, energy scattering in this sample is sufficiently high. Figure 8B illustrates the relationship between the total perimeter of cracks to the observation area ratio and the transmitting energy ratio (R2 = 0.60). The correlation has the same tendency in few-damage samples (No. 5 and No. 3) as in the previous, but there are few differences in variance of samples with high damage degree. The position of sample No. 9 has not changed compared to the damage degree situation but sample No. 7 was displaced in horizontal duration which can be the fact the cracks in this sample are greatly wider than in others. Figure 8C demonstrates the correlation between voltage ratio and crack density (R2 = 0.59). As in the former two graphs, sample No. 5 has an absolute high value of the AU parameter (Voltage). Samples No. 7 and No. 9 illustrate the high-damage condition with little difference in voltage ratio. The evaluation of the damage degree of samples in the central parts of these graphs is difficult due to various aspects which affect the accuracy of result interpretation.
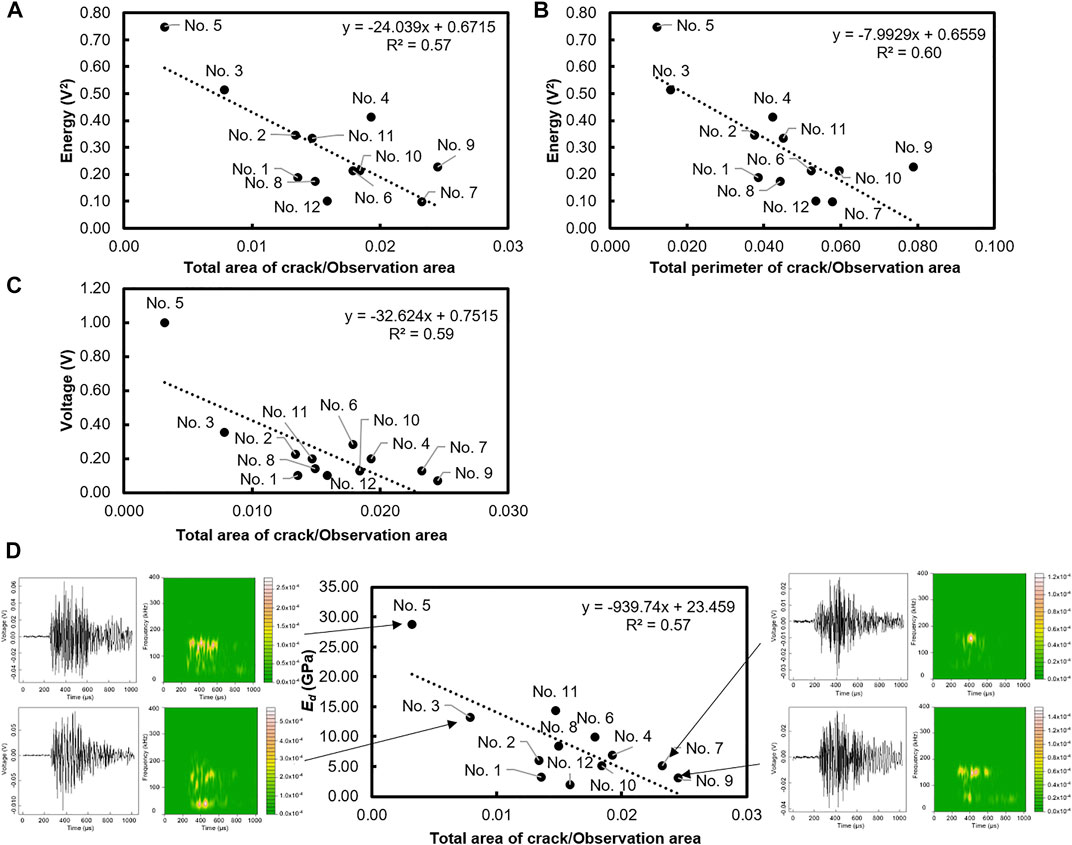
FIGURE 8. Relation between proportions parameters of concrete components and AU, NDT parameters. (A) Relation between energy and crack density. (B) Relation between energy and ratio of the total perimeter of crack to the observation area ratio. (C) Relation between voltage and crack density. (D) Relation between proportions parameters of concrete components and NDT parameter.
Figure 8D demonstrates the correlation between crack density and Ed (R2 = 0.57). Time-frequency and time-voltage domains of the received signal are also attached to this figure. Sample No. 5 shows the high value of dynamic modulus of elasticity Ed under the low value of crack density. The high-frequency component prevails in the transmitted signal which in fact can point that the inner structure has a small number of cracks. Sample No. 3 can be mentioned as low-damaged. But received signal besides high-frequency components also has a low centroid frequency which indicates a high attenuation by the inner structure. It can be related that horizontal cracks are prevalent in this sample and have a high influence on signal propagation. Samples No. 7 and No. 9 refer to samples with high damage degrees. The frequency domain reflects the centroid frequency which dominated in high values. The signal of sample No. 9 also shows low-frequency components that are a consequence of attenuation phenomena. Thus, the dynamic modulus of elasticity is affected by crack density and its properties. The development of cracks affects the attenuation of the input ultrasonic wave and decreases the energy of AU parameters.
The analysis of the mechanical behavior of concrete can be conducted by applying a reliable damage mechanics model in the compression field to evaluate the material damage caused by mechanical and environmental loads. The classical damage mechanics model assumes the introduction of a scalar damage variable which varies between 0 for an intact material and 1 for an existing damaged condition (Loland, 1980). This variable affects directly the stiffness tensor, leading to a nonlinear relation between strain and stress tensors. Such a model was used for damage quantification in concrete material by estimating the intact modulus of elasticity (Suzuki et al., 2020) and the initial material damage as a function of the gel-space ratio (Ouyang et al., 1988). In future research, we will develop the damage estimation method for concrete by X-ray CT and related elastic wave method in the core test, which is based on the damage mechanics model.
4 Conclusion
For quantitative estimation of damage in concrete, X-ray CT, NDT parameters, and dynamic modulus of elasticity were applied to concrete materials drilled out from in-service deteriorated concrete headworks. The analytical procedure is based on damage mechanics and elastic wave theory. In this study, visualization and quantification of cracking damage of in-service concrete are conducted by X-ray CT image technique. It is qualitatively demonstrated that testing concrete is damaged based on comparing the crack density and the dynamic modulus of elasticity. Reasonable agreement with the spatial distribution of cracks in concrete is confirmed by the results of elastic wave characteristics in the core test. The results are summarized as follows.
1. The tested sampling structure is strongly damaged by cracks in the concrete body which is confirmed by the results of pulse velocity, resonant frequency, and acousto-ultrasonic tests. The average values of Ed and ED are 8.8 and 15.1 GPa, respectively (in few-damaged concrete are 28.7 and 26.8 GPa).
2. The spatial distribution of cracking damage in the core samples is determined by applying an X-ray CT scanning with image analysis. The color schemes of concrete components visualize the internal distribution of such particles as coarse aggregate, void, and crack.
3. The extracted concrete matrix is assessed by calculating the main geometric characteristics of the particles by image processing technique. The optimal evaluation parameter, the total area of crack to the observation area ratio, is defined according to the definition of the damage propagation process.
4. The correlation between non-destructive testing parameter Vp, Ed, and X-ray CT geometric parameter of damage condition is successfully evaluated. In cracked concrete, the low values of ultrasonic pulse velocity Vp (=1,226 m/s), dynamic modulus of elasticity Ed (=3.1 GPa), and a high crack density (=0.025) were observed.
5. The trends observed in the acousto-ultrasonic data were compared to observations of the inner structure of the specimen made using the X-ray CT technique. The low ratio of the transmitted energy and voltage is confirmed in the high-damaged concrete specimen (No. 7 and No. 9).
6. These results suggest that the most sensitive component to the degree of damage in a concrete matrix is the crack density which represents the severity of the microcracking damage. Therefore, the damage condition of the structure can be assessed by analyzing X-ray CT and NDT parameters of concrete components.
Data availability statement
The original contributions presented in the study are included in the article/supplementary material, further inquiries can be directed to the corresponding author.
Author contributions
NM conducted the measurements, the analysis, and wrote the manuscript. KS conducted the measurements and the analysis. YS improved the accuracy of the analysis and reviewed the manuscript. ST revised the manuscript. NA revised the manuscript. TS supervised the work and revised the manuscript.
Conflict of interest
The authors declare that the research was conducted in the absence of any commercial or financial relationships that could be construed as a potential conflict of interest.
Publisher’s note
All claims expressed in this article are solely those of the authors and do not necessarily represent those of their affiliated organizations, or those of the publisher, the editors, and the reviewers. Any product that may be evaluated in this article, or claim that may be made by its manufacturer, is not guaranteed or endorsed by the publisher.
References
Alver, N., Tanarslan, H. M., and Tayfur, S. (2017). monitoring fracture processes of CFRP-strengthened RC beam by acoustic emission. J. Infrastruct. Syst. 23 (1). doi:10.1061/(asce)is.1943-555x.0000304
Anugonda, P., Wiehn, J. S., and Turner, J. A. (2001). Diffusion of ultrasound in concrete. Ultrasonics 39 (6), 429–435. doi:10.1016/S0041-624X(01)00077-4
ASTM (2002). Standard test method for pulse velocity through concrete. West Conshohocken, PA: ASTM International. doi:10.1520/C0597-16
Barisin, T., Jung, C., Müsebeck, F., Redenbach, C., and Schladitz, K. (2021). Methods for segmenting cracks in 3d images of concrete: A comparison based on semi-synthetic images. Pattern Recognit. 129, 108747. doi:10.1016/j.patcog.2022.108747
Bonagura, M., and Nobile, L. (2021). Artificial neural network (ANN) approach for predicting concrete compressive strength by SonReb. SDHM Struct. Durab. Health Monit. 15 (2), 125–137. doi:10.32604/sdhm.2021.015644
Chen, B., and Liu, J. (2004). Effect of aggregate on the fracture behavior of high strength concrete. Constr. Build. Mater. 18 (8), 585–590. doi:10.1016/j.conbuildmat.2004.04.013
Chung, S. Y., Kim, J. S., Stephan, D., and Han, T. S. (2019). Overview of the use of micro-computed tomography (micro-CT) to investigate the relation between the material characteristics and properties of cement-based materials. Constr. Build. Mater. 229, 116843. doi:10.1016/j.conbuildmat.2019.116843
Dong, H., Gao, P., and Ye, G. (2017). Characterization and comparison of capillary pore structures of digital cement pastes. Mat. Struct. 50, 154. doi:10.1617/s11527-017-1023-9
du Plessis, A., and Boshoff, W. (2019). A review of X-ray computed tomography of concrete and asphalt construction materials. Constr. Build. Mater. 199, 637–651. doi:10.1016/j.conbuildmat.2018.12.049
du Plessis, A., le Roux, S. G., and Guelpa, A. (2016). Comparison of medical and industrial X-ray computed tomography for non-destructive testing. Case Stud. Nondestruct. Test. Eval. 6, 17–25. doi:10.1016/j.csndt.2016.07.001
Eiras, J. N., Kundu, T., Popovics, J. S., Monzó, J., Soriano, L., Payá, J., et al. (2014). Evaluation of frost damage in cement-based materials by a nonlinear elastic wave technique. Health Monit. Struct. Biol. Syst. 20149064, 90641G. doi:10.1117/12.2035951
Helal, J., Sofi, M., and Mendis, P. (2015). Non-destructive testing of concrete: A review of methods. Special Issue Electron. J. Struct. Eng. 14 (1), 97–105. https://ejsei.com/EJSE/article/view/193.
Japan Concrete Institute (JCI) C65 (2005). Evaluation of concrete performance in natural environmental conditions. Japan: Japan Concrete Institute, 35–140.
JIS A 1127:2001 (2010). Methods of test for dynamic modulus of elasticity, rigidity and dynamic Poisson's ratio of concrete specimens by resonance vibration. Tokyo, Japan: Japanese Standards Association.
Kachanov, L. M. (1986). Some type of damage, introduction to continuum damage mechanics. Belgium: Martinus Nijhoff Publishers, 1–10.
Kapur, J. N., Sahoo, P. K., and Wono, A. K. C. (1985). A new method for gray-level picture thresholding using the entropy of the Histogram. Comput. Vis. Graph. Image Process. 29, 273–285. doi:10.1016/s0734-189x(85)90156-2
Karcili, M., Alver, N., and Ohtsu, M. (2016). Application of AE rate-process analysis to damaged concrete structures due to earthquake. Mater. Struct. Materiaux et Construct. 49 (6), 2171–2178. doi:10.1617/s11527-015-0641-3
Kay, S. M. (1998). Fundamentals of statistical signal processing: Detection theory. Upper Saddle River, NJ, USA: Prentice-Hall, 2.
Kazama, M., and Noda, T. (2012). Damage statistics (summary of the 2011 off the pacific coast of tohoku earthquake damage). Soils Found. 52 (5), 780–792. doi:10.1016/j.sandf.2012.11.003
Kong, W., Wei, Y., Wang, S., Chen, J., and Wang, Y. (2020). Research progress on cement-based materials by X-ray computed tomography. Int. J. Pavement Res. Technol. 13 (4), 366–375. doi:10.1007/s42947-020-0119-8
Kozul, R., and Darwin, D. (1997). “Effects of aggregate type, size, and content on concrete strength and fracture energy,” in Structural engineering and engineering materials (Lawrence, Kansas: University of Kansas Center for Research, Inc.). SM Report No.43.
Kroworz, A., and Katunin, A. (2018). Non-destructive testing of structures using optical and other methods: A review. SDHM Struct. Durab. Health Monit. 12 (1), 1–17. doi:10.3970/sdhm.2018.012.001
Kuang, D., Wang, X., Jiao, Y., Zhang, B., Liu, Y., Chen, H., et al. (2019). Influence of angularity and roughness of coarse aggregates on asphalt mixture performance. Constr. Build. Mater. 200, 681–686. doi:10.1016/j.conbuildmat.2018.12.176
Landau, L. D., and Lifshitz, E. M. (1975). “Theory of elasticity,” in Course of theoretical physics Great Briton: Pergamon, 07.
Lee, B. J., Kee, S. H., Oh, T., and Kim, Y. Y. (2017). Evaluating the dynamic elastic modulus of concrete using shear-wave velocity measurements. Adv. Mater. Sci. Eng. 2017, 1–13. doi:10.1155/2017/1651753
Leonard, J. B. (2018). “Fundamentals of ultrasonic inspection,” in ASM handbook. Kinsman Road Materials Park, OH: ASM International, 17, 155–168. doi:10.31399/asm.hb.v17.a0006470
Leslie, J. R., and Cheesman, W. J. (1949). An ultrasonic method of studying deterioration and cracking in concrete structures. J. Am. Concr. Inst. 21 (1), 17–36.
Liu, G., Mu, S., Cai, J., Xie, D., Zhou, Y., Zhou, X., et al. (2021). Influence of crack on concrete damage in salt-freezing environment. Adv. Mater. Sci. Eng. 2021, 1–13. doi:10.1155/2021/5543286
Loland, K. E. (1980). Continuous damage model for load-response estimation of concrete. Cem. Concr. Res. 10, 395–402. doi:10.1016/0008-8846(80)90115-5
Lu, H., Alymov, E., Shah, S., and Peterson, K. (2017). Measurement of air void system in lightweight concrete by X-ray computed tomography. Constr. Build. Mater. 152, 467–483. doi:10.1016/j.conbuildmat.2017.06.180
Maire, E., and Withers, P. (2014). Quantitative X-ray tomography. Int. Mat. Rev. 59 (1), 1–43. doi:10.1179/1743280413Y.0000000023
Malhorta, V. M., and Sivansudaran, V. (2004). “Resonant frequency methods,” in Handbook on nondestructive test of concrete. Editors V. M. Malhorta, and N. J. Carino. 2nd Edition (West Conshohocken, PA: CRC Press), 160–180.
Meddah, M. S., Zitouni, S., and Belâabes, S. (2010). Effect of content and particle size distribution of coarse aggregate on the compressive strength of concrete. Constr. Build. Mater. 24 (4), 505–512. doi:10.1016/j.conbuildmat.2009.10.009
Molero, M., Segura, I., Aparicio, S., and Fuente, J. V. (2010). Influence of aggregates and air voids on the ultrasonic velocity and attenuation in cementitious materials. Eur. J. Environ. Civ. Eng. 15 (4), 501–517. doi:10.1080/19648189.2011.9693343
Molyneux, J. B., and Schmitt, D. R. (2000). Compressional-wave velocities in attenuating media: A laboratory physical model study. Geophysics 65 (4), 1162–1167. doi:10.1190/1.1444809
Mori, Y., and Ellingwood, B. R. (1994). Maintaining reliability of concrete structures. I: Role of inspection/repair. J. Struct. Eng. (N. Y. N. Y). 120 (3), 824–845. doi:10.1061/(asce)0733-9445(1994)120:3(824)
Naik, T. R., Malhorta, V. M., and Popovics, J. S. (2004). “The ultrasonic pulse velocity method,” in Handbook on nondestructive test of concrete. Editors V. M. Malhorta, and N. J. Carino. 2nd Edition (Boca Raton, USA: CRC Press), 181–199.
Nemati, K., and Monteiro, P. J. M. (1998). Analysis of compressive stress-induced cracks in concrete. ACI Mater. J. 95 (5), 617–630. https://www.researchgate.net/publication/279697586.
Ohtsu, M. (1987). Acoustic emission characteristics in concrete and diagnostic applications. J. Acoust. Emiss. 6 (2), 99–108.
Ohtsu, M. (2016). Elastic wave methods for NDE in concrete based on generalized theory of acoustic emission. Constr. Build. Mater. 122, 845–854. doi:10.1016/j.conbuildmat.2015.12.137
Ohtsu, M. (2005). Nondestructive evaluation of damaged concrete due to freezing and thawing by elastic-wave method. J. Adv. Concr. Technol. 3 (3), 333–341. doi:10.3151/jact.3.333
Otsu, N. (1979). A threshold selection method from gray-level histograms. IEEE Trans. Syst. Man. Cybern. 9 (1), 62–66. doi:10.1109/tsmc.1979.4310076
Ouyang, C., Suaris, W., and Chang, W. F. (1988). Effect of sulfate attack on compression properties of cement-based mixtures containing phosphogypsum. Mater. J. 85 (2), 82–89.
Paetsch, O. (2019). “Possibilities and limitations of automated feature extraction shown by the example of crack detection in 3D-CT images of concrete specimen,” in Proc. Conf. Ind. Comp. Tomogr. Padova, Italy: iCT2019.
Parisatto, M., Dalconi, M. C., Valentini, L., Artioli, G., Rack, A., Tucoulou, R., et al. (2015). Examining microstructural evolution of Portland cements by in-situ synchrotron micro-tomography. J. Mat. Sci. 50 (4), 1805–1817. doi:10.1007/s10853-014-8743-9
Philleo, R. E. (1955). Comparison of results of three methods for determining young's modulus of elasticity of concrete. J. Am. Concr. Inst. 26 (5), 461–469.
Rezaie, A., Achanta, R., Godio, M., and Beyer, K. (2020). Comparison of crack segmentation using digital image correlation measurements and deep learning. Constr. Build. Mater. 261, 120474. doi:10.1016/j.conbuildmat.2020.120474
Salawu, O. S. (1997). Detection of structural damage through changes in frequency: A review. Eng. Struct. 19 (9), 718–723. doi:10.1016/s0141-0296(96)00149-6
Samouh, H., Rozière, E., and Loukili, A. (2017). The differential drying shrinkage effect on the concrete surface damage: Experimental and numerical study. Cem. Concr. Res. 102, 212–224. doi:10.1016/j.cemconres.2017.09.016
Shields, Y., Garboczi, E., Weiss, J., and Farnam, Y. (2018). Freeze-thaw crack determination in cementitious materials using 3D X-ray computed tomography and acoustic emission. Cem. Concr. Compos. 89, 120–129. doi:10.1016/j.cemconcomp.2018.03.004
Shimamoto, Y., Morozova, N., Shibano, K., and Suzuki, T. (2022). Evaluation of damage properties of the shinkawa river drainage gate in service for 50 years. Water, Land Environ. Eng. 90 (5), 321–324.
Shuto, N., and Fujima, K. (2009). A short history of tsunami research and countermeasures in Japan. Proc. Jpn. Acad. Ser. B. Phys. Biol. Sci. 85, 267–275. doi:10.2183/pjab.85.267
Suzuki, T., and Ohtsu, M. (2014). Damage estimation of concrete canal due to earthquake effects by acoustic emission method. Constr. Build. Mater. 67, 186–191. doi:10.1016/j.conbuildmat.2014.05.016
Suzuki, T., Nishimura, S., Shimamoto, Y., Shiotani, T., and Ohtsu, M. (2020). Damage estimation of concrete canal due to freeze and thawed effects by acoustic emission and X-ray CT methods. Constr. Build. Mater. 245, 118343. doi:10.1016/j.conbuildmat.2020.118343
Suzuki, T., Ogata, H., Takada, R., Aoki, M., and Ohtsu, M. (2010). Use of acoustic emission and X-ray computed tomography for damage evaluation of freeze-thawed concrete. Constr. Build. Mater. 24 (12), 2347–2352. doi:10.1016/j.conbuildmat.2010.05.005
Suzuki, T., and Ohtsu, M. (2016). On-site damage evaluation by AE and CT in concrete. Innovative AE and NDT techniques for on-site measurement of concrete and masonry structures. Dordrecht: Springer, 157–171. State of the art report of the RILEM Technical Committee 239-MCM. doi:10.1007/978-94-017-7606-6_9
Suzuki, T., and Shimamoto, Y. (2017). “Detection of cracking damage in-service concrete by AE energy parameter,” in 2nd International RILEM/COST Conference on Early Age Cracking and Serviceability in Cement-Based Materials and Structures - EAC2. Brussels, Belgium: ULB-VUB.
Suzuki, T., and Shimamoto, Y. (2019). On-site damage evaluation of cracked irrigation infrastructure by acoustic emission and related nondestructive elastic wave method. Paddy Water Environ. 17 (3), 315–321. doi:10.1007/s10333-019-00726-1
Tayfur, S., Alver, N., Tanarslan, H. M., and Ercan, E. (2018). Identifying CFRP strip width influence on fracture of RC beams by acoustic emission. Construct. Build. Mater. 164, 864–876. doi:10.1016/j.conbuildmat.2018.01.189
Tayfur, S., and Alver, N. (2019). A 3D parameter correction technique for damage assessment of structural reinforced concrete beams by acoustic emission. Construct. Build. Mater. 215, 148–161. doi:10.1016/j.conbuildmat.2019.04.140
Tian, W., and Han, N. (2016). Evaluation of damage in concrete suffered freeze-thaw cycles by CT technique. J. Adv. Concr. Technol. 14 (11), 679–690. doi:10.3151/jact.14.679
Uomoto, T. (2000). “Maintenance of concrete structures and application of non-destructive inspection in Japan,” in Proceedings of non-destructive testing in civil engineering. Editor T. Uomoto (Kidlington, Oxford: Elsevier), 1–11.
Vary, A. (1988). The acousto-ultrasonic approach. Cleveland, OH: Springer Science+Business Media New York, 1–21.
Yamagishi, S., and Suzuki, T. (2015). Identification of concrete damage by X-ray CT images. JSCE Proc. A2 Appl. Mech. 18, I_117–I_124. doi:10.2208/JSCEJAM.71.I_117
Keywords: in-service concrete headworks, concrete damage estimation, dynamic modulus of elasticity, X-ray computed tomography, segmentation
Citation: Morozova N, Shibano K, Shimamoto Y, Tayfur S, Alver N and Suzuki T (2022) Visualization and evaluation of concrete damage in-service headworks by X-ray CT and non-destructive inspection methods. Front. Built Environ. 8:947759. doi: 10.3389/fbuil.2022.947759
Received: 19 May 2022; Accepted: 30 June 2022;
Published: 08 August 2022.
Edited by:
Didem Ozevin, University of Illinois at Chicago, United StatesReviewed by:
Lucio Nobile, University of Bologna, ItalyQing-Feng Liu, Shanghai Jiao Tong University, China
Copyright © 2022 Morozova, Shibano, Shimamoto, Tayfur, Alver and Suzuki. This is an open-access article distributed under the terms of the Creative Commons Attribution License (CC BY). The use, distribution or reproduction in other forums is permitted, provided the original author(s) and the copyright owner(s) are credited and that the original publication in this journal is cited, in accordance with accepted academic practice. No use, distribution or reproduction is permitted which does not comply with these terms.
*Correspondence: Nadezhda Morozova, ZjIxZTEwNmFAbWFpbC5jYy5uaWlnYXRhLXUuYWMuanA=
†These authors have contributed equally to this work and share first authorship