 Chih-Hao Hsu
 Siao-Syun Ke
 Tzu-Hsiu Wu
95% of researchers rate our articles as excellent or good
Learn more about the work of our research integrity team to safeguard the quality of each article we publish.
Find out more
ORIGINAL RESEARCH article
Front. Built Environ. , 07 July 2022
Sec. Earthquake Engineering
Volume 8 - 2022 | https://doi.org/10.3389/fbuil.2022.938747
Earthquakes can be devastating to cities. Therefore, accurate and efficient simulation of the potential seismic damage to buildings has become an indispensable part of worldwide efforts to mitigate earthquake hazards. Precise simulation results can highlight potential seismic damage and serve as a reference in urban development and for planning post-earthquake rescue operations. In urban areas, simulation of the structural dynamic response during an earthquake is key for planning an appropriate emergency response. Multidimensional visualization of the effects of earthquakes is a popular technique in current earthquake simulation research. In the present study, a dynamic multidimensional simulation method was developed for analyzing the impact of an earthquake on buildings. This method involved conducting three-dimensional (3D) dynamic analysis of data from a seismic capacity database. Polygonal models and seismic capacity data were used in a high-performance computing process to calculate the seismic response of each building in an urban environment. On the basis of the calculations, a platform was developed for multidimensional urban earthquake impact simulation (MDUES). The developed MDUES platform enables analysis of the impact of long-period earthquakes, simulation of the 3D seismic responses of buildings, and visualization of the disaster risk and earthquake impact in a specified area. In summary, simulation of structural seismic responses in an urban setting necessitates a careful examination of the characteristics of ground and building motion, and the results of this simulation can provide a crucial reference for city planning, post-earthquake rescue operations, and seismic damage assessments.
Earthquakes often cause substantial economic losses and casualties. The level of urbanization has increased over time worldwide. Currently, populations are concentrated in high-rise buildings in urban centers. With an increase in the number of buildings, the impact of a seismic event might increase. To ensure the safety of citizens, authorities should use earthquake risk assessment models to formulate urban disaster prevention strategies. An earthquake risk assessment model can facilitate rapid disaster response and rescue efforts and improve disaster prevention planning.
Fragility curve analysis is used in evaluations of the structural damage caused by earthquakes. This method is based on statistical analysis of accumulated earthquake damage data. However, studies conducted since the 2011 Great East Japan Earthquake have indicated that long-period ground motion has relatively strong effects on high-rise buildings and their internal structures (JMA, 2013; Aizawa et al., 2014). However, the parameters of structural fragility curve analyses are rarely used to describe these effects.
Analyses can be conducted on a large disaster risk database to predict the impact of an earthquake disaster to assist governments in preventing and responding to such a disaster. In recent years, many countries have developed technologies for assessing the risk of disasters caused by earthquakes to reduce the fatalities and property losses caused by earthquakes. Using technology to assess the impact of earthquakes on buildings in urban areas can facilitate disaster response, disaster prevention planning, and rescue operations. Reducing the risk of and damage caused by urban earthquake disasters is critical (Redweik et al., 2017; Hori and Ichimura., 2018; Zhai et al., 2019; Zhai and Chen, 2020; Lu and Guan, 2021).
Multi-dimensional visualization is a popular technique in simulation research and facilitates the analysis of spatial information. In the present study, a simulation module was developed to visualize the impact of earthquakes on buildings in urban areas. The main goal was to simulate an earthquake by using a seismic capacity database for dynamically presenting the impact of earthquakes on urban buildings and to facilitate the acquisition of seismic data for thematic applications. Multidimensional visualization can be used to analyze earthquake impact scenarios and illustrate the seismic response of buildings.
A multidimensional urban earthquake impact simulation (MDUES) platform was developed in this study to simulate the earthquake-induced dynamic seismic response of and damage to buildings in urban areas. An area of Taipei City in Taiwan was used as an example in a simulation of an earthquake scenario; the earthquake-induced dynamic seismic response of buildings was evaluated, and the risk of building damage in the simulated earthquake scenario calculated.
With rapid advances in multidimensional spatial information technology, simulation technologies have been developed for predicting the impact of earthquakes on cities in a three-dimensional (3D) manner. Compared with two-dimensional information, 3D information enables more comprehensive understanding. Disaster prevention, disaster response, and rescue strategies can be designed for urban disasters by using 3D models. Many earthquake-related studies have developed and applied 3D earthquake disaster assessment models for urban areas. Figure 1 illustrates the application of the 3D models developed in some of these studies. The literature relevant to the present study is described in the following text.
• Redwelk et al. (2017) used a spatial model on a city database for 3D city visualization. They considered Lisbon, which is the capital of Portugal, as an example in their evaluation of the earthquake vulnerability of buildings in various earthquake scenarios. The degree of damage was indicated by the geometry and color of a building. The study used the Level of Detail (LOD) two approximation model to increase the identifiability of buildings for facilitating decision analysis. Figure 1A depicts the degree of earthquake-induced damage and the process of attribute data analysis for an example building.
• Hori and Ichimura (2018) used an integrated earthquake simulation platform to fully simulate an earthquake shock process and incorporated the simulation results into a geographic information system (GIS) software program to construct a 3D city model by using high-performance computing (HPC) and automated model development systems. They performed seismic scenario simulations to estimate earthquake hazards and disaster impact and simulated the dynamic response of buildings in various earthquake scenarios. Figure 1B depicts the model of Hori and Ichimura (2018) showing the maximum interstory displacement of buildings.
• Zhai et al. (2019) developed a system for earthquake disaster prevention planning in urban areas. This system comprises a building vulnerability analysis model, data query function, spatial analysis and theme display system, and prediction system. Figure 1C presents the simulation results obtained by Zhai et al. for the degree of seismic damage caused to buildings by an earthquake.
• Zhai and Chen (2020) used MATLAB and the OpenSees software to construct a simplified dynamic numerical model and developed a complete system for predicting urban earthquake damage. They selected an area for earthquake hazard simulation and used the earthquake damage index to verify the reliability of their system. Figure 1D presents the results of earthquake hazard estimation obtained by Zhai and Chen.
• Lu and Guan (2021) proposed a 3D visualization model that can enhance simulated visualizations of earthquake-induced damage to urban buildings. The building damage simulation was based on a nonlinear multiple-degree-of-freedom model and an HPC model that can facilitate accelerated earthquake simulations for an urban area. Figure 1E displays an example of the simulation results of the aforementioned authors. Table 1 summarizes reports on 3D visualization methods that aid urban earthquake disaster prevention.
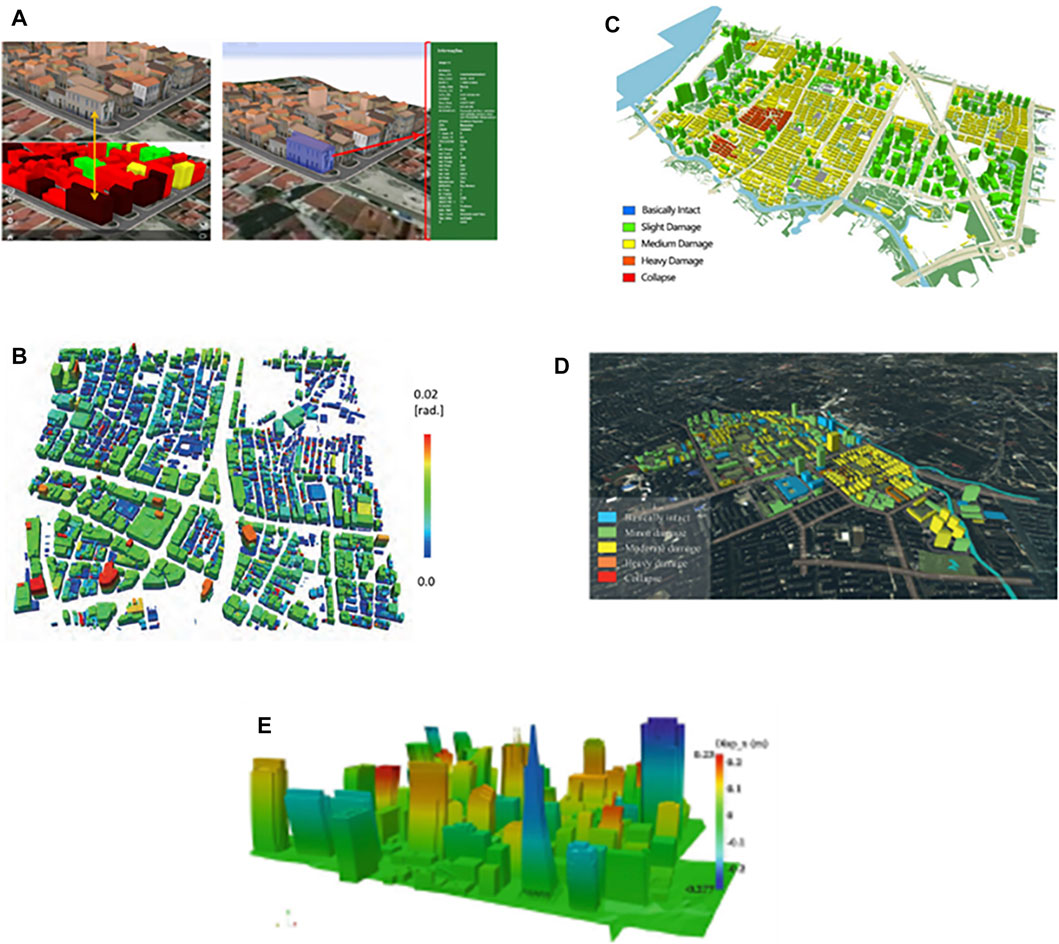
FIGURE 1. Examples of 3D urban earthquake impact models: models of (A) Redwelk et al. (2017), (B) Hori and Ichimura (2018), (C) Zhai et al. (2019), (D) Zhai and Chen (2020), and (E) Lu and Guan (2021)
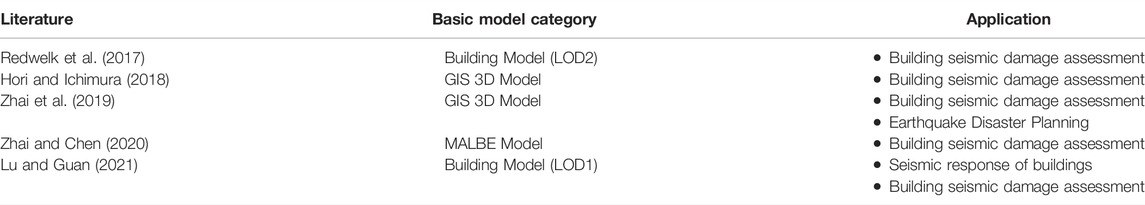
TABLE 1. Applications of 3D-visualization-assisted assessment of urban earthquake disasters.
Simulated ground motion responses, a dynamic analysis model for buildings, and high-efficiency dynamic time history analysis were used to establish a dynamic structural damage assessment system. This system comprises 1) a data analysis module, 2) software modules and hardware, and 3) a user interface with visualization functionality. The construction of this system is illustrated in Figure 2.
• Data analysis: A simplified dynamic analysis model is created for buildings by using a seismic database. This model is then used to simulate ground motion and perform a dynamic diachronic seismic analysis of buildings (Figure 3).
• Modules and technology: High-performance computer processing units and graphics processing units (GPUs) are used to render the floors of buildings, and the effects of the simulated ground motion are used to calculate the seismic displacement and deformation response of the floors in each multidimensional building model.
• Display and application: In accordance with the simulated seismic response of buildings, the effects of an earthquake are presented by depicting building walls with different textures and in different colors. Such visualization enables dynamic building analysis and thus aids disaster prevention.
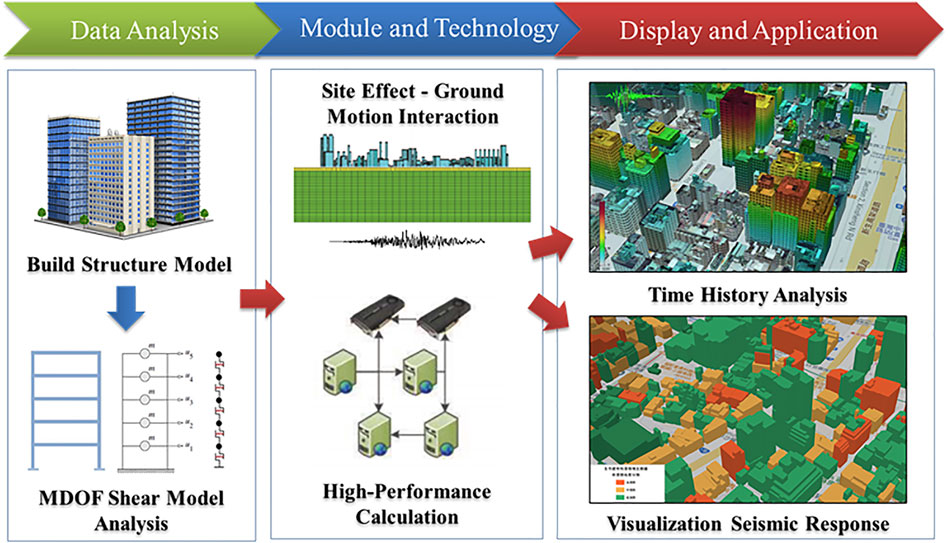
FIGURE 2. Multi-dimensional visualization module for simulating earthquake damage.

FIGURE 3. Construction of the 3D database detailing the seismic capacity of urban buildings.
Building models are a key element of the GIS in a 3D urban model. The sources of data used for constructing multidimensional building models include ground surveys, close-range photogrammetric data, high-resolution satellite images, and aerial images. The algorithm for developing these models is based on the building model specifications defined by the Open Geospatial Consortium City Geography Markup Language (Gröger et al., 2008; Open Geospatial Consortium City Geography Markup Language, 2013) for a systematic construction process. Different models can have different LODs (Figure 4). The LOD0 model only includes the terrain and layers that overlap different theme maps. The LOD1 model is a simple block model in which simple 3D cubes are assembled into simple buildings. These cubes are generally called building blocks. The LOD2 model is a structural model in which buildings have different textures, roof types, shapes, and heights. Real images are used for building roofs and sides. In the LOD3 model, roofs, walls, balconies, and other building features have detailed textures. The creation of an LOD3 map requires the detailed construction of house doors, windows, and various auxiliary facilities; real textures and images are required. The LOD4 model depicts the interior structure of buildings, including rooms, doors, stairs, and furniture.
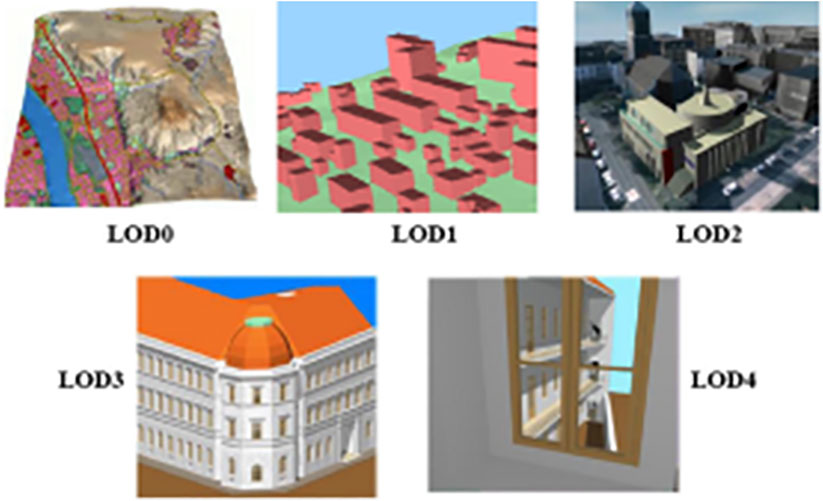
FIGURE 4. LODs of various 3D building models (Gröger et al., 2008)
Figure 5 illustrates the process for constructing a 3D building model. An outline of a building is used as the basic data for producing a 3D building facade model, and wall and roof textures are then applied to this model. The process for developing the aforementioned model is detailed as follows:
• Wall textures: Image retrieval technology is used to search a material image library for a street-view image of a building to identify the material that best approximates the building material for use in a wall texture map.
• Roof texture map: The roof texture of the selected building can be converted from building outline coordinates into image coordinates. The corresponding frame image and image position are computed using a frame joint table. An aerial image of the building can be extracted as the roof image for the building model.
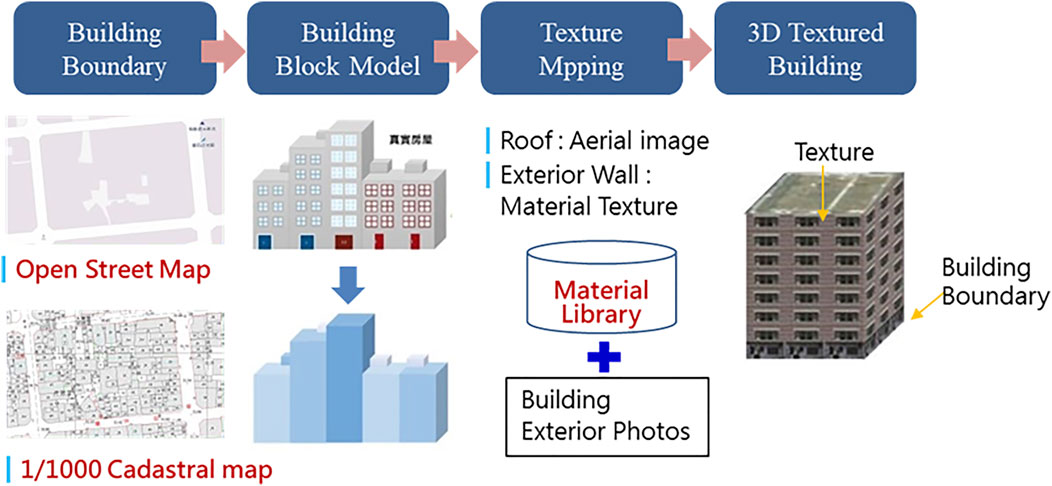
FIGURE 5. Construction of a 3D building model.
On the basis of the method of dynamic diachronic seismic analysis proposed for buildings by Xiong et al. (2017), a multiple degree of freedom (MDOF) analysis program was used in the present study. The parameter models proposed by Steelman and Hajjar (2009)—the flag-shaped model for unreinforced masonry, the bilinear model for steel moment frames, and the pinching model for reinforced concrete—were employed in this study. The building height, the total floor area, and other building parameters were used as inputs of the aforementioned models, and a nonlinear dynamic diachronic analysis of buildings was performed to obtain the seismic response of each floor in them. In this study, a bilinear model was used to simulate the dynamic nonlinear behavior of buildings, and the drift ratio of and damage to buildings were analyzed. The analysis process employed in this study is illustrated in Figure 6.
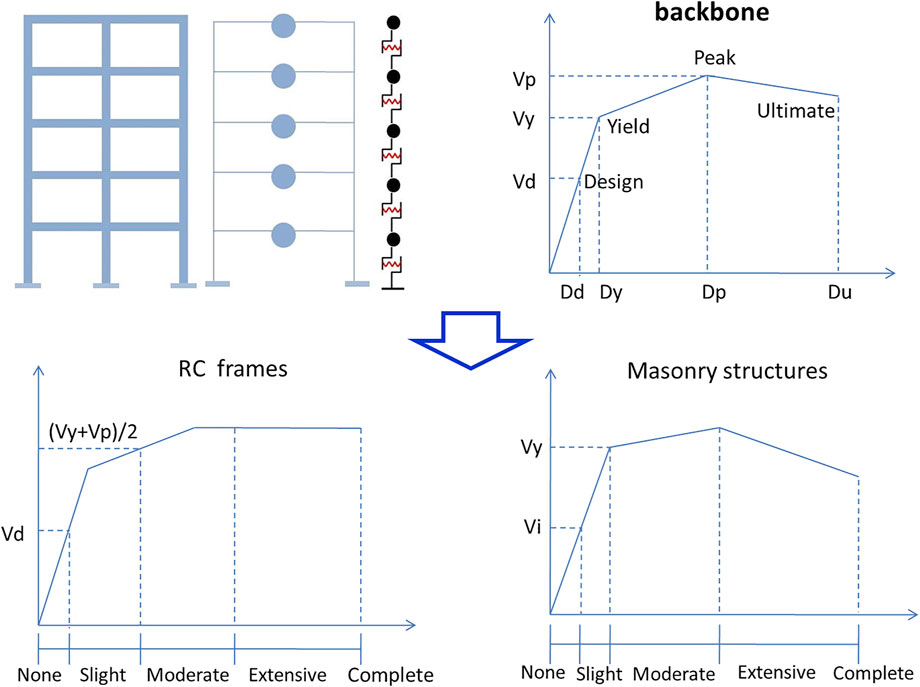
FIGURE 6. Time-duration dynamic analysis and damage assessment model for buildings.
The bilinear model was also used to investigate the interstory drift ratio of and overall damage to buildings and to establish an index of potential damage. On the basis of the research of Xiao et al. (2002) regarding methods for assessing building performance, the interstory drift ratio that indicated that damage was possible was set as 2, 2.5, and 1% for structures made of reinforced concrete, steel, and other materials, respectively. If the interstory drift ratio exceeds the relevant threshold, pipelines may be damaged, and elevators may be temporarily unavailable. Table 2 presents the interstory drift ratio thresholds for different structures.
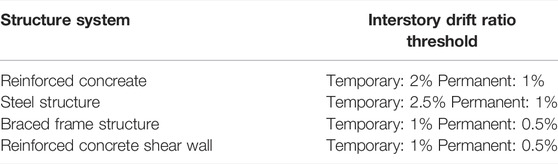
TABLE 2. Threshold in the interstory drift ratio for various structures.
In this study, seismic analysis data and building data were integrated to visualize the effects of an earthquake in a simulation, including variations in the dynamic responses and damage level of buildings during and after the earthquake. The simulated data can be applied in urban dynamic seismic analysis and disaster prevention. Figure 7 displays a flowchart of the process for dynamic 3D simulation of an earthquake’s impact on a city. The steps involved in this simulation were as follows:
• Creation of a GIS layer map: Various maps were integrated, including a basic urban model map (such as an open street map, an aerial photo map, a topographic map, and building frames), county and city boundary map, and 3D building models. The map obtained after integrating the aforementioned maps was used with building frame and house tax data to construct a seismic capacity database that included information such as buildings’ age, structure type, total floor area, and height.
• Dynamic analysis: The nonlinear MDOF shear-force NMS model of Xiong et al. (2017) was used for the dynamic analysis of the 3D building models. The bilinear MDOF shear house model was used for the dynamic analysis of each building. The results obtained in the aforementioned analysis were used to categorize buildings into those at low, medium, or high risk of being affected by earthquakes.
• Visualization: A high-performance GPU was used to render building floors with different colors and exterior textures to represent the simulated seismic displacement and deformation results for each building.
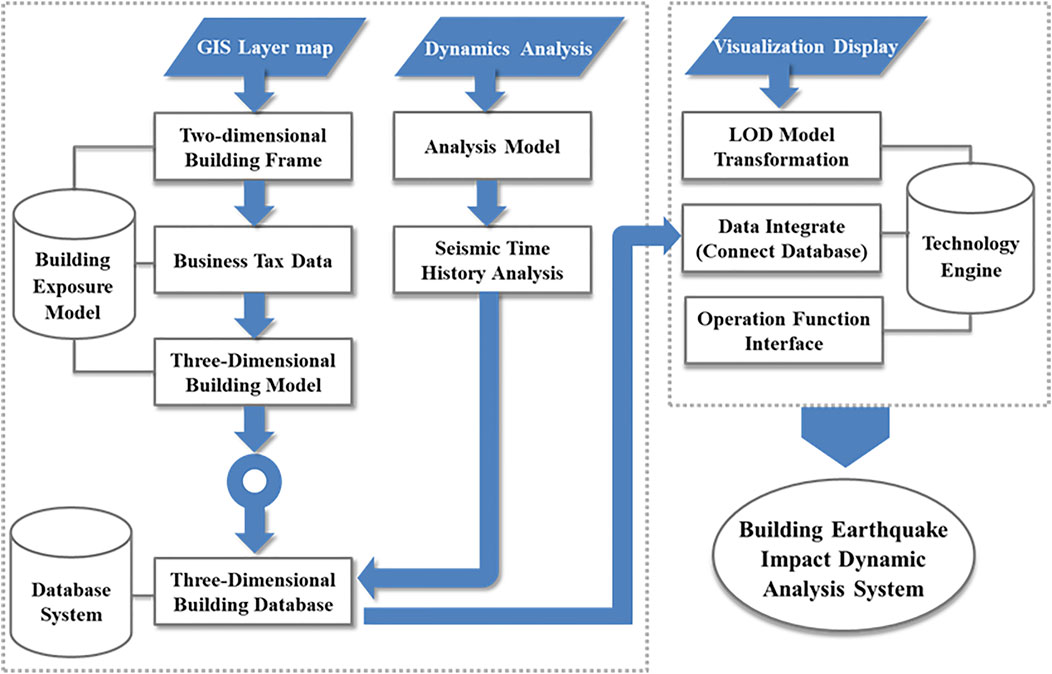
FIGURE 7. Construction of a dynamic analysis system for investigating the impact of earthquakes on buildings.
Figure 8 illustrates the method used in this study to visualize the results of the dynamic multidimensional seismic simulation. The steps involved in the 3D building visualization method are described in the following text. First, the external polygon surfaces of each building in a 3D urban polygonal model were identified. Second, the position and attribute data of each building were extracted from official maps. Third, the map data and polygon data were matched to assign building attributes to each 3D model. Fourth, the attributes, two-dimensional outline polygons, exterior polygons, and seismic 3D data of each matched building were stored in a database. The polygonal two-dimensional data of each building plane were used to identify the positions of the building’s boundaries and external polygon. Fifth, each 3D model was included in the 3D seismic database of the buildings. Sixth, an earthquake was simulated using the MDOF model analysis program to analyze the nonlinear dynamic history of urban building groups and obtain the seismic response for each building floor (Figure 8). Seventh, the seismic response of each building (such as the displacement of each floor of the building) was obtained from the nonlinear analysis results for the seismic duration. Finally, the obtained seismic responses were imported into the corresponding polygonal building model to visualize the multidimensional impact of the earthquake (Figures 9A–D).
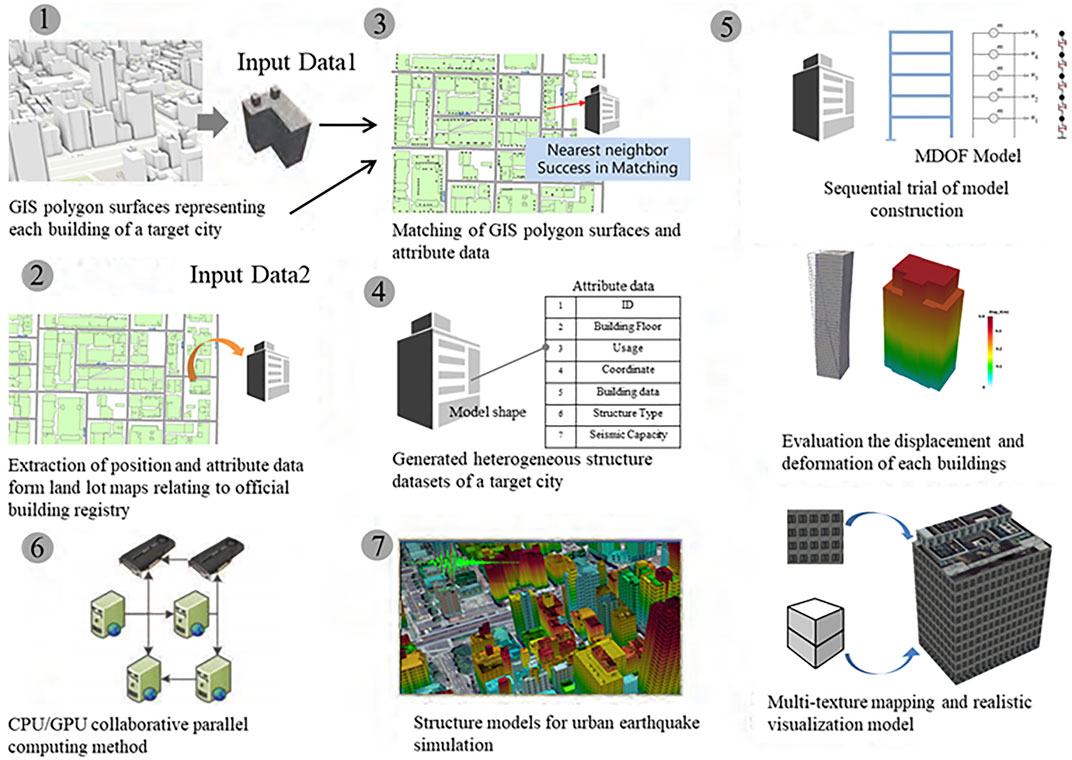
FIGURE 8. 3D visualization of an earthquake’s impact.
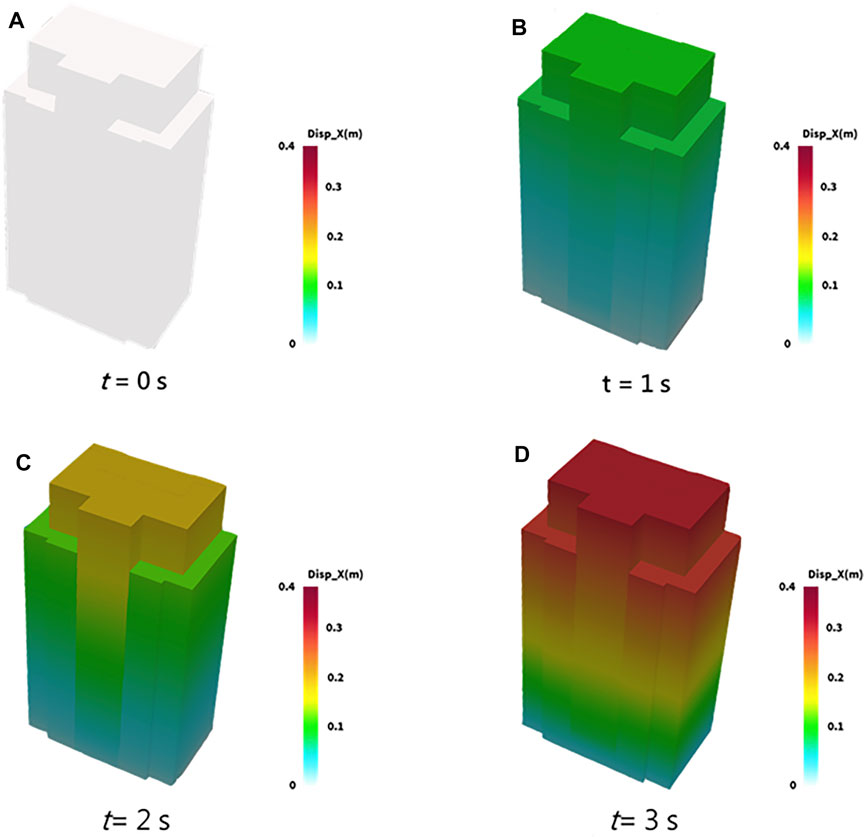
FIGURE 9. Dynamic seismic analysis of building deformation and displacement (A) t = 0 s, (B) t = 1 s, (C) t = 2 s, (D) t = 3 s.
The MDUES platform contained powerful computer processing units and GPUs, which were used to calculate and analyze polygons for the buildings in a building group. The Lizard engine was used to render 3D scenes, and the earthquake response was analyzed in terms of the displacement and deformation of each floor in each building. The MDUES platform was developed using C# and the. NET framework. The rendered 3D results were displayed on the user interface of the developed platform (Figure 10).
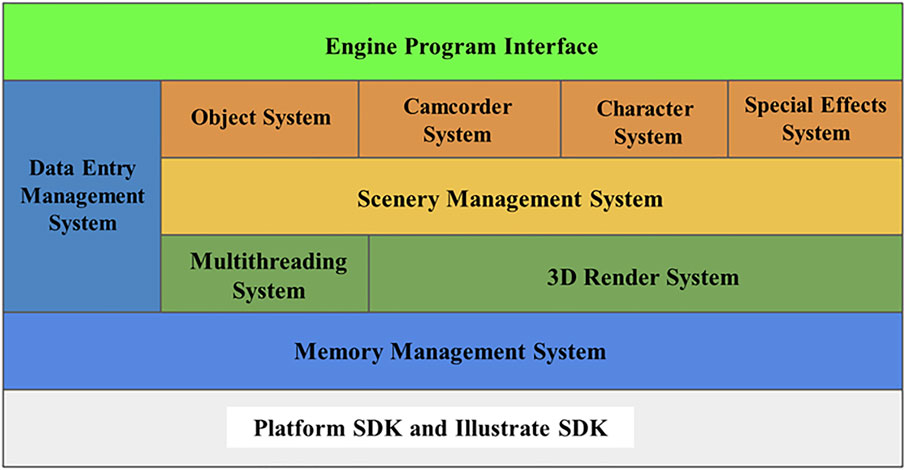
FIGURE 10. Framework of the developed system’s program engine.
Because of the numerous calculations required to determine the dynamic history of urban building groups, 3D scenes of the investigated area were divided into 256 × 256 quadrilateral nodes to facilitate the processing of building data. The process executed by the software is described in the following text. Each building model was exported into the KMZ file format, and the model files were used in each area. This information was loaded onto the viewing area of the user interface and included the dynamic data of each building. The polygon vertices for each building were then rendered to estimate the building’s height and number of floors. High-performance GPUs were used to render the 3D scene rapidly and change the position of the building vertices to achieve dynamic analysis. Figure 11 presents an example of a simulation performed using the MDUES platform.
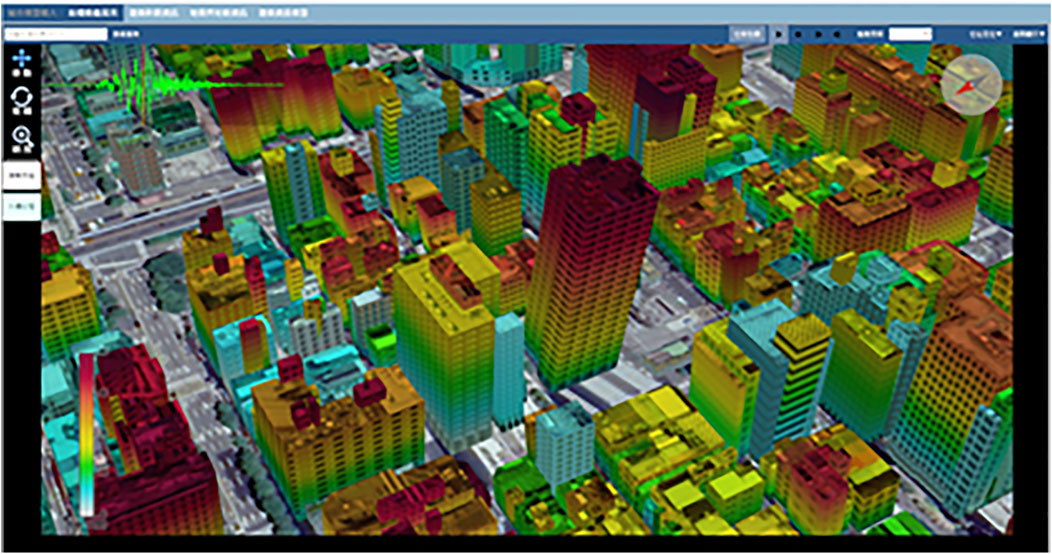
FIGURE 11. Simulation of the impact of earthquakes on urban buildings with the MDUES platform.
In 3D visualization, scenes are presented volumetrically in accordance with the relationships between geographic locations and the 3D space, such as terrain and elevation information. Appearance characteristics, such as color, transparency, and exterior wall textures, are 3D space attributes that are used to present the outer contours of buildings in a 3D space by using 3D modeling technology. For the 3D building models created in this study, the building parameters were integrated with geometric and spatial information. These models were constructed using an aerial orthophoto map of elements such as roads, vegetation, parks and green spaces, and trees along the sides of streets (Figure 12).
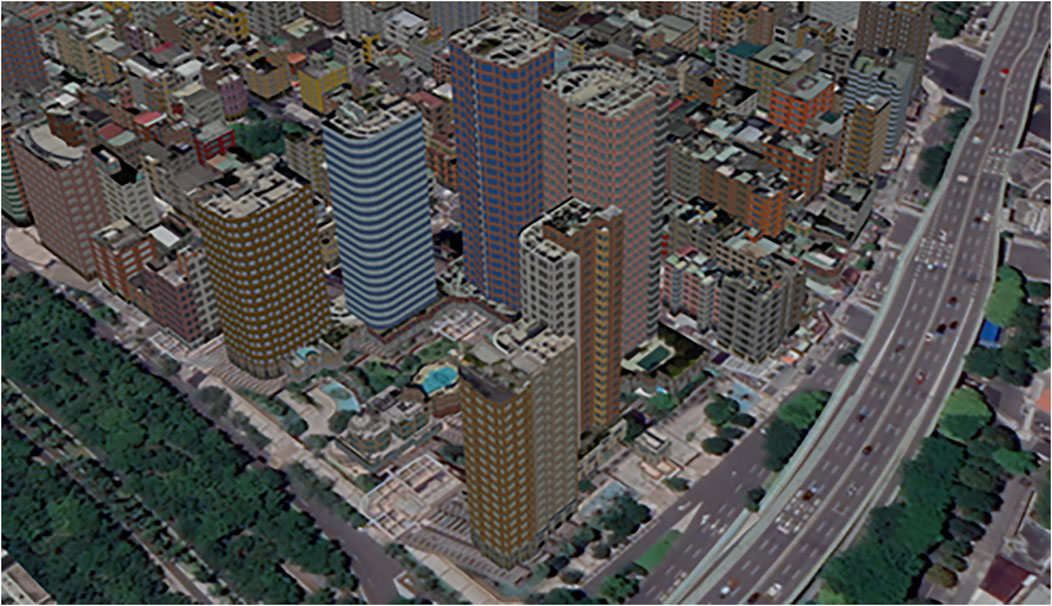
FIGURE 12. 3D urban visualization with the MDUES platform.
The 3D building models included the spatial location and earthquake attribute data of the buildings, which enabled data such as a building’s number of floors, usage, spatial coordinates (in the WGS84 or TWD97 coordinate system), construction year, structure type, and seismic capacity class (Figure 13) to be acquired and analyzed.

FIGURE 13. Seismic attributes of a building in the 3D urban visualization.
In this study, a seismic database of buildings was established to enable multidimensional visualization. This database enabled basic seismic data and building classifications to be acquired. The status of each building could be visually presented on a large map, which could be modified to highlight a given building characteristic.
The buildings examined in this study were classified into the following categories in accordance with the material used to construct them: steel-reinforced concrete, reinforced concrete, unreinforced masonry, reinforced masonry, steel, and wood. An example of a thematic map for building structures is displayed in Figure 14.
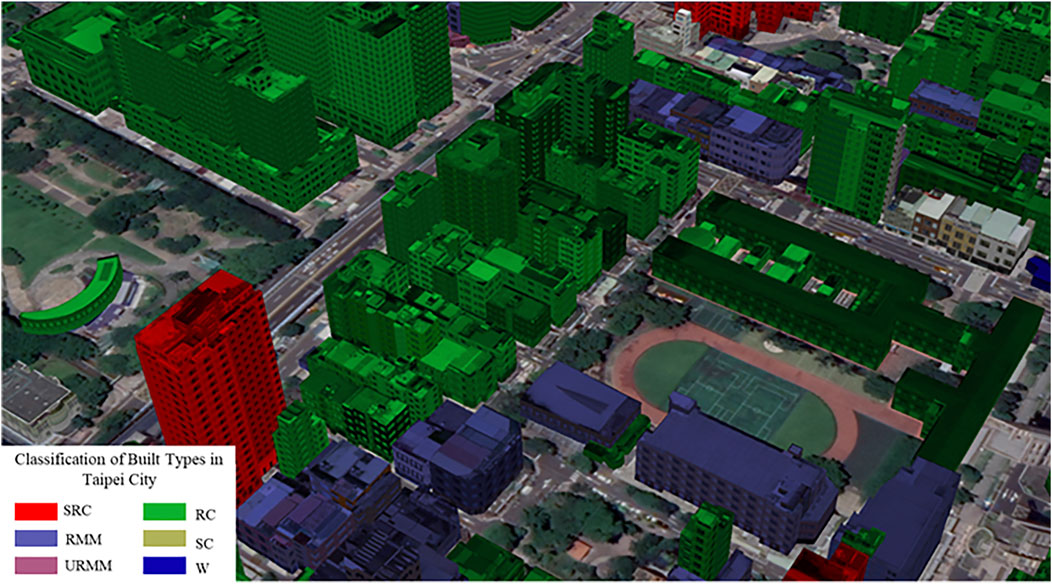
FIGURE 14. Thematic map of buildings made of different materials in Taipei City.
The buildings were classified into the following categories in accordance with their usage: public assembly, commercial, industrial, cultural and educational, religious, health- and welfare-related, office, residential, and dangerous. Figure 15 presents a section of a thematic map for building usage.

FIGURE 15. Thematic map of building usage in Taipei City.
Building age was classified into five categories in accordance with the seismic capacity design standards in Taiwan: buildings constructed before 1973, buildings constructed during 1974–1982, buildings constructed during 1983–1990, buildings constructed during 1991–2011, and buildings constructed after 2012. Figure 16 presents a thematic map of building age; this map could be accessed to determine a building’s age and understand the spatial distribution of buildings.
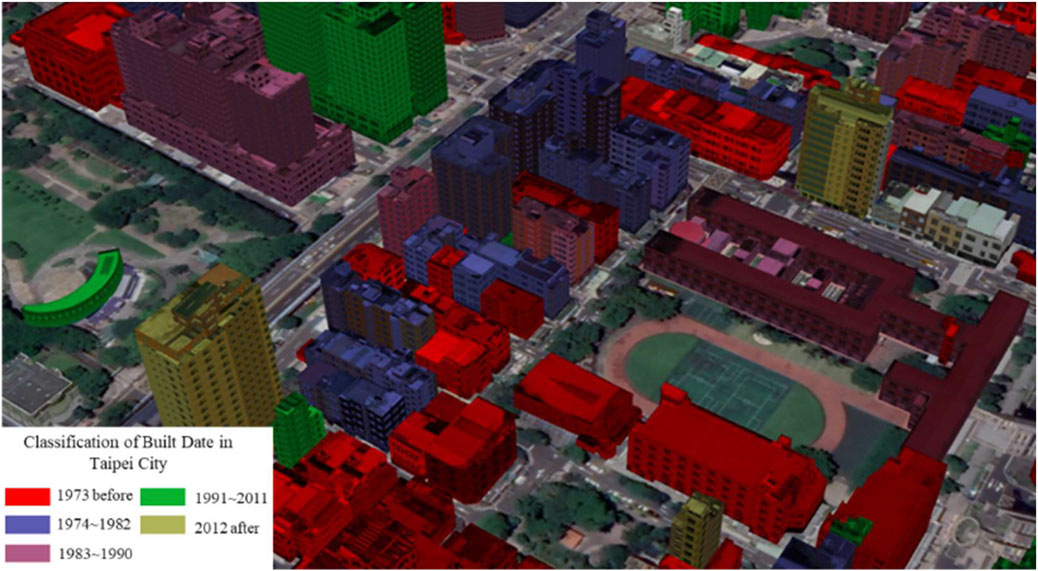
FIGURE 16. Thematic map of building age in Taipei City.
The buildings were classified by their damage risk in accordance with the results of dynamic building analysis. The interstory displacement of each building floor was estimated, the nonlinear behavior of the buildings was investigated, and buildings at high risk were identified. Figure 17 presents a thematic map of the damage risk.
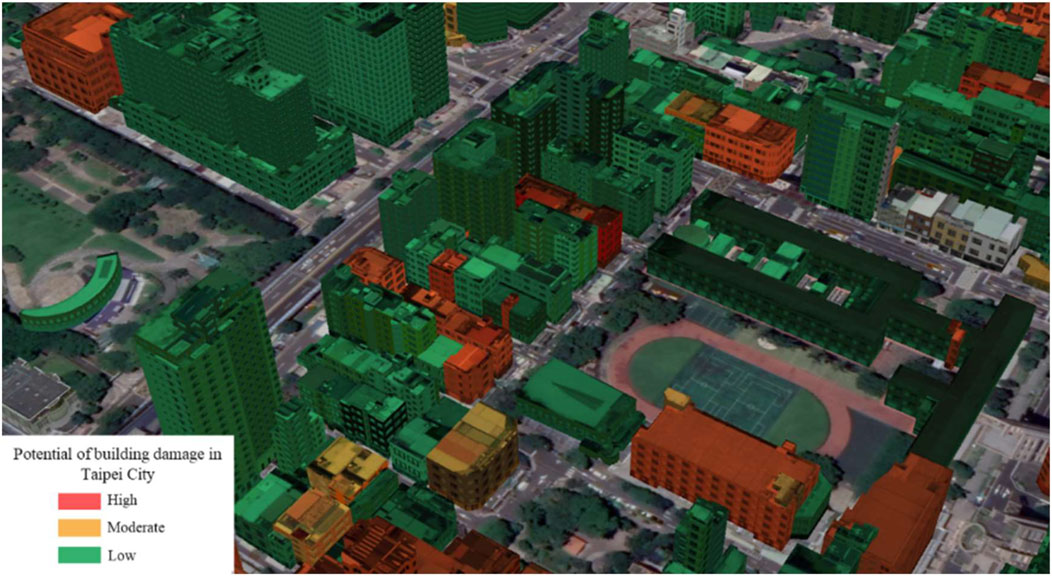
FIGURE 17. Thematic map of the damage risk for buildings in Taipei City.
Long-period seismic waves can travel to distant urban areas and cause the considerable displacement of high-rise buildings, resulting in their damage. The natural vibration period of high-rise buildings is relatively long. If the main period of the surface vibration is similar to the natural vibration period of the building, resonance occurs, and the building reacts violently to the earthquake. The main characteristics of long-period earthquakes are as follows:
• The main period of the earthquake is longer than a few seconds.
• Larger earthquakes tend to generate seismic waves with a longer period and higher intensity.
• When an earthquake has a shallow source, it is likely that long-period seismic surface waves will be generated.
• Seismic waves can travel long distances with little attenuation; their amplitude is amplified if they encounter weak alluvial layers.
• The structures affected by long-period earthquakes are super-high-rise buildings, oil tanks, suspension bridges, and long-span bridges.
The seismic impact of long-period earthquakes on high-rise buildings was investigated. The characteristics of the area considered in this study were determined using the database of the 3D models and attributes of buildings. Dynamic analysis was then conducted using the 3D building models to analyze the impact of a long-period earthquake. The earthquake scenario considered was an earthquake with a magnitude of 8.0 offshore of Hualien, Taiwan. The parameters of the considered earthquake scenario are depicted in Figure 18.
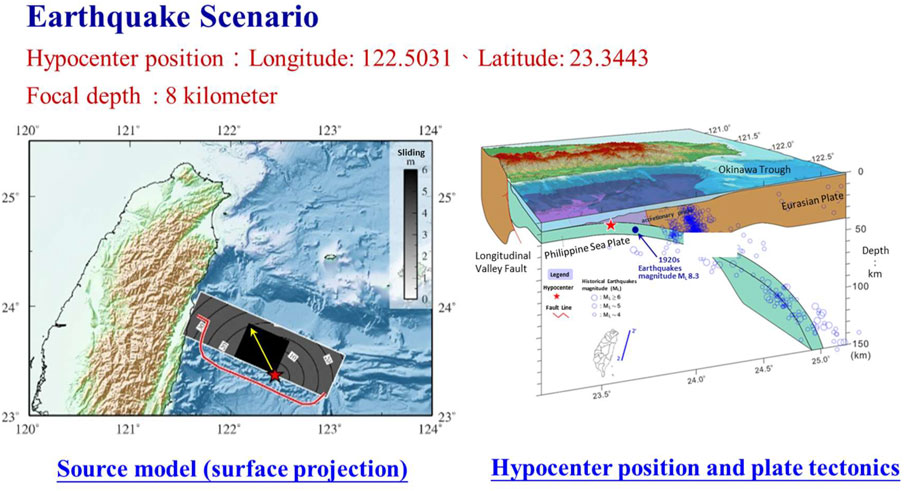
FIGURE 18. Parameters of an earthquake scenario.
The ground motion attenuation formula and site effect correction coefficient were used to calculate the ground motion intensity. Table 3 presents the ground motion prediction model. The prediction process was divided into two stages. First, the ground motion prediction model was used to calculate the ground motion at an observation station. Second, the site correction coefficient was added to the calculated value. The peak ground acceleration was simulated in accordance with the results of Jean and Loh (2001), Chang (2002), and Jean et al. (2006). The peak ground velocity was calculated in accordance with the results of Chang (2009). The peak ground displacement was calculated in accordance with the results of Liu 1999) and Liu and Tsai (2005).
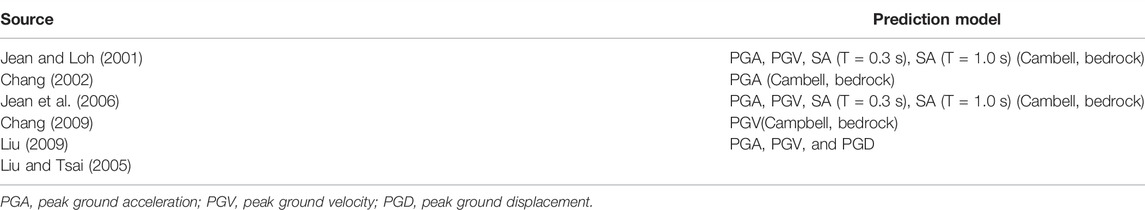
TABLE 3. Ground motion prediction models.
The impact of a long-period earthquake on the area surrounding Taipei Main Station was investigated. Numerous passengers and visitors pass through this station every day because it serves as a hub for the subway, train, high-speed rail, and bus systems in Taipei. Moreover, the business district surrounding the aforementioned station has substantial commercial activity and numerous office buildings. As displayed in Figure 19, most buildings in the aforementioned area were categorized as office, residential, or commercial buildings. The high-rise buildings were mostly made of steel-reinforced concrete or reinforced concrete. Figure 20 presents the number of people in the commercial area near the station during the night (22:00–6:00), morning commute (6:00–9:00), working period (9:00–17:00), and evening commute (17:00–22:00). The results revealed that the population in the aforementioned area was highest during the working period (approximately 13,000 people on weekdays and approximately 8,000 people on holidays). Figure 21 presents the dynamic analysis results obtained using the 3D building models (displacements are presented with a magnification of ×5 for better visualization). These results revealed that long-period earthquakes considerably affect the seismic response of high-rise buildings in the considered area.
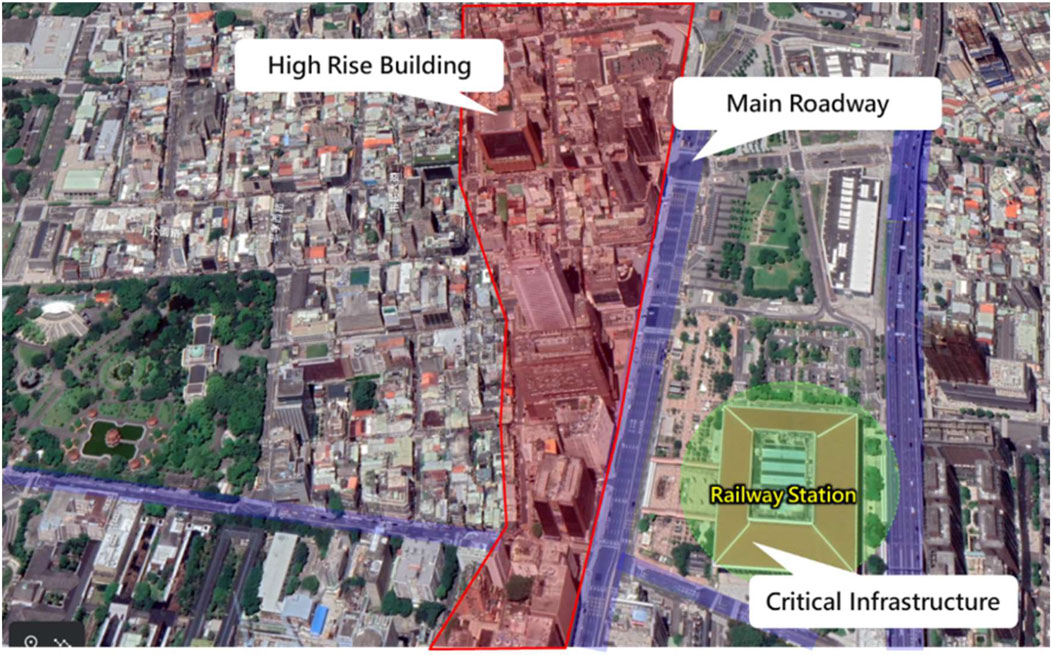
FIGURE 19. High-rise buildings surrounding Taipei Main Station.
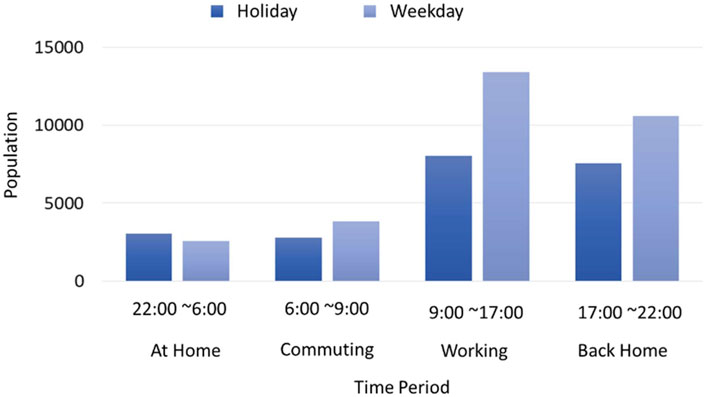
FIGURE 20. Population near Taipei Main Station at different times on weekdays and holidays.
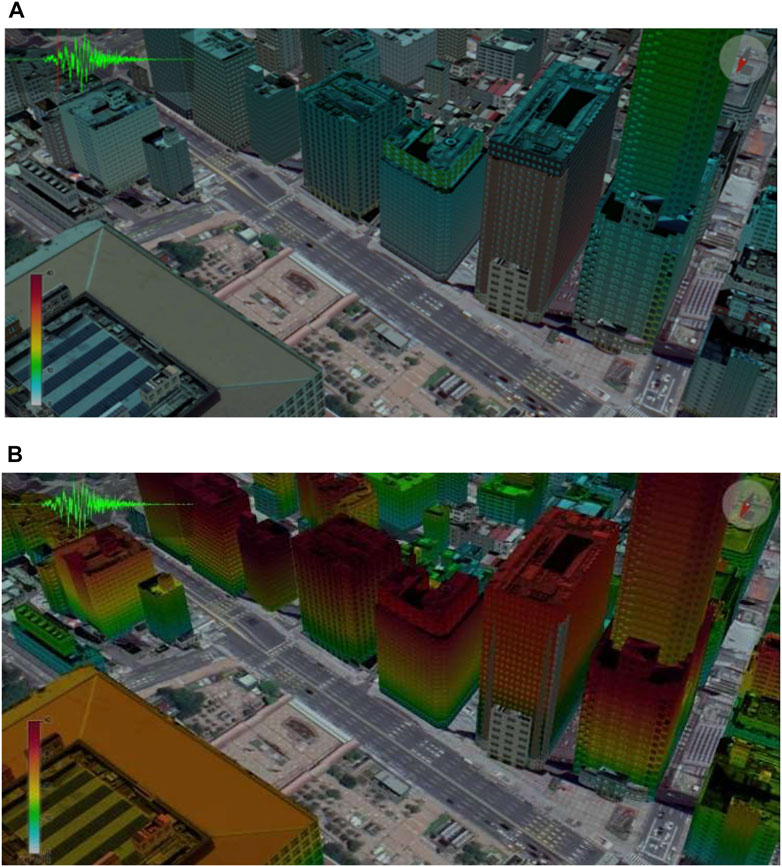
FIGURE 21. Temporal simulation results of the building models: (A) t = 10 s and (B) t = 20 s.
The considered commercial area has numerous high-rise buildings, and the impacts of a long-period earthquake disaster on this area would be as follows:
• Impact on super-high-rise buildings: Most super-high-rise buildings have low structural damping (1% or lower) if their natural vibration period is similar to the main vibration period of the earthquake. The resulting amplification of the seismic wave would cause the building to react violently.
• Injuries or obstruction of evacuation: High-rise buildings can exhibit relatively large displacement under a long-period earthquake. Furniture might be toppled or scattered in these buildings during such an earthquake, which could result in injuries to people or the obstruction of evacuation.
• Impact on elevators: During long-period earthquakes, elevators might fail to operate or be damaged because of the excessive displacement between layers in a building; this might result in people becoming trapped.
In this study, a dynamic simulation method was developed to analyze the multidimensional impact of earthquakes on buildings in urban areas. Earthquake scenario simulations were conducted and multidimensional spatial display technologies were used to effectively visualize the consequences of earthquake disasters; and such visualization can improve the efficiency and accuracy of decision-making regarding disaster prevention. The conclusions of the study are as follows:
1) A dynamic analysis method was developed in this study to investigate the impact of earthquakes on urban buildings. This method involves analyzing a database of the seismic capacity and dynamic seismic responses of buildings by using high-performance dynamic simulation technology to visualize the impact of earthquakes on urban buildings in a 3D manner.
2) An MDUES platform was developed to visualize the dynamic response and damage analysis results for urban building groups. This platform was used to analyze the impact of long-period earthquakes on urban buildings in various scenarios.
3) The simulation results obtained in this study can be used to identify urban buildings at high risk of earthquake damage to facilitate earthquake disaster prevention and risk assessment. The multidimensional earthquake disaster risk assessment conducted in this study can be extended in the future by considering the impacts of earthquakes on bridges, roads, and pipelines.
4) Building defects affect the impacts of earthquakes on buildings. For example, rebar slippage in the reinforced concrete elements of a building results in concrete expansion and the formation of large cracks, which cause premature strength deterioration and stiffness degradation, particularly in inelastic energy-dissipating zones (Ahmad et al., 2021). Therefore, future studies should include attribute data related to building defects into the platform developed in this study.
The raw data supporting the conclusion of this article will be made available by the authors, without undue reservation.
The authors confirm contribution to the paper as follows: study conception and design: C-HH and S-SK; data collection: C-HH and T-HW; analysis and interpretation of results: C-HH and T-HW; draft manuscript preparation: C-HH. All authors reviewed the results and approved the final version of the manuscript.
The authors declare that the research was conducted in the absence of any commercial or financial relationships that could be construed as a potential conflict of interest.
All claims expressed in this article are solely those of the authors and do not necessarily represent those of their affiliated organizations, or those of the publisher, the editors and the reviewers. Any product that may be evaluated in this article, or claim that may be made by its manufacturer, is not guaranteed or endorsed by the publisher.
Ahmad, N., Masoudi, M., and Salawdeh, S. (2021). Cyclic Response and Modelling of Special Moment Resisting Beams Exhibiting Fixed-End Rotation. Bull. Earthq. Eng. 19, 203–240. doi:10.1007/s10518-020-00987-w
Aizawa, K., Kawazoe, Y., Uratani, J., Sakihara, H., and Nakamura, M. (2014). Japan Meteorological Agency Information on Long-Period Ground Motion. Japan Geoscience Union Meeting.
Chang, S. C. (2009). A Study on the Classification of Site Effects and its Correction in Attenuation Relationship of Peak Ground Velocity. Taoyuan: Nation Center University. [Master’s thesis],
Chang, Y. W. (2002). A Study on the Classification of Site Effects and its Correction in Attenuation Relationship of Peak Ground Acceleration. Taoyuan: Nation Center University. [Master’s thesis]
Gröger, G., Kolbe, T. H., Czerwinski, A., and Nagel, C. (2008). OpenGIS® City Geography Markup Language (CityGML) Encoding Standard. Taoyuan: OpenGeospatial Consortium Inc.. Online. Available at: http://www.opengeospatial.org/.
Hori, M., and Ichimura, T. (2008). Current State of Integrated Earthquake Simulation for Earthquake Hazard and Disaster. J. Seismol. 12, 307–321. doi:10.1007/s10950-007-9083-x
JMA (2013). Japan Meteorological Agency Long-period Ground Motion. (in Japanese). Available at: https://www.data.jma.go.jp/eqev/data/choshuki/index.html.
Jean, W.-Y., Chang, Y.-W., Wen, K.-L., and Loh, C.-H. (2006). Early Estimation of Seismic Hazard for Strong Earthquakes in Taiwan. Nat. Hazards 37, 39–53. doi:10.1007/s11069-005-4655-y
Jean, W. Y., and Loh, C. H. (2001). “A Study on the Classification of Site Effects and its Application to the Seismic Hazard and Microzonation,” in 10th International Conference on Soil Dynamics and Earthquake Engineering
Liu, K.-S., and Tsai, Y. B. (2005). Attenuation Relationships of Peak Ground Acceleration and Velocity for Crustal Earthquakes in Taiwan. Bull. Seismol. Soc. Am. 95, 1045–1058. doi:10.1785/0120040162
Lu, X., and Guan, H. (2021). “Visualization and High-Performance Computing for City-Scale Nonlinear Time-History Analyses,” in Earthquake Disaster Simulation of Civil Infrastructures (Beijing: Springer Singapore), 641–711. doi:10.1007/978-981-15-9532-5_9
Redwelk, P., Teves-Costa, P., Vilas-Boas, I., and Santos, T. (2017). 3D City Models as a Visual Support Tool for the Analysis of Buildings Seismic Vulnerability: the Case of Lisbon. Int. J. Disaster Risk Sci. 8, 308
Steelman, J. S., and Hajjar, J. F. (2009). Influence of Inelastic Seismic Response Modeling on Regional Loss Estimationfluence of Inelastic Seismic Response Modeling on Regional Loss Estimation. Eng. Struct. 31, 2976–2987. doi:10.1016/j.engstruct.2009.07.026
Xiao, J. B., Loh, C. H., Chen, P. T., Liao, W. I., Chai, J. F., Deng, C. R., et al. (2002). The Study on Performance Target of Building Seismic Capacity Design Method,” Research Report. Taiwan: Architecture and Building Research InstituteMinistry of the Interior.
Xiong, C., Lu, X., LinLin, X., Xu, Z., and Ye, L. (2017). Parameter Determination and Damage Assessment for THA-Based Regional Seismic Damage Prediction of Multi-Story Buildings. J. Earthq. Eng. 21, 461–485. doi:10.1080/13632469.2016.1160009
Zhai, Y., and Chen, S. (2020). A Seismic Hazard Prediction System for Urban Buildings Based on Time-History Analysis. Math. Problems Eng. 2020, 1–18. doi:10.1155/2020/7367434
Keywords: seismic response, multi-scale model, visualization display simulation, long-period earthquake, simulation platform
Citation: Hsu C-H, Ke S-S and Wu T-H (2022) Development and Application of a Platform for Multidimensional Urban Earthquake Impact Simulation. Front. Built Environ. 8:938747. doi: 10.3389/fbuil.2022.938747
Received: 08 May 2022; Accepted: 17 June 2022;
Published: 07 July 2022.
Edited by:
Dipendra Gautam, Tribhuvan University, NepalReviewed by:
Rishi Ram Parajuli, University of Bristol, United KingdomCopyright © 2022 Hsu, Ke and Wu. This is an open-access article distributed under the terms of the Creative Commons Attribution License (CC BY). The use, distribution or reproduction in other forums is permitted, provided the original author(s) and the copyright owner(s) are credited and that the original publication in this journal is cited, in accordance with accepted academic practice. No use, distribution or reproduction is permitted which does not comply with these terms.
*Correspondence: Chih-Hao Hsu, d2lsbGllMjU2N0BuY2RyLm5hdC5nb3YudHc=
Disclaimer: All claims expressed in this article are solely those of the authors and do not necessarily represent those of their affiliated organizations, or those of the publisher, the editors and the reviewers. Any product that may be evaluated in this article or claim that may be made by its manufacturer is not guaranteed or endorsed by the publisher.
Research integrity at Frontiers
Learn more about the work of our research integrity team to safeguard the quality of each article we publish.